FROM RAINWATER TO DRINKING WATER
USING MEMBRANE REACTOR TECHNOLOGY
Justine Gregoir
Student number: 01605167
Promotor: Prof. Dr. Ir. Korneel Rabaey
Tutor: Ir. Arjen Van de Walle
Master’s Dissertation submitted in fulfilment of the requirements for the degree
of Master of Science in Biochemical Engineering Technology
Academic year: 2019-2020
FROM RAINWATER TO DRINKING WATER
USING MEMBRANE REACTOR TECHNOLOGY
Justine Gregoir
Student number: 01605167
Promotor: Prof. Dr. Ir. Korneel Rabaey
Tutor: Ir. Arjen Van de Walle
Master’s Dissertation submitted in fulfilment of the requirements for the degree
of Master of Science Biochemical Engineering Technology
De auteur en de promotor geven de toelating deze scriptie voor consultatie beschikbaar te stellen en delen ervan te kopiëren voor persoonlijk gebruik. Elk ander gebruik valt onder de beperkingen van het auteursrecht, in het bijzonder met betrekking tot de verplichting uitdrukkelijk de bron te vermelden bij het aanhalen van de resultaten uit deze scriptie.
The author and the promoter give the permission to use this thesis for consultation and to copy
parts of it for personal use.
Every other use is subject to the copyright laws, more specifically the source must be extensively specified when using results from this thesis.
Ghent, 25/05/2020,
The promotor, The author,
Acknowledgements
First, I would like to thank Professor Rabaey for proposing this interesting project. You gave me freedom in this project and the possibility to grow as a researcher and as an individual. However, I also appreciated your honest advice and opinions. You were there with answers to my questions and valuable advice, but also with calming and motivating words.
A big thanks is also given to Arjen, who guided me through the project during the entire year. You helped me with the development of the experiments and with valuable information and resources. Without you, this thesis would not have been how it is right now. Also thank you for reading this thesis so many times!
I would also like to thank Mike and Greet, who helped me a lot in the labs by giving me information and showing me how certain things worked. Without you, I would have probably messed up my experiments at least once. I must also thank Jana, Jorien and Karlien for helping me out with analyses while having so much work themselves.
At last, I would like to thank my friends, family and boyfriend for supporting me during this thesis year. You all helped me by giving me the distraction I sometimes needed and you were always willing to listen to all my complaints and thoughts.
A small foreword
Originally, my experimental plans were a little different before the corona virus came along. I had a new experimental setup to test the removal efficiencies of a dead-end UF filtration and a cross-flow RO filtration, both connected with an activated carbon column as a pre-treatment step. The goal was to compare these two setups with a blank (solely an activated carbon column) based on the removal of pathogens, organics, inorganics and other pollutants. The first four weeks of the second semester, I had been really busy building these setups. Due to a few technical problems (e.g. leakage), the configuration build-up took me longer than expected and long days were spent in my small lab. When finally all three setups were ready to be run, more specifically on the first day that my experiment started, the news came in that thesis students were not permitted to enter the labs anymore. My experimental run was thus so short that I could not even register any data for this new experiment. I only had results from the experiments I did during the first semester.
Because of this rare situation, I talked with my tutor Arjen and promotor Prof. Rabaey about the implementation of an alternative for this experiment. This alternative turned out to be a techno-economical case study about the application of domestic treatment systems to convert rainwater to potable water. Despite the bad luck I had, I tried to make the best out of my thesis. This case study was the last part I needed to make my thesis a completed paper, and I can say now that I am really proud of the result.
Nederlandse samenvatting
Door de klimaatopwarming, bevolkingsgroei en verstedelijking wordt de verdeling van drinkbaar water aan ieder individu een steeds groter probleem. Een oplossing voor de toekomst is nodig zodat er, onafhankelijk van deze toenemende problemen, toch genoeg drinkbaar water kan worden voorzien.
In deze thesis wordt er geprobeerd regenwater te zuiveren tot drinkwater aan de hand van enkele membraanreactor configuraties. Op die manier probeert men zelf in drinkwater te voorzien, met als doel een systeem te ontwikkelen dat op huishoudschaal door gezinnen kan worden geïmplementeerd. Zo zou regenwater op het dak kunnen worden opgevangen en aan de hand van een membraan reactorsysteem worden omgezet naar drinkwater. Zo kan het hele gezin hierin worden voorzien, al dan niet na extra zuiveringsstappen.
Eerst werden drie verschillende membraanconfiguraties getest: een dead-end reverse osmose (RO) filtratie, een dead-end microfiltratie (MF) en een cross-flow RO-filtratie. De resultaten voor de twee dead-end filtraties waren niet volgens de verwachtingen. De concentraties aan organische- en anorganische stoffen leken te stijgen na behandeling. Na eliminatie van mogelijke oorzaken, leken de meest waarschijnlijke een membraandefect of een te lage accuraatheid van de meetapparatuur. De resultaten voor de cross-flow filtratie waren wel volledig zoals verwacht werd.
Ten tweede werden enkele batch reactoren opgesteld die gevuld werden met ongezuiverd regenwater en een laag granulair actief kool (GAC). Twee reactoren werden anaeroob gemaakt en twee reactoren aeroob. Het doel van dit experiment was het bestuderen en identificeren van de gegroeide biofilm op de korrels na een incubatieperiode van 7 dagen. Als laatste deel werd een theoretische case study uitgewerkt die de implementatie van huishoudelijke regenwaterzuiveringssystemen tot drinkwater behandelde. Twee scenario’s werden ontwikkeld op basis van membraanfiltratie; het eerste scenario bestaande uit een UF-membraan met vervolgens een UV-desinfectie, het tweede een RO-UF-membraan gevolgd door een remineralisatiekolom als afwerking. De conclusie van deze case study was dat beide systemen na 16,5 jaar winstgevend zouden zijn ten opzichte van het gebruik van 100% leidingwater.
English summary
Due to climate change, population growth and urbanisation the distribution of potable water to everyone is becoming an increasing problem. A solution for the future is needed so that enough potable water can be provided, independently from these problems.
In this thesis, an attempt is made to convert rainwater to drinking water using different membrane reactor configurations. In this way one can try to provide potable water for ourselves, with the objective of developing a system that could be implemented by families on a household scale. Rainwater would be harvested on roofs and converted to drinking water using a membrane reactor system, if needed with extra treatment steps.
First, three different membrane configurations were tested on their removal performance: a dead-end reverse osmosis (RO) filtration, a dead-end microfiltration (MF) and a cross-flow RO filtration. The results for the two dead-end configurations were not as expected. The concentrations of organic- and inorganic compounds increased after treatment. After elimination of possible causes, the problem could be originating from a membrane defect or the accuracy of the measuring devices. The results for cross-flow filtration were completely as expected.
Second, some batch reactors were constructed and filled with untreated rainwater and a layer of granular activated carbon (GAC). Two reactors were made anaerobic and two reactors aerobic. The objective of this experiment was to study and identify the grown biofilm on the GAC grains after an incubation period of 7 days.
The last part consisted of a theoretical case study focusing on the implementation of domestic rainwater treatment systems to potable water. Two scenarios were developed based on membrane filtration; the first scenario consisted of a UF membrane with subsequently a UV-disinfection, the second consisted of a RO membrane followed by a remineralisation column. The conclusion of this case study was that both systems would have a profit after 16.5 years, compared to a 100% tap water utilisation.
Contents
Introduction ... 1
Literature study ... 4
2.1 Decentralisation of water systems as a possible solution to water scarcity ... 4
2.2 Rainwater as an alternative water resource ... 5
2.2.1 Introduction... 5
2.2.2 Rainwater reuse globally ... 5
2.2.3 Rainwater reuse in Flanders ... 6
2.2.4 Rainwater characterization ... 6
2.2.5 General rainwater reuse systems ... 8
2.3 Biofilm growth in rainwater ... 10
2.3.1 Definition of a biofilm ... 10
2.3.2 Composition of biofilms ... 10
2.3.3 Formation of biofilms ... 11
2.3.4 Role of biofilms in water treatment ... 11
2.4 Membrane bioreactors ... 12
2.4.1 Application of MBR systems ... 13
2.4.2 Membrane characteristics ... 15
2.4.3 Operation of MBR systems ... 20
Objectives ... 24
Materials and methods ... 26
4.1 Rainwater harvesting ... 26
4.2 Experiment 1: dead-end RO filtration and MF ... 27
4.2.1 Configuration setup ... 27
4.3 Experiment 2: cross-flow RO filtration ... 30
4.3.1 Configuration setup ... 30
4.3.2 Experimental methods ... 31
4.4 Analyses... 32
4.4.1 Anions and cations ... 32
4.4.2 COD ... 32
4.4.3 pH and Conductivity ... 33
4.4.4 Coliforms ... 33
4.5 Experiment 3 ... 34
Results and discussion ... 36
5.1 Harvested rainwater quality ... 36
5.2 Experiment 1: Dead-end RO filtration ... 37
5.2.1 pH & Conductivity ... 37
5.2.2 Cations ... 37
5.2.3 Anions ... 39
5.2.4 Discussion ... 40
5.3 Experiment 2: Dead-end microfiltration ... 40
5.3.1 pH & Conductivity ... 40
5.3.2 COD ... 40
5.3.3 Cations ... 41
5.3.4 Anions ... 42
5.3.5 Discussion ... 43
5.4 Experiment 3: cross - flow RO filtration ... 44
5.4.1 pH & Conductivity ... 44
5.4.2 COD & coliforms ... 44
5.4.3 Cations ... 45
5.4.4 Anions ... 46
5.5 Experiment 3 ... 48
Case study: advanced reuse of rainwater on a household scale ... 50
6.1 General assumptions ... 50
6.2 Techno-economic analysis ... 52
6.2.1 Case design ... 52
6.2.2 Technical fiche ... 56
6.2.3 Economic analysis ... 57
6.3 Comparison with conventional domestic rainwater harvesting systems ... 62
Conclusion ... 65
Bibliography ... 67
8.1 Resources ... 67
8.2 Materials economic analysis ... 79
List of used abbreviations
GAC Granular activated carbon
BOD Biological oxygen demand
CAPEX Capital expenditures
COD Chemical oxygen demand
EPA Environmental protection agency
FAO Food and agriculture organisation (of the United Nations)
FO Forward osmosis
GAC Granular activated carbon
MBR Membrane bioreactor
MF Microfiltration
MWCO Molecular weight cut-off
NF Nanofiltration
OPEX Operational expenditures
PAH Polycyclic aromatic hydrocarbons
PVC Polyvinylchloride
RO Reverse Osmosis
RWH Rainwater harvesting
TMP Transmembrane pressure
TOC Total organic carbon
UF Ultrafiltration
UV Ultraviolet
USGS United States geological survey
Figure list
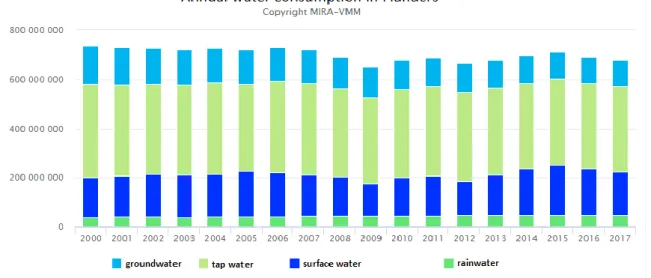
Figure 1: Annual water consumption in Flanders (VMM, 2019)……..……….……..2
Figure 2: Domestic rainwater harvesting system with Catchment, Pre-treatment, storage and reuse (Whatech, 2019)………..………9
Figure 3: Rainsafe installation containing microfiltration, UV disinfection and ozon (Valeco, 2019)………..………10
Figure 4: Stages of biofilm formation on a flat surface (Bioninja, 2020)……….……….….11
Figure 5: Specific retention by MF, UF, NF and RO (Protec, 2017) ………..………….17
Figure 6: Operation of (A) dead-end filtration and (B) cross-flow filtration (Ambrosi, 2014)…..17
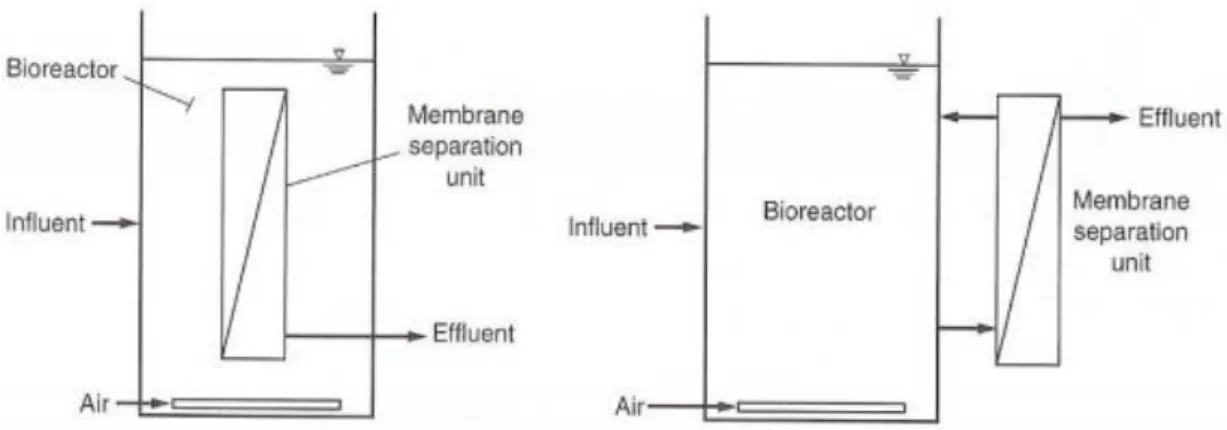
Figure 7: Schematic representation of a submerged (left) versus a side stream (right) MBR (Tchobanoglous, 2013) ……….………18
Figure 8: Possible membrane configurations: a) plate-and-frame, b) spiral-wound, c) hollow-fibre (Daramola, 2012)………..……….19
Figure 9: General scheme of operation of a bioreactor (with aeration) (Smartlearningacademy, 2019) ………..………..20
Figure 10: Membrane fouling in an MBR by (a) pore clogging or (b) cake deposition (Meng et al., 2009)………..…………21
Figure 11: Rainwater harvesting system from a polycarbonate roof………..25
Figure 12: Experimental setup dead-end RO filtration……….26
Figure 13: Experimental setup dead-end microfiltration………..……….………28
Figure 14: Experimental setup cross-flow RO filtration………30
Figure 15: Petri dish without coliform growth………..……….33
Figure 16: Petri dish with coliform growth………..……….33
Figure 17: Setup for oligotrophic biofilm growth on activated carbon in (l) two anaerobic and (r) two aerobic reactors……….………34 Figure 18: Evolution of the effluent cation concentration over time by deadend RO filtration.37
Figure 19: Evolution of the effluent anion concentration over time by deadend RO filtration.39 Figure 20: Evolution of the influent cation concentration over time by deadend MF…….……...42 Figure 21: Evolution of the effluent cation concentration over time by deadend MF……….…...42 Figure 22: Evolution of the influent anion concentration over time by deadend MF…….….…...43 Figure 23: Evolution of the effluent anion concentration over time by deadend MF……….…...43 Figure 24: Evolution of the influent cation concentration over time by cross-flow RO…….…….45 Figure 25: Evolution of the effluent cation concentration over time by cross-flow RO…….…….45 Figure 26: Evolution of the influent anion concentration over time by cross-flow RO…………...46 Figure 27: Evolution of the effluent anion concentration over time by cross-flow RO…..……….46 Figure 28: Relative abundance of the bacteria present in taken samples………..…….………48 Figure 29: Average tap water use of a Flemish household (Van Marcke, 2020)………..50 Figure 30: Evolution of the amount of rainfall in Flanders from 1833-2018 (VMM, 2020)………51 Figure 31: Scenario 1: biofiltration, UF filtration and a UV-unit ……….………54 Figure 32: Scenario 2: biofiltration, RO filtration and a remineralisation step………..55 Figure 33: Evolution of the annual tap water cost for an average Flemish household that consumes up to 72 m³/year (De Watergroep, 2020)……….………57 Figure 34: Return on investment calculation case 1……….………..59 Figure 35: Return on investment calculation case 2………..……….61 Figure 36: Conventional domestic rainwater harvesting system (gwp, 2020)………..62
Table list
Table 1: Advantages and disadvantages of an MBR system (VITO, 2015; Ladewig, 2017; Almes-eko, 2019; Iorhemen, 2016; Kootenaei, 2014) ………..12 Table 2: Removal efficiencies of an MBR system for wastewater treatment (Tchobanoglous, 2003; Kootenaei, 2014; Metcalf & Eddy, 2004) ……….13 Table 3: Removal efficiencies of MF, UF and RO membranes (Warsinger, 2018)………15 Table 4: Characteristics of membrane processes based on pore size (Eeckhout, 2019; Abdullah, 2018; De Gelder, 2019; Alfa Laval, 2019) ………..……16 Table 5: Characteristics of side-stream and submerged membranes (Zhang, 2006)…………..….18 Table 6: pH and conductivity of rainwater (influent), effluent and drinking water norm………..37 Table 7: Rainwater and effluent concentrations, removal rate over time and drinking water norm for sodium, ammonium, potassium, calcium and magnesium (VMM, 2015)………..………38 Table 8: Rainwater and effluent concentrations, removal rate over time and drinking water norm for chlorine, nitrite, nitrate and sulphate (VMM, 2015)……….39 Table 9: pH and conductivity of rainwater (influent), effluent and drinking water norm………..40 Table 10: COD and CFU of rainwater, mean removal % and drinking water norm………..…..40 Table 11: Rainwater and effluent concentrations, removal rate over time and drinking water norm for sodium, ammonium, potassium, calcium and magnesium (VMM, 2015)………..41 Table 12: Rainwater and effluent concentrations, removal rate over time and drinking water norm for chlorine, nitrite, nitrate and sulphate (VMM, 2015)……….42 Table 13: pH and conductivity of rainwater (influent), effluent and drinking water norm……..44 Table 14: COD and CFU of rainwater, mean removal % and drinking water norm…………..……..44 Table 15: Rainwater and effluent concentrations, removal rate over time and drinking water norm for sodium, ammonium, potassium, calcium and magnesium (VMM, 2015)………..45 Table 16: Rainwater and effluent concentrations, removal rate over time and drinking water norm for chlorine, nitrite, nitrate and sulphate (VMM, 2015)……….46 Table 17: Technical fiche case 1 and case 2……….……….56
Table 18: Sections of the total water bill for a 4-person household in Evergem that consumes 130 m³ per year (De Watergroep, 2020) ………57 Table 19: CAPEX case 1………58 Table 20: OPEX case 1……….……….………59 Table 21: CAPEX case 2………..60 Table 22: OPEX case 2………..………60 Table 23: Chemical and microbial parameters in harvested rainwater on campus Coupure (De Watergroep) ………..……..81 Table 24: Flemish drinking water standards (VMM, 2015) ………85 Table 25: European drinking water standards (Lenntech, 2019) ………..……86
1
Introduction
Water scarcity forms a large obstacle to the provision of water of potable quality. In the last few decades water use increased twice as fast as the population growth, resulting in numerous regions surpassing the sustainable water delivery limit (United Nations, 2019). According to the Food and Agriculture Organisation (FAO), around one billion people worldwide do not have access to potable water (FAO, 2019). Nowadays, a third of the world’s biggest groundwater systems are in distress (Richey et al, 2015). Furthermore, due to changes in precipitation patterns and the combination with increasing urbanisation, water scarcity is expected to increase even more (FAO, 2008).
Water scarcity is both a natural and human-made phenomenon. There is enough freshwater available for the entire global population but too much of it is polluted, managed unsustainably or distributed unevenly (United Nations, 2007). Water scarcity can be temporary when it is caused by drought or wastage, but can also be long-lasting because of a lack of infrastructure, constraints in water management or an excessive demand growth (Carrasco, 2012). Water scarcity can be experienced in three ways: 1) when the available supply does not satisfy the demand, 2) when the infrastructure in place does not allow for satisfaction of water demand by all users and 3) when institutions and legislations fail to ensure reliable, secure and equitable supply of water to users. Some countries experience an abundance of water while others encounter conditions of extreme water scarcity (FAO, 2011). As mentioned before in this introduction, global warming leads to an increasing insecurity of global water availability. Adaptation to climate change is necessary, especially in regions where more variable rainfall patterns determine the daily life (e.g. agricultural regions) (UNDP, 2006).
2 In Flanders, water scarcity in the region is among the highest of Europe (Bressers et al., 2016; Thoeye C., 2005). The freshwater scarcity is higher in Flanders than in more arid countries like Spain (Vlakwa, 2019). This problem is mainly caused by the high population density and urbanisation. Climate change is also influencing water scarcity in Flanders. The annual amount of rainwater increases slightly, although summers are getting dryer every year (VMM, 2018). Nonetheless, there are legal obligations about rainwater harvesting and some reuse already takes place; but a large amount is still redirected towards surface water and wastewater treatment (VMM, 2019). Figure 1 illustrates the water consumption in Flanders, where the relatively low rainwater consumption is shown.
The figure shows that tap water originating from tap water companies (light green bars) and surface water (dark blue bars) are the dominant water expenditures in Flanders. Rainwater (dark green bars) consumption is relatively low compared to the others, with a quite constant amount of 50000 m³/year over the years 2000-2017.
In Flanders, the government is frequently handing out benefits to people who are installing a rainwater tank. Since 2014, the construction of a rainwater tank and rainwater infiltration are obligatory in most cases when building or renovating houses (Vlaamse overheid, 2019). In 2.2.3 the rainwater reuse in Flanders is discussed.
Figure 1: Annual water consumption in Flanders: around 190.000.000 m³ surface water, 120.000.000 m³ groundwater and 50.000 m³ rainwater have been consumed in 2017 in Flanders (VMM, 2019)
4
Literature study
2.1
Decentralisation of water systems as a possible solution to
water scarcity
The environmental protection agency (EPA, 2019) defines decentralised wastewater treatment as a variety of approaches for collection, treatment, and dispersal/reuse of wastewater for individual dwellings, industrial or institutional facilities, clusters of homes or businesses, and entire communities”. A possible solution to regional water scarcity and the associated lack of water reuse could lie in the decentralisation of water systems, whereby water reuse is locally implemented (Leigh, 2019). Multiple arguments can be found for decentralisation of water management:
1) For instance, people who live in remote areas often have no opportunity to connect to a centralised facility (Siegrist, 2017). Decentralisation currently serves almost one-quarter of the population of the United States (Nelson, 2005).
2) Decentralisation makes the water usage more efficient as it causes less leakage and as a result is more sustainable and resilient (Leigh, 2019). Transportation distances and volumes can be minimized (Larsen, 2013).
3) Stormwater and other variable water sources that could overwhelm centralised systems can be used more easily. In the US, rainwater harvesting can reduce the stormwater runoff volume up to 20% in semi-arid regions (Steffen et al., 2013). However, decentralised water systems still have several limitations such as a higher energy input per volume of treated wastewater and inadequate technical and financial support from the governments for the water management setup (Tchobanoglous et al., 2003).
Water reuse can be defined as the use of alternative water resources for a beneficial purpose. The process of treating water prior to reuse is called water reclamation (NAS, 2019). Wastewater is most often treated for reuse as non-potable water (e.g. gardening water). With further treatment and disinfection, water of potable quality can be achieved (Helmreich, 2008). This means that with additional treatment of non-potable water, drinking water standards can be reached, as defined in appendix A (Larsen et al, 2013). Rainwater is a more convenient resource for water reuse as it is easy to harvest and available for nearly everyone (Watercache, 2019). In the following chapter rainwater as an alternative water resource is illustrated.
5
2.2
Rainwater as an alternative water resource
2.2.1
Introduction
Rainwater is directly applicable for non-potable use (e.g. irrigation, laundry, garden irrigation, car-washing and toilet flushing). This type of water reuse aims to reduce drinking water consumption from centrally supplied sources (Campisano et al., 2017). Water scarcity and the need for water supply augmentation are two main reasons why the interest in rainwater harvesting systems has increased in the last decade (Steffen et al., 2013).
Rainwater harvesting (RWH), the collection and storage of water from rooftops and diverse surfaces, is needed for rainwater reuse (Kwaadsteniet et al., 2013). Although rainwater harvesting has been performed since ages, better and more complex RWH systems are implemented as the need for alternative water resources is increasing (Campisano et al., 2017).
2.2.2
Rainwater reuse globally
Generally, rainwater reuse is successfully implemented worldwide as a sustainable water supplement. However, the implementation speed differs between regions.
In Africa, RWH systems are often used in small communities and rural areas. Here, the use of RWH systems is often more because of economic reasons than because of water scarcity, which means that there is enough water available but there is a lack of infrastructure to store, treat and transport water (Dobrowsky et al., 2014).
In many Asian countries, there is much motivation for the implementation of rainwater reuse systems as many large cities are facing a lack of water and flood problems. As a result, rainwater reuse systems have been integrated into a large part of the public and private buildings, mainly because of the financial support of local municipalities. Moreover, 30% of the installed harvesting systems in Japan were at universities and schools, another 15% at offices. In Japan, domestic rainwater harvesting systems are widespread. Also in China and Thailand, the government supports the implementation of rainwater reuse systems (Campisano et al., 2017).
Australia has the highest rate of implementation worldwide. In 2013 about 34% of the population possessed their own rainwater harvesting system (Chubaka et al., 2018). Europe (EU) and Northern-America (USA) are also employing RWH systems progressively, but the usage varies by application, country and state.
6 Texas leads in the United States’ rainwater system utilisation, having most systems per capita nowadays. In Europe, Germany is currently the leader in RWH system realisation (Schuetze, 2013; Godskesen, 2013).
2.2.3
Rainwater reuse in Flanders
In Flanders, the usage of rainwater wells has increased markedly in recent years as the installation of rainwater wells is mandatory for newly built and renovated houses. Houses with roof areas larger than 40m² should provide a rainwater well volume of at least 5000L and for areas larger than 100m² the volume should be 50L per square meter of catchment surface. Harvested rainwater can be used, perhaps previously filtered, for toilet flushing, washing machines, irrigation and home- and car cleaning. For drinking water purposes, personal hygiene and dishwashers, the consumption of rainwater without treatment is discouraged by awareness programmes (Vlaamse Overheid, 2019).
2.2.4
Rainwater characterization
Rainwater mainly contains small particles such as dissolved solids, metals and organics. However, these particles are present in relatively low concentrations in rainwater (Rainwater characterisation see appendix A: table 23). Biological treatment, physical treatment and a disinfection step are performed to remove coliforms and heavy metals and eliminate associated health impacts. For rainwater, a chemical treatment is not deemed necessary (Li et al., 2010; Leong et al., 2017). Most quality parameters of rainwater meet drinking water standards except e.g. faecal coliforms and heavy metal concentrations originating from catchment roofs (Huston et al.,2009; Yaziz et al., 1989). For lead (Pb), special attention is needed as it can cause serious health effects when present in drinking water. On the contrary, the presence of fluoride (F) in rainwater is needed when it is used as a primary water resource (Sazakli et al., 2007; Satur et al., 2010).
Microbial and chemical contamination can originate from (Abbasi & Abbasi, 2011): (1) Polluted air
(2) Catchment areas (3) Storage tanks (4) Weather conditions
7 Atmospheric deposition can occur in regions with high industrial or agricultural activities, or in areas with intense traffic (Cunliffe, 1998). In these regions the rainwater possibly contains chemicals at concentrations that exceed the country’s drinking water standards (Kwaadsteniet et al., 2013). Another concern here is the presence of organics derived from herbicides and pesticides. Nonetheless, several studies on rainwater show that for organics the concentrations of interest were below drinking water standards (Sazakli et al., 2007; Chapman et al., 2008; Huston et al., 2009).
A second source of contamination are catchment areas, rooftops and drainage pipes. The roof material, materials deposited onto the roof, roof maintenance and roof geometry affect the roof runoff quality mainly by leaching. Leaching is a physical process in which ions and small organics dissolve in water as they escape from the originating material (Fath, 2018). Lead, acrylic and bitumen roofs are not appropriate for rainwater harvesting as these components cause adverse health effects when present in harvested rainwater (Abbasi & Abbasi, 2011). Other elements that possibly elicit contamination are Zinc (Zn) and Aluminium (Al) (Forster, 1999; Lee et al., 2010). If roofs are made from asbestos, harvested rainwater may contain traces of asbestos dust. However, drinking rainwater containing asbestos may not lead to health issues (WHO, 2004). Pipes may also lead to contamination through release of copper (Cu) or iron (Fe) (Martin et al., 2010).
Severe microbiological contamination can occur because of soil and leaf litter accumulation on roofs and faecal material from birds, mice, rats and insects on catchment areas. In addition, airborne micro-organisms are blown in by the wind (Abbasi et al., 2011; Kwaadsteniet et al., 2013).
When applying domestic rainwater harvesting, the roof runoff is stored in a storage tank. The used tank material may have an influence on the rainwater quality as leaching of ions and metals can occur. For example, due to a release of calcium carbonate, higher pH values have been detected for rainwater stored in concrete tanks when compared to nonconcrete tanks (plastic or wood) (Simmons et al., 2001; Despins et al., 2009).
Rainfall events also affect the rainwater quality, as a correlation is observed between the magnitude of rainfall and the harvested rainwater quality (Kwaadsteniet et al., 2013). In addition, the time between rainfall events affects the rainwater quality as more contaminants are deposited on catchment areas during periods without rainfall, which is why first flush diversion is a possibility to obtain more pure rainwater (Yaziz et al., 1989).
8
2.2.5
General rainwater reuse systems
2.2.5.1 Catchment and pre-treatment
Rainwater can easily be collected on terraces and roofs, while the most efficient rainwater harvesting occurs on sloped metal- and concrete tile roofs (VMM, 2000; Leong, 2017). Pre-treatment is often carried out with first-flush diverters, debris screens and filters (Melville-Shreeve, 2016; Kwaadsteniet et al., 2013). First-flush diversion removes an initial volume of rainwater which contains a high-level turbidity, conductivity and total solids, leading to a better overall quality of the harvested rainwater (Li, 2010). This higher concentration of contaminants comes from the washing-off of particles deposited onto harvesting roofs during dry periods (Yaziz et al., 1989). Screens and coarse filtration remove bigger particles such as leaves and debris before reaching the storage tank, as they cause chemical contamination and bacterial growth (Abbasi & Abbasi, 2011). In addition, coarse filtration is needed to avoid clogging of the pumping system, the accumulation of organics and to reduce the need for cleaning (Leong, 2017).
2.2.5.2 Storage tank
During rainfall events, the roof runoff is delivered to a storage tank with a collection system, mostly consisting of gutters and downspouts. Often a separate piping network with one or more pumps is needed for the direct use of rainwater (Kwaadsteniet et al., 2013).
A tightly sealed, non-transparent tank improves the microbial quality (Gould & Nissen-Petersen, 1999). Some organics and heavy metals can possibly settle in the tank, and therefore a tap must be placed at least 0.5m above the bottom to prevent accidental sludge supply (Coombes et al., 2000; Huston et al., 2012). Above-ground plastic or metal containers can be used, mostly with only a few cubic meters capacity, for irrigation or runoff control. Another type is a below-ground pottery, ferrocement or polyethylene cistern of larger size, mainly for multi-purpose rainwater harvesting (GhaffarianHosseini et al., 2016; Kwaadsteniet et al., 2013). The storage tank is a critical point in the design of rainwater harvesting systems, as the tank design must be suitable for rainwater storage. As mentioned before, concrete tanks can increase the rainwater pH by leaching of calcium carbonate (CaCO3) (Zhu et al., 2004).
9
2.2.5.3 Treatment
Treatment of the harvested rainwater can occur inside the storage tank or in another compartment. Treatment can be implemented by disinfection with Ultraviolet (UV), settling, membrane filtration, heat and biological treatment. Other methods are chlorination, slow sand filtration and solar irradiation (SODIS) (Leong, 2017; Kwaadsteniet et al., 2013). In this thesis, the focus lies on membrane filtration combined with biological treatment.
Figure 2: Domestic rainwater harvesting system with catchment, pre-treatment, storage and reuse (Whatech, 2019)
As shown in figure 2, rainwater is captured on a domestic roof. Thereafter it is transported to a storage tank while passing a diverter. From the storage tank, rainwater is reused for domestic purposes such as heating and toilet flushing. Used rainwater is drained and as such does not return to the reuse cycle.
2.2.5.4 Rainwater treatment systems on the market
Several companies in Flanders already provide rainwater treatment systems. For example, Valeco® claims to convert harvested rainwater to drinking water with the intention of using treated rainwater in the entire housekeeping. After treatment, the water should be ready to use for culinary and drinking facilities as the treated water is free from microbial contaminants. The rainwater would be treated by filtration (5 µm particle size) for the removal of colloids and disinfected using UV-light and ozone. Besides a strong oxidation reagent, zeolite filtration (as an inlet filter) and coarse filtration (as an outlet filter) are applied. Because low concentrations of chemicals and heavy metals are found in rainwater worldwide, these treatment steps should be very effective for the conversion to drinking water (Valeco®, 2019).
10 Other companies worldwide are selling rainwater treatment systems as well, some with the same working principle as explained above.
Figure 3: Rainsafe installation containing microfiltration, UV disinfection and ozone (Valeco, 2019)
2.3
Biofilm growth in rainwater
2.3.1
Definition of a biofilm
A biofilm is a layer of microbial cells that is irreversibly attached to a surface in the presence of water (Areerachakul et al., 2009; Kim, 2014; Livescience, 2016). These microbes are embedded in a self-produced matrix made of extracellular polymeric substances (EPS), mostly consisting of proteins, DNA, RNA and polysaccharides (Kim, 2014; Liu, 2016). Rainwater is low in nutrients and as such provides an oligotrophic environment. However, certain micro-organisms are able to grow in oligotrophic habitats such as rainwater. These micro-organisms use biofilm growth on solid surfaces as a survival strategy in low nutrient conditions (Kim, 2014; Lehtola, 2004).
2.3.2
Composition of biofilms
Almost all micro-organisms are capable of forming biofilms. Some typical bacterial species are
P. aeruginosa, S. epidermidis, E. coli, S. aureus, E. cloacae and K. pneumoniae (Jamal, 2015).
Also yeasts such as S. cerevisiae, C. albicans and A. niger can produce biofilms (Vila et al., 2016). Proteobacteria and Planctomyces are two dominant phyla found in biofilms grown under oligotrophic conditions (Feng, 2017).
11
2.3.3
Formation of biofilms
Biofilm formation mainly depends on rainwater quality, the used type of carrier, hydraulic conditions, the backwashing regime and temperature (Gibert, 2013). Growth happens in four stages: (1) an initial stage defined as the colonisation of different populations, (2) an intermediate stage with a limited amount of dominant populations, (3) a mature stage containing mature biofilms grown in a complex spatial structure and (4) a detachment stage (Kim, 2014).
Figure 4: Stages of biofilm formation on a flat surface (Bioninja, 2020)
Studies using a biofilter show that biofilm growth is inversely proportional to the column depth because of an increasing hydraulic pressure from top to bottom. In addition, a steady-state microbial concentration was detected after three weeks on a lab scale and after two to three months in a full-scale installation (Lethola, 2004; Persson et al., 2006; Velten et al., 2011).
2.3.4
Role of biofilms in water treatment
Biofilms play an important role in many water reuse and reclamation systems. In some cases, biofilms cause problems to the treatment system e.g. biofouling or growth of pathogens. However, biofilms can be very beneficial in water treatment systems by degrading organic contaminants present in water (Kim, 2014). Biofilms are often associated with membrane reactors and filtration systems used in water reuse- and reclamation. In a study from Areerachakul et al. (2009) based on the growth of biofilms on granular activated carbon (GAC) in a fixed bed bioreactor, the removal of nutrients was examined. This study concluded that there was a removal of 40% COD in a 15cm bed and of 80% nitrate and 30% phosphate in a 10 cm bed. However, there was no reduction in fluoride and chlorine as they were not taken up by the microbes of the biofilm.
12
2.4
Membrane bioreactors
Membrane bioreactor (MBR) technology is the combination of a membrane filtration process and a biological treatment process (Judd, 2006). Membrane bioreactors are used for many purposes, e.g. the biological treatment of wastewater, with a high removal efficiency of organic compounds in the effluent (VITO, 2015). After treatment, the effluent stream can be released or recycled in the industrial process e.g. a brewery malting process. Nonetheless, membrane bioreactors require high operational and energy costs due to the constant pump usage and aeration (Judd, 2010). Several benefits and drawbacks of membrane bioreactors are listed in table 1.
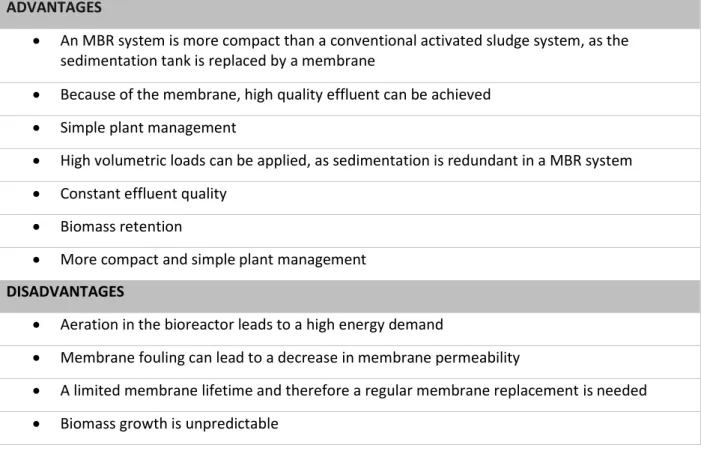
Table 1: Advantages and disadvantages of an MBR system (VITO, 2015; Ladewig, 2017; almes-eko, 2019; Iorhemen, 2016; Kootenael, 2014)
ADVANTAGES
• An MBR system is more compact than a conventional activated sludge system, as the sedimentation tank is replaced by a membrane
• Because of the membrane, high quality effluent can be achieved • Simple plant management
• High volumetric loads can be applied, as sedimentation is redundant in a MBR system • Constant effluent quality
• Biomass retention
• More compact and simple plant management
DISADVANTAGES
• Aeration in the bioreactor leads to a high energy demand
• Membrane fouling can lead to a decrease in membrane permeability
• A limited membrane lifetime and therefore a regular membrane replacement is needed • Biomass growth is unpredictable
13
2.4.1
Application of MBR systems
MBR systems are an attractive option when wastewater must be treated where space is limited and quality high effluent is required (Judd et al., 2019). In the table below, the average removal efficiencies from literature of BOD, COD, NH4, Nt, and TSS are shown for municipal
wastewater treatment.
Table 2: Average removal efficiencies of an MBR system for municipal wastewater treatment (Tchobanoglous, 2003; Kootenaei, 2014; Metcalf & Eddy, 2004)
Effluent component Removal efficiency (%)
Biological oxygen demand (BOD) 95 Chemical oxygen demand (COD) 94
Ammonia (NH4) 98
Total N (Nt) 81
Total suspended solids (TSS) 97
Membrane bioreactor (MBR) technology is a promising method for water and wastewater treatment because of its capability to produce high-quality effluent that meets the water quality regulations (Aileen & Kim, 2007). In many places worldwide, the MBR approach is used for wastewater reuse or to provide superior quality effluent (Kootenaei, 2014). MBR technology is used for water treatment in many sectors including industry, domestic use and water reclamation. In industry, MBRs can be used for treatment of heavily polluted wastewater streams such as chemical streams, oily streams and lab wastewater streams. (Judd, 2006; Adema & Benson, 2001). Membrane bioreactors are also used for cleaning of municipal wastewater (Judd, 2006).
14 For small-scale applications, the focus currently lies on bench or pilot scale studies, but some companies are already handling more advanced studies (e.g. Bosaq). All kinds of setups are tested worldwide (Yang et al., 2006). There, research is performed on the treatment of a specific type of wastewater during short-term operations. The removal of proteins, salts, bacteria, organics and metals is investigated. An example of an upcoming small-scale MBR treatment system is a membrane bioreactor applying an osmosis principle. These systems use forward osmosis (FO) and can overcome the limits of usual MBR systems, as they require no hydraulic pressure and achieve a higher quality effluent (Cornelissen et al., 2008; Xue et al., 2016). However, problems such as salt accumulation within the reactor and membrane fouling prevent use on a large-scale (Wang et al, 2016). Another example is the use of small-scale MBRs for the removal of biological nutrients from domestic wastewater (Abbeglen et al., 2008). Research in groundwater treatment with MBRs for drinking water production has remained minimal, probably because the use of biological treatment options can be quite unpredictable. However, increased attention to water reuse will play an important role in expanding MBR technology for water treatment and potable water supply (Yang et al., 2006).
15
2.4.2
Membrane characteristics
Six commercial membrane processes are available: microfiltration (MF), ultrafiltration (UF), nanofiltration (NF), reverse osmosis (RO), diafiltration (DF) and electrodialysis (ED). These processes can be classified based on membrane pore size, the applied separation mechanism, membrane configuration and the driving force (pressure, concentration differences, etc.) (Tchobanoglous et al., 2003). Experiments have shown that most membrane bioreactors (MBR) are effective on organics, solids and pathogen removal, depending on the chosen membrane pore size (Bani-Melhem & Smith, 2012).
Table 3: Removal efficiencies of MF, UF and RO filtration (Warsinger, 2018; ESP water products ,2020)
Component MF UF RO TOC 45-65% 50-75% / BOD 75-90% 80-90% / COD 70-85% 75-90% 95-98% TSS 95-98% 96-99,9% 97-99,9% NH4+ 5-15% 5-15% 85-95% NO32- 0-2% 0-2% 60-75% PO43- 0-2% 0-2% 96-98% SO42- 0-1% 0-1% 96-98% Cl- 0-1% 0-1% 85-92%
Total coliform Log 2-5 Log 3-6 Log 4-7
16
2.4.2.1 Pore size
The pore size defines the size of the particles that can diffuse through the membrane. Components bigger than the membrane pore size are retained, as molecules with a smaller pore size permeate through the membrane. This way, the separation of sludge and effluent is achieved (Heis, 2013). The smaller the pore size of the membrane, the higher the needed pressure on the membrane (Mulder, 1996). This specific pressure is called the transmembrane pressure (TMP), the difference in pressure between the two sides of a membrane. In case of a NF or RO membrane, separation is based on the molecular weight cut-off (MWCO) instead of the pore size (De Meis, 2017). The flux, the flowrate of particles through a membrane at a given pressure, is proportional to the driving force (Eeckhout, 2019).
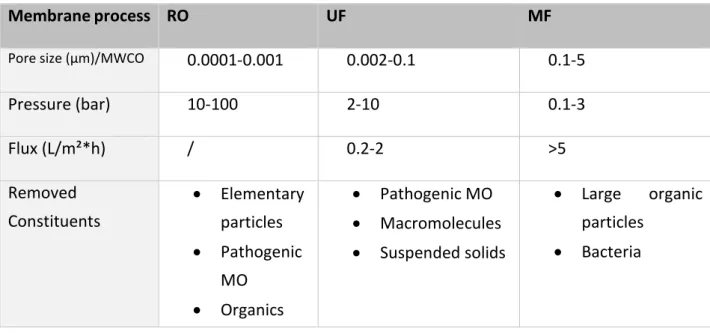
Table 4: Characteristics of membrane processes based on pore size (Eeckhout, 2019; Abdullah, 2018; De Gelder, 2019; Alfa Laval, 2019). RO flux is not given as RO fluxes are dependent of the applied pressure on the membrane.
Membrane process RO UF MF
Pore size (µm)/MWCO 0.0001-0.001 0.002-0.1 0.1-5
Pressure (bar) 10-100 2-10 0.1-3 Flux (L/m²*h) / 0.2-2 >5 Removed Constituents • Elementary particles • Pathogenic MO • Organics • Pathogenic MO • Macromolecules • Suspended solids • Large organic particles • Bacteria
The main disadvantage of MF is that it cannot eliminate dissolved solids smaller than 0.1µm (Eeckhout, 2019). In addition, MF is not an absolute barrier to viruses and bacteria (De Gelder, 2019). UF has some limitations including its inability to remove any dissolved inorganic substances from water, and regular cleaning is needed to maintain a high-pressure water flux (De Gelder, 2019; Abdullah, 2018). RO is only permeable to water molecules, some ions and small organic molecules. The applied pressure on RO must be high enough so that water is able to overcome the osmotic pressure (Abdullah, 2018). The pore structure of RO membranes is much tighter than UF membranes as hard water is converted to soft water with RO applications. Some disadvantages include the use of high pressures resulting in high energy demands, a higher equipment cost compared to other membrane processes and RO membranes are more prone to fouling when using higher flow rates (Mulder, 1996).
17
Figure 5: Specific retention by MF, UF, NF and RO (Protec, 2017)
2.4.2.2 Configuration
Dead-end filtration and cross-flow filtration are two main configurations of membrane filtration. Dead-end filtration entails the process in which the influent stream permeates the membrane perpendicular to it. Membrane fouling occurs when applying MF-, UF-, NF- or RO membranes and for polluted influent streams (Mulder, 1996). All water must pass through the membrane, as the rest is retained and treated as waste. The advantages of dead-end filtration are high product recovery and simple operation.
During cross-flow filtration, the influent stream flows tangentially across the membrane surface as filtrate passes through and concentrate accumulates at the end of the membrane. The concentrate can be recirculated to the influent tank (Eeckhout, 2019).
The best option for MBR systems is cross-flow filtration as it reduces membrane fouling and therefore foresees a longer membrane lifespan (Alexander et al., 2003; Synder, 2019). Yet dead-end filtration is most often used because of the abovementioned high product recovery and simple operation (Singh, 2015).
18 Membranes can either be used in submerged (intern) or side-stream (extern) MBRs. In submerged MBR configurations the membrane is placed in the bioreactor itself. The effluent is withdrawn from the sludge by applying an under-pressure (De Meis, 2017). Mainly flat-sheet membranes are used. For side-stream MBRs the membrane is placed outside of the reactor and a recirculation is added towards the bioreactor. The influent is applied in cross-flow mode through the membrane. Both tubular and flat-sheet membranes can be handled in side-stream configurations.
In industry, submerged membranes are preferred as the cost is reduced due to the elimination of an extra pressure needed for transport (Layson, 2004). However, an under-pressure is still needed for filtration to occur. A second benefit is that a submerged membrane requires less space than a pressurized membrane (Judd & Judd, 2017).
Table 5: Characteristics of side-stream and submerged membranes (Le-Clech, 2005: Zhang, 2006)
Parameter Side-stream Submerged
TMP (bar) 0.3-0.5 0.03-0.05
Permeate flux (L/m²h) 5-15 2-4
19
2.4.2.3 Geometry
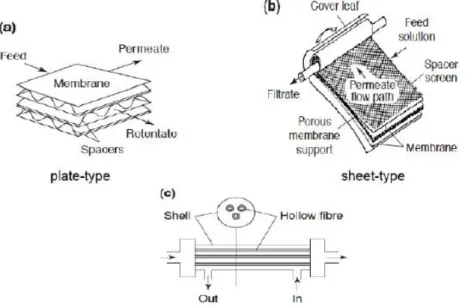
In tubular membranes, a pipe-shaped carrier is used for attachment of the membrane. The feed enters the tubular membrane at one side, whereas the permeate passes through the holes of the packaging. Tubular membrane systems work with tangential cross-flow and are applied when feed streams are high in solids; oil, fat, or grease contents require processing (Eeckhout, 2019; Mulder et al., 1996).
In hollow fibre systems numerous hollow fibres or long porous tubes are packed into an outer shell (cartridge). These filaments are very delicate but flexible. Hollow fibre systems operate under the same principles as tubular systems, but a smaller tube diameter is used. There is a much higher permeate flux than in tubular systems. However, there is easy breakage and membrane fouling is irreversible (Steviashantanu, 2019; Eeckhout, 2019; Mulder et al., 1996). In plate-and-frame systems, membranes are attached on top of plate-like structures and the system is held together by a frame-like support. A plate-and-frame system is operated under cross-flow, where the feed enters on one side of the system and retentate exits the system on the other side. Benefits of tangential cross-flow plate-and-frame systems are reduced membrane fouling and an easy separation of solids from extracts (Steviashantanu, 2019; Eeckhout, 2019; Mulder et al., 1996).
Spiral wound systems are the most complex membrane configurations. A feed spacer is put in between two folded membranes, as the feed spacer is needed for the water to flow between the two membranes. This spacer complex is attached to a permeate spacer, which is connected to a permeate tube. These steps are repeated until all the permeate spacers are attached to the membranes. Eventually, the membrane layers are fastened to the permeate tube, creating the spiral system (Steviashantanu, 2019; Eeckhout, 2019; Mulder et al., 1996).
20
2.4.3
Operation of MBR systems
2.4.3.1 Biological treatment
Bhatia and Bera (2015) defined a bioreactor as “a vessel that carries out a biological reaction and is used to culture aerobic cells for conducting cellular or enzymatic immobilization” (Saurabh Bhatia, Tanmoy Bera, 2015). The working principle is equal in submerged and side-stream MBRs. At first the influent, in the case of this thesis rainwater, enters the bioreactor. For heavily polluted influents there can be a filtration step before entering the bioreactor. Bacteria in the bioreactor use components such as organics and nutrients in the wastewater as nutrition for their metabolism and multiplication.
As such organic components and inorganic nutrients present in the wastewater are converted to bacteriological activated sludge (VITO, 2015). The retained sludge can either stay in the bioreactor or be removed through a separate exit. In the context of MBR treatment the membrane replaces a sedimentation tank used in classical biological separations of sludge and effluent, as sedimentation is not needed in an MBR (VITO, 2015). This makes the installation more compact. Another benefit is that higher sludge concentrations (10-20g/L) can be achieved in an MBR as there is a good removal of components from the influent by the biomass (Ladewig, 2017). As a result, smaller reactor volumes can be used in comparison to conventional systems.
Although an agitation system is shown in figure 8, it is not always needed in a bioreactor system as it is not an MBR.
21
2.4.3.2 Membrane filtration
The sludge-water mix then undergoes treatment by membrane filtration. Naturally, molecules move from areas with a high concentration to a lower concentration, but with an applied pressure the molecules can flow from low concentrations to high concentrations (Synder, 2019). A membrane can transport some components more readily than others because of differences in chemical or physical properties between the membrane and the permeating components. Often the permeation rate through a membrane is proportional to the driving force (Mulder, 1996).
Here, hollow fibre and flat-sheet membranes are the most frequently used membrane types as they reach higher removal efficiencies (VITO, 2015).
2.4.3.3 Membrane fouling in MBR systems
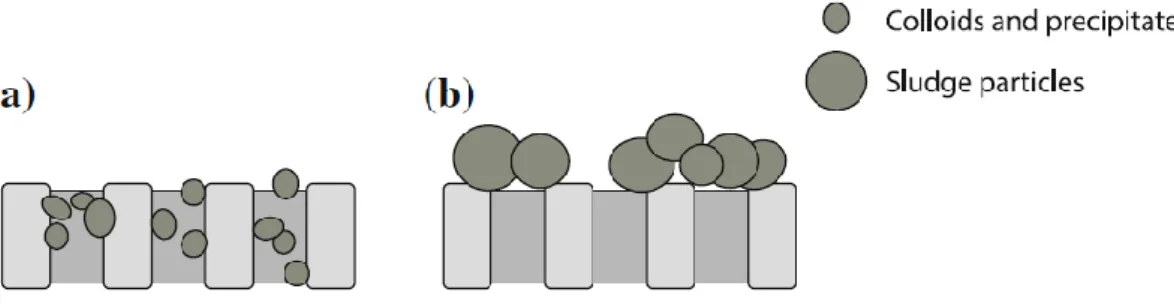
“Membrane fouling is the accumulation of substances on the membrane surface and or within the membrane pores, which results in deterioration of the membrane performance” (Nady, 2011). Membrane fouling in MBR systems leads to more frequent cleaning, a shortened membrane lifespan and compromised product water quality. In addition, it leads to a higher energy operation as the transmembrane pressure (TMP) increases under constant-flux conditions (Judd, 2006). Fouling is a common phenomenon in which retained particles, macromolecules, micro-organisms or salts are deposited and accumulated on the membrane surface or in the membrane pores (Meng et al., 2009; Hilal, 2015).
Depending on the specific membrane process, membrane fouling can be classified into organic fouling or inorganic fouling, biofouling, particulate fouling, reversible or irreversible fouling and removable or irremovable fouling. Organic-, inorganic- and biofouling occur simultaneously during filtration processes. The interaction between different types of foulants leads to a decline in the permeation flux of the membrane (Judd, 2006; Ochando-Pulido; 2018).
22 Membrane fouling is caused by biofouling, pore-clogging and sludge cake deposition (Hilal et al., 2005; Lee et al., 2001). Other types of adsorption or deposition of particles within the membrane pores and alterations to the cake layer affect membrane fouling (Bai & Leow, 2002; Wiesner et al., 1992). Pore blocking and adsorption in internal pore surfaces occur if the foulants are smaller than the membrane pores. As a result, pore clogging increases the membrane resistance whereas a cake layer can create an additional layer of resistance to the permeation flow (Bai & Leow, 2002; Wiesner et al., 1992).
Air sparging is an effective method used to remove cake layers from the membrane surface and control concentration polarisation. External fouling can be removed a certain extent via chemical cleaning. However, chemical cleaning for the sake of eliminating irremovable membrane fouling should be limited to a minimum because repeated chemical cleaning may shorten the membrane lifespan. Second, chemicals could degrade the membrane and thus shorten the membrane lifespan, and the disposal of spent chemical agents causes environmental issues as these chemicals can lead to water pollution (Yamamura et al., 2007). As an alternative, removable fouling can be treated by the performance of physical cleaning (backwashing, backflushing or relaxation) (Meng et al., 2009). Using absorbents or coagulants can reduce the internal clogging of the membrane or the amounts of solute in the solution and improve the flocculation ability of flocs.
24
Objectives
As explained in the literature study, there is an increasing demand for drinking water globally. Other water resources such as rainwater could be used to provide potable water for households and thus stimulate decentralisation. In this thesis, the main goal is to convert rainwater to potable water on a household scale. A membrane bioreactor (MBR) is an attractive treatment option to obtain drinking water. However, additional treatment steps such as disinfection are possibly needed depending on the effluent quality after membrane treatment. The goal is to investigate whether drinking water norms can be achieved with RO filtration or microfiltration. The objective is as well to achieve high recovery rates (> 90%). In the second part, a theoretical assessment is performed for two rainwater treatment systems on a household scale. In addition, these rainwater treatment systems are compared with conventional rainwater harvesting.
RQ1: Can the influent be converted to drinking water with high recovery rates?
RQ2: Could drinking water standards be reached with microfiltration and reverse osmosis
filtration?
RQ3: What are the costs and return on investment periods for domestic rainwater treatment
26
Materials and methods
4.1
Rainwater harvesting
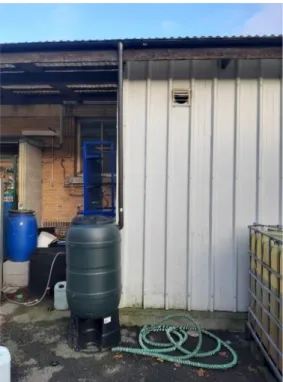
Rainwater was captured from a 99% polycarbonate roof at campus Coupure from Ghent University in the city centre of Ghent. The sampling site lies within a 500m vicinity of major city roads around such as Rooigemlaan and Martelaarslaan. In addition, the port of Ghent is located within 5km of campus Coupure. Polluting emissions from companies located at the port of Ghent are possible. The vicinity of these companies possibly affects the condition of the sampling site. Rainwater was collected in a gutter and thereafter transported to a harvesting tank using a PVC piping network. The rainwater was stored in the 210L harvesting tank (Practo®, Hubo). The tank was non-transparent to prevent sunlight entering the tank, thus avoiding algal growth. The outside temperature was between 3 and 20 degrees Celsius during the sampling period (Experiments: October-December 2019, De Watergroep: February 2020). Rainwater batches were taken using a small tap at the bottom of the rainwater tank.
27
4.2
Experiment 1: dead-end RO filtration and MF
4.2.1
Configuration setup
4.2.1.1 Dead-end RO filtration
A synthetic influent tank of 25L was applied containing the captured rainwater, and a synthetic 10L barrel to capture permeate exiting the system. Transport of water through the system occurred using two peristaltic pumps (Watson Marlow®, UK, 101 U/R, 1-99rpm, 60Hz). One pump was placed at each side of the reactor to transport the feed and permeate respectively. For this transport through the system, 4.8 mm polypropylene tubes were applied. An aeration pump of the brand Superfish® airflow mini was employed to ensure an adequate mixing in the reactor. A perforated aeration tube was connected to the aeration pump and subsequently placed at the bottom of the reactor as the pump was not water resistant. The reactor itself was a plexiglass rectangular column with dimensions 51cm x 25cm x 9.5cm and a total volume of 12.1L. The membrane was made manually by gluing two 20cm x 32cm RO membrane sheets (Dow® water & process solutions FILMTEC flat sheet membrane BW30, polyamide Thin-film composite, feed max 19m³/h) on a 21cm x 33cm plate-and-frame MF membrane (chlorinated polyethylene, pore size 0.4 µm) with epoxide glue.
28
4.2.1.2 Dead-end microfiltration
Figure 13: Setup dead-end microfiltration
The used materials for the MF setup were analogous to the materials applied in the RO setup. A synthetic influent tank of 25L containing the harvested rainwater was used, as well as a transparent synthetic 10L barrel for the permeate. Transport of the water through the system again occurred by employing two peristaltic pumps (Watson Marlow®, UK, 101 U/R, 1-99rpm, 60Hz). For transport in the system 4.8 mm transparent polypropylene tubes were adopted. For aeration in the reactor, an aeration pump (Superfish® airflow mini) was used. A perforated aeration tube was connected to the aeration pump and subsequently placed at the bottom of the reactor to achieve a good mixing of the influent and reactor concentrate. The reactor itself was a plexiglass rectangular column with dimensions 51cm x 25cm x 9.5cm. As a filtration barrier a plate-and-frame MF membrane made of chlorinated polyethylene and with a pore size of 0.4 µm was used (De Gusseme, 2009). The total membrane surface was 0.05m². Effluent was pumped out of the membrane spacer via a polymer Tygon® tube (Saint-Gobain, France, 3.2mm), into a synthetic 10L effluent tank.
29
4.2.2
Experimental methods
In the first experiment an RO membrane was used as filtering barrier in a membrane bioreactor during a five-day run. The second experiment was performed analogously, replacing the RO membrane by an MF membrane. Influent, harvested rainwater, was stored in an influent tank of 25L. The rainwater was pumped from the influent tank to the bottom of the reactor using a Watson-Marlow® pump (UK, 121 U/R) at an influent flow rate of 4 mL/min. The pressure acting on the membrane was regarded as negligible for the MF membrane and was around 0.5 bar during the RO experiment. For the first experiment the second Watson-Marlow® pump (UK, 121 U/R) also had an effluent flux of 4mL/min, the second experiment had an outgoing flux of 3.2mL/min to achieve a recovery rate of approximately 80 percent. This means that 80% of the influent volume was recovered as permeate. The rest was routed to drain. The overflow of the reactor was caught in an overflow vessel. The effluent was pumped out of the membrane spacer via a polymer Tygon® tube, connected at the top of the membrane spacer, to an effluent tank of 10L. An aeration tube, connected to an aeration pump, was placed on the bottom of the reactor so that rising air bubbles could maintain complete mixing of the incoming influent and concentrate in the reactor. The reactor was placed in a room at approximately 19°C.
Samples were taken in the influent tank, reactor and effluent tank on days 1, 3 and 5. The samples were analysed to quantify cations/anions, COD, pH, conductivity and coliforms. Analyses were performed within 24 hours after sampling. If not, they were stored at -20°C until analysis. Analyses for coliform detection and ion determination were always performed immediately after sampling. The applied analyses are explained in section 4.4.
30
4.3
Experiment 2: cross-flow RO filtration
4.3.1
Configuration setup
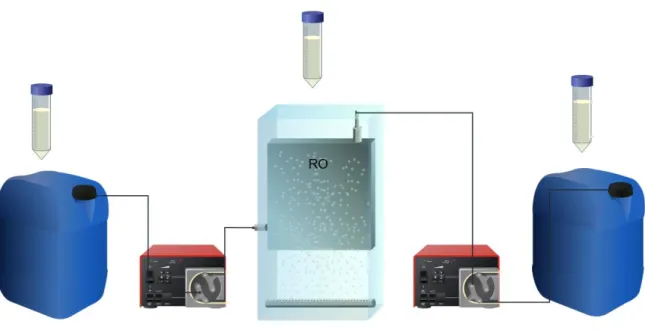
Figure 14: Experimental setup cross-flow RO filtration
As an influent pump, a peristaltic Watson-Marlow® pump (323U, UK, 3-400rpm, 60Hz) was used. It pumped the harvested rainwater from a synthetic 10L tank into another 10L tank, which served as the reactor tank. A second peristaltic Watson-Marlow® pump (530S, UK, 0,1-220rpm, 60Hz) transported the water to the flow cell containing a 20cm x 7cm RO membrane sheet (DOW® water & process solutions, FILMTEC flat sheet BW30, polyamide Thin-film composite, feed max 19m³/h). The total membrane area was 0.014m². The flow cell consisted of two plexiglass rectangular plates (32cm x 12cm x 2cm) that were attached with screws. The flow cell had four inner rubber O-rings (two in each plate) to prevent water leaking from the cell. A synthetic effluent tank of 10L was connected to the flow cell with polypropylene tubing, but the flow cell was also connected to other tubing for recirculation of concentrate to the reactor tank. One spring-loaded backpressure regulator of the brand Swagelok® (USA, KBP-series, 0.68-34.4bar) was placed after the flow cell to control the applied pressure on the membrane. The backpressure valve was connected to a liquid manometer (Mega®, 63mm, 0-2.5bar)
31
4.3.2
Experimental methods
A five-day run was performed with a flow cell containing an RO membrane. The influent, rainwater, was pumped into the reactor tank with the influent pump at a rate of 0.833 mL/min. A total influent volume of 5.976L was therefore needed during a five-day run. From the reactor tank the second pump was connected working at a flow rate of 80 rpm. This inflow from the reactor was led directly to the flow cell. The feed passed through the flow cell containing the RO membrane, resulting in an applied pressure on the flow cell between 1 and 1.5 bar. The effluent, treated rainwater, entered a 10L effluent tank with a flux of 0.667 mL/min. After five days, 4.8L of effluent had been captured. The second exiting stream was led back to the reactor as a recirculation flow to remove concentrate from the membrane. The flow rate of the recirculation was 62mL/min, depending on the applied pressure on the flow cell. Because of the presence of a recirculation flow and additional influent pumping into the reactor tank, there was an overflow of 20% for these parameters. This overflow led out of the reactor tank into a catchment barrel. A recovery rate of 80% could be achieved, which means that 80% of the influent was recovered as permeate and 20% left the system.
Samples were taken in the influent tank, reactor and effluent tank. During a five-day run, samples were taken at day 1-3-5. The samples were analysed for the detection of cations/anions, COD, pH, conductivity and coliforms. Analyses were performed within 24 hours after sampling, particularly the coliform test and IC analysis. If the other tests were not immediately performed, the therefore needed samples were stored deeply frozen at -20°C until analysis.