DECARBONISATION OPTIONS
FOR THE DUTCH PVC
INDUSTRY
V.P. Semeijn, K.M. Schure
10 February 2020Decarbonisation options for the Dutch PVC industry
© PBL Netherlands Environmental Assessment Agency; © 2020 TNO The Hague, 2020
PBL publication number: 3717
TNO project nr. 060.33956 / publication nr. TNO 2019 P11954
Authors
V.P. Semeijn and K.M. Schure
Acknowledgements
We are thankful to Paul Beaufort, Albert Keukens, Jan van Bezouw, and Robert Versteeg (Shin-Etsu PVC B.V.), for providing us with valuable insight and feedback regarding the current PVC production processes.
MIDDEN project coordination and responsibility
The MIDDEN project (Manufacturing Industry Decarbonisation Data Exchange Network) was initiated and is also coordinated and funded by PBL and ECN part of TNOa. The project aims to support industry, policymakers, analysts, and the energy sector in their common efforts to achieve deep decarbonisation. Correspondence regarding the project may be addressed to: K.M. Schure (PBL), Klara.Schure@pbl.nl, A.W.N van Dril (TNO), Ton.vanDril@tno.nl, or D. van Dam (Dick.vanDam@pbl.nl).
Production coordination
PBL Publishers
This publication is a joint publication by PBL and ECN – part of TNO and can be downloaded from: www.pbl.nl/en. Parts of this publication may be reproduced, providing the source is stated, in the form: Semeijn, V.P. & Schure, K.M. (2020), Decarbonisation options for the Dutch PVC industry. PBL Netherlands Environmental Assessment Agency and ECN part of TNO, The Hague.
PBL Netherlands Environmental Assessment Agency is the national institute for strategic policy analysis in the fields of the environment, nature and spatial planning. We contribute to improving the quality of political and administrative decision-making by conducting outlook studies, analyses and evaluations in which an integrated approach is considered paramount. Policy relevance is the prime concern in all of our studies. We conduct solicited and
unsolicited research that is both independent and scientifically sound.
ECN part of TNO has a twofold mission: to accelerate the energy transition and to strengthen the competitive position of the Netherlands. ECN part of TNO conducts independent and internationally leading research and we stand for an agenda-setting, initiating and supporting role for government, industry and NGOs.
This report is reviewed by Shin-Etsu PVC B.V. PBL and ECN part of TNO remain responsible for the content. The decarbonisation options and parameters are explicitly not verified by Shin-Etsu PVC B.V.
Contents
LIST OF ABBREVIATIONS
4
SUMMARY
5
INTRODUCTION
7
1
PVC PRODUCTION IN THE NETHERLANDS
8
1.1 Introduction to the Dutch chemical industry 8
1.2 Production locations of PVC in the Netherlands 9
1.3 Shin-Etsu PVC B.V. 11 1.4 Vynova Beek 12 1.5 CO2 emissions 13
2
PVC PRODUCTION PROCESSES
17
2.1 Overview 17 2.2 VCM production 17 2.3 PVC production 233
PVC PRODUCTS AND APPLICATION
27
3.1 PVC in the Netherlands 27
3.2 Recycling of PVC 30
4
OPTIONS FOR DECARBONISATION
32
4.1 Cracking furnace with hydrogen burners 34
4.2 Electric furnace 36
4.3 Carbon capture and storage (CCS) 38
4.4 Bio-ethylene as feedstock 40
4.5 Steam from biomass 43
4.6 Circularity 44
5
DISCUSSION
49
6
REFERENCES
51
APPENDIX
57
Notable revamps of Shin-Etsu Botlek and Pernis 57
Calculations on Chemelot BKG08 emissions 58
Mass Flow Analysis (MFA) 60
Energy Flow Analysis (EFA) 67
List of abbreviations
BAT Best Available Technique BIS Buizen Inzamel Systeem BTX Benzene Toluene Xylene CAPEX Capital Expenditures
CCS Carbon Capture and Storage CCU Carbon Capture and Utilisation CHP Combined Heat and Power CO Carbon Monoxide
CO2 Carbon Dioxide
EDC 1,2-Dichloroethane / 1,2-ethylenedichloride EEI Energy Efficiency Improvement
EFA Energy Flow Analysis
EU ETS European Union Emission Trading System
H2 Hydrogen
H2O Water
HCl Hydrogen Chloride
HE Heavy Ends
HP EDC High Purity 1,2-Dichloroethane HP steam High Pressure steam
HTC High Temperature Chlorination kt Kilotonnes (1000 metric tonnes) LE Light Ends
LP steam Low Pressure steam
LTC Low Temperature Chlorination MFA Mass Flow Analysis
MIDDEN Manufacturing Industry Decarbonisation Data Exchange Network MP steam Medium Pressure steam
NEa Dutch Emission Authority (Nederlandse Emissieautoriteit) NOx Nitrogen Oxides
OPEX Operating Expenditures PVC Polyvinyl Chloride
TRL Technology Readiness Level VCM Vinyl Chloride Monomer
FINDINGS
Summary
The Dutch chemical industry has evolved into a leading supplier of chemical products and services in Europe. Ethylene, one of the largest volume commodity chemicals produced by the petrochemical sector is the main feedstock for the production of polyvinyl chloride (PVC). Since this polymer is strong, lightweight, resistant to weathering and cost-effective it is widely used for building and construction applications, such as underground pipes, window frames and flooring.
In the Netherlands there are two EU ETS registered PVC manufacturing companies: Shin-Etsu PVC B.V. and Vynova Beek. It is estimated in this report that the sites together are responsible for around 94 kilotonne (kt) direct CO2 emissions. Shin-Etsu PVC B.V. is located in the Port of Rotterdam and is built up of two production sites: Botlek and Pernis. Vinyl chloride monomer (VCM) is produced in Botlek which is then transported to Pernis where PVC is manufactured. Vynova Beek in Chemelot Industrial Site is only responsible for the
production of PVC out of imported VCM from Vynova Tessenderlo in Belgium.
PVC is produced by polymerisation of VCM, which is obtained by thermal cracking (pyrolysis) of 1,2-ethylenedichloride (EDC). In the Netherlands EDC is produced by a combination of (i) direct chlorination and (ii) oxychlorination. The main feedstocks required are ethylene, chlorine, oxygen and hydrogen chloride. Furthermore, natural gas, steam (low-pressure, medium-pressure, high-pressure), hydrogen and electricity are consumed in the process.
Most of the energy in the process is consumed during cracking of VCM. Natural gas is burned to pre-heat the cracking reactants and provide the endothermic reaction process with heat. This goes hand in hand with high CO2 emissions: from calculations it is found that the
cracking furnaces emit 80.6 kt CO2/year, and are responsible for 86% of the direct emissions reported by the NEa.
In general, decarbonisation options for the PVC manufacturing industry in this report focus on feedstock substitution, fuel substitution, recycling (circularity) and carbon capture and storage (CCS), each with its own advantages and disadvantages. In terms of its chemical composition PVC is only partly based on carbon-containing feedstocks. The mass of chlorine in PVC determines 57% of its weight. In the Netherlands chlorine is obtained in large amounts from the chlor-alkali industry, which is already party fuelled by renewable electricity, indirectly reducing the CO2 footprint of PVC.
The cracking furnace, as mentioned before, is the main source of CO2 emissions in the PVC production process. Three main options exist to reduce emissions from the cracking furnace. Firstly, fully replacing natural gas burners with hydrogen burners in the cracking furnace has the potential to remove all CO2 emissions from the cracking furnace, since burning hydrogen only emits water. Prerequisites for successful implementation of hydrogen burners would be the availability of green or blue hydrogen for a price which is competitive with natural gas and more research into the optimal distribution of burners inside the cracking furnace. It is expected that the technology will be available around 2030.
Alternatively, the cracking furnaces could be fully electrified by applying electric heat technologies. Implementing electric cracking furnaces would require demolition of the existing furnaces and will come most likely with high investment costs (Engelenburg, 2019). In order to avoid indirect emissions, availability of cheap renewable electricity is a
prerequisite and the power grid will have to be able to deal with the increased electricity demand. According to TNO experts, electrification does not come with large technological barriers (Zondag, 2019).
Thirdly, carbon capture and storage (CCS) technology could be used in the VCM production process at Shin-Etsu to separate CO2 from the flue gas coming from the natural gas burners which are currently installed in the cracking furnaces. The Porthos project in the Port of Rotterdam opens up the opportunity for industrial sites in the Botlek area, such as Shin-Etsu, to invest in CCS technology since the transport infrastructure for captured CO2 will be made available by the Port. Besides that and the capture installation, CCS would not require any major modifications to the existing production process.
During the whole PVC production process, steam is consumed in several steps. Shin-Etsu Botlek imports steam from Nouryon (previously AkzoNobel), Shin-Etsu Pernis from Shell, and Vynova Geleen is dependent on a steam boiler operated by EdeA. Technology which
generates steam from renewable energy sources such as renewable electricity, or biomass has the potential to reduce the indirect emissions arising from steam consumption. Both direct-fired bio-CHP or gasification bio-CHP plants are discussed in this report.
The petrochemical industry in Rotterdam produces ethylene by steam cracking naphtha which is an energy intensive process. The total indirect emissions released from the production of ethylene for Shin-Etsu add up to 390 kt CO2/yearb, which is more than three times the total direct emissions in 2017. Bio-ethylene produced from bio-based sources has the potential to avoid a large part of these emissions. However, this report did not address the absolute total avoided emissions of the entire chain, as it is highly dependent on factors such as the type of biomass used and methods of cultivation and transportation deployed. Bio-ethylene could be directly injected in the already existing ethylene pipeline infrastructure that connects the Port of Rotterdam with Belgium and Germany, which makes integration of bio-ethylene straightforward once the production technology is ready.
Decreasing waste streams by reusing and recycling products is gaining momentum in a wide range of sectors, including plastics. PVC can be recycled in different ways. Post-consumer PVC waste is often difficult to recycle mechanically due to contamination. Moreover, the mixed waste streams only contain marginal amounts of PVC. Therefore the focus lies on specific PVC products that are more easily recyclable. Examples are large volume
applications for rigid PVC, such as piping and window frames, which can be mechanically recycled to acceptable quality PVC material up to eight times (Shin-Etsu, personal communication). Pre-consumer waste such as cutting losses or other process losses are recycled by producers at high rates. The future of chemical recycling of PVC to VCM is highly uncertain (Shin-Etsu, personal communication). According to the industry it would be more attractive to look at chemical recycling of PVC to ethene or hydrogen chloride. Alternatively, syngas can be produced by pyrolysis or gasification of PVC waste.
b The specific consumption of ethylene by the production process was estimated at approximately 0.45 tonne
ethylene/tonne VCM. Assuming a yearly production capacity of 620 ktonne VCM this would lead to a yearly demand of 279 ktonne ethylene/year. Emission factor of ethylene = 1.4 tonne CO2/tonne ethylene.
FULL RESULTS
Introduction
This report describes the current situation of the Dutch PVC manufacturing production and the options and conditions for its decarbonisation. It is part of the MIDDEN project: the Manufacturing Industry Decarbonisation Data Exchange Network. MIDDEN aims to support industry, policy makers, analysts and the energy sector in their common efforts to achieve deep decarbonisation.
Scope
The aim of the MIDDEN project is to compile a database of material and energy uses of industrial processes at a plant level for the Dutch manufacturing industry. The scope of this research will focus specifically on the manufacturing of polyvinyl chloride in the Netherlands, starting from ethylene and chloride as feedstocks.
Production locations include:
• Shin-Etsu PVC B.V. in the Port of Rotterdam; Rotterdam, Zuid-Holland. • Vynova Group in Chemical Site Chemelot; Geleen, Limburg.
Processes include:
• Direct Chlorination • Oxychlorination • Thermal Cracking
• Suspension Polymerisation
• Several distillation and drying processes.
Products include:
• Vinyl chloride monomer (VCM) • High-purity 1,2-dichloroethane (EDC) • Polyvinyl chloride (PVC).
The main decarbonisation options are: • Hydrogen as fuel
• Electric furnaces
• Carbon Capture and Storage (CCS) • Bio-ethylene as feedstock
• Biomass to steam
• Mechanical and chemical recycling of PVC.
Reading guide
Section 1 gives a general introduction to the PVC manufacturing industry in the Netherlands and describes the employed methodology. In Section 2 we describe the current situation of PVC production processes in the Netherlands and in Section 3 we describe the relevant products to these processes. Options for decarbonisation are systematically quantified and evaluated in Section 4. The feasibility and requirements of those decarbonisation options are discussed in Section 5. Finally the Appendices give more background information used in the research.
1 PVC production in
the Netherlands
1.1 Introduction to the Dutch chemical industry
1.1.1 The importance of the Dutch chemical industry
In the past decades the Dutch chemical industry has evolved into one of Europe’s leading suppliers of chemical products and services. The geographical position of the Netherlands in Europe, the excellent available infrastructure such as the Rotterdam harbour – which is one of the largest in the world – and the abundance of well-educated citizens (32% of the Dutch 25–64 year-olds hold a university degree (OECD, 2014)) allowed the industry to grow to the scale it is nowadays (VNCI, 2018). In total the chemical industry provides employment to 44,000 people, distributed among more than 400 companies, and generates a total turnover of 50 billion euro (VNCI, 2018). The strong international position that the Netherlands holds is emphasised by the fact that 80% of the chemicals produced in the Netherlands are exported to countries all over the world (VNCI, 2018).
The industry is home to a wide variety of chemical sectors, such as the petrochemical, fertiliser, and chlor-alkali sectors. The petrochemical sector produces platform chemicals such as ethylene, propylene and BTX by steam cracking a range of feedstocks e.g. propane, naphtha or gasoil (VNCI, 2018). These compounds form the starting point for a wide variety of products, such as different types of polymers, rubbers, fibre raw materials, natural gas and other organic intermediate products. This is valuable to the Netherlands, but, on the other side of the coin, goes hand in hand with high greenhouse gas emissions. For example in 2018, the petrochemical industry emitted a total of ~10 Mtonnes of carbon dioxide (CO2) during the production of these chemicals. To put this into perspective, this is ~5 % of the total greenhouse gas emissions of the Netherlands.
1.1.2 Role of ethylene and chlorine in the Dutch PVC manufacturing
industry
One of the largest volume commodity chemicals produced by the petrochemical sector is ethylene. The total production in 2013 was estimated at 25 Mtonnes of ethylene in EU-28 countries alone. The Netherlands is the second-largest contributor in Europe, after Germany, with an overall production capacity of almost 4 Mtonnes of ethylene per year in 2013
(Boulamanti & Moya, 2017). The main use for ethylene is the production of different types of polymers. In 2018, approximately 60% was consumed for the production of low-, linear low and high-density polymers, such as HDPE, LLDPE and LDPEc (IHS Markit, 2019). Another 9% was used for the manufacturing of 1,2-dichloroethane (EDC) which is the precursor for the polymer polyvinyl chloride (PVC) (IHS Markit, 2019). Other ethylene uses include the
production of ethylene oxide, ethylbenzene, alpha-olefins and vinyl acetate (IHS Markit, 2019). These compounds have a wide range of applications.
Figure 1 Block scheme of the entire supply chain from crude feedstocks, such as natural gas and petroleum, to PVC products.
The PVC industry is not only dependent on the petrochemical industry for the supply of ethylene, but also on the the chlor-alkali industry to supply chlorine, which is another primary feedstock for the PVC production process (see Figure 1). EuroChlor (2016) reported that the Dutch chlor-alkali industry produces approximately 850 kt chlorine per year. In Europe about one third of chlorine is used for the production of PVC (EuroChlor, 2018). This shows just how interconnected the PVC industry and the petrochemical and chlor-alkali industry are.
1.2 Production locations of PVC in the Netherlands
In the Netherlands PVC is obtained at two production locations: Shin-Etsu PVC B.V. in Rotterdam and Vynova Beek in Geleen. The location of both producers is visualized in Figure 2. Their main activities and emissions in 2017 are presented in Table 1. It is important to note that Shin-Etsu PVC B.V. location Pernis and Vynova Beek have no ETS registered emissions. The production process of PVC only requires steam and electricity, and those are imported in the cases of these PVC producers, which is why the company has no direct emissions. All emissions reported by the Dutch Emission Authority (NEa) for Shin-Etsu PVC B.V. are related to location Botlek.Figure 2 Production locations of the two main PVC producers in the Netherlands. Table 1 Overview of PVC producers in the Netherlands.
Producer / ETS
registration
Location Main activity Nameplate
production capacity6) [kt/yr] Number of employees Direct CO2 emissions in 2017 registered at NEa [tonne/yr] Shin-Etsu PVC B.V., location Botlek Rotterdam Production of vinyl chloride monomer and high purity 1,2-dichloroethane VCM: 670 HP EDC: 80 1101) 93,6152) Shin-Etsu PVC B.V., location Pernis Rotterdam Production of polyvinyl chloride PVC: 520 751) 0
Vynova Beek Geleen Production of polyvinyl chloride PVC: 225 1003) 04) Chemelot BKG085) - - - - 83,3692) 1) (Port of Rotterdam, 2016).
2) The emissions as reported by (NEa, 2018). The emissions of Vynova Beek are reported under Chemelot BKG08, the value in the table is the total emissions from Chemelot BKG08 and thus not specifically for Vynova Beek.
3) (“Over Vynova Beek”, 2019).
4) It was estimated that Vynova Beek does not emit direct CO2 emissions, see Section 1.5 and
Appendix A.2 for more information.
5) Chemelot BKG08 includes a group of emissions points owned by several companies at Chemelot Industrial site. In the NEa EU ETS database these are grouped under the same registration. Together this group emitted around 83 kton CO2 in 2017.
6) In this report nameplate production capacity refers directly to the permitted production capacity, not necessarily the actual production capacity. Actual (realisable) capacity closer to 90% of nameplate capacity.
1.3 Shin-Etsu PVC B.V.
1.3.1 History of Shin-Etsu
Shin-Etsu PVC B.V. is a subsidiary of the Japanese giant Shin-Etsu Chemical Co., Ltd., which is the largest chemical company in Japan (Shin-Etsu Chemical Co., Ltd., 2018). In 1999 Shin-Etsu Chemical Co., Ltd. bought a VCM plant and a PVC plant in the Port of Rotterdam, both of which were operated as part of a Shell/AkzoNobel joint venture. This was part of the Japanese company’s strategy to increase their PVC production capacity in Europe and
strengthen their position in the European PVC market. Initially in 2000, the yearly nameplate production capacity was 500 kt VCM, 80 kt HP (High Purity) EDC and 400 kt PVC. Quickly Shin-Etsu expanded their permitted capacity at Botlek in 2003 to 620 kt VCM and at Pernis in 2006 to 450 kt PVC (Shin-Etsu Chemical Co., Ltd., 2005). The realisable production potential is assumed to be around 90% of the nameplate capacity.
Over the recent decades both production sites have experienced multiple revamps, as summarised in Appendix A.1. The most notable revamps at location Botlek are the addition of the third and fourth cracking furnaces in 1977 and 2003, the addition of the
oxychlorination reactor in 1997 and the replacement of the original two cracking furnaces, which dated from 1971, in 2004. Pernis expanded their PVC production capacity by adding two reactors in 1993 and 2006. Improvements to the polymerisation process in recent years increased the capacity at Pernis to its current size of 520 kt of PVC.
1.3.2 Existing infrastructure in the Port of Rotterdam
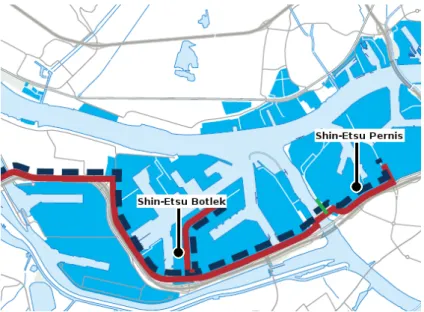
As already mentioned, Shin-Etsu has two production sites: Botlek and Pernis. Vinyl chloride monomer (VCM), which is the building block for PVC (see Section 2.3), is produced at Botlek, and PVC is produced at Pernis. VCM is transported by a pipeline connection, called the Multicore pipeline system (Port of Rotterdam, 2016) from Botlek to Pernis. Figure 3 shows the location of production site Botlek and Pernis relative to each other and the pipeline connecting the two sites. The distance between the two production locations is approximately 9 km (Shin-Etsu, personal communication).
As will be shown later in Section 2.2, chlorine is one of the feedstocks for the oxychlorination process, which produces VCM. For the last few decades Shin-Etsu has been a key part of an integrated chlorine chain with several other companies: AkzoNobel MEB (Membraan
Electrolyse Bedrijf), Hexion and Huntsman (Shin-Etsu PVC B.V., 2018c). This collaboration reduces chlorine losses to the environment and realises circular and thus effective use of feedstock resources. AkzoNobel produces chlorine and caustic from salt, which are then transported to Shin-Etsu and used as feedstock for oxychlorination and caustic washing, respectively. Hexion and Huntsman produce hydrogen chloride as a by-product during the production of epoxy resins and polyurethanes, respectively, which are also used for oxychlorination.
Figure 3 Location of Shin-Etsu Botlek and Shin-Etsu Pernis relative to each other. The red line represents the Multicore pipeline system (Port of Rotterdam, 2016).
Figure 4 Overview of the integrated chlorine chain at industrial site Botlek (Shin-Etsu PVC B.V., 2018c). AkzoNobel is now Nouryon.
1.4 Vynova Beek
1.4.1 History of Vynova
Vynova Beek is located at Chemelot Industrial park, which is another large industrial cluster in the south of the Netherlands, and part of the larger chlor-vinyls platform Vynova Group (“About Vynova”, 2019). Although Vynova was founded only recently in 2015, the PVC production site at Chemelot has existed for multiple decades. In 1972 the Belgian company Tessenderlo Group, in collaboration with DSM, produced the first batch of PVC in Beek (“Over Vynova Beek”, 2019). In 2011 INEOS ChlorVinyls bought all PVC related activities including the PVC production facilities from Tessenderlo Group (“Over Vynova Beek”, 2019). Finally, in 2015 the International Chemical Investors Group (ICIG) became owner of the site and founded Vynova Beek in Chemelot (“Over Vynova Beek”, 2019). The production capacity of Vynova Beek was estimated based on 2013 data from Boulamanti & Moya (2017) to be approximately 225 kt PVC/yeard.
d Information on the production capacity of Vynova Beek was not found in public sources. Boulamanti & Moya
(2017) reported that the Netherlands had a total PVC production capacity of 675 kton in 2013, divided over two production sites. It is assumed that these two sites are Shin-Etsu Pernis and Vynova Beek, as this is not clear from the report. From Appendix A.1 it is known that the production capacity of Shin-Etsu Pernis in 2013
1.5 CO
2emissions
1.5.1 Scope of this report
In order to effectively allocate CO2 emissions in any process or system it is important to define direct and indirect emissions. The widely used GHG Protocol published by the World Resource Institute (WRI) formulates direct GHG emissions as ”emissions from sources that are owned and controlled by the company” (WRI, 2015; p.25). In other words, any
emissions that are generated by on-site activities are attributed to direct emissions, which is also often referred to as scope 1 emissions.
Figure 5 Overview of the definition of scope 1, 2 and 3 emissions in this report.
Indirect emissions are according to the WRI ”emissions that are a consequence of the activities of the company but occur at sources owned or controlled by another company” (WRI, 2015; p.25). These are further categorized in two scopes: scope 2 and scope 3 (WRI, 2015). Scope 2 indirect emissions are emissions resulting from consumption of purchased steam or electricity. Scope 3 includes all other indirect emissions that are not covered in scope 2, such as transport-related activities, waste disposal or feedstock production. This is visualised in Figure 5 from the perspective of the PVC manufacturing industry.
Within the context of this study scope 1 and scope 2 emissions will be included. From scope 3, only the emissions emitted by other companies for the production of the feedstock will be included.
1.5.2 Shin-Etsu PVC B.V.
In the NEa EU ETS database only emissions from Shin-Etsu Botlek are reported. The scope 1 direct emissions of Shin-Etsu Botlek are displayed in Figure 6. The CO2 emissions of the VCM plant have been fluctuating over time, which could be due to fluctuating yearly production rates. Between 2010—2017 the average yearly emissions were 99 kt CO2/year. This is more than 10% higher compared to the period 2005–2009 when the average yearly emissions were 83 kt CO2/year. This could be explained by the fact that Shin-Etsu might have
increased their yearly production rate and thus their emissions. However, this cannot be stated with any certainty as the yearly production rates are unknown. In 2017 the whole production plant was down for a period of time for a planned turn-around (Shin-Etsu PVC B.V., 2018d), which could explain the relative decrease of yearly emissions in 2017 compared to 2016.
As already mentioned in the beginning of this subsection, Shin-Etsu Pernis is not registered in the NEa EU ETS database. As shown later in Section 2.3, the energy consumption of Shin-Etsu Pernis is strictly limited to steam and electricity. Both of these are purchased from a third party (Shin-Etsu, personal communication), meaning that the scope 1 direct emissions are little to none.
Figure 6 Direct carbon dioxide emissions in kt/yr emitted by Shin-Etsu Botlek from 2005-2017. Unfortunately, data from 2008 is unknown. Data for 2005—2007 from NEa (2014); for 2013—2017 from NEa (2018); for 2009—2012 from Shin-Etsu PVC B.V. (2013), p.12.
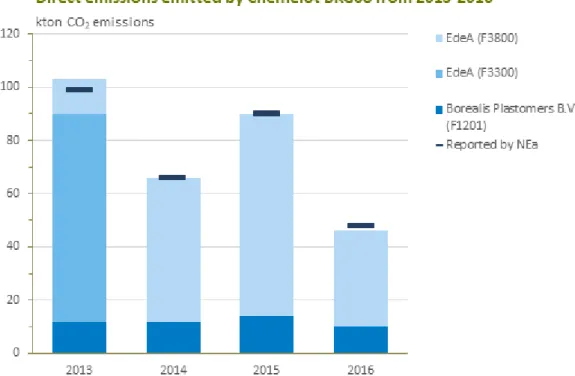
Figure 7 Direct carbon dioxide emissions in kt/year emitted by Chemelot BKG08 from 2013—2016 (NEa, 2018; calculations from Appendix A.2).
1.5.3 Vynova Beek
In the NEa EU ETS database the emissions of Chemelot Industrial Site are not reported per company, but per industrial area 1 to 14 which are referred to as BKGs. According to personal communication with NEa, emissions of Vynova Beek are reported under the name Chemelot BKG08 in the NEa EU ETS database. It is known that Vynova Beek, one steam boiler from EdeA and a furnace from Borealis Plastomers B.V. are included in Chemelot BKG08. However, from the NEa registration alone it is not possible to attribute the emissions among these companies as the NEa reports overall emissions of the BKG. Therefore, the direct emissions of the individual emission sources on BKG08 were calculated using emission registrations from Chemelot themselves, see Appendix A.2. From the calculations it was found that the direct emissions from EdeA (F3300/F3800) and Borealis Plastomers B.V. (F1201) match the yearly emissions as registered under Chemelot BKG08. This leads to the conclusion that the PVC production line of Vynova Beek, similar to Shin-Etsu Pernis, has no direct emissions.
The results are presented in Figure 7. From this graph it can be seen that Vynova Beek, similar to Shin-Etsu Pernis, has no direct emissions as all direct emissions from Chemelot BKG08 can be assigned to EdeA and Borealis Plastomers B.V.. In 2013, EdeA replaced their F3300 steam boiler with a new steam boiler (F3800). This is the reason that after 2014 no emissions from the old F3300 were reported.
1.5.4 Energy efficiency of Shin-Etsu PVC B.V.
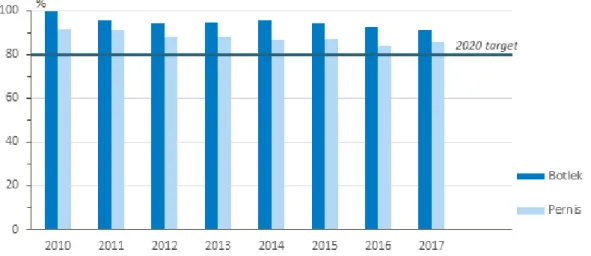
The development of energy efficiency of both Shin-Etsu Botlek and Pernis relative to 2006 for the period 2010 to 2017 is displayed below. The target of Shin-Etsu for 2020 is to achieve an Energy Efficiency Index (EEI) of 80% relative to 2006. The EEI of Botlek shows overall a decreasing trend between 2010 and 2017. However, between 2012 and 2014 the EEI
increased. There was no explanation found for this. In 2017 the EEI increased relative to 2016 due to a temporary factory shutdown (Shin-Etsu, 2018d). The EEI of Pernis has not improved over the past few years. According to Shin-Etsu, the EEI in 2015 increased significantly due to lower PVC production due to external circumstances (Shin-Etsu, 2018d). The temporary factory shutdown in 2017 also caused the EEI of Pernis to increase in that year (Shin-Etsu, 2018d). Unfortunately, no statistics about the energy efficiency of Vynova Beek were found.
Figure 8 Overview of the Energy Efficiency Index (EEI) of Shin-Etsu Botlek and Pernis from 2010 to 2017 with respect to 2006. The lower the EEI, the more energy efficient the plant is relative to 2006. Data is collected from Shin-Etsu PVC B.V. (2015; 2016; 2018d).
2 PVC production
processes
2.1 Overview
PVC is produced by polymerisation of the chemical vinyl chloride monomer (VCM). This chemical is obtained by thermal cracking (pyrolysis) of 1,2-ethylenedichloride (EDC). In the Netherlands EDC is produced by a combination of (i) direct chlorination and (ii)
oxychlorination of ethylene. In general, the total PVC process can be divided in two main parts, each consisting of several subprocesses as indicated in Table 2. These subprocesses are selected based on descriptions of the PVC production process in literature (Dimian & Bildea, 2008; EEA, 2006; Falcke et al., 2017). This chapter will describe the total production process using the grouping in Table 2.
Table 2 Primary energy demand of the PVC production process from ethylene via VCM to PVC at Shin-Etsu and Vynova Beek. The assumed production capacities are 620 kt VCM/yr and 470 kt PVC/yr for Shin-Etsu. The assumed production capacity for Vynova Beek is 225 kt PVC/yr, as estimated in Section 1.4.
Production step Primary energy demand [GJ/tonne product]
Shin-Etsu EDC production 1.91) EDC purification 0.71) EDC cracking 3.41) VCM purification 0.91) PVC production 4.12) Vynova Beek PVC production 4.03)
1) Calculated from the EFA (Appendix A.4)
2) Provided by Shin-Etsu. Only the aggregate number is known.
3) As no information was known about Vynova Beek, the energy demand was assumed to be the
same as reported in the most recent BAT document (EU, 2007).
2.2 VCM production
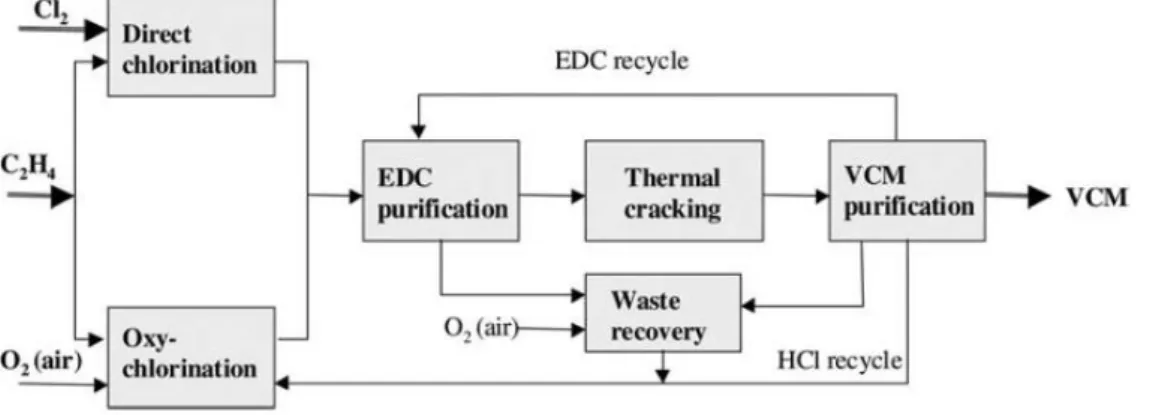
A general overview of the VCM production process is shown in figure 9. The main inputs for VCM are chlorine, ethylene and oxygen. There are several recycling streams, namely the uncracked EDC to the EDC purification step and the produced hydrogen chloride (HCl).
2.2.1 EDC production
In total, there can be four sources of EDC for the VCM production process. Direct chlorination and oxychlorination are two separate processes that are performed in tandem to produce EDC. Thirdly, EDC is recycled back from the VCM purification to EDC purification. Fourthly, an option would be to feed external EDC in case this is necessary, but this practice has not been observed in the Dutch PVC manufacturing industry.
Direct chlorination
The first step in the production of VCM is the formation of 1,2-ethylenedichloride (EDC). During direct chlorination, ethylene and chlorine react to form EDC. Both low-temperature chlorination (LTC) and high-temperature chlorination (HTC) can be performed (Falcke et al, 2017).
LTC is performed in a gas-liquid contact column at operating temperatures between 50-70°C. This process has the advantage of achieving high ethylene selectivity up to 99%, but
requires extra processing costs due to catalyst removal (Dimian & Bildea, 2008). The chemical reaction of LTC is the following equation:
C2H4 (g) + Cl2(g) FeCl3
↔ C2H4Cl2(l) (eq. 2.1)
The overall chemical reaction is exothermic with a heat of reaction of approximately -218 kJ/mol (Dimian & Bildea, 2008). The temperature in the reactor has to remain constant since higher temperatures promote the formation of by-products. Therefore, an indirect cooling system has to be used, which can either be positioned inside or outside the reactor. Since the reaction temperatures are relatively low, the transfer of heat is highly inefficient due to the low temperature difference.
In HTC, a chemical reactor is operating at a temperature between 90-150°C and a pressure between 1.5-5 bar (Dimian & Bildea, 2008). HTC has the advantage that the heat of
reaction, which is sevenfold higher compared to the heat of evaporation of EDC, can be used for EDC purification later in the process. However, HTC suffers from lower selectivity. It is known that Shin-Etsu applies LTC (Shin-Etsu PVC B.V., 2004).
Figure 9 Block scheme of the VCM production process (Dimian & Bildea, 2008). In most cases ferric chloride, FeCl3, acts as a catalyst. In order to ensure complete ethylene conversion, an excess of chlorine is used. It is preferred to reduce formation of chlorinated by-products, such as 1,1,2-trichlorethane, by adding oxygen as an inhibitor. If the chlorine is produced by means of electrolysis, small amounts of oxygen are usually already present.
Akzo-Nobel produces chlorine during salt production and offers it as input for Shin-Etsu Botlek (Shin-Etsu PVC B.V. 2018c).
Oxychlorination
In oxychlorination, ethylene, hydrogen chloride and oxygen react to produce EDC and water. The reaction can be carried out in either a fluid-bed reactor or a fixed-bed reactor. Fluid-bed reactors generally operate at a temperature between 220-235°C and a pressure between 250-600 kPa (EEA, 2006). The operating temperature of fixed-bed reactors is between 230-300°C, with an operating pressure between 250-1500 kPa (EEA, 2006). Fluid-bed reactors are generally preferred due to more intensive heat transfer, reduced occurrence of hot spots and more efficient catalyst regeneration (Dimian & Bildea, 2008). Indeed, Shin-Etsu Botlek operates a total of three fluid-bed reactors (Shin-Etsu PVC B.V., 2012). The chemical reaction of oxychlorination follows the following equation:
C2H4(g) + 2HCl(g) + 1 2O2(g)
CuCl2
↔ C2H4Cl2(g) + H2O(g) (eq. 2.2)
Oxychlorination is - similarly to direct chlorination - a highly exothermic reaction with a heat of reaction of approximately -238 kJ/mol (Dimian & Bildea, 2008). Due to the higher reaction temperature in the reactor it is possible to produce steam as a side product using external heat exchangers. This is generally used during the distillation steps in EDC purification.
Copper(III)chloride, CuCl2, impregnated on alumina is widely used as catalyst, also at Shin-Etsu Botlek. During oxychlorination a wide spectrum of impurities can be formed, such as 1,1,2-trichlorethane and chloral. It is important to remove these impurities, since some impurities formed in one reactor might promote the formation of impurities in other reactors (Dimian & Bildea, 2008). E.g. chloral has the tendency to polymerize, which is why it is washed out immediately after oxychlorination.
Oxychlorination acts as a sink for hydrogen chloride, produced in large amounts during thermal cracking, which realizes the balanced process (PlasticsEurope, 2015). Hydrogen chloride from external sources, such as the production of chloroform, can be used as well if it is of suitable purity (PlasticsEurope, 2015). In the case of Shin-Etsu, hydrogen chloride is imported from Hexion and Huntsman. The oxygen source for the chemical reaction can be both ambient air or a pure oxygen stream. Air fed systems have the disadvantage of increased formation of chlorinated by-products and larger waste streams (PlasticsEurope, 2015). Although oxygen fed systems do not suffer from this, they require a larger excess of ethylene in the feed stream and additional energy for the production of oxygen
(PlasticsEurope, 2015). At Shin-Etsu Botlek, two of the newly replaced reactors are air fed systems (operating temperatures: 210-240°C), while the third is an oxygen fed system.
2.2.2 EDC purification
EDC produced by direct chlorination, oxychlorination or any unreacted EDC from VCM production requires additional treatments in order to obtain the required purity for thermal cracking. The purity of the feed for the cracker has to be at least 99.5 wt% in order to reduce coke formation and fouling of the pyrolysis reactor (PlasticsEurope, 2015).
Since the operating temperature of LTC (50-70°C) is below the boiling point of EDC (which is 84°C), EDC leaves the direct chlorination reactor as a liquid. The FeCl3 catalyst is still diluted in the outflow stream and has to be removed first. By washing EDC with water the catalyst is separated and recycled back to the reactor.
Because of the high operating temperatures of oxychlorination, EDC leaves this process as a gas mixture with water. Generally, the gas mixture is quenched with water vapor and condensed at successively decreasing temperatures (PlasticsEurope, 2015). Finally, water and EDC will naturally separate from one another by decantation, due to a difference in solubility (EEA, 2006).
The two EDC streams are combined and be fed to an EDC dryer. This is generally a cyclone dryer which will remove a large part of the water. Next the EDC is supplied to the light ends azeotropic distillation column, which will remove water and chlorinated organic by-products with a boiling point lower than EDC (Falcke et al., 2017). Afterwards, the stream is fed to a high ends distillation column, which removes by-products and tars with a boiling point higher than EDC (Falcke et al., 2017). The light ends and heavy ends waste are fed to a chlorine-recycling plant, where the chlorine contained in the compounds can be recovered by oxidation to hydrogen chloride (Falcke et al., 2017). This can in turn be reused in the oxychlorination process.
2.2.3 EDC cracking
In a large cabin-type furnace, EDC is decomposed at high temperatures into VCM and hydrogen chloride (see equation 2.3). The process operates typically at temperatures between 425-550°C and pressures between 1-4 MPa, with mean residence times of 10-20 seconds (Falcke et al., 2017). The reported conversion rate is 50-65% per pass
(PlasticsEurope, 2015; Falcke et al., 2017), which means that not all EDC will be reacted in one cycle.
C2H4Cl2(g) → C2H3Cl(g) + HCl(g) (eq. 2.3)
The process gas stream containing VCM, hydrogen chloride, EDC and by-products, is
immediately quenched in order to reduce the formation of tar and heavy by-products (Falcke et al., 2017). This can be done directly with downstream liquid EDC or indirectly using heat exchangers.
The cracking process is an endothermic reaction with a heat of reaction of +71 kJ/mol (Dimian & Bildea, 2008) and thus requires energy to continue the process reaction. This energy is typically provided by burning natural gas. Also, it is expected that natural gas is burned in gas burners to reach the higher operating temperature of approximately 500°C. This would mean that this step is the main source of CO2 emissions in the production process.
2.2.4 VCM purification
The final step involves separation of hydrogen chloride, EDC and other by-products from the VCM stream by two-stage distillation. The first distillation column separates hydrogen chloride, together with low-boiling side products, which is then recycled back to the
oxychlorination process (Falcke et al., 2017). A hydrogenation step is optional to remove any traces of acetylene in hydrogen chloride. VCM is separated in a second distillation column, neutralized with NaOH to remove any traces of hydrogen chloride, and transferred in liquid form to VCM storage (Falcke et al., 2017). Any leftover EDC is recycled back to the cracking furnace after purification.
2.2.5 Overall VCM production process
When combining the three reaction equations for direct chlorination, oxychlorination and thermal cracking, it becomes clear that the overall balanced equation is highly exothermic. Several sources state that a VCM plant should be able to cover a large part of its energy needs by cleverly upgrading and reusing the energy from heat (Falcke et al., 2017; PlasticsEurope, 2015). It is known that Shin-Etsu is already doing this by installing heat exchangers in their direct chlorination units and their oxychlorination units. The internal heat flows are not known.
2.2.6 Mass and energy flows
In order to gain an understanding of the mass and energy flows in the production process, a mass flow analysis (MFA) and energy flow analysis (EFA) were performed. For the details, see Appendix A.3 and A.4. The results from the MFA are compared to Falcke et al. (2017), Wilkes et al. (2005) and ThyssenKrupp (2012) in Table 3. It can be seen that the results from the MFA are very close to the data that is presented in the literature.
Table 3 Raw material consumption for the VCM production process.
Raw materials Specific consumption
Ethylene [t/t VCM] 0.47 0.46-0.47 0.46 0.45
Chlorine [t/t VCM] 0.59 0.59 0.58 0.57
Air [t/t VCM] 0.73 0.73 - -
Oxygen [t/t VCM] - - 0.14 0.13
Reference Wilkes et al., 2005 Falcke et al., 2017 ThyssenKrupp, 2012 MFA (Appendix A.3)
The result of the EFA (A.4) are presented in Table 4. Unfortunately, literature reported no specific breakdown of the specific energy usage of the VCM process.
Table 4 Energy consumption per process step for the VCM production process.
EDC production EDC purification EDC cracking VCM purification Total
Final energy demand [GJ/t VCM]
0.69 0.64 2.83 0.85 5.01
Overview of the main process reactions
Direct chlorination ∆𝐻𝑜= -218 kJ/mol C2H4 (g) + Cl2(g) FeCl3 ↔ C2H4Cl2(l) Thermal cracking ∆𝐻𝑜 = +71 kJ/mol C2H4Cl2(g) → C2H3Cl(g) + HCl(g) Oxychlorination ∆𝐻𝑜 = -238 kJ/mol C2H4(g) + 2HCl(g) + 1 2O2(g) CuCl2 ↔ C2H4Cl2(g) + H2O(g) Overall reaction ∆𝐻𝑜 = -192.5 kJ/mol C2H4+ 1 2Cl2+ 1 4O2 → C2H3Cl + 1 2H2O
It can be found from the results in Table 4 that the EDC cracking process is the most energy intensive part of the process. This should not come as a surprise as the compounds have to be heated and pressurized heavily prior to cracking. Furthermore, the cracking process itself is endothermic, meaning that a constant flow of heat has to be added to the cracking furnace. The total calculated specific energy demand was calculated to be 5.01 GJ/t VCM.
The required energy consumed during the VCM production process is compared with values from literature in Table 5. Energy is provided in the form of steam, natural gas or electricity. For comparability, we report the numbers in both primary and final form, with conversion factors for 2019 (RVO, 2019). Cooling water is not included as it extracts energy from the system. Ideally, the total the sum of the utilities should add up to fit the total energy demand of the VCM plant (as summarized in Table 4).
Table 5 Comparison of the required energy carriers, steam, natural gas and electricity, for the VCM production process from different sources. The relative difference between the numbers from the EFA and the data communicated by Shin-Etsu (2019) are displayed in the final column.
Energy carrier Final energy
Steam [GJ/t VCM] 0.3-1.7 2.2 1.4-1.8 2.1 Natural gas [GJ/t VCM] 3.4-4.2 3.1 3.0-3.1 2.2 Electricity [GJ/t VCM] 0.4-0.81) 0.8 0.68-0.72 0.7
Energy carrier Primary energy2) Comparison EFA
Steam [GJp/t VCM] 0.3-1.8 2.4 1.5-2.0 2.3
Natural gas [GJp/t VCM] 3.4-4.2 3.1 3.0-3.1 2.2
Electricity [GJp/t VCM] 1.0-2.0 2.0 1.7-1.8 1.8
Total primary energy required for utilities (GJp/t VCM)
4.7-8.0 7.5 6.2-6.9 6.3
Reference Falcke et al., 2017 Shin-Etsu PVC B.V., 2007 Shin-Etsu, personal communication (2019)
EFA (Appendix A.4)
1) Falcke et al. (2017) reports an electricity demand of 0.11-0.21 MWh/t VCM. This range was
converted to GJ/t VCM using a conversion factor of 1 MWh = 3.6 GJ.
2) Conversion factors to primary energy are: 1 GJ steam = 1.11 GJp; 1 GJ natural gas = 1 GJp; 1
GJ electricity = 2.5 GJp (RVO, 2019)
The natural gas demand as calculated with the EFA is lower than reported in the literature. On the other hand, the steam demand is higher than in literature. The offset in steam and natural gas demand could be explained by the fact that the assumptions made in the model related to steam and natural gas use are incorrect. It could for example be that in certain parts where steam use is assumed in the model, in the actual plant natural gas is required and/or steam is produced on site using natural gas. Falcke et al. (2017) based their data on a questionnaire which was conducted with VCM producers in Europe, which could explain why the numbers show such a wide range. The total primary energy consumption from the EFA lies within the range as reported by Falcke et al. (2017). Figure 10 visually summarize the main findings from the EFA.
Figure 10 Overview of the final energy consumption of the VCM production process as calculated in the EFA in this report, see Appendix A.4.
2.3 PVC production
A general overview of the PVC production process is shown in Figure 11. The production process is rather linear and only requires VCM and water as the main raw input.
Furthermore, it will be shown in this chapter that the process generally does not require natural gas for the heat demand. Steam and electricity are therefore the only sources of energy that are required in this part of the process. Assuming that the steam and electricity are imported, this part of the process emits little or no amounts of greenhouse gases on site. In fact, the PVC production plant of Shin-Etsu is not registered in the NEa emission database. The PVC production process will be described according to the structure presented in Table 2.
Figure 11 Block scheme of the PVC production process
2.3.1 PVC polymerization
Three different processes for the manufacturing of PVC can be distinguished (EU, 2007: Wilkes et al., 2005):
• Suspension polymerization (S-PVC) • Emulsion polymerization (E-PVC) • Mass (or bulk) polymerization (M-PVC).
Suspension polymerization is the most widely used polymerization technique since it performs economically and environmentally better than the other techniques, due to good
temperature and viscosity control and relatively simple PVC purification (Wilkes et al., 2005). The produced grain is on average 100-180 µm in diameter, and this method is suited for large volume production applications (EU, 2007). Mass polymerization has lost importance since it cannot be operated in closed-polymerization reactors and because the PVC
purification is energy intensive for several technical reasons, which will not be explained here (Wilkes et al., 2005). Emulsion polymerization is the second most used polymerization technique and it produces PVC grains which are one hundred times smaller (0.1-3.0 µm) than suspension PVC grain (EU, 2007). The small particles size makes the resins particularly useful for small specialized applications, such as wall coverings (EU, 2007).
VCM polymerizes via the free radical method and in the liquid state to form PVC (Wilkes et al., 2005). The overall reaction can be simplified to equation 2.4, where n stands for the number of VCM molecules forming the polymer. The length of the polymer can vary between 750-1500 monomer units depending on the operating temperature. The polymerization reaction is exothermic with a heat of reaction of -1540 kJ/mol, and typically operates at a temperature between 35-70°C and a pressure between 4-12 bar (EU, 2007). The overall conversion of VCM is limited to 85-95% (EU, 2007).
𝑛 CH2= CHCl → (−CH2CHCl −)𝑛 +heat (eq. 2.4)
At the start of the reaction, water, VCM and additional compounds such as dispersants and initiators are loaded in the reactor (Wilkes et al., 2005). Unlike most polymers that are soluble in their respective liquid monomer, PVC is highly insoluble in VCM (Wilkes et al., 2005). This characteristic allows industry to produce PVC as porous granules. During polymerization the PVC precipitates as tiny particles, which agglomerate to form a porous internal structure in the resin particles (Wilkes et al., 2005). The polymerization reaction is started by the initiator, after which the length of the polymerization chain is controlled using the polymerization temperature. After the desired conversion has been reached, a stopping agent can be used to terminate the reaction. The reactor is depressurised by venting off unreacted VCM which is recycled back to the reactor for polymerization. The contents of the reactor are removed and the resulting sludge is transported to a blowdown vessel where part of the remaining unreacted VCM is vented off and recycled back to the polymerization
reactor. The product stream consists of an aqueous slurry, containing PVC and a small amount of unreacted VCM (2-3%).
2.3.2 VCM recovery
It is common practice to remove any leftover VCM from the PVC down to concentrations well below 1 ppm (Wilkes et al., 2005). This is generally done by means of a steam stripping column. The slurry is blown down into a stripping column from the top recovered down to atmospheric pressure.
Next, steam of approximately 100°C (between 100-120°C) is fed from the bottom of the column, which will evaporate VCM and part of the water from the slurry. The stripped slurry leaves the column from the bottom while the recovered VCM/water gas mixture is captured at the top. The VCM is recovered and recycled back to the polymerization reactor. The PVC slurry, still containing 50-60% water, is processed further in the next part of the process.
2.3.3 PVC drying
The final processing step is the removal of the large fraction of water which is still present in the PVC slurry. This is generally done by a mechanical drying step and a thermal drying step (Wilkes, 2005; ThyssenKrupp, 2012).
After stripping, the slurry enters a centrifuge, which will separate a large fraction of the water from the slurry mechanically and produces a wet-cake with 20-30% moisture content (Allsopp & Vianello, 2002; EU, 2007). The water extracted after centrifuging is transported to a water treatment plant and reused partly. Next, several techniques can be used to further dry the produced PVC. Shin-Etsu implements two drying techniques (Shin-Etsu PVC B.V., 2018a): Fluidized bed drying and flash drying.
Fluidized bed drying is widely used in the chemical industry to reduce the moisture content of powders and granules. Hot air at a temperature of up to 95°C is injected at high pressure through a bed of moist PVC particles (Chan et al., 2008). Due to the hot air, the particles are lifted and suspended in a stream of air. Liquid is vaporized as a result of the heat transfer between the wet solids and the hot air and removed (Law & Mujumdar, 2007).
Flash drying is a technique, similar to fluidized bed drying, where hot air is used to treat powders and granules. The wet particles are fed into a hot gas stream and transported down the drying tube. As the name implies, the thermal contact between the gas stream and the particles is usually short. This means that this technique is most useful for removing surface moisture from particles (Borde & Levy, 2007). Both drying techniques are followed by sieving to remove any coarse particles (EU, 2007). Finally the PVC material is bagged and /or
transported.
2.3.4 Mass and energy flows
The inputs for the PVC production process were based on data provided by Shin-Etsu. It is compared in Table 6 with ThyssenKrupp (2012) and EU (2007).
Table 6 Raw material consumption for the PVC production process.
Raw materials Specific consumption
VCM [t/t PVC] 1.0011) 1.0011) 1.0002)
Water [t/t PVC] 2.3 3.1 1.52)
Reference ThyssenKrupp, 2012 EU, 20073) Shin-Etsu, personal communication (2019)
1) Both ThyssenKrupp (2012) and EU (2007) report overall VCM losses to waste water of 10kg
VCM/t PVC
2) Both numbers were obtained after personal communication with Shin-Etsu (2019). According
to Shin-Etsu VCM losses are negligible (<0.1%) and the water consumption is half of what is reported in EU (2007).
3) EU (2007) base their numbers on data from 2003, which should be taken into consideration
when comparing the data.
Similarly to Section 2.2, the energy of the PVC production process, as reported by different sources, are compared. As the approximate steam and electricity demand of Shin-Etsu Pernis are known from recent personal communication by the company itself, that data is
Table 7 Comparison of the required energy for the PVC production processes from different sources.
Energy carrier Final Energy
Steam [GJ/t PVC] 2.41) 3.2 2.1
Electricity [GJ/t PVC] 0.52) 0.6 0.7
Energy carrier Primary Energy
Steam [GJp/t PVC] 2.7 3.6 2.33)
Electricity [GJp/t PVC] 1.3 1.4 1.74) Total primary energy
required for utilities [GJp/t VCM]5) 4.0 5.0 4.1 Reference EU, 2007 DCMR, 2004
Shin-Etsu, personal communication (2019)
1) EU (2007) reports a steam demand of 879 kg/t PVC. Using an energy density for saturated
steam (1 bar, 100ᵒC) of 2675 kJ/kg (Engineering Toolbox, 2003) results in 2.4 GJ/t PVC.
2) EU (2007) reports an electricity demand of 0.14 MWh/t VCM. This was converted to GJ/t VCM
using a conversion factor of 1 MWh=3.6 GJ.
3) Shin-Etsu shared that Pernis consumes 1.1 PJ steam/year. Considering a production capacity of
470 kton PVC/yr results in a specific steam consumption of 2.34 GJ/t PVC.
4) Shin-Etsu shared that Pernis consumes 0.8 PJ electricity/year. Considering a production
capacity of 470 kton PVC/yr results in a specific electricity consumption of 1.7 GJ/t PVC.
5) Conversion factors to primary energy are: 1 GJ steam = 1.11 GJp; 1 GJ natural gas = 1 GJp; 1
GJ electricity = 2.5 GJp (RVO, 2019).
3 PVC products and
application
Plastic material is widely appreciated due to its unique combination of light-weight, durable and other intrinsic properties. The worldwide production of plastics reached 348 million tons in 2017 of which 64.4 million tons (18.5%) originated from Europe (PlasticsEurope, 2018a). To put this in perspective, in 2002 the worldwide production of plastics was 200 million tons, which shows that in the past 16 years the global supply increased by 74% (PlasticsEurope, 2008). This chapter will present the facts about the applications, market value, and recycling rates of PVC in Europe and the Netherlands.
3.1 PVC in the Netherlands
First of all, it is important to note that it remains difficult to gain quantitative insight in the separate plastic streams in the Netherlands for a couple of reasons (CPB, 2017). Firstly, the amount of plastic in products which are partly consisting of plastic material is not tracked. Secondly, the amount of plastic material which is currently littered in the environment is unknown. And thirdly, the definitions of plastic material and its respective subtypes differ between organizations. A lack of this overview makes it difficult for the government to set waste-and recycling goals and, more importantly, verify if new regulations are sufficient of not (CPB, 2017). In terms of recycling, it is important to note that PVC resin is more often than not used in combination with other materials. Composite products which combine PVC with all types of plastics and other materials, such as metal, require extra treatment before recycling, as will be discussed later.
3.1.1 Grades of PVC resin
There are several grades of PVC resins that can be produced by PVC manufacturers, which is specified by the K-value (Allsopp & Vianello, 2002; Schellerer et al., 2016). Manufacturers are able to control the K-value by changing the polymerisation temperature during production. The K-value of the resin determines its flexibility and therefore the application area of the PVC (see Table 8).
Table 8 Different PVC K-values and the representative applications (Allsopp & Vianello, 2002)
K-Value Application
55-60 Formulations for injection moulding of pipe and conduit fittings, blow moulding of bottles.
66-68 Rigid formulations, such as pipes, conduit, sheet
65-71 Flexible formulations, such as flexible sheet, flooring, tubing
Shin-Etsu currently produces PVC using suspension polymerisation with 4 different K-values, as can be seen in Table 9. Vynova Beek has a larger PVC grade portfolio, offering a total of 11 grades with 6 different K-values (Vynova Group, 2019b).
Table 9 Overview of the four types of PVC resin that Shin-Etsu produces (Shin-Etsu PVC B.V., 2018b). The first number of the code indicates the value. E.g. the K-value of S58-02 is 58.
Shin-Etsu PVC grade
Application
S58-02 Injection moulding of rigid articles, such as pipe fittings. Production of foamed products.
S60-12 Production of thin profiles, foamed boards, film/sheet and boards. S67-04 Production of window profiles and both pressure or non-pressure
pipes.
S70-16 Production of transparent and non-transparent film/sheet, and extrusion of cables.
3.1.2 Production of PVC
The overall plastics production in the Netherlands is known and has been following the global trend and increased therefore slightly in the past years (Euromap, 2016). According to Euromap, in 2018 the total plastics production was about 4 Mton. The plastics consumption per capita has been increasing slightly as well and reached about 87 kg per capita in 2017. As mentioned at the beginning of Section 3.1 there is no specific data available about the volumes per plastic types. However, according to PlasticsEurope (2018a), approximately 10% of the plastic demand in Europe was reserved for PVC. CPB (2017) reports a market share in the Netherlands of 11-12%, however this number is again based on European market statistics.
In order to make an estimate of the total volumetric PVC production demand in the Netherlands it is possible to assume 10% of 4 Mton, which is approximately 0.4 Mton.
Comparing this with the total production capacity of Shin-Etsu and Vynova, which sums up to 0.75 Mton, shows that this is a correct estimation. Export of PVC to other countries could explain why the actual production capacity is higher than the demand for PVC in the Netherlands. According to Shin-Etsu their main market is Europe, of which Germany and Italy are the largest importers of PVC (Shin-Etsu, personal communication).
3.1.3 Application of PVC
Again, the applications for PVC in the Netherlands specifically are not reported. However, data for Europe can be used to give some insight in this matter. In Europe, PVC is used mostly used in construction applications, such as window frames and profiles, pipes and fittings, cables and flooring (PlasticsEurope, 2018a). PVC is strong, lightweight, easy to install, resistant to weathering, cost-effective and therefore widely applied (PVC.org, 2018). Furthermore there are more niche applications such as garden hoses and inflatable pools. It can be assumed that these applications will be similar in the Netherlands. Figure 11 shows the distribution of PVC for its different applications.
Figure 12 PVC is widely used in a variety of applications. Source: VinylPlus, 2011
3.1.4 Market price
The market price in the Netherlands for PVC has been fluctuating in 2018. As seen from Figure 12, the price for virgin PVC was 970 euro/ton PVC at the beginning of the year and has since then fluctuated to end up at a current price of 950 euro/ton PVC (K&R, 2018). The price of PVC is only partly influenced by the price of oil, because firstly PVC can also be produced using other feedstocks and secondly because the price of oil is only part of the costs to produce PVC (CPB, 2017).
Figure 13 Graph showing the price of virgin PVC in EUR/ton PVC in 2018. It has remained relatively constant and is at the time of writing 950 EUR/ton. The price concerns the Dutch target price for PVC (K&R, 2018).
3.2 Recycling of PVC
3.2.1 Recycling of plastics in the Netherlands in general
Besides the decarbonisation options that will be discussed later in this report, another effective method to indirectly reduce greenhouse gas emissions in the PVC manufacturing industry is to simply reuse PVC that has already been produced. By re-circulating PVC back into the supply chain the industry could on one hand reduce their greenhouse gas emissions because less PVC has to be manufactured to supply the same demand, and on the other hand reduce costs since less feedstock (specifically ethylene) is needed.
The general process of recycling of plastics can be divided in different steps: 1. Collection: plastics have to be collected and transported to the sorter.
2. Sorting: plastics are manually and automatically sorted in their respective mono streams (PP, PE, PVC, etc…) to obtain the purest possible plastic streams. The plastics are then pressed to bales for further processing.
3. Recycling: mechanical recycling or chemical recycling to produce recycle plastic granulates.
In the Netherlands this whole process can be characterised as an ‘open’ organisation
(Berenschot, 2017). This means that the producer or importer who brings the plastic product to the consumer market is not involved in the collection, sorting or recycling or their
respective product. The collection of plastic is generally done by consumers of the product, and in the case of mixed consumer waste is controlled by the municipalities. The sorting and recycling is then done by another group of sorters and recyclers. Having such a large group of actors involved in this process has proven to slow down innovation and optimisation (Berenschot, 2017).
3.2.2 Where PVC waste occurs
Two major groups of PVC waste can be defined: pre-consumer waste and post-consumer waste (EU, 2000). Pre-consumer waste is PVC material which is leftover before the usage of the product by the consumer. This group can be further divided in 1) production waste and 2) installation waste. Production waste is generated during the manufacturing of the intermediate and final PVC products. An example of production waste is PVC cut-offs when shaping the PVC product. Installation waste is generated during the installation of the PVC products. An example of installation waste is cutting losses during the installation of flooring. Pre-consumer waste is valuable waste as it is a pure PVC stream and can be directly recycled into the process.
Post-consumer waste is PVC material which occurs from products at its end-of-life phase in mixed waste streams or as part of composite materials. Post-consumer waste can occur as a relatively pure mono fraction as a result of sorting from the mixed waste stream or separate collection, such as is the case for PVC pipes. Alternatively, PVC can be processed into composite products in combination with other materials. To recover this PVC the products will have to be disassembled, mechanically grinded and sorted. An example are cables, which are mainly made of PVC and copper.
Table 10 PVC waste classified based on source of origin (EU, 2000).
Currently the quantity of PVC items entering the waste stream is relatively small as the majority of PVC products have long lifetimes averaging 50-100 years. It is expected that this situation will change as more and more PVC products will approach their end of economic lives and will add to the PVC waste stream (Pieter Bruijnincx, personal communication; PVC.org, 2018). Since PVC consumption took off in the 1970s it is expected that due to this time-lag considerable amounts of PVC will be available for recycling in 2020 (EU, 2000).
Figure 14 Simplified scheme of the recycling options for PVC waste treatment. Directly re-use of PVC products is most valuable. Alternatively, waste can be recycled mechanically or chemically. Finally, the least valuable method of PVC waste treatment is energy recovery (Berenschot, 2017).
Group Subcategory Example
Pre-consumer waste Production waste Cut-offs Installation waste Cutting losses
Post-consumer waste Mono fraction Pipes
4 Options for
decarbonisation
This chapter will describe the proposed options to achieve a reduction of energy use and/or CO2 emissions for the manufacturing of PVC at Shin-Etsu PVC B.V., Rotterdam and Vynova Beek, Geleen. Figure 14 visualises seven categories that can be distinguished when addressing decarbonisation. A full overview, based on what we could find in literature and from conversations with industry, of possible decarbonisation options for the manufacturing of PVC is shown in Table 11.
Figure 15 Seven possible categories of decarbonisation measures that can be applied in the full production chain (PBL, 2019).
Table 11 Full overview of all the decarbonisation options for the PVC manufacturing industry, the ones highlighted in green will be discussed further in this chapter.
Category Description Options
1 Fuel
substitution
Substitution of the (currently fossil) energy supply: e.g. biogas, electrification, hydrogen, geothermal heat, recycled heat
- Production of steam by syngas-CHP plants
- Heat generation by replacing natural gas burners in the cracking furnaces with hydrogen burners - Production of steam by
combustion biomass (e.g. wood chips)
- Production of steam by combustion of biogas and syngas
Category Description Options
- Production of steam using an heat pump
- Steam upgrading by mechanical vapour recompression (MVR). - Electric cracking furnaces - Electric boilers
2 Feedstock substitution
Feedstock substitution, e.g. with biomass, recycled flows, other upstream material substitution
- Replacement of ethylene from naphtha by bio-ethylene from bio-ethanol
3 Process design Substitution production processes based on different fuel, feedstock, or entirely different process, for creating the same product or products with the same or similar application, e.g. innovative processes with membrane separation process instead of thermal process
- Substitution of balanced production process by ethane-to-VCM over copper ZSM-5 catalyst process
4 Recycling Recycling of products or
by-products - Improved mechanical recycling of PVC, especially the post-consumer waste stream - Innovative non-conventional
mechanical recycling of PVC - Chemical recycling of PVC to
the main chemical building blocks
5 Product design Reduction of the total product demand or substitution with other product with the same properties but lower CO2 footprint
- Alternative to PVC
- Use alternative polymers for short life cycle applications
6 Use of residual energy
Reuse of waste heat either within the process itself, or other useful applications outside of the process
- Heat integration in the PVC plant
7 CO2 capture and storage or re-use
Carbon capture and storage processes or alternative uses of the potentially emitted CO2
- CCS of CO2 stream from
natural gas burners
Figure 15 visualises the decarbonisation options in the total production chain. As part of the MEE-covenante Shin-Etsu aims to maintain an annual yearly increase in energy efficiency of ~2%.