Bijlage 1
Dietary exposure to cadmium in the
Netherlands
RIVM Letter report 2015-0085 R.C. Sprong│P.E. Boon
Colophon
© RIVM 2015
Parts of this publication may be reproduced, provided acknowledgement is given to the 'National Institute for Public Health and the Environment', along with the title and year of publication.
R. Corinne Sprong (auteur), RIVM Polly E. Boon (auteur), RIVM
Contact: Polly Boon
Department Food Safety
Centre for Nutrition, Prevention and Health Services
polly.boon@rivm.nl
This investigation was performed by order and for the account of the Netherlands Food and Consumer Product Safety Authority (NVWA), Office for Risk Assessment and Research, within the framework of project ‘Intake calculations and modelling’, research questions 10A.8.5 and 9.4.39
This is a publication of:
National Institute for Public Health and the Environment
P.O. Box 1│3720 BA Bilthoven The Netherlands
Publiekssamenvatting
Inname van cadmium via het voedsel in Nederland
Het RIVM heeft in 2015 berekend hoeveel cadmium mensen binnen kunnen krijgen via voeding in Nederland. Uit de berekening blijkt dat kinderen tot de leeftijd van ongeveer 10 jaar gemiddeld meer cadmium binnen krijgen dan wenselijk is. De hoeveelheid cadmium die mensen gemiddeld gedurende hun leven via de voeding binnenkrijgen is echter zodanig laag dat het risico op schadelijke gezondheidseffecten
verwaarloosbaar is. Kinderen krijgen naar verhouding meer cadmium binnen, omdat zij per kilogram lichaamsgewicht meer eten dan volwassen. De voedselgroepen granen, aardappels, groente en fruit dragen het meeste bij aan de totale blootstelling (circa 80 procent). Cadmium komt vooral via de bodem in voeding terecht. De stof kan nadelig zijn voor de gezondheid doordat het stapelt in de nieren. Wanneer de concentratie te hoog wordt, kan het de werking van de nieren schaden.
Voor de innameberekening van cadmium zijn voldoende
concentratiegegevens beschikbaar voor producten als melk, granen, groente, fruit en aardappelen. Van een aantal voedingsmiddelen zijn deze gegevens niet of slechts beperkt beschikbaar, waaronder vlees, pindaproducten, bewerkte cacao, oliezaden (vooral zonnebloempitten), ananas, runder- en varkenslever en bepaalde vissoorten (koolvis, kabeljauw, zalm en haring). Met deze gegevens zou de
innameberekening verder kunnen worden geoptimaliseerd.
De beschikbare concentratiegegevens van cadmium in producten zijn gecombineerd met voedselconsumptiegegevens van de
Voedselconsumptiepeiling (VCP). Daarna is de berekende inname vergeleken met de gezondheidslimiet die voor deze stof geldt. Deze limiet is gebaseerd op de gemiddelde hoeveelheid van een stof waar mensen langdurig dagelijks aan mogen worden blootgesteld, zonder dat dit nadelige gevolgen heeft voor de gezondheid.
De gemiddelde cadmiuminname varieert van 0,57 microgram per kilo lichaamsgewicht per dag bij 2-jarigen tot ongeveer 0,20 microgram per kilo lichaamsgewicht per dag op volwassen leeftijd.
Kernwoorden: Cadmium, jonge kinderen, kinderen, volwassenen, concentratie data, langetermijninname, statistisch modelleren
Synopsis
Dietary exposure to cadmium in the Netherlands
In 2015, the Dutch National Institute for Public Health and the Environment (RIVM) calculated the dietary intake of cadmium in the Netherlands. The results show that the average intake of cadmium of children up to the age of about 10 is higher than desirable. The average life-long dietary intake of cadmium is however so low that the risk to public health is negligible. Cadmium intake in children is higher than in adults because, children consume more food per kilogramme of body weight than adults do. Cereals, potatoes, vegetables and fruit were the main sources of exposure to cadmium (accounting for approx. 80% of total intake).
Uptake from the soil is the main route by which cadmium ends up in food. Cadmium poses health risks because it accumulates in the kidneys. If the concentration becomes too high, it can cause kidney damage.
For a number of products, such as milk, cereals, vegetables, fruit and potatoes, sufficient cadmium concentration data were available for the intake calculations. However, for a number of other products no data or only limited data were available. These include meat, peanut-based products, processed cocoa, oil seeds (such as sunflower seeds),
pineapple, bovine and pig liver, and some fish species (such as pollock, cod, salmon and herring). Additional data on cadmium concentrations in these foods would make it possible to perform more accurate intake calculations.
To calculate the dietary exposure to cadmium in the Netherlands, food consumption data derived from the Dutch National Food Consumption Survey were combined with the available data on cadmium
concentrations in foods. The calculated intake was then compared to the health-based guidance value for cadmium. This value is based on the daily quantity of cadmium that people may ingest on average over a long period without detrimental consequences to health.
The average daily cadmium intake in the Netherlands ranges from 0.57 microgrammes per kilogramme of body weight in two-year-old children to approx. 0.20 microgrammes per kilogramme of body weight in adults.
Key words: Cadmium, young children, children, adults, concentration data, long-term exposure, statistical modelling
Contents
1 Introduction — 9 2 Intake calculations — 13 3 Results — 15 3.1 Exposure to cadmium — 15 4 Discussion — 194.1 Comparison with a 2012 cadmium intake study performed by EFSA — 19
4.2 Comparison with the 2010 RIVM/RIKILT study — 22
4.3 Uncertainties related to the exposure assessment to cadmium — 22
4.4 Comparison with the tolerable daily intake — 26
4.5 Conclusions — 28
Acknowledgements — 29
References — 31
Appendix 1 Overview of cadmium concentrations (mg/kg) used in the dietary exposure assessment: minimum (Min), maximum (Max) and mean in the lower (LB), medium (MB) and upper bound
(UB) scenario — 35
Appendix 2 Normality of the lognormal transformed long-term dietary exposure distributions to cadmium for young children aged 2 to 6 and population aged 7 to 69 in the Netherlands in which samples with a cadmium concentration below the limit of detection (LOD) or
quantification (LOQ) equalled ½LOD or ½LOQ (medium bound scenario) — 40
Appendix 3 Median (P50) and high (P95) exposure estimates (µg/kg bw per day) to cadmium per age in young children aged 2 to 6 and the population aged 7 to 69 in the Netherlands following three scenarios of assigning concentrations to samples with cadmium concentrations below limit of detection (LOD) or quantification (LOQ) — 41
Appendix 4 Consumption of the main contributors to the median (P50) and high (P95) dietary exposure to cadmium per food group and
individual foods in young children aged 2 to 6 and the population aged 7 to 69, as well as the mean cadmium concentration, with samples below limit of detection or quantification assigned 0 mg/kg (lower bound scenario) — 44
Appendix 5 Raw agricultural commodities (RACs) included in the current dietary intake assessment study, but not in the 2010 RIVM/RIKILT study (Boon et al., 2010) — 45
Appendix 6 Mean consumption of fish (g/d) and other sea foods in young children aged 2 to 6 and the population aged 7 to 69 — 46
Appendix 7 Average exposure estimates (µg/kg bw per day) to cadmium per age in the population aged 2 to 69 in the Netherlands in which samples with a cadmium concentration below the limit of detection (LOD) or quantification (LOQ) equalled ½LOD or ½LOQ (medium bound scenario) — 47
1
Introduction
The aim of this document is to report on the dietary exposure to
cadmium in children and adults in the Netherlands. Cadmium is a heavy metal occurring as an environmental contaminant with its origin in both natural (soil) and anthropogenic sources. It has no known biological function in animals and humans, but mimics other divalent metals with essential biological functions, such as calcium, zinc and iron (EFSA, 2009). Food is the predominant source of cadmium exposure in the non-smoking general population; approximately 90% of cadmium exposure is derived from dietary sources (excluding drinking water). Although cadmium absorption from dietary sources is relatively low (3-5%), it is effectively stored in the kidneys and liver. Its biological half-life can be up to 10 to 30 years. Prolonged and/or high exposure to cadmium can result in renal dysfunction and bone demineralization. Cadmium is classified as a human carcinogen (Group I) and has been associated with pulmonary, endometrial, bladder and breast cancer. In addition, cadmium exposure has been associated with teratogenicity, and endocrine and reproductive effects.
In 2009 and subsequently confirmed in 2011, the Scientific Panel on Contaminants in the Food Chain (CONTAM) of the European Food Safety Authority (EFSA) derived a tolerable weekly intake (TWI) of cadmium of 2.5 µg/kg bw (EFSA, 2009, 2011). This TWI is lower than the provisional tolerable monthly intake (PTMI) of 25 µg/kg bw (equivalent to a
provisional TWI of 5.8 µg/kg bw) established by the Joint FAO/WHO Expert Committee on Food Additives (JECFA) in 2010 (FAO/WHO, 2010). In this report, the TWI of EFSA was used to assess the health risk of dietary cadmium intake in the Netherlands. Since the intake model used for the current calculation provides daily intakes, the TWI was converted to a tolerable daily intake (TDI) of 0.357 µg/kg bw.
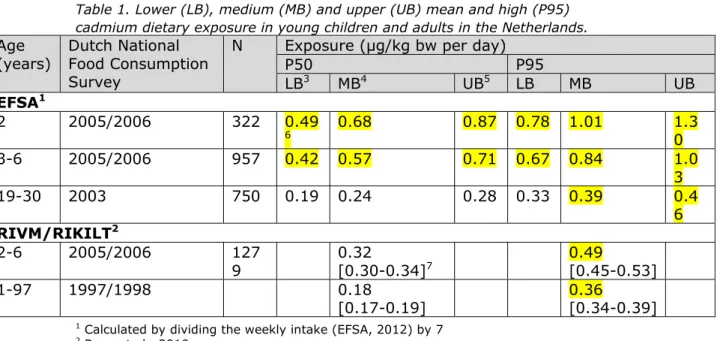
EFSA estimated in 2012 the dietary cadmium exposure in several European countries, including the Netherlands (EFSA, 2012). Exposure estimates for the Netherlands were based on food consumption data of the Dutch National Food Consumption Survey (DNFCS) 2003 (Ocké et al., 2005) and the DNFCS-Young Children of 2005/2006 (Ocké et al., 2008) combined with cadmium concentrations of at least 25 European countries1. Table 1 shows the cadmium intake results reported for the
Netherlands. The mean and high (95th percentile; P95) intake in children
exceeded the TDI. In adults, high intake exceeded the TDI in the medium and upper bound scenario. For the lower bound scenario, the high intake was slightly below the TDI2.
1 These countries included 22 EU Member States, and three European Economic Area or other countries. The
data also included data from some food business operators (EFSA, 2012).
2 Lower bound scenario meant that samples lower than the limit of reporting (LOR), detection (LOD) or
quantification (LOQ) were defined as containing no cadmium (0 mg/kg). For the medium bound and upper bound scenario, these samples were defined as containing cadmium at a concentration equal to ½LOR or ½LOD or ½LOQ and LOR, LOD or LOQ, respectively.
Table 1. Lower (LB), medium (MB) and upper (UB) mean and high (P95) cadmium dietary exposure in young children and adults in the Netherlands.
Age (years)
Dutch National Food Consumption Survey
N Exposure (µg/kg bw per day)
P50 P95 LB3 MB4 UB5 LB MB UB EFSA1 2 2005/2006 322 0.49 6 0.68 0.87 0.78 1.01 1.30 3-6 2005/2006 957 0.42 0.57 0.71 0.67 0.84 1.0 3 19-30 2003 750 0.19 0.24 0.28 0.33 0.39 0.4 6 RIVM/RIKILT2 2-6 2005/2006 127 9 0.32 [0.30-0.34]7 0.49 [0.45-0.53] 1-97 1997/1998 0.18 [0.17-0.19] 0.36 [0.34-0.39]
1 Calculated by dividing the weekly intake (EFSA, 2012) by 7 2 Boon et al., 2010
3 Non-detects defined as 0 mg/kg
4 Non-detects defined as ½ limit of reporting (LOR) 5 Non-detects defined as LOR
6 Highlighted values indicate values exceeding the tolerable daily intake of 0.357 µg/kg bw
per day (obtained by dividing the tolerable weekly intake of 2.5 µg/kg bw per week by 7).
7 2.5% lower and 97.5% upper confidence limits of the exposure estimate (not reported by
EFSA)
Country-specific exposure estimates to food contaminants, such as cadmium, reported by EFSA may not represent the true exposure within a country, because of three reasons. Firstly, EFSA uses a harmonised food categorisation system (FoodEx1) to assess the exposure to food contaminants in which foods, both consumed and analysed, are categorised at four hierarchical levels.
The less detail available about the food, the lower the level at which the food is classified. In practice, the use of this classification system results in a less detailed classification of foods than available in national food and concentration databases, and may thus result in conservative estimations of exposure (Boon et al., 2012; 2014b). Secondly, in these exposure assessments national food consumption data are combined with a concentration database containing concentration data of different European countries. Although an exposure assessment based on such concentration data may be useful to identify possible risks in the general population of the European Union (EU) and for development of risk reduction measures at EU-level (e.g. decrease of maximum limits), extrapolation of the exposure results to country level may not always be adequate, especially when national differences in concentrations in foods are to be expected, as might be the case for heavy metals such as cadmium. And thirdly, in exposure assessments performed by EFSA a conservative model is used to assess the long-term exposure, resulting potentially in an overestimation of the true long-term exposure (Boon et al., 2012, 2014b).
When a country-specific exposure estimate reported by EFSA indicates that a possible health risk cannot be excluded, it is therefore advisable
to refine the assessment for this country by using national concentration data, a more refined food classification system to optimise the linkage between foods analysed and consumed, and/or a refined model to assess long-term exposure. Theoretically, an exposure assessment performed by EFSA can underestimate the exposure at country level. However, due to the use of a less detailed food classification system (FoodEx1) and a conservative model to assess long-term exposure, an overestimation of the exposure at country level is most likely.
In 2010, the RIVM/RIKILT Front Office Food Safety performed an exposure assessment to cadmium via food in the Netherlands (Boon et al., 2010) using food consumption data of DNFCS 1997/1998 covering the general population aged 1 to 97 (Kistemaker et al., 1998) and of DNFCS-Young Children 2005/2006 covering young children aged 2 to 6 (Ocké et al., 2008). These consumption data were combined with concentration data of cadmium in raw agricultural commodities (RACs) covering the period 1999 to 2007. In this assessment, a refined model to assess the long-term exposure was used. Table 1 summarises the exposure results of this assessment. Lower dietary cadmium exposure estimates for young children were calculated compared to those reported by EFSA. For the adult population addressed by EFSA, the estimated high (P95) exposure equalled the upper bound of the
confidence interval around this exposure level for the population aged 1 to 97. However, the population aged 1 to 97 also included young
children. Given the high exposure levels in this younger age group (Table 1), it is very likely that the exposure would have been lower if in the 2010 RIVM/RIKILT study only adults had been included.
The food consumption data for the general Dutch population used in the 2010 RIVM/RIKILT study were fairly old. Given changes in dietary habits over time (Geurts et al., 2013; van Rossum et al., 2011), an updated cadmium assessment with recent food consumption data is therefore desirable. In 2011, food consumption data of a survey conducted in 2007 to 2010 among persons aged 7 to 69 living in the Netherlands (DNFCS 2007-2010) was released (van Rossum et al., 2011). These food consumption data, together with updated national cadmium concentrations, an optimised linking between RACs and food
consumption data, and use of a refined model to assess the long-term exposure, were used to estimate the dietary exposure to cadmium in the Netherlands. To cover as much ages as possible, also the food
consumption data of DNFCS-Young Children were used to estimate the exposure to cadmium via food in children aged 2 to 6. Apart from estimating the exposure to cadmium via food, the aim of the current study was also to compare the exposure estimates with those reported by EFSA (Table 1) and to identify factors contributing to a possible difference in outcome.
In this report, the terms exposure and intake are used alternatively, referring both to the ingestion of cadmium via food.
2
Intake calculations
Calculations for young children were performed using food consumption data of DNFCS-Young children 2005/2006 (Ocké et al., 2008). This survey covers the dietary habits of young children aged 2 to 6 and was conducted in 2005 and 2006. Calculations for the population aged 7 to 69 were performed using food consumption data of DNFCS 2007-2010 (van Rossum et al., 2011). This survey includes the eating habits of people aged 7 to 69, with the exception of pregnant and breast-feeding women.
Cadmium concentration data used for the dietary exposure assessment to cadmium were obtained from Dutch monitoring programmes
performed by the Netherlands Food and Consumer Product Safety Authority (NVWA; 1999- 2010), the Institute for Marine Sources & Ecosystem Studies (1999-2011), Fytolab (2009-2011), and the Dutch Dairy Association (2000-2011). These data were stored in the Quality of Agricultural Products (KAP) database3. Concentrations of cadmium in
drinking water were obtained from Centre for Sustainability,
Environment and Health (RIVM), and covered analyses performed in 2006 to 2010. Cadmium analyses were predominantly performed in raw agricultural commodities (RACs), including vegetables, fruit, cereals, milk, fish, liver and kidney (Appendix 1). Only few concentration data were available for meat. To supplement these data, cadmium
concentrations in meat were estimated based on concentrations analysed in liver and kidney using a conversion factor of 31 and 134, respectively (de Winter-Sorkina et al., 2003). No data were available for cocoa beans, a major contributor to the cadmium exposure in the EFSA study (EFSA, 2012). Therefore, mean cadmium concentrations in cocoa beans reported by EFSA (2012) were used in the current study.
Additional concentration data of cadmium in peanut butter were
obtained from RIKILT Wageningen UR (RIKILT), who analysed cadmium in 20 peanut butter samples in 2014.
In the cadmium concentration database, a number of samples were reported to contain cadmium below the limit of quantification (LOQ) or detection (LOD). In the intake calculations, these samples were assigned a cadmium concentration equal to ½LOD or ½LOQ (medium bound (MB) scenario). To study the sensitivity of the intake calculations to the concentration assigned to samples with a cadmium concentration below LOD or LOQ, two other scenarios were performed in which either zero (lower bound (LB) scenario) or the limit itself (upper bound (UB) scenario) was assigned to these concentrations. Appendix 1 shows the mean cadmium concentrations per food following these three scenarios. Because cadmium analyses were predominantly performed in RACs, the reported cadmium concentrations in RACs were translated to
concentrations in food products using the conversion model for primary agricultural products (Boon et al., 2009; van Dooren et al., 1995).
The Monte Carlo Risk assessment programme (MCRA), Release 7.1 (de Boer and van der Voet, 2010) was used for the intake calculations. Age was defined as a covariable. For DNFCS-Young children, the exposure was estimated for each age (so 2, 3, 4, 5 and 6 years, respectively), whereas for DNFCS 2007-2010, the exposure was estimated per age with intervals of 3 years (so 7, 10, 13, etc.). The long-term exposure was calculated by multiplying first daily consumption patterns of individuals with the mean cadmium concentration per consumed food, and summed over foods per day per individual, resulting in a distribution of daily individual exposures. Subsequently, these daily exposure were corrected for day-to-day variation in exposure using the Logisticnormal-Normal (LNN) model to estimate long-term exposure (Goedhart et al., 2012; van Klaveren et al., 2012). All daily estimated exposures were adjusted for individual body weight and expressed in µg/kg bw per day. The reported percentiles of the long-term exposure to cadmium are P50 (median) and P95. By using the bootstrap approach (Efron, 1979; Efron and Tibshirani, 1993), the uncertainty around the exposure estimates was quantified due to the sampling size of the food consumption and concentration database. The uncertainty is reported as the 95% confidence interval around the percentiles of exposure.
An important prerequisite to use LNN for estimating long-term exposure is that the logarithmic transformed positive daily exposure distribution is normally distributed (de Boer et al., 2009). Appendix 2 shows that this was true for both populations, justifying the use of this model to assess the long-term exposure to cadmium via food.
3
Results
Exposure to cadmium 3.1
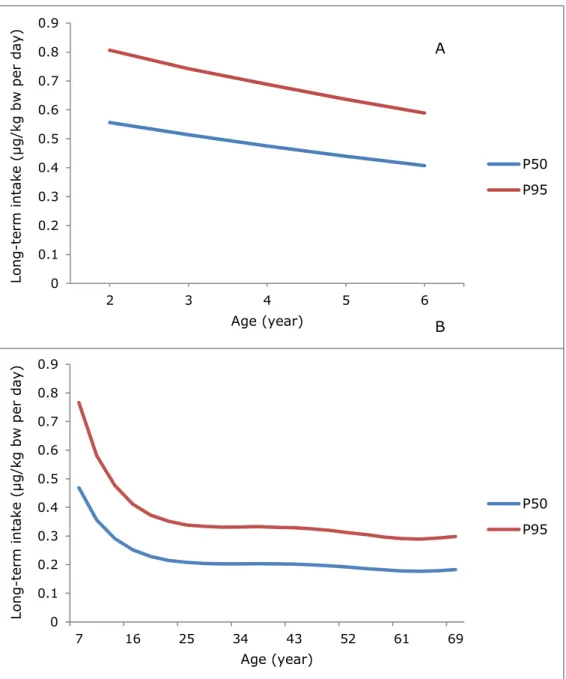
Figure 1 show the median (P50) and P95 of long-term dietary cadmium exposure in young children aged 2 to 6 and the population of 7 to 69 years, respectively, for the MB scenario. Appendix 3 lists the exposure estimates for all three scenarios, including 95% confidence intervals, for both populations.
Figure 1. Median (P50) and high (P95) long-term dietary exposure to cadmium per age in young children aged 2 to 6 (A) and the population aged 7 to 69 (B) in the Netherlands in which samples with a cadmium concentration below the limit of detection (LOD) or quantification (LOQ) equalled ½LOD or ½LOQ (medium bound scenario) 0 0.1 0.2 0.3 0.4 0.5 0.6 0.7 0.8 0.9 7 16 25 34 43 52 61 69 Lo n g -t erm in ta ke (µ g/ kg bw p er da y) Age (year) P50 P95 0 0.1 0.2 0.3 0.4 0.5 0.6 0.7 0.8 0.9 2 3 4 5 6 Lo ng -t er m int ake (µ g /kg bw per da y) Age (year) P50 P95 A B
Food groups contributing to cadmium exposure
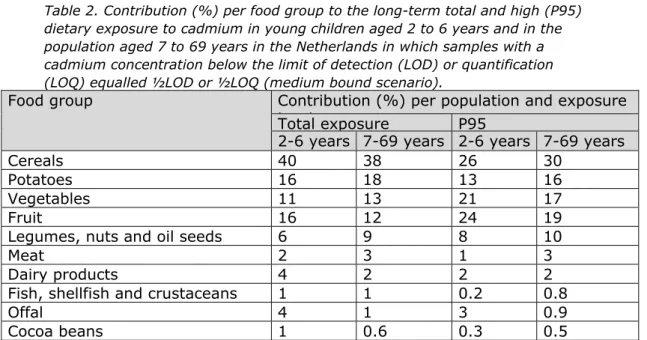
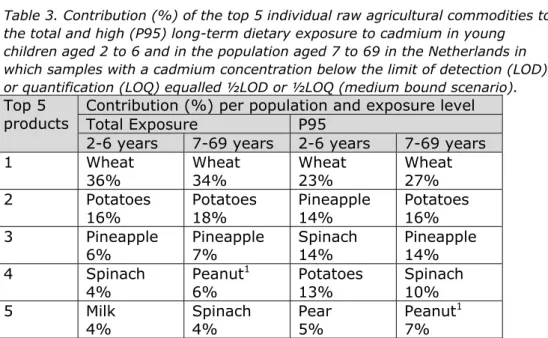
Table 2 shows the percentage contribution of different food groups to the total and high (P95) dietary cadmium exposure in both populations. Cereals and potatoes were important contributors to the exposure in both populations (Table 2). This was due to a high consumption of these food groups rather than high cadmium concentrations (Appendix 4). Wheat was the main contributor within the cereal group (Table 3). Vegetables and fruit were also important sources of exposure with spinach and pineapple as the main contributors (Table 3). Legumes, nuts and oil seeds contributed to the cadmium exposure (Table 2) via the consumption of peanut or peanut butter. In young children, also milk was an important contributor to the exposure (Table 3). This contribution was mainly due to a high consumption of milk (including dairy products), and not by a high cadmium content.
Meat had a low contribution to the total cadmium intake (Table 2). This was due to the relatively low concentration of cadmium in meat
consumed with high frequency, such as beef and pig, or to a low consumption of meat with high cadmium concentrations, such as horse meat (Appendix 4). Although offal and several types of fish and
crustaceans contain high concentrations of cadmium (Appendix 1), their contribution to the total cadmium intake was also very low (Table 2), because of their low consumption (Appendix 4). The contribution of cocoa was low, despite a moderate consumption (median consumption of 4 and 7 g/d for young children and the population aged 7 to 69 years, respectively). This was due to a low cadmium concentration in cocoa beans (Appendix 1).
Table 2. Contribution (%) per food group to the long-term total and high (P95) dietary exposure to cadmium in young children aged 2 to 6 years and in the population aged 7 to 69 years in the Netherlands in which samples with a cadmium concentration below the limit of detection (LOD) or quantification (LOQ) equalled ½LOD or ½LOQ (medium bound scenario).
Food group Contribution (%) per population and exposure l l
Total exposure P95
2-6 years 7-69 years 2-6 years 7-69 years
Cereals 40 38 26 30
Potatoes 16 18 13 16
Vegetables 11 13 21 17
Fruit 16 12 24 19
Legumes, nuts and oil seeds 6 9 8 10
Meat 2 3 1 3
Dairy products 4 2 2 2
Fish, shellfish and crustaceans 1 1 0.2 0.8
Offal 4 1 3 0.9
Table 3. Contribution (%) of the top 5 individual raw agricultural commodities to the total and high (P95) long-term dietary exposure to cadmium in young children aged 2 to 6 and in the population aged 7 to 69 in the Netherlands in which samples with a cadmium concentration below the limit of detection (LOD) or quantification (LOQ) equalled ½LOD or ½LOQ (medium bound scenario).
Top 5 products
Contribution (%) per population and exposure level Total Exposure P95
2-6 years 7-69 years 2-6 years 7-69 years 1 Wheat 36% Wheat 34% Wheat 23% Wheat 27% 2 Potatoes 16% Potatoes 18% Pineapple 14% Potatoes 16% 3 Pineapple
6% Pineapple 7% Spinach 14% Pineapple 14% 4 Spinach
4% Peanut
1
6% Potatoes 13% Spinach 10% 5 Milk
4% Spinach 4% Pear 5% Peanut
1
7%
1 Consumed as (coated) peanuts, peanut sauce and other peanut-based products, such as
4
Discussion
The current study describes the dietary exposure to cadmium in the population of 2 to 69 years in the Netherlands. Below, the results are discussed in relation to a study into the dietary exposure in the Netherlands performed by EFSA and a 2010 study performed in the Netherlands by RIVM/RIKILT (section 1), and to the methodology and input data used. At the end, the estimated exposures are compared to the health-based guidance value of cadmium to establish if there is a possible health risk related to the reported cadmium intake levels. Comparison with a 2012 cadmium intake study performed by 4.1
EFSA
A recent national dietary exposure assessment to lead resulted in lower lead exposure estimates in the Netherlands compared to the approach applied by EFSA (Boon et al., 2012). This difference in exposure was explained by the use of lower national lead concentrations in foods, a more optimal linkage of food consumption and concentration data, and the use of a refined intake model to estimate long-term exposure. In the current study, the cadmium exposure estimates in young children were also lower than those reported by EFSA for the same age group
(Table 4). Comparing the exposure reported by EFSA for the adult age (19 to 30 years) group with that of the population of 7 to 69 years showed that the exposure was higher in the current study (Table 4). This result could be due to the inclusion of children and adolescents in the population of 7 to 69 years, which had a higher exposure to cadmium than adults (Figure 1). Examining the cadmium intake of the population aged 19 to 30 in the current study showed that the P95 intake was lower than 0.39 µg/kg bw per day, as reported by EFSA (Appendix 3). So also for this adult age group, the estimated exposure in the current study was lower than the exposure reported by EFSA. As described above, these differences in cadmium exposure can be explained by three factors: 1) the concentration database, 2) the calculation model, and/or 3) the food classification system. To examine which of these factors contributed to the observed differences in
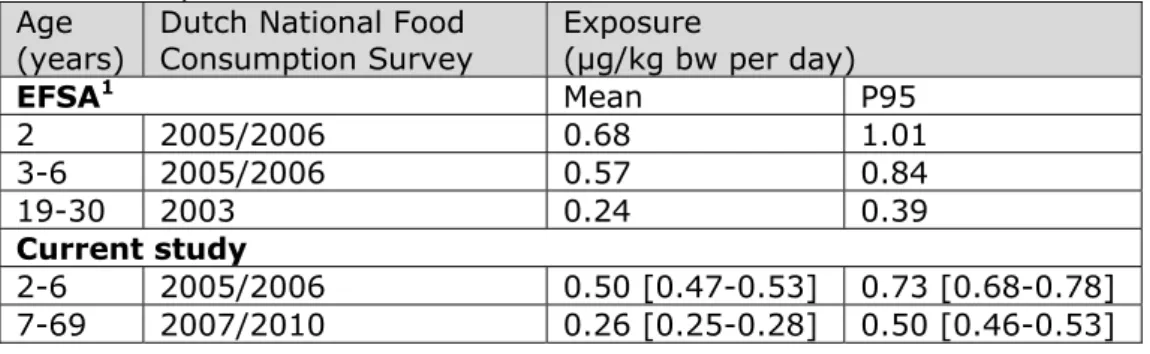
Table 4. Median (P50) and high (P95) cadmium dietary exposure in young children and adults in the Netherlands calculated by EFSA (2012) and in the current study.1
Age
(years) Dutch National Food Consumption Survey Exposure (µg/kg bw per day)
EFSA1 Mean P95 2 2005/2006 0.68 1.01 3-6 2005/2006 0.57 0.84 19-30 2003 0.24 0.39 Current study 2-6 2005/2006 0.50 [0.47-0.53] 0.73 [0.68-0.78] 7-69 2007/2010 0.26 [0.25-0.28] 0.50 [0.46-0.53]
1 Samples with a cadmium concentration below the limit of detection (LOD) or
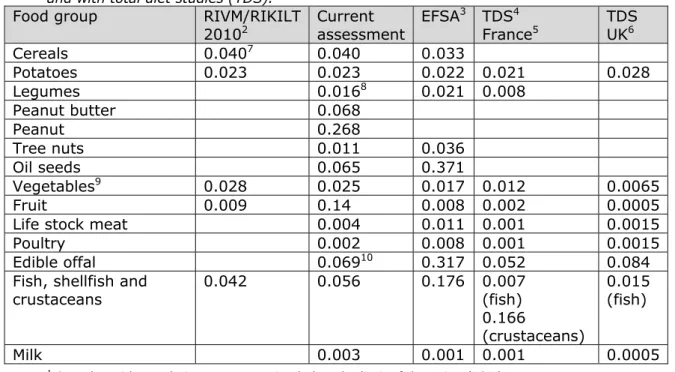
Table 5. Mean cadmium concentrations1 (mg/kg) per food groups as stored in the KAP database from 1999 up to 2011 in comparison with the EU database and with total diet studies (TDS).
Food group RIVM/RIKILT
20102 Current assessment EFSA
3 TDS4 France5 TDS UK6 Cereals 0.0407 0.040 0.033 Potatoes 0.023 0.023 0.022 0.021 0.028 Legumes 0.0168 0.021 0.008 Peanut butter 0.068 Peanut 0.268 Tree nuts 0.011 0.036 Oil seeds 0.065 0.371 Vegetables9 0.028 0.025 0.017 0.012 0.0065 Fruit 0.009 0.14 0.008 0.002 0.0005 Life stock meat 0.004 0.011 0.001 0.0015
Poultry 0.002 0.008 0.001 0.0015
Edible offal 0.06910 0.317 0.052 0.084
Fish, shellfish and crustaceans 0.042 0.056 0.176 0.007 (fish) 0.166 (crustaceans) 0.015 (fish) Milk 0.003 0.001 0.001 0.0005
1 Samples with a cadmium concentration below the limit of detection (LOD) or
quantification (LOQ) equalled ½LOD or ½LOQ (medium bound scenario).
2 Boon et al., 2010 3 EFSA, 2012
4 TDS = total diet study 5 Arnich et al., 2012 6 Rose et al., 2012 7 Wheat only 8 Including peanut 9 Including tea
10 Liver of bovine and pig
exposure, Table 5 lists first the mean cadmium concentrations used by EFSA and those used in the current study for the LB scenario.
Concentrations in cereals, vegetables, fruit and legumes were higher in the current study, but concentrations in fish, edible offal, oil seeds and tree nuts were lower compared to those used by EFSA.
Particularly for foods with a high consumption, such as wheat,
vegetables and fruit, mean concentrations were higher in the current study (Table 5). To study the effect of concentration values, as well as the use of more broad food categories, on the exposure, an exposure estimate using the mean concentrations of the 2012 EFSA study (LB scenario) was run for DNFCS-Young children, because this age group was most comparable to the age groups examined by EFSA. To this end, the mean concentration of the corresponding food group at FoodEx1 level 2 was used, which is a less refined food categorisation system than the national one used in the current study. For example, endive was linked to the mean concentration of leaf vegetables. For peanuts, the concentration of “legumes dried” was used, since according to FoodEx1 peanuts belong to this food group. Table 6 shows that changing the concentration values, including broader food categories, tended towards slightly higher exposure levels.
Secondly, in the current study a refined long-term exposure model (LNN) was used to assess the long-term exposure (section 2). In the
Table 6. Median (P50) and 95th percentile (P95) of dietary exposure to cadmium and the percentage of the population exceeding the tolerable daily intake (TDI) of 0.357 µg/kg bw per day for young children aged 2 to 6 using different calculation methods or concentration data.
Input Model1 Exposure
(µg/kg bw per day)2
P50 P95 Current calculation LNN 0.40
[0.38-0.44]3 0.62 [0.58-0.70]
Current calculation with mean EFSA concentrations
LNN 0.43 [0.41-0.44]
0.68
[0.64-0.71] Current calculation OIM 0.38
[0.36-0.40] 0.72 [0.66-0.81]
1 LNN: Logisticnormal-Normal; OIM: observed individual means 2 Lower bound scenario
3 2.5% lower and 97.5% upper confidence limits of the exposure estimate
EFSA study, the observed individual means (OIM) approach was used (EFSA, 2012). OIM assumes that the individual average intake over the survey days is a proxy for the long-term exposure (de Boer et al., 2009). Because of this assumption, the long-term exposure distribution obtained with OIM still contains a considerable amount of
within-individual variation, which is not relevant for the true long-term
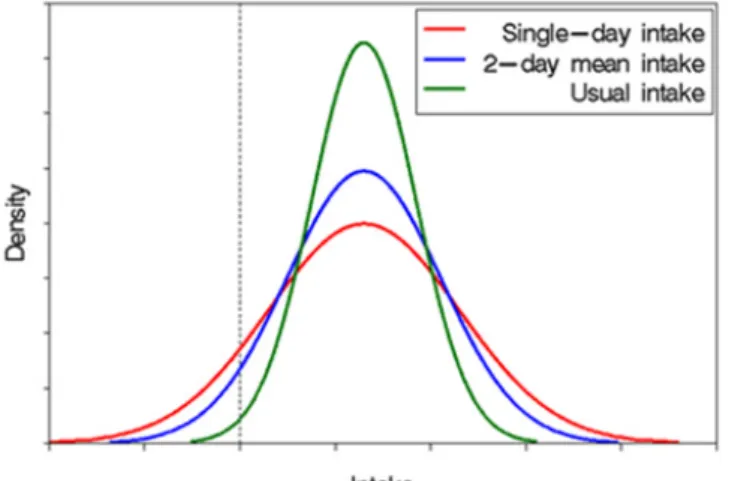
exposure distribution. As a result, the long-term exposure estimates in the right tail of the exposure distribution will overestimate true high intakes (van Klaveren et al., 2012). At the level of the median exposure, the exposure results obtained with OIM will be comparable with the outcome obtained with a refined model, such as LNN (Figure 2; peak value of the blue vs green line). To examine the effect of the model used on the exposure estimates, runs were performed for DNFCS-Young children using also OIM. The results showed that at the P95 level of exposure, OIM tended towards a higher exposure level compared to LNN: 0.72 vs 0.62 µg/kg bw per day (Table 6).
Figure 2. The effect of the within-individual variation on long-term (usual) exposure distributions. This figure is obtained from the National Cancer Institute.
Overall, the outcome of the current refined dietary cadmium exposure assessment was lower compared to the 2012 EFSA study, which is very likely due to a combination of all three factors (national concentration data, linkage between food consumption and concentration data, and model for long-term intake).
4.2 Comparison with the 2010 RIVM/RIKILT study
The exposure to dietary cadmium in the current study was higher than the exposure reported in the 2010 RIVM/RIKILT study (Boon et al., 2010; Table 1). The reason for this was very likely a more complete concentration database available in the current study (Table 5).
In the current study, more concentration data and more raw agricultural commodities (RACs) were included in the assessment. Appendix 5 shows 31 RACs for which no concentration data were present in the 2010 RIVM/RIKILT study. Of these 31 RACs, 22 had at least one positive sample in the present study. Some of the RACs included in the present assessment and not in the 2010 assessment, such as rice and peanut, had a reasonable consumption as well as moderate to high cadmium concentrations. Furthermore, in the 2010 RIVM/RIKILT study, milk was not included in the exposure assessment. All analysed concentrations over the years included in that study were below the reporting limit (LOR). LOR is the limit value below which concentrations were reported as ‘less than’. Given the high consumption levels of milk in the
Netherlands, in- or exclusion of milk in the assessment will affect the exposure estimate. In the current study, cadmium levels in milk were all below LOD or LOQ (Appendix 1). However, in accordance with the 2012 EFSA study (EFSA, 2012), milk was included in the present study. Because of the gaps in concentration data in the 2010 RIVM/RIKILT study, the dietary cadmium exposure estimates in the 2010
RIVM/RIKILT study very likely underestimate the true exposure to cadmium. When these 31 RACs were omitted from the current intake assessment, the dietary exposure percentiles decreased (results not shown).
Another difference between the 2010 RIVM/RIKILT study and the present assessment is the use of another intake model. In the 2010 study, the Betabinomial-Normal (BBN) model was used (Boon et al., 2010). We do however not expect that this will explain the difference in outcome between the two assessments (Goedhart et al., 2012).
Uncertainties related to the exposure assessment to cadmium 4.3
Concentration data
In this exposure assessment, cadmium concentration analysed in RACs in the period 1999 to 2011 were used. For peanut butter, concentration data sampled and analysed in 2014 were used. Ideally, concentration data up to 2014 should have been used for all foods considered in this exposure assessment. Boon et al. (2010) showed however that
cadmium concentrations in RACs show no decreasing or increasing trend over time. In addition, no new risk reduction measures have come into place until mid-2014. Maximum limits have then been set for infant formula, chocolate and cocoa products. Since the effect of these new
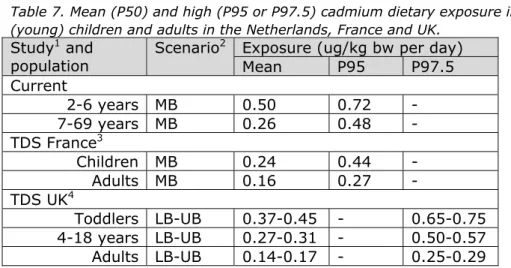
Table 7. Mean (P50) and high (P95 or P97.5) cadmium dietary exposure in (young) children and adults in the Netherlands, France and UK.
Study1 and
population
Scenario2 Exposure (ug/kg bw per day)
Mean P95 P97.5 Current 2-6 years MB 0.50 0.72 - 7-69 years MB 0.26 0.48 - TDS France3 Children MB 0.24 0.44 - Adults MB 0.16 0.27 - TDS UK4 Toddlers LB-UB 0.37-0.45 - 0.65-0.75 4-18 years LB-UB 0.27-0.31 - 0.50-0.57 Adults LB-UB 0.14-0.17 - 0.25-0.29
1 TDS = total diet study
2 LB = lower bound scenario: samples with a cadmium concentration below limit of
detection (LOD) or quantification (LOQ) were assumed to contain no cadmium; MB = medium bound scenario: samples with a cadmium concentration below LOD and LOQ were assigned a cadmium concentration equal to ½LOD or ½LOQ; UB = upper bound scenario: samples with a cadmium concentration below LOD and LOQ were assigned a cadmium concentration equal to LOD or LOQ
3 Arnich et al., 2012 4 Rose et al., 2012
limits on cadmium concentrations in food is not to be expected in 2014, the omission of concentration data of 2012-2014 for foods other than peanut butter has most likely not affected the exposure assessment. A preliminary study into the intake of cadmium via food using
concentrations analysed in a limited number of peanut samples showed that peanut butter could largely contribute to the cadmium exposure in young children. Because of this observation, cadmium in peanut butter was analysed in 2014 and used in the current exposure assessment. A limited number of analyses per food (group) with a high contribution to the cadmium intake, such as peanut, oil seeds, and pineapple
(Appendix 3), was an important factor contributing to the concentration data uncertainty. Comparing the cadmium concentrations used in the current study with results of total diet studies performed in France (Arnich et al., 2012) and UK (Rose et al., 2012), in which representative national composite samples of specified food groups were analysed, showed that cadmium concentrations in vegetables, fruit, meat and offal were lower than those used in the current study (Table 5).
Concentrations in potato were comparable between studies (Table 5). The use of these concentration data resulted in lower estimates of dietary exposure to cadmium in France and UK compared to the current study (Table 7). Below we describe in more detail the uncertainties regarding the concentration data in several foods.
Meat and offal
Concentration data from all sources of meat, except horse meat, present in the database were derived from concentrations in liver (poultry) or kidney (cow, sheep, goat and pig) using a conversion factor of 31 and 134, respectively (de Winter-Sorkina et al., 2003). These conversion factors are subjected to variation. Limited analytical data on liver from cow, sheep, goat and pig were available. Concentrations in livers of
these species were also calculated from the cadmium concentration in kidney, which contributes to the uncertainty of cadmium exposure from liver products.
Cocoa-based products
According to the 2012 EFSA study (EFSA, 2012), high concentrations of cadmium were present in cocoa-based products. No Dutch concentration data for cocoa or cocoa products were available. In the current study, the mean concentration (0.011 mg/kg) of cocoa beans of the 2012 EFSA study was therefore used. However, higher concentrations were found for cocoa powder (0.183 mg/kg), bitter chocolate (0.123 mg/kg), and bittersweet chocolate (0.135 mg/kg) (EFSA 2012). The reason for this is not known, but can be due to regional differences in the presence of cadmium in soil (Mounicou et al., 2003) and/or to targeted sampling. To obtain a good impression for the contribution of cocoa to dietary
cadmium intake, concentration data on cocoa used for foods available on the Dutch market is needed.
Cereals and potatoes
Wheat was a high contributor of cadmium exposure in the Netherlands (Table 3). Only 16% of cereals consumed in the Netherlands are of Dutch origin (LEI, 2012). The majority of wheat is imported from among other European countries, with Germany being the most important supplier. Cadmium concentrations in the concentration database used by EFSA (2012) for cereals were comparable with those in the Dutch
database and from total diet studies (Table 5), indicating that the concentrations in the Dutch database were very likely representative. This was also true for potatoes, which also contributed largely to the exposure to cadmium (Table 2 and 3).
Fish and sea foods
Fish and other sea foods are high contributors to the exposure to
cadmium in many EU countries (EFSA, 2012), but not in the Netherlands (Table 2). This is because of a low consumption of this food group in the Netherlands (Appendix 6). Pollock, cod, salmon, tuna and herring are the most frequently consumed fish species in the Netherlands. Except for tuna, only small numbers of concentration data were available for these fish species (Appendix 1).
Milk and apple
Cadmium concentrations in milk were below LOD or LOQ for many years (Appendix 1). Due to the fact that all cadmium levels were below the limit value and milk (including dairy products) is consumed at high amounts, milk contributed largely to the uncertainty around the
exposure estimates depending on the concentration assigned to samples with a cadmium concentration below LOD or LOQ (Appendix 3). This was also true for apple, which is also frequently consumed and for which the majority of the samples (> 98%) was also below the LOD or LOQ. Use of an analytical method with a lower LOD or LOQ could reduce this
Exposure to cadmium via other sources than food
Apart from food (including drinking water), people can also be exposed to cadmium via inhalation of ambient air. EFSA (2009) estimated the intake of cadmium via this source at 0.003 µg/kg bw per day in non-
Table 8. Sources, direction and magnitude of uncertainty in dietary exposure assessment to cadmium.
Source of uncertainty Direction & Magnitude1
Food consumption data
Sampling uncertainty (bootstrap)2 -/+
Concentration levels
Sampling uncertainty (bootstrap)2 -/+
Limited concentration data of number of products -/+ Conversion factor to assess cadmium concentrations in
meat + Concentrations < limit of detection or quantification were
assumed to contain half the limit value + Representativity samples for consumed foods -/+ Matching food consumption and concentration data
Calculation via RACs3 --/++
Exposure via other sources
Not included in the present assessment • Model uncertainty
LNN4 •
Overall assessment: Based on this qualitative evaluation of different uncertainty sources it was concluded that the exposure to cadmium may be slightly conservative due to the use of conversion factors to derive cadmium
concentrations in meat and the use of ½LOD or ½LOQ in the assessment, especially for milk and apple.
+
1 Key to direction and magnitude
+, ++, +++ = uncertainty likely to cause small, medium or large overestimation of exposure
-, --, --- = uncertainty likely to cause small, medium or large underestimation of exposure • = uncertainty likely to cause a negligible effect on exposure estimate
2 In the analyses, sampling uncertainty of food consumption and concentration data was
quantified simultaneously via a bootstrap analysis. Therefore, it is not possible to quantify which part of the sampling uncertainty was due to food consumption data and which due to concentration data. For more details, see section 2.
3 RAC = raw agricultural commodity 4 LNN = Logisticnormal-Normal
smoking adults and 0.0005 µg/kg bw per day in children. Another source of intake is dust. RIVM estimated the intake via dust at 0.0002 µg/kg bw per day in adults and 0.006 µg/kg bw per day children (Oomen et al., 2008). These exposure are relatively low compared to the exposure via food (section 3.1), and will not significantly increase the exposure as reported in this study. These sources were therefore not considered in the risk assessment (section 4.6).
In Table 8, the different sources contributing to the uncertainty of the exposure estimates are summarized. The uncertainty related to food consumption and to the matching of food consumption and
Boon et al. (2014a). Overall, the estimated exposure to cadmium may be slightly overestimated due to the use of conversion factors to derive cadmium concentrations in meat based on those analysed in liver and kidney, and the use of ½LOD or ½LOQ in the assessment, especially for milk and apple.
Comparison with the tolerable daily intake 4.4
The tolerably weekly intake of cadmium was set at 2.5 µg/kg bw, corresponding with a tolerable daily intake (TDI) of 0.357 µg/kg bw (EFSA, 2011). This health-based guidance value is based on the
development of kidney failure at the age of 50 or older due to life-long exposure to cadmium. In the derivation of the TWI, a “body burden
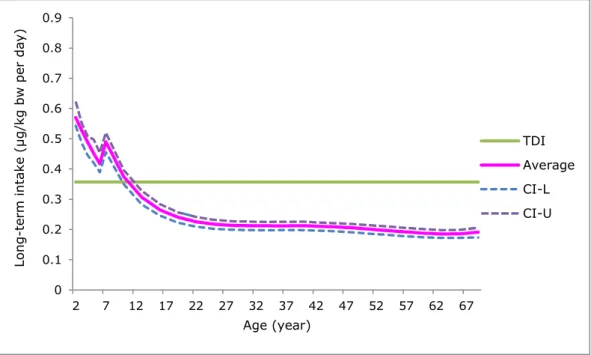
Figure 3. Average long-term dietary exposure to cadmium per age in the population aged 2 to 69 in the Netherlands in which samples with a cadmium concentration below the limit of detection (LOD) or quantification (LOQ) equalled ½LOD or ½LOQ (medium bound scenario). Tolerable daily intake (TDI) = 0.357 µg/kg bw per day. CI-L and CI-U = 2.5% lower and 97.5% upper confidence limits of the average exposure, respectively.
approach” was used. Intake below this TWI ensures that the chronic daily exposure to cadmium from food does not lead to an ‘internal’ level that might induce the above-mentioned nephrotoxicity.
In the MB scenario, the median daily intake exceeded the TDI up to the age of about 10. For the upper 5% of the population, this was true up to the age of about 20 (Figure 1). The percentage of the population
exceeding the TDI decreased from more than 90% in 2-year-olds to approximately 1-3% from the age of 25 onwards.
0 0.1 0.2 0.3 0.4 0.5 0.6 0.7 0.8 0.9 2 7 12 17 22 27 32 37 42 47 52 57 62 67 Lo ng-te rm i n take (µg/ kg b w pe r day) Age (year) TDI Average CI-L CI-U
Since the nephrotoxicity due to the intake of cadmium via food develops after life-long exposure, we estimated the average life-long (between 2 and 69 years) intake of cadmium4. The estimated average intake was
0.25 µg/kg bw per day (Figure 3). Given the uncertainty around this exposure estimate due to the sampling size of the concentration and consumption database (section 2), the average intake could be as high as 0.27 µg/kg bw per day. This average exposure was below the daily equivalent of the TWI showing that the high cadmium intake during childhood was, in the long run, offset by a lower intake during adulthood. For a numerical presentation of the average exposure to cadmium by age, see Appendix 7.
In this life-long assessment, it is assumed that the food consumption patterns and concentrations of cadmium in food will not change over a life time. For example, it is assumed that 2-year-olds will have an exposure in 60 years’ time that equals the exposure of individuals that are presently aged 62. These assumptions may not reflect reality, and may result in an over- or underestimation of the life-long intake of cadmium as reported here. However, at present it is the best approach available to estimate life-long exposure as future changes in food
consumption patterns and cadmium concentrations cannot be predicted. Furthermore, the calculation of the average exposure over a life-time assumes that individuals with a possible higher-than-average intake during a certain period of their life will have a lower-than-average intake in another period of their life. This may not always apply to all
individuals in a population. Due to their dietary preferences, some individuals may have a higher than average intake over a long period of their life or even their entire lifetime. For these individuals, the
presented average life-long intake may very likely underestimate their true life-long intake. However, whether their true life-long intake will exceed the TDI is unclear. Since the estimated average estimate
covered already approx. 70% of the TDI, the percentage of persons with an intake exceeding this limit value may not be negligible.
Please note that the average exposure to cadmium in 5- and 6-year-olds was lower than in 7-year-olds (Figure 3, Appendix 7). Due to differences in study design between the food consumption survey in 2- to 6-year-olds and that of the older population, this surprising result is very likely due to methodological issues rather than real differences in exposure. The new DNFCS 2012-2017 that is presently being conducted will cover ages of 1 up to 795, foreclosing possible differences in intake between
age groups due to differences in study design.
The exposure results presented in this report indicate that, given current cadmium concentrations and consumption patterns, the exposure is sufficiently low to conclude that an increased risk of developing kidney failure due to life-long exposure to cadmium via food for the general population is negligible.
4 The average exposure was calculated using version 8 of MCRA (de Boer et al., 2015). Version 7.1 of MCRA
does not support this functionality.
5 www.rivm.nl/Onderwerpen/V/Voedselconsumptiepeiling/Overzicht_voedselconsumptiepeilingen/VCP_Basis_
Conclusions 4.5
The median daily intake exceeded the TDI up to the age of about 10. For the upper 5% of the population, this was true up to the age of about 20 (Figure 1). A risk assessment, based on these outcomes and taking into consideration that the adverse effect of cadmium occurs after life-long exposure to cadmium, showed that on average the higher intake during childhood was compensated by a lower intake at a later age, resulting in life-long exposure estimates that were so low that an increased risk of developing kidney failure due to life-long exposure to cadmium via food is negligible.
In the exposure calculation performed in this study, cadmium concentrations as analysed in monitoring programmes were used, analysed primarily in raw agricultural commodities. For a number of products, such as milk, cereals, vegetables, fruit and potatoes, sufficient cadmium concentration data were available for the intake calculations. However, for a number of other products no concentration data or only limited concentration data were available, including meat, peanut-based products, (processed) cocoa, oil seeds, pineapple, bovine and pig liver, and some frequently consumed fish species, such as pollock, cod, salmon and herring. For products with only limited concentration data, those data were used, whereas for products with no concentration data (meat and cocoa), data from the 2012 EFSA study were used (cocoa) or concentrations were calculated based on concentrations analysed in liver and kidney (meat). Additional data on cadmium concentrations in these products would make it possible to perform more accurate intake calculations.
The outcome of the current refined (for the Dutch situation) dietary cadmium exposure assessment using a national concentration database, a more optimal linking between food consumption and concentration data, and a refined model to assess long-term intake was lower than the results of the 2012 EFSA study.
Acknowledgements
The authors would like to thank Dr. Harald Dik (RIVM) for providing concentration data on cadmium in Dutch tap water, Gerda van
Donkersgoed and Teetske van Gorcum for providing data from the KAP database, and Jacob van Klaveren, Bas Bokkers, Wim Mennes and Piet Wester (RIVM) for their valuable comments on an earlier version of the letter report. RIKILT Wageningen UR is acknowledged for supplying cadmium concentrations in peanut butter.
References
Arnich N, Sirot V, Riviere G, Jean J, Noël J, Guerin T, Leblanc J-C (2012). Dietary exposure to trace elements and health risk assessment in the 2nd French Total Diet Study. Food and Chemical Toxicology 50: 2432-2449.
Boon P, Bonthuis M, Janssen P, te Biesebeek JD, van Donkersgoed G (2010). Risk assessment of exposure to cadmium through food. Bilthoven, Wageningen, RIVM-RIKILT Front Office Food Safety. Boon PE, te Biesebeek JD, de Wit, L, van Donkersgoed, G (2014a). Dietary exposure to dioxins in the Netherlands. RIVM Letter report 2014-0001. Bilthoven, National Institute for Public Health and the Environment (RIVM). Available online: www.rivm.nl.
Boon PE, te Biesebeek JD, Sioen I, Huybrechts I, Moschandreas J,
Ruprich J, Turrini A, Azpiri M, Busk L, Christensen T, Kersting M, Lafay L, Liukkonen K-H, Papoutsou S, Serra-Majem L, Traczyk I, De Henauw S, van Klaveren JD (2012). Long-term dietary exposure to lead in young European children: comparing a pan-European approach with a national exposure assessment. Food Additives and Contaminants Part A 29: 1701-1715.
Boon PE, Ruprich J, Petersen A, Moussavian S, Debegnach F, van
Klaveren JD (2009). Harmonisation of food consumption data format for dietary exposure assessments of chemicals analysed in raw agricultural commodities. Food and Chemical Toxicology 47: 2883-2889.
Boon PE, van der Voet H, Ruprich J, Turrini A, Sand S, van Klaveren JD (2014b). Computational tool for usual intake modelling workable at the European level. Food and Chemical Toxicology 74: 279-288.
de Boer WJ, Goedhart PW, Hart A, Kennedy MC, Kruisselbrink J, Owen H, Roelofs W, van der Voet H (2015). MCRA 8.0 a web-based program for Monte Carlo Risk Assessment. Reference Manual. January 16, 2015. Wageningen, Bilthoven, The Netherlands and York, UK, Biometris, Wageningen UR, National Institute for Public Health and the
Environment (RIVM) and Food and Environmmental Research Agency (Fera).
de Boer WJ, van der Voet H (2010). MCRA 7. A web-based program for Monte Carlo Risk Assessment. Reference Manual 2010-08-25. Bilthoven, Wageningen, Biometris, Wageningen UR and National Institute for Public Health and the Environment (RIVM).
de Boer WJ, van der Voet H, Bokkers BGH, Bakker MI, Boon PE (2009). Comparison of two models for the estimation of usual intake addressing zero consumptions and non-normality. Food Additives and Contaminants Part A 26: 1433-1449.
de Winter-Sorkina R, Bakker MI, van Donkersgoed G, van Klaveren JD (2003). Dietary intake of heavy metals (cadmium, lead and mercury) by the Dutch population. RIVM report 320103001. Bilthoven, National Institute for Public Health and the Environment (RIVM). Available online:
www.rivm.nl.
Efron B (1979). Bootstrap methods: another look at the jackknife. Annals of Statistics 7: 1-26.
Efron B, Tibshirani R (1993). An introduction to the bootstrap. New York: Chapman & Hall.
EFSA (2009). Scientific Opinion of the Panel on Contaminants in the Food Chain on a request from the European Commission on cadmium in food. The EFSA Journal 980:1-139. Available online:
www.efsa.europa.eu.
EFSA (2011). State on tolerable weekly intake for cadmium. The EFSA Journal 9(2): 1975. [19 pp.]. Available online: www.efsa.europa.eu. EFSA (2012). Cadmium dietary exposure in the European population. EFSA Journal 10(1):2551. [37 pp.]. Available online:
www.efsa.europa.eu.
FAO/WHO (2010). Joint FAO/WHO Expert Committee on Food Additives. Seventy-third meeting, Geneva, 8-17 June 2010. Summary and
Conclusions. Issued 24 June 2010. Available online:
www.fao.org/ag/agn/agns/jecfa.
Geurts M, van Rossum CTM, Brants H, Verkaik-Kloosterman J, Westenbrink S (2013). Veranderingen in het aanbod van
voedingsmiddelen en de voedselconsumptie. Resultaten gebaseerd op bijna 25 jaar voedselconsumptieonderzoek. Bilthoven, Rijksinstituut voor Volksgezondheid en Milieu (RIVM). Available online: www.rivm.nl.
Goedhart PW, van der Voet H, Knüppel S, Dekkers ALM, Dodd KW, Boeing H, van Klaveren JD (2012). A comparison by simulation of different methods to estimate the usual intake distribution for
episodically consumed foods. Supporting Publications 2012:EN-299. [65 pp.]. Available online: www.efsa.europa.eu.
Kistemaker C, Hulshof KFAM, Bouman M (1998). De consumptie van groepen voedingsmiddelen naar maaltijdtypering-
Voedselconsumptiepeiling 1997-1998. TNO report V98.809. Zeist, TNO-Voeding.
LEI (2012). Land- en tuinbouwcijfers 2012. Den Haag, Landbouw Economisch Instituut. Available online: www.lei.wur.nl.
Mounicou S, Szpunar J, Andrey D, Blake C, Lobinski R (2003).
Concentrations and bioavailability of cadmium and lead in cocoa powder and related products. Food Additives and Contaminants 20: 343-352.
Ocké MC, Hulshof KFAM, van Rossum CTM (2005). The Dutch national food consumption survey 2003. Methodological issues. Archives of Public Health 63: 227-241.
Ocké MC, van Rossum CTM, Fransen HP, Buurma EJM, de Boer EJ, Brants HAM, Niekerk EM, van der Laan JD, Drijvers JJMM, Ghameshlou Z (2008). Dutch National Food Consumption Survey - Young children 2005/2006. RIVM report 350070001. Bilthoven, National Institute for Public Health and the Environment (RIVM). Available online:
www.rivm.nl.
Oomen AG., Janssen PJCM., Dusseldorp A, Noorlander CW (2008). Exposure to chemicals via house dust. RIVM report 609021064. Bilthoven, National Institute for Public Health and the Environment (RIVM). Available online: www.rivm.nl.
Rose M, Baxter M, Brereton N, Baskaran C. (2012) Dietary exposure to metals and other elements in the 2006 UK Total Diet Study and some trends over the last 30 years. Food Additives and Contaminants Part A 27: 1380-1404.
van Dooren MMH, Boeijen I, van Klaveren JD (1995). Conversie van consumeerbare voedingsmiddelen naar primaire agrarische produkten. RIKILT rapport 95.17. Wageningen, RIKILT-Instituut voor
Voedselveiligheid, Wageningen UR. Available online: www.rikilt.wur.nl. van Klaveren JD, Goedhart PW, Wapperom D, van der Voet H (2012). A European tool for usual intake distribution estimation in relation to data collection by EFSA. Supporting Publications 2012:EN-300. Available online: www.efsa.europe.eu.
van Rossum CTM, Fransen HP, Verkaik-Kloosterman J, Buurma-Rethans EJM, Ocké MC (2011). Dutch National Food Consumption Survey 2007-2010. Diet of children and adults of 7 to 69 years. RIVM report
350050006. Bilthoven, National Institute for Public Health and the Environment (RIVM). Available online: www.rivm.nl.
Appendix 1 Overview of cadmium concentrations (mg/kg)
used in the dietary exposure assessment: minimum (Min),
maximum (Max) and mean in the lower (LB), medium (MB)
and upper bound (UB) scenario
Product name N % Positive
samples Min Cadmium concentration (mg/kg) Max Mean LB Mean MB Mean UB DRINKING WATER TAP WATER 781 1.4 <0.000 0.0001 0.000 0.000 0.000155 DAIRY MILK 186 0 <0.001 <0.002 0.000 0.000 0.001625 MEAT BEEF 106 99.4 0.0001 0.0896 0.004 0.004 0.0047 PORK 192 99.3 <0.007 0.0134 0.001 0.001 0.0020 MUTTON 60 98.3 <0.000 0.0194 0.002 0.002 0.0021 HORSE 74 87.8 <0.005 0.3358 0.072 0.072 0.0729 CHICKEN 804 93.4 <0.032 0.0871 0.001 0.001 0.0014 TURKEY 32 100 0.0002 0.0071 0.003 0.003 0.0030 OSTRICH 8 25 <0.015 0.1100 0.031 0.033 0.0363 GAME RABBIT 7 100 0.0005 0.0037 0.001 0.001 0.0013 WILD PIG 88 23.9 <0.005 0.0220 0.002 0.003 0.0058 DUCK 69 75 <0.005 0.0110 0.005 0.005 0.0064 PIGEON 47 70.3 <0.005 0.0730 0.014 0.015 0.0161 HARE 141 97.3 <0.005 0.0645 0.007 0.007 0.0078 FISH & SEA FOOD
GURNARD 14 28.5 <0.005 0.0400 0.005 0.007 0.0093 REDFISH 12 0 <0.004 <0.025 0.000 0.011 0.0232 EEL. RED 113 32.7 <0.005 0.1700 0.006 0.008 0.0098 RAY 2 0 <0.005 <0.005 0.000 0.002 0.0050 HERRING 25 60 <0.025 0.0450 0.008 0.009 0.01108 ANCHOVY 27 92.6 <0.005 0.4500 0.113 0.113 0.1135 SARDINES 65 84.6 <0.200 0.1820 0.039 0.041 0.043953 SPRAT 1 0 <0.004 <0.004 0.000 0.002 0.0040 MACKEREL 35 57.1 <0.025 0.060 0.011 0.014 0.017114 TUNA 231 54.9 <0.200 0.080 0.016 0.021 0.027242 SWORDFISH 46 90 <0.025 0.416 0.114 0.115 0.116695 COD 54 5.6 <0.005 0.8100 0.016 0.018 0.0207 POLLOCK 7 14.3 <0.025 0.0250 0.003 0.007 0.010571 HADDOCK 11 18 <0.005 0.0270 0.002 0.004 0.0068 WHITING 2 0 <0.005 <0.025 0.000 0.007 0.0150 FLOUNDER 32 28.1 <0.005 0.1190 0.009 0.011 0.0134 PLAICE 61 31.2 <0.005 0.0250 0.007 0.009 0.0111
Product name N % Positive samples
Cadmium concentration (mg/kg) Min Max Mean
LB Mean MB Mean UB SOLE 30 30 <0.005 0.0250 0.007 0.009 0.0109 LEMON SOLE 4 75 <0.100 0.0250 0.018 0.031 0.0438 SALMON 25 12 <0.005 0.0070 0.000 0.002 0.0048 TROUT 27 11.1 <0.005 0.0200 0.001 0.003 0.0059 PERCH 31 12.9 <0.005 0.0300 0.002 0.004 0.0069 PERCH NILE 15 0 <0.005 <0.025 0.000 0.005 0.010333 PIKE PERCH 31 3 <0.025 0.0250 0.000 0.003 0.00681 TILAPIA 21 0 <0.004 <0.025 0.000 0.012 0.0240 SEAWOLF 13 0 <0.005 <0.025 0.000 0.011 0.02348 CRAB 9 100 0.0400 0.3000 0.121 0.121 0.1212 LOBSTER 1 100 0.0200 0.0200 0.020 0.020 0.0200 SHRIMPS 50 84 <0.025 0.339 0.034 0.034 0.03556 CUTTLE FISH 25 100 0.0200 2.3380 0.569 0.569 0.5696 MUSSEL 74 93.2 <0.005 0.3100 0.069 0.069 0.0694 OYSTERS 16 100 0.0400 0.6180 0.205 0.205 0.2055 OTHER FISH 230 54 <0.025 18 0.119 0.121 0.12297 CEREALS WHEAT 252 92.4 <0.100 0.1300 0.040 0.043 0.0472 RYE 3 0 <0.100 <0.100 0.000 0.050 0.1000 MAIZE 1 0 <0.100 <0.100 0.000 0.050 0.1000 RICE 118 100 0.0110 0.1100 0.033 0.033 0.0335 MILLET 8 100 0.0110 0.0330 0.020 0.020 0.0200 BUCKWHEAT 4 100 0.0240 0.0300 0.026 0.026 0.0265 LEGUMES, NUTS AND OIL SEEDS
GREEN PEAS 8 12.5 <0.005 0.0030 0.000 0.002 0.0044 LEGUME 4 0 <0.005 <0.005 0.000 0.002 0.0050 CHICK PEA 2 100 0.0160 0.0180 0.017 0.017 0.0170 BROAD BEAN 2 0 <0.005 <0.005 0.000 0.002 0.0050 STRING BEAN 6 0 <0.005 <0.005 0.000 0.002 0.0050 BEAN 2 100 0.0110 0.1000 0.055 0.055 0.0555 GREEN BEANS 17 41.2 <0.005 0.0060 0.001 0.002 0.0040 LENTILS 7 85.8 <0.005 0.0200 0.012 0.012 0.0131 SOY BEAN 18 100 0.0110 0.0810 0.032 0.032 0.0322 MARROWFAT PEA 1 0 <0.005 <0.005 0.000 0.002 0.0050 FLAGEOLET 2 0 <0.200 <0.200 0.000 0.100 0.2000 BROWN BEAN 1 0 <0.005 <0.005 0.000 0.002 0.0050 LINSEED 15 100 0.0450 0.1500 0.083 0.083 0.0838 RAPE SEED 2 100 0.0130 0.0720 0.042 0.042 0.0425 SESAME SEED 7 100 0.0160 0.0380 0.025 0.025 0.0259 SUNFLOWER 6 100 0.0530 0.0990 0.080 0.080 0.0800 PUMPKIN KERNEL 1 100 0.0110 0.0110 0.011 0.011 0.0110 PEANUT 8 100 0.0540 0.4200 0.268 0.268 0.2680 HAZELNUT 1 100 0.0110 0.0110 0.011 0.011 0.0110
Product name N % Positive samples
Cadmium concentration (mg/kg) Min Max Mean
LB Mean MB Mean UB
COCONUT 8 62.5 <0.025 0.0310 0.013 0.018 0.0231 PEANUT BUTTER 20 100 0.0150 0.3010 0.068 0.068 0.0684
STARCHY ROOTS & TUBERS
POTATOES 100 95 <0.005 0.1170 0.022 0.022 0.0229 VEGETABLES CHICORY 1 0 <0.005 <0.005 0.000 0.002 0.0050 ENDIVE 68 100 0.0070 0.1930 0.041 0.041 0.0414 CURLED ENDIVE 1 0 <0.010 <0.010 0.000 0.005 0.0100 FRISEE ENDIVE 9 66.7 <0.050 0.1300 0.041 0.045 0.0489 ICEBERG 60 41.7 <0.050 0.0330 0.006 0.010 0.0146 COS LETTUCE 31 88.9 <0.010 0 0.1086 0.0269 0.0277 0.0285 CURLY LETTUCE 1 100 0.0690 0.0690 0.069 0.069 0.0690 LOLLO ROSSA 21 85.8 <0.050 0.0860 0.033 0.034 0.0364 BATAVIA 14 78.6 <0.010 0.0600 0.020 0.021 0.0229 RUCOLA 11 91 <0.010 0.0600 0.030 0.030 0.0309 CELERY LEAVES 2 100 0.0910 0.2120 0.151 0.151 0.1515 SPINACH 71 100 0.0060 0.2710 0.082 0.082 0.0820 RHUBARB 2 100 0.0100 0.0320 0.021 0.021 0.0210 RADICCHIO 5 40 <0.010 0.0100 0.004 0.007 0.0100 OAKLEAF 3 100 0.0480 0.1620 0.096 0.096 0.0969 LAMBS LETTUCE 3 33 <0.005 0.1780 0.059 0.061 0.0627 TURNIP 2 100 0.0390 0.0680 0.053 0.053 0.0535 ASPARAGUS 4 25 <0.005 0.0020 0.000 0.002 0.0043 BLEACH CELERY 3 100 0.0160 0.0200 0.018 0.018 0.0180 GLASSWORT 2 0 <0.050 <0.050 0.000 0.025 0.0500 BROCCOLI 9 88.9 <0.005 0.0380 0.012 0.012 0.0132 CAULIFLOWER 9 77.8 <0.005 0.0140 0.006 0.006 0.0071 RED CABBAGE 16 68.8 <0.005 0.0110 0.003 0.004 0.0054 WHITE CABBAGE 10 40 <0.005 0.0090 0.002 0.003 0.0054 BRUSSELS 10 70 <0.050 0.0100 0.005 0.010 0.0156 KALE 18 100 0.0074 0.0530 0.020 0.020 0.0208 CHINESE 16 93.4 <0.005 0.1000 0.040 0.040 0.0406 SAVOY CABBAGE 3 100 0.0060 0.0090 0.007 0.007 0.0070 OXHEART 4 75 <0.005 0.0060 0.004 0.005 0.0058 SHALLOT 1 100 0.0090 0.0090 0.009 0.009 0.0090 ONION 30 90 <0.005 0.0270 0.008 0.009 0.0094 LEEK 45 100 0.0040 0.0790 0.031 0.031 0.0314 GARLIC 2 100 0.0170 0.0200 0.018 0.018 0.0185 CHIVES 1 100 0.0180 0.0180 0.018 0.018 0.0180 WINTER CARROT 7 100 0.0071 0.1330 0.043 0.043 0.0432 CARROT 77 83.1 <0.010 0.1080 0.030 0.030 0.0314 BEETROOT 27 88.9 <0.050 0.0530 0.016 0.017 0.0185 SCORZONERA 2 100 0.0110 0.0700 0.040 0.040 0.0405
Product name N % Positive samples
Cadmium concentration (mg/kg) Min Max Mean
LB Mean MB Mean UB RADISH 5 80 <0.005 0.0110 0.005 0.006 0.0066 BLACK RADISH 1 100 0.0050 0.0050 0.005 0.005 0.0050 SWEDE 1 100 0.0090 0.0090 0.009 0.009 0.0090 CELERIAC 1 100 0.0930 0.0930 0.093 0.093 0.0930 CUCUMBER 37 2.7 <0.050 0.0060 0.000 0.003 0.0069 TOMATO 84 11.9 <0.050 0.0300 0.001 0.005 0.010428 BEEF TOMATO 16 6.2 <0.050 0.0100 0.000 0.007 0.0150 AUBERGINE 4 50 <0.005 0.0270 0.008 0.009 0.0108 COURGETTE 5 20 <0.003 0.0020 0.000 0.001 0.0024 SWEET CORN 1 100 0.0090 0.0090 0.009 0.009 0.0090 SWEET PEPPER 11 27.3 <0.005 0.0130 0.002 0.004 0.0059 OKRA 3 100 0.0050 0.0100 0.008 0.008 0.0083 PEPPERS (FRESH) 7 85.8 <0.005 0.0260 0.013 0.013 0.0143 MUSHROOM 1 0 <0.010 <0.010 0.000 0.005 0.0100 BEAN SPROUTS 1 0 <0.010 <0.010 0.000 0.005 0.0100 STRING BEAN 1 0 <0.005 <0.005 0.000 0.002 0.0050 PAC CHOY 1 100 0.0220 0.0220 0.022 0.022 0.0220 SEAWEED 56 100 0.1000 14.500 1.232 1.232 1.2323 FRUIT BANANA 5 0 <0.003 <0.005 0.000 0.002 0.0046 DATE 1 100 0.0070 0.0070 0.007 0.007 0.0070 FIG 2 100 0.0290 0.0340 0.031 0.031 0.0315 PINEAPPLE 6 50 <0.005 0.4550 0.190 0.191 0.1920 KIWI FRUIT 2 50 <0.005 0.0020 0.001 0.002 0.0035 MANGO 3 33.3 <0.005 0.0120 0.005 0.005 0.0067 PASSIONFRUIT 1 100 0.0170 0.0170 0.017 0.017 0.0170 MELON 4 50 <0.005 0.0200 0.005 0.006 0.0078 PAPAYA 3 0 <0.001 <0.005 0.000 0.001 0.00367 APPLE 58 1.7 <0.005 0.0020 0.000 0.002 0.0049 PEAR 11 72.7 <0.005 0.0200 0.009 0.009 0.0104 APRICOT 1 0 <0.003 <0.003 0.000 0.001 0.0030 NECTARINE 5 0 <0.005 <0.005 0.000 0.002 0.0050 PEACH 5 0 <0.005 <0.005 0.000 0.002 0.0050 PLUM 5 0 <0.003 <0.003 0.000 0.001 0.0030 AVOCADO 2 50 <0.005 0.0030 0.001 0.002 0.0040 OLIVE 3 0 <0.005 <0.005 0.000 0.002 0.0050 TABLE GRAPE 58 0 <0.002 <0.005 0.000 0.002 0.0049 STRAWBERRY 50 52 <0.005 0.1200 0.007 0.008 0.0093 RASPBERRY 14 92.8 <0.005 0.0820 0.042 0.042 0.0427 BLACKBERRY 17 94.2 <0.005 0.0220 0.012 0.013 0.0132 BLUE BERRY 2 50 <0.005 0.0020 0.002 0.002 0.0035 ELDERBERRY 1 100 0.0120 0.0120 0.012 0.012 0.0120 CRANBERRY 6 100 0.0670 0.1200 0.092 0.092 0.0927
Product name N % Positive samples
Cadmium concentration (mg/kg) Min Max Mean
LB Mean MB Mean UB BLUEBERRY 12 83.4 <0.005 0.0760 0.027 0.028 0.0288 RED CURRANT 4 100 0.0370 0.0470 0.041 0.041 0.0415 ORANGE 8 0 <0.002 <0.005 0.000 0.002 0.0046 MANDARIN 2 0 <0.010 <0.010 0.000 0.005 0.0100 GRAPEFRUIT 2 0 <0.002 <0.005 0.001 0.002 0.0035 OFFAL BOVINE LIVER 354 99.4 <0.001 0.9948 0.122 0.122 0.1221 LIVER OF PIG 192 99.3 <0.001 0.4195 0.059 0.059 0.0593 LIVER OF HORSE 23 100 0.0694 10.410 3.212 3.212 3.2127 KIDNEY OF 23 100 0.3000 45.000 13.88 13.88 13.88700 LIVER OF VEAL 359 99.7 <0.001 0.8097 0.068 0.068 0.0684 LIVER OF DUCK 213 100 0.0210 2.6000 0.246 0.246 0.2460 LIVER OF DEER 76 100 0.0023 0.7866 0.198 0.198 0.1987 DIETARY FAT MARGARINE/OIL/ 14 0 <0.020 <0.020 0.000 0.010 0.0200 FAT OF BEEF 1 0 <0.020 <0.020 0.000 0.010 0.0200 PORCINE FAT 12 0 <0.020 <0.020 0.000 0.010 0.0200 FAT OF HEN 1 0 <0.020 <0.020 0.000 0.010 0.0200 PALM OIL 49 2.0 <0.020 0.0100 0.000 0.006 0.0131 SOYBEAN OIL 13 23.1 <0.020 0.2230 0.019 0.026 0.0333 COCONUT OIL 1 0 <0.020 <0.020 0.000 0.010 0.0200 COCONUT FAT 1 0 <0.020 <0.020 0.000 0.010 0.0200 FRYING FAT 5 0 <0.020 <0.020 0.000 0.010 0.0200 VEGETABLE OILS 3 0 <0.020 <0.020 0.000 0.010 0.0200 HERBS & SPICES
OTHER FRESH 2 100 0.2860 0.2990 0.292 0.292 0.2925 OTHERS COCOA BEANS 1 100 0.0130 0.0130 0.001 0.001 0.0013 COCOA POWDER 1 100 0.1850 0.1850 0.185 0.185 0.1850 HONEY 12 25 <0.005 0.0200 0.004 0.006 0.0076 TEA 79 0 <0.010 <0.080 0.000 0.005 0.011942
Appendix 2 Normality of the lognormal transformed
long-term dietary exposure distributions to cadmium for young
children aged 2 to 6 and population aged 7 to 69 in the
Netherlands in which samples with a cadmium concentration
below the limit of detection (LOD) or quantification (LOQ)
equalled ½LOD or ½LOQ (medium bound scenario)
Young children aged 2 to 6 years
age in young children aged 2 to 6 and the population aged 7 to 69 in the Netherlands following
three scenarios of assigning concentrations to samples with cadmium concentrations below limit of
detection (LOD) or quantification (LOQ)
Young-children 2-6 years Age
(years) Percentiles of exposure per scenario (µg/kg bw per day) LB1 MB2 UB3
P50 P95 P50 P95 P50 P95 2 0.46 [0.42-0.51] 0.68 [0.62-0.77] 0.55 [0.53-0.61] 0.81 [0.75-0.88] 0.67 [0.64-0.71] 0.97 [0.90-1.03] 3 0.43 [0.39-0.46] 0.64 [0.58-0.70] 0.51 [0.47-0.54] 0.74 [0.67-0.79] 0.60 [0.56-0.62] 0.86 [0.79-0.91] 4 0.40 [0.35-0.43] 0.59 [0.51-0.64] 0.47 [0.43-0.49] 0.68 [0.62-0.72] 0.54 [0.51-0.58] 0.79 [0.73-0.83] 5 0.37 [0.34-0.42] 0.55 [0.50-0.63] 0.44 [0.41-0.49] 0.63 [0.59-0.71] 0.51 [0.48-0.55] 0.72 [0.69-0.80] 6 0.34 [0.32-0.37] 0.51 [0.47-0.57] 0.40 [0.37-0.44] 0.58 [0.53-0.64] 0.49 [0.44-0.51] 0.67 [0.63-0.74]
Note: 2.5% lower – 97.5% upper confidence limits of the percentiles of exposure are reported between brackets.
1 LB = lower bound, samples with a cadmium concentration below LOD and LOQ were assumed to contain no cadmium.
2 MB = medium bound, samples with a cadmium concentration below LOD and LOQ were assigned a cadmium concentration equal to ½LOD or
½LOQ.