Dit is een uitgave van:
Rijksinstituut voor Volksgezondheid en Milieu
Postbus 1 | 3720 ba bilthoven www.rivm.nl
Environmental risk limits for
phenanthrene
RIVM Letter report 601357007/2011 E.M.J. Verbruggen| R. van Herwijnen
Colofon
© RIVM 2011
Parts of this publication may be reproduced, provided acknowledgement is given to the 'National Institute for Public Health and the
Environment', along with the title and year of publication.
E.M.J. Verbruggen
R. van Herwijnen
Contact:
R. van Herwijnen
Expertise Centre for Substances
rene.van.herwijnen@rivm.nl
This investigation has been performed by order and for the account of Directorate-General for Environmental Protection, Directorate
Environmental Safety and Risk Management, within the framework of the project 'International and National Environmental Quality Standards for Substances in the Netherlands' (INS)
Abstract
Environmental risk limits for phenanthrene
RIVM has derived environmental risk limits (ERLs) for phenanthrene. This derivation has been performed because the current ERLs have not been derived according to the current valid methodology. Phenanthrene is a substance belonging to the group of PAHs and is included in the Dutch decree on water quality objectives in the context of the Water Framework Directive (WFD). The ERLs in this report are advisory values that serve as a scientific background for the Dutch Steering Committee for Substances, which is responsible for setting those standards. The maximum permissible concentration in water (MPCwater) is the level at which no harmful effects are expected, based on annual
concentrations. This MPC is based on three routes: direct toxicity, secondary poisoning and consumption of fish by humans. Direct toxicity is the most critical of these three routes and determines the overall MPC for fresh- and saltwater (1.1 microgram per liter). The Maximum Acceptable Concentration (MACwater, eco), that protects the ecosystem from effects of short term concentration peaks, is 6.7 microgram per liter for fresh- and saltwater.
The newly derived ERLs for water, suspended matter and sediment are higher than the currently valid ERLs. These differences are due to a more extensive dataset on ecotoxicology in combination with the more recent methodology for derivation of ERLs. Monitoring data indicate that the new MPC and MACeco for water, suspended matter and sediment are not being exceeded. In this observation, mixture toxicity for the total of PAHs has not been included.
Trefwoorden / Key words:
environmental risk limits, maximum permissible concentration, negligible concentration, phenanthrene
Rapport in het kort
Milieurisicogrenzen voor fenantreen
Het RIVM heeft in opdracht van het ministerie van Infrastructuur en Milieu (I&M), milieurisicogrenzen voor fenantreen bepaald. Dit was nodig omdat de huidige norm voor fenantreen voor waterkwaliteit niet is afgeleid volgens de meest recente methodiek. Fenantreen is een stof die behoort tot de stofgroep PAK’s. De stof is opgenomen in de Regeling Monitoring Kader Richtlijn Water, waarin staat aan welke eisen
oppervlaktewater in Nederland moet voldoen. De Stuurgroep Stoffen stelt de nieuwe normen vast op basis van de wetenschappelijke advieswaarden in dit rapport.
Het Maximaal Toelaatbaar Risiconiveau (MTR) is de concentratie in water waarbij geen schadelijke effecten te verwachten zijn, gebaseerd op jaargemiddelde concentraties. Hiervoor zijn drie routes onderzocht: directe effecten op waterorganismen, indirecte effecten op vogels en zoogdieren via het eten van prooidieren, en indirecte effecten op mensen via het eten van vis. De eerste van de drie levert de laagste waarde en bepaalt daarmee het MTR voor zoet- en zoutwater (1,1 microgram per liter). De Maximaal Aanvaardbare Concentratie (MACwater, eco), die het ecosysteem beschermt tegen kortdurende concentratiepieken, is 6,7 microgram per liter.
De nieuw afgeleide milieurisicogrenzen voor water, in water zwevend stof en sediment zijn hoger dan de nu geldende milieurisicogrenzen. Dit komt doordat er meer gegevens beschikbaar zijn over de directe effecten van fenantreen op waterorganismen en door het gebruik van een nieuwere methodiek. Gebaseerd op monitoringsgegevens worden de nieuwe MTR en MACeco voor water, zwevend stof en sediment naar verwachting niet overschreden. Bij deze beoordeling is de giftige aard voor het totaal aantal PAK’s nog niet in beschouwing genomen.
Trefwoorden:
milieukwaliteitsnormen, milieurisicogrenzen, maximaal toelaatbaar risiconiveau, verwaarloosbaar risiconiveau, fenantreen
Contents
Summary—9 1 Introduction—11 1.1 Project framework—11 1.2 Current MPCs—12 1.3 Sources of phenanthrene—12 1.4 Methodology—121.5 Status of the results—14
2 Substance properties, fate human toxicology and trigger
values—15
2.1 Identity—15
2.2 Physicochemical properties—15
2.3 Bioconcentration and biomagnification—15
2.4 Human toxicological threshold limits and carcinogenicity—17 2.5 Trigger values—17
3 Toxicity data and derivation of ERLs for water—19
3.1 Toxicity data—19
3.2 Treatment of fresh- and saltwater toxicity data—20 3.3 Derivation of MPCfw and MPCsw—20
3.4 Derivation of MPCdw, hh—21 3.5 Derivation of MACeco—21 3.6 Derivation of the NC—22
3.7 Derivation of the SRCwater, eco—23 3.8 Lipid approach—23
4 Toxicity data and derivation of ERLs for sediment—25
4.1 Toxicity data—25
4.2 Derivation of MPCsediment—25 4.3 Derivation of NCsediment—25 4.4 Derivation of SRCsediment, eco—25 4.5 Lipid approach—26
5 Toxicity data and derivation of ERLs for soil—27
5.1 Toxicity data—27 5.2 Derivation of MPCsoil—27 5.3 Derivation of NCsoil—28 5.4 Derivation of SRCsoil, eco—28 5.5 Lipid approach—28
6 Derivation of ERLs for groundwater—29
6.1 Derivation of MPCgw—29 6.2 Derivation of NCgw—29 6.3 Derivation of SRCgw, eco—29
7 Derivation of ERLs for air—31
7.1 Derivation of MPCair—31 7.2 Derivation of NCair—31
9 Conclusions—35 References—37
Summary
Environmental risk limits are derived using ecotoxicological, physicochemical, and human toxicological data. They represent environmental concentrations of a substance offering different levels of protection to man and ecosystems. It should be noted that the ERLs are scientifically derived values. They serve as advisory values for the Dutch Steering Committee for Substances, which is appointed to set the Environmental Quality Standards (EQSs) from these ERLs. ERLs should thus be considered as preliminary values that do not have an official status.
This report contains ERLs for phenanthrene in water, groundwater, sediment and soil. The following ERLs are derived: Negligible Concentration (NC), Maximum Permissible Concentration (MPC), Maximum Acceptable Concentration for ecosystems (MACeco), and Serious Risk Concentration for ecosystems (SRCeco). The risk limits were mostly based on data presented in the RIVM report “Environmental risk limits for polycyclic aromatic hydrocarbons (PAHs)” (Verbruggen, in prep.).
For the derivation of the MPC and MACeco for water and the MPC for sediment, the methodology used is in accordance with the Water Framework Directive. For the derivation of ERLs for air, no specific guidance is available. However, as much as possible the basic principles underpinning the ERL derivation for the other compartments are followed for the derivation of atmospheric ERL. For the MPCs for soil, and the NCs and the SRCseco in general, the guidance developed for the project ‘International and National Environmental Quality Standards for Substances in the Netherlands’ was used (Van Vlaardingen and Verbruggen, 2007). An overview of the derived environmental risk limits is given in Table 1. The MPCs for water and suspended matter are higher than the current EQSs, in which the routes secondary poisoning and fish consumption were not included. The MPC for sediment is higher than the current EQS. These differences are due to a more extensive dataset on ecotoxicology in combination with the more recent methodology for derivation of ERLs.
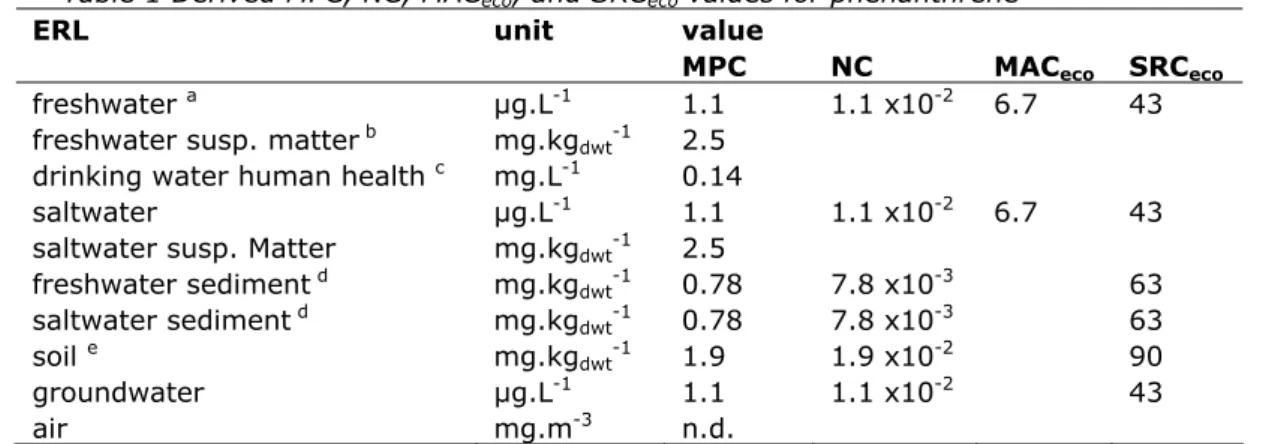
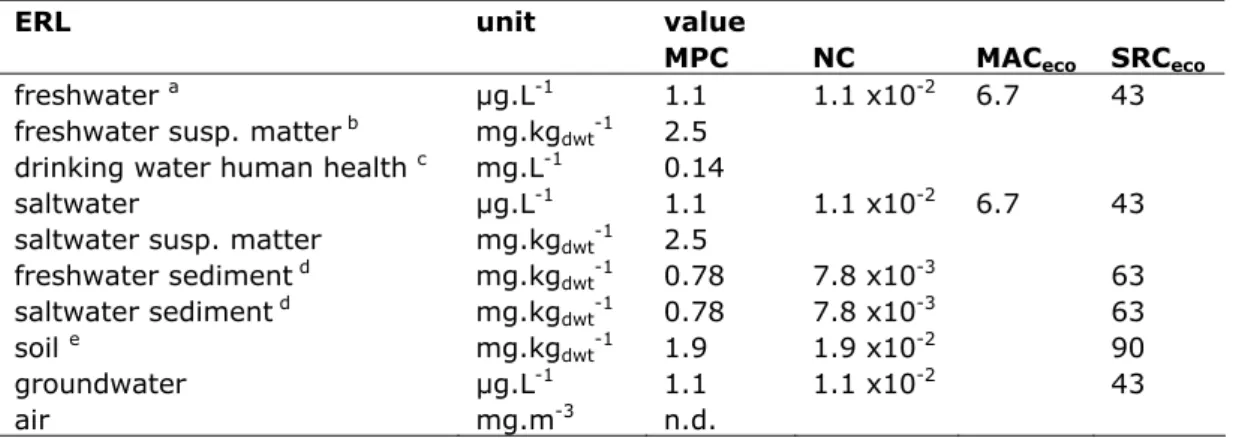
Table 1 Derived MPC, NC, MACeco, and SRCeco values for phenanthrene
ERL unit value
MPC NC MACeco SRCeco
freshwater a µg.L-1 1.1 1.1 x10⁻² 6.7 43
freshwater susp. matter b mg.kgdwt-1 2.5
drinking water human health c mg.L-1 0.14
saltwater µg.L-1 1.1 1.1 x10⁻² 6.7 43
saltwater susp. Matter mg.kgdwt-1 2.5
freshwater sediment d mg.kgdwt-1 0.78 7.8 x10⁻³ 63 saltwater sediment d mg.kgdwt-1 0.78 7.8 x10⁻³ 63 soil e mg.kgdwt-1 1.9 1.9 x10⁻² 90 groundwater µg.L-1 1.1 1.1 x10⁻² 43 air mg.m-3 n.d. a From the MPC
fw, eco, MPCfw, secpois and MPCfw, hh food the lowest one is selected as the ‘overall’
MPCwater.
b Expressed on the basis of Dutch standard suspended matter. c As stated in the new WFD guidance, the MPC
dw, hh is not included in the selection of the
final MPCfw. Therefore, the MPCdw, hh is presented as a separate value. d Expressed on the basis of Dutch standard sediment.
e Expressed on the basis of Dutch standard soil.
Monitoring data for phenanthrene indicate that currently the NCwater derived in this report is exceeded in all Dutch surface waters and that the MPCsusp, water and MPCsusp, sw are likely to be exceeded at many locations. Also, the MPCsediment could be exceeded in some cases and the NCsediment is likely to be exceeded in most cases. For this observation, the additive mixture toxicity for all PAHs has not been taken into account.
1
Introduction
1.1 Project framework
In this report environmental risk limits (ERLs) for surface water (freshwater and marine), soil, groundwater and air are derived for phenanthrene. Phenanthrene is listed in the Dutch decree on WFD-monitoring (Regeling monitoring
Kaderrichtlijn water) as a specific pollutant. The aim of this report is to present
updated risk limits that can be used to set water quality standards in accordance with the WFD. Phenanthrene is relevant for other compartments as well,
therefore, ERLs for soil and air have also been derived. MPCs for direct
ecotoxicity have already been derived by Verbruggen (in prep.). Additional ERLs, including those considering secondary poisoning and human health through fish consumption, are derived in this report. The derivation of the ERLs is performed in the context of the project National Policy on Substances. The following ERLs are considered:
- Maximum Permissible Concentration (MPC) – defined in VROM (1999, 2004) as the standard based on scientific data which indicates the concentration in an environmental compartment for which:
1 no effect to be rated as negative is to be expected for ecosystems;
2a no effect to be rated as negative is to be expected for humans (for non-carcinogenic substances);
2b for humans no more than a probability of 10-6 per year of death can be calculated (for carcinogenic substances). Within the scope of the Water Framework Directive (WFD), a probability of 10-6 on a life-time basis is used.
The MPCs for water and soil should not result in risks due to secondary poisoning (considered as part of the ecosystem in the definition above) and/or risks for human health aspects. These aspects are therefore also addressed in the MPC derivation. Separate MPC-values are derived for the freshwater and saltwater environment.
- Negligible Concentration (NC) – the concentration at which effects to ecosystems are expected to be negligible and functional properties of ecosystems are safeguarded fully. It defines a safety margin which should exclude combination toxicity. The NC is derived by dividing the MPC by a factor of 100.
- Maximum Acceptable Concentration (MACeco) for aquatic ecosystems – the concentration protecting aquatic ecosystems from effects due to short-term exposure or concentration peaks. The MACeco is derived for freshwater and saltwater ecosystems.
- Serious Risk Concentration for ecosystems (SRCeco) – the concentration in water at which possibly serious ecotoxicological effects are to be expected. This value should be compared with the Serious Risk Concentration for humans (SRChuman), which is not derived elsewhere (Lijzen et al., 2001). - Maximum Permissible Concentration for surface water that is used for
water that meets the requirements for use of surface water for drinking water production. The MPCdw, hh specifically refers to locations that are used for drinking water abstraction.
The quality standards in the context of the WFD refer to the absence of any impact on community structure of aquatic ecosystems. Hence, not the potential to recover after transient exposure, but long-term undisturbed function is the protection objective under the WFD. Recovery in a test situation, after a limited exposure time, is therefore not included in the derivation of the MPC and MAC.
1.2 Current MPCs
The current MPCs for phenanthrene are 0.3 µg.L-1 for water, 1 mg.kg
dwt-1 for suspended matter and 0.5 mg.kgdwt-1 for sediment. The derivation of these values is reported by Kalf et al. (1995). For air there is an indicative MPC of 9.6 ng.m-3. Derivation of this value is described by Hansler et al. (2008).
1.3 Sources of phenanthrene
There is no production of phenanthrene as a pure product. Phenanthrene, like most other polycyclic aromatic hydrocarbons (PAHs), is however present in fossil fuels and derived products; human use of these products is one of the main sources of phenanthrene in the environment. Other important anthropogenic sources are industrial processes, such as iron steel works, coke manufacturing, asphalt production, wood preservation, ship protection and petroleum cracking. Most of these industries have however improved their processes or reduced or stopped the use of PAH containing products and current emissions are highly reduced as compared to the past. Apart from anthropogenic sources, there are also natural sources like vegetation fires and volcanic emissions.
1.4 Methodology
The methodology for risk limit derivation is described in detail in the INS-guidance document (Van Vlaardingen and Verbruggen, 2007), which is further referred to as the INS-Guidance. The methodology is based on the Technical Guidance Document (TGD), issued by the European Commission and developed in support of the risk assessment of new notified chemical substances, existing substances and biocides (EC, 2003) and on the Manual for the derivation of Environmental Quality Standards in accordance with the Water Framework Directive (Lepper, 2005). The European guidance under the framework of WFD has been revised, and the updated guidance has been published recently (EC, 2011). The risk limits in this report will be used for setting water quality standards that will become effective after the new guidance has come in to force. Therefore, the terminology is harmonised as much as possible and the new guidance is followed in the case it deviates from the INS-guidance. This specifically applies to the derivation of the MAC (see section 3.5), for which the new methodology is used. This also holds for the MPC for surface waters
intended for the abstraction of drinking water (MPCdw, hh, see section 3.4). In the INS-guidance, this is one of the MPCs from which the lowest value should be selected as the general MPCwater (see section 3.1.6 and 3.1.7 of the INS-Guidance). According to the new guidance, the MPCdw, hh is not taken into account for the derivation of the general MPCwater, but specifically refers to locations that are used for drinking water abstraction. For the derivation of ERLs for air, no specific guidance is available. However, as much as possible, the
basic principles underpinning the ERL derivation for the other compartments are followed for the derivation of an atmospheric ERL.
1.4.1 Data sources
The RIVM report “Environmental risk limits for polycyclic aromatic hydrocarbons (PAHs)” (Verbruggen, in prep.) is used as the source of physicochemical and (eco)toxicity data. Information given in this report is checked thoroughly and approved by the scientific committee of the project 'International and National Environmental Quality Standards for Substances in the Netherlands' (INS). Therefore, no additional evaluation of data is performed for the ERL derivation. Only valid data combined in an aggregated data table are presented in the current report. Occasionally, key studies are discussed when relevant for the derivation of a certain ERL. Since in the report of Verbruggen only ERLs for direct toxicity are reported, the additional ERLs to be derived according to the INS guidance are derived in this report.
1.4.2 Data evaluation
Ecotoxicity studies were screened for relevant endpoints (i.e. those endpoints that have consequences at the population level of the test species) and thoroughly evaluated with respect to the validity (scientific reliability) of the study. A detailed description of the evaluation procedure is given in section 2.2.2 and 2.3.2 of the INS-Guidance and in the Annex to the draft EQS-guidance under the WFD. In short, the following reliability indices were assigned, based on Klimisch et al. (1997):
Ri 1: Reliable without restriction
’Studies or data … generated according to generally valid and/or internationally accepted testing guidelines (preferably performed according to GLP) or in which the test parameters documented are based on a specific (national) testing guideline … or in which all parameters described are closely related/comparable to a guideline method.’
Ri 2: Reliable with restrictions
’Studies or data … (mostly not performed according to GLP), in which the test parameters documented do not totally comply with the specific testing guideline, but are sufficient to accept the data or in which investigations are described which cannot be subsumed under a testing guideline, but which are nevertheless well documented and scientifically acceptable.’
Ri 3: Not reliable
’Studies or data … in which there are interferences between the measuring system and the test substance or in which organisms/test systems were used which are not relevant in relation to the exposure (e.g., unphysiologic pathways of application) or which were carried out or generated according to a method which is not acceptable, the documentation of which is not sufficient for an assessment and which is not convincing for an expert judgment.’
Ri 4: Not assignable
’Studies or data … which do not give sufficient experimental details and which are only listed in short abstracts or secondary literature (books, reviews, etc.).’
Citations
In case of (self-)citations, the original (or first cited) value is considered for further assessment, and an asterisk is added to the Ri of the endpoint that is cited.
All available studies are summarised in data-tables that are included as Annexes to this report. These tables contain information on species characteristics, test conditions and endpoints. Explanatory notes are included with respect to the assignment of the reliability indices. In the aggregated data table only one effect value per species is presented. When for a species several effect data are available, the geometric mean of multiple values for the same endpoint is calculated where possible. Subsequently, when several endpoints are available for one species, the lowest of these endpoints (per species) is reported in the aggregated data table.
1.5 Status of the results
The results presented in this report have been discussed by the members of the scientific advisory group for the INS-project (WK-INS). It should be noted that the ERLs in this report are scientifically derived values, based on
(eco)toxicological, fate and physicochemical data. They serve as advisory values for the Dutch Steering Committee for Substances, which is appointed to set the Environmental Quality Standards (EQSs). ERLs should thus be considered as advisory values that do not have an official status.
2
Substance properties, fate human toxicology and trigger
values
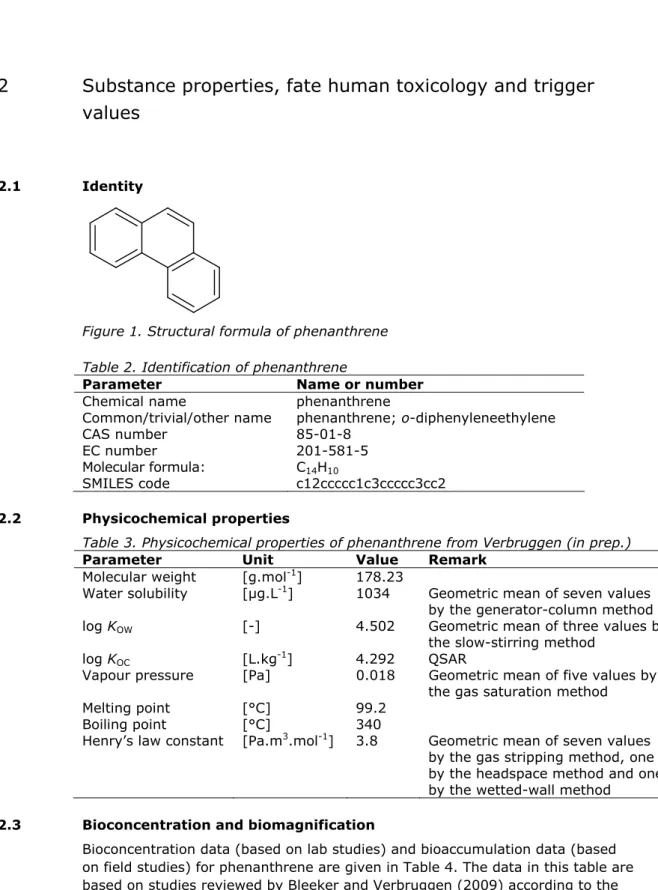
2.1 Identity
Figure 1. Structural formula of phenanthrene Table 2. Identification of phenanthrene
Parameter Name or number
Chemical name phenanthrene
Common/trivial/other name phenanthrene; o-diphenyleneethylene
CAS number 85-01-8
EC number 201-581-5
Molecular formula: C14H10
SMILES code c12ccccc1c3ccccc3cc2
2.2 Physicochemical properties
Table 3. Physicochemical properties of phenanthrene from Verbruggen (in prep.)
Parameter Unit Value Remark
Molecular weight [g.mol-1] 178.23
Water solubility [µg.L-1] 1034 Geometric mean of seven values by the generator-column method log KOW [-] 4.502 Geometric mean of three values by
the slow-stirring method
log KOC [L.kg-1] 4.292 QSAR
Vapour pressure [Pa] 0.018 Geometric mean of five values by the gas saturation method
Melting point [°C] 99.2
Boiling point [°C] 340
Henry’s law constant [Pa.m3.mol-1] 3.8 Geometric mean of seven values by the gas stripping method, one by the headspace method and one by the wetted-wall method
2.3 Bioconcentration and biomagnification
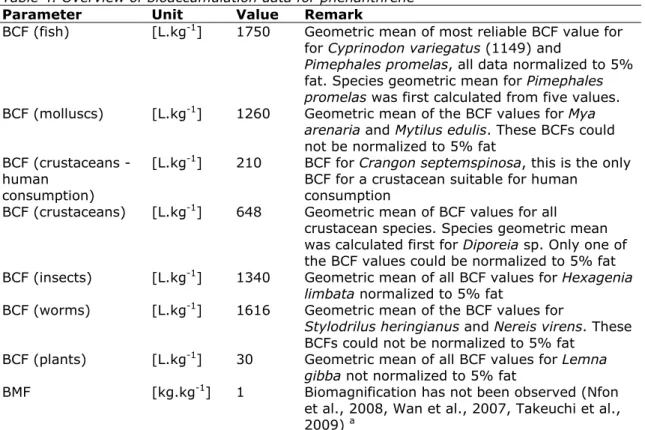
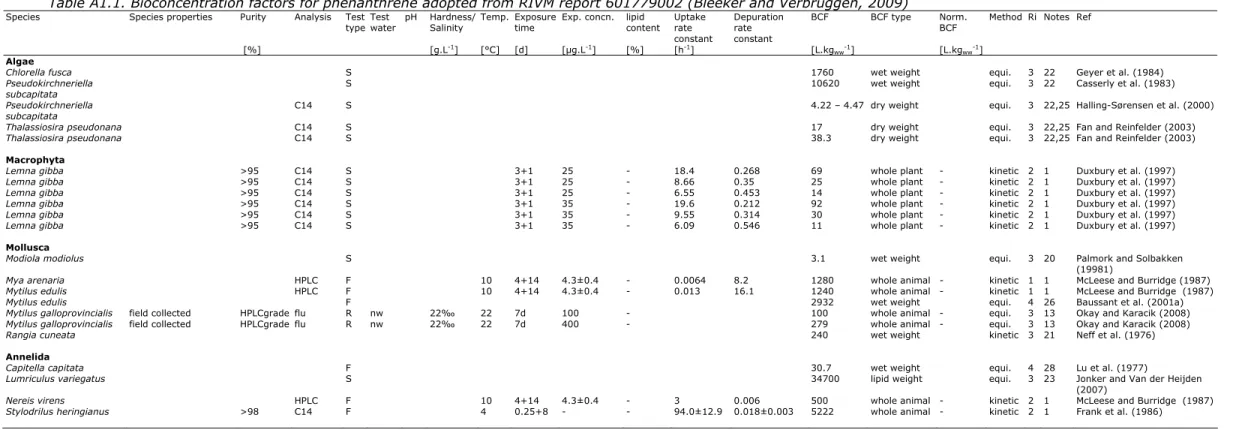
Bioconcentration data (based on lab studies) and bioaccumulation data (based on field studies) for phenanthrene are given in Table 4. The data in this table are based on studies reviewed by Bleeker and Verbruggen (2009) according to the Ri classification of Klimisch et al. (1997) and considered reliable (Ri1 or 2). A full overview of these studies is given in Appendix 1
Table 4. Overview of bioaccumulation data for phenanthrene
Parameter Unit Value Remark
BCF (fish) [L.kg-1] 1750 Geometric mean of most reliable BCF value for for Cyprinodon variegatus (1149) and
Pimephales promelas, all data normalized to 5%
fat. Species geometric mean for Pimephales
promelas was first calculated from five values.
BCF (molluscs) [L.kg-1] 1260 Geometric mean of the BCF values for Mya
arenaria and Mytilus edulis. These BCFs could
not be normalized to 5% fat BCF (crustaceans -
human consumption)
[L.kg-1] 210 BCF for Crangon septemspinosa, this is the only BCF for a crustacean suitable for human
consumption
BCF (crustaceans) [L.kg-1] 648 Geometric mean of BCF values for all
crustacean species. Species geometric mean was calculated first for Diporeia sp. Only one of the BCF values could be normalized to 5% fat BCF (insects) [L.kg-1] 1340 Geometric mean of all BCF values for Hexagenia
limbata normalized to 5% fat
BCF (worms) [L.kg-1] 1616 Geometric mean of the BCF values for
Stylodrilus heringianus and Nereis virens. These
BCFs could not be normalized to 5% fat BCF (plants) [L.kg-1] 30 Geometric mean of all BCF values for Lemna
gibba not normalized to 5% fat
BMF [kg.kg-1] 1 Biomagnification has not been observed (Nfon et al., 2008, Wan et al., 2007, Takeuchi et al., 2009) a
a In a study into foodweb distribution of PAHs (Vives et al., 2005), a biomagnification
factor of 1.5 kg.kg-1 is reported. This value was based on phenanthrene concentrations in
the fish diet and a fat normalized concentration in the fish liver. Since the phenanthrene concentration in the fish liver is in general higher than in the whole fish, this reported value supports the use of a BMF of 1.
A wide range of BCFs is available. In addition, BAFs are available. These BAFs (derived from field samples) indicate that the BCFs (derived from laboratory studies) are comparable to the bioaccumulation in the field. The BAF values are presented in Appendix 1. The low lipid content of most organisms from the field carries some additional uncertainty in comparison to the laboratory BCF values. Therefore, the BCF data normalized to 5% lipids will be used in the calculation of the MPCs for secondary poisoning of mammals and birds (MPCfw, secpois and MPCsw, secpois) and the MPC for human food consumption (MPCwater, hh food). When deciding which BCF should be used for calculation of the MPCs for secondary poisoning of mammals and birds (MPCfw, secpois and MPCsw, secpois) and the MPC for human food consumption (MPCwater, hh food), it should be considered that humans have a more specific food choice (fishery products) than mammals and birds, for which diets can vary considerably amongst different species. Therefore different BCFs should be used when deriving the different MPCs. For the MPCwater, hh food, the relative human consumption of fish, molluscs and crustaceans is used to determine the BCF. The human food consumption pattern used to determine the BCF is based on the Dutch food consumption survey for 1998 (Anonymous, 1998). The relative consumption of fish, molluscs and crustacean is 90% : 7% : 3% for fish : molluscs : crustaceans. On the basis of this relative consumption, a weighted average is calculated from the BCFs for fish, molluscs and the crustacean that is suitable for human consumption. The calculated BCF is: 1664 L.kg-1 based on geometric mean values for fish and molluscs, normalized to 5% lipids if possible. It should be noted that this approach is not the most conservative. A person having an equal daily consumption of fish only might not entirely be protected by this BAF. On the
other hand, the derivation of the MPCwater, hh food is already precautionary for the general Dutch population, because of the relatively high daily intake (115 g fishery prodcucts) and the fact that the contribution of the consumption of fishery products to the total daily exposure is only 10%. Therefore, a large risk for such a person is considered unlikely.
For the BCF to calculate the MPCfw, secpois, it is presumed that some predatory species have strong preference for the one of the three groups (fish, crustaceans or molluscs) or another group (e.g. worms) for their diet. The selected BCF for the MPCfw, secpois is the highest of the available groups and is the geometric mean of the BCF values for fish which is 1750 L.kg-1.
2.4 Human toxicological threshold limits and carcinogenicity
Phenanthrene has not been classified in EU framework. The U.S. EPA (IRIS) concluded that phenanthrene is not classifiable for human carcinogenicity. RIVM concluded that phenanthrene is probably carcinogenic, but the relative
carcinogenic potential is extremely low. For oral toxicity, a Tolerable Daily Intake (TDI) of 0.040 mg.kgbw-1.day-1 was derived based on a threshold approach (Baars et al., 2001). This value is adopted as TDI in this report.
For inhalation toxicity no individual TCA (Tolerable Concentration in Air) is available for phenanthrene. A limit value of 0.01 ng.m-3 has been proposed by the EU working group on PAHs (EC, 2001) for a lifetime exposure risk of 10-6 for benzo[a]pyrene (BaP) as indicator for the total PAHs and this value has been adopted in EU legislation (EU, 2004). To obtain an limit value for
benzo[a]pyrene as an individual substance, the limit value can be increased with a factor of 10 (a factor that is used to estimate the risk of total PAHs on the risk of BaP only) to 0.1 ng.m-3. TCAs for other PAHs can be derived from this value on the basis of their relative carcinogenic potency. The relative carcinogenic potency of phenanthrene is considered to be negligible and has been set at <0.001 (Baars et al., 2001). With this value the TCA for phenanthrene will be > 0.1 µg.m-3, no bound value can be derived. With a daily breathing volume of about 10,000 L air, it is can be calculated that this value of 0.1 µg.m-3 would still be very stringent compared to the TDI.
2.5 Trigger values
This section reports on the trigger values for ERLwater derivation (as demanded in WFD framework) as reported in Verbruggen (in prep.).
Table 5. Phenanthrene: collected properties for comparison to MPC triggers
Parameter Value Unit Method/Source
Log Kp,susp-water 3.29 [-] KOC × fOC,suspa
BCF 1664 / 1750b [L.kg-1] BMF 1 [kg,kg-1] Log KOW 4.50 [-] R-phrases n.a. [-] A1 value n.a. [µg.L-1] DW standard n.a. [µg.L-1] a f
OC,susp = 0.1 kgOC.kgsolid-1(EC, 2003).
b Different BCF values are given to be used separately for calculation of the MPC
water, hh food
and the MPCfw, secpois respectively.
n.a. = not available.
o phenanthrene has a log Kp, susp-water > 3; derivation of MPCsediment is triggered.
o phenanthrene has a log Kp, susp-water > 3; expression of the MPCwater as MPCsusp, water is required.
o phenanthrene has a BCF > 100 L.kg-1; assessment of secondary poisoning is triggered.
o phenanthrene is only marginally carcinogenic but given the low TDI and the fact that the BCF is above 100 L.kg-1, an MPC
water for human health via food (fish) consumption (MPCwater, hh food) should be derived.
3
Toxicity data and derivation of ERLs for water
3.1 Toxicity data
The selected freshwater toxicity data for phenanthrene as reported by
Verbruggen (in prep.) are given in Table 6 and marine toxicity data are shown in Table 7.
Table 6. Phenanthrene: selected freshwater toxicity data for ERL derivation
Chronic NOEC/EC10 Acute L(E)C50
Taxonomic group (µg.L-1) Taxonomic group (µg.L-1)
Cyanophyta
Anabaena flos-aqua 1300
Algea Algea
Pseudokirchneriella subcapitata 15 a Nitzschia palea 870
Scenedesmus vacuolatus 150 Pseudokirchneriella subcapitata 233 f
Scenedesmus vacuolatus 590
Crustacea Crustacea
Ceriodaphnia dubia 13 Daphnia magna 700
Daphnia magna 18 b Daphnia pulex 100
Daphnia pulex 13 c Diporeia spp. 74 g
Hyalella azteca 155 Gammarus minus 460
Insecta
Pisces Chironomus riparius 41 h
Danio rerio 14 d
Micropterus salmoides 11
Oncorhynchus mykiss 23 d
Oryzias latipes 93 e
a Geometric mean of 10 and 24 µg.L-1 for the growth rate (most relevant parameter) under
optimal growth conditions (2 d, pH restricted to 7.0-7.3).
b Most sensitive parameter (reproduction) determined under most reliable exposure regime
(intermittent flow).
c Most sensitive parameter (reproduction). d Most sensitive parameter (weight). e Most sensitive parameter (malformations).
f Geometric mean of 180 and 302 µg.L-1 for the growth rate (most relevant parameter)
under optimal growth conditions (2 d, pH restricted to 7.0-7.3).
g Longest exposure time of 5 d.
h Most sensitive life-stage (1st instar) illuminated with a mercury light source 330-800 nm,
including some UV-A.
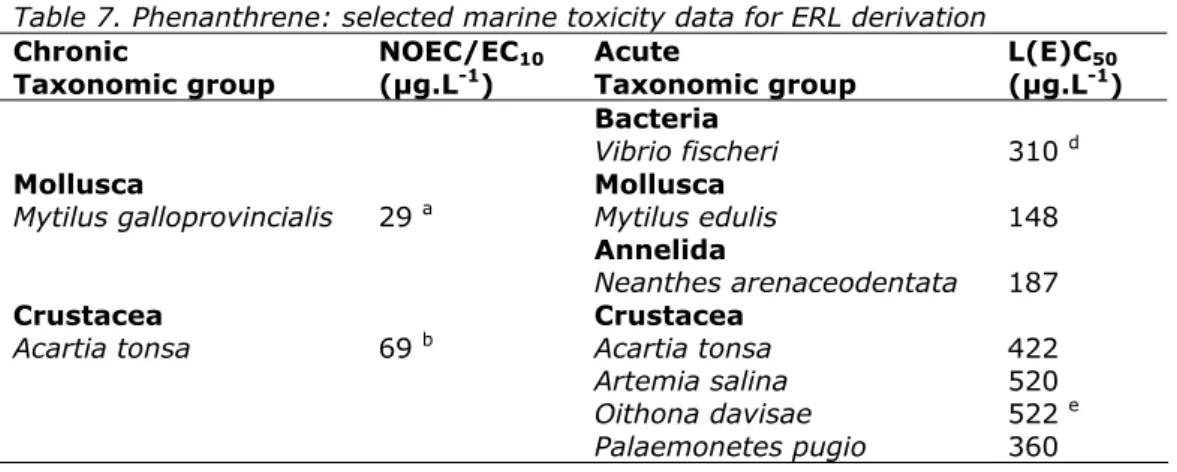
Table 7. Phenanthrene: selected marine toxicity data for ERL derivation
Chronic NOEC/EC10 Acute L(E)C50
Taxonomic group (µg.L-1) Taxonomic group (µg.L-1)
Bacteria
Vibrio fischeri 310 d
Mollusca Mollusca
Mytilus galloprovincialis 29 a Mytilus edulis 148
Annelida
Neanthes arenaceodentata 187
Crustacea Crustacea
Acartia tonsa 69 b Acartia tonsa 422
Artemia salina 520
Oithona davisae 522 e
Chronic NOEC/EC10 Acute L(E)C50
Taxonomic group (µg.L-1) Taxonomic group (µg.L-1)
Echinodermata
Arbacia punctulata 164
Paracentrotus lividus 105 c
Urochordata
Ciona intestinalis 262 c
a determined in the dark.
b most sensitive parameter (recruitment) determined under most reliable exposure regime
(intermittent flow).
c determined with a photoperiod 14:10 h light:dark by cool daylight lamps (380-780nm,
PAR) with an intensity of 70 µE.m-2.s-1.
d Geometric mean of 530, 530, 510, 520, 144, 142, and 182 µg.L-1 for standard exposure
time (15 min).
e Most sensitive endpoint (mortality).
3.1.1 Mesocosm studies
No mesocosm studies are available.
3.2 Treatment of fresh- and saltwater toxicity data
As stated by Verbruggen (in prep.), there is no significant difference between the freshwater and marine acute toxicity data. Therefore the datasets can be combined. Chronic data for marine organisms appeared to be significantly higher than data for freshwater organisms. This was considered due to the inclusion of typically marine taxonomic groups (Echinodermata and Urochordata), which appeared to be relatively tolerant to phenanthrene. Therefore, the chronic data sets were combined as well.
3.3 Derivation of MPCfw and MPCsw
3.3.1 MPCfw, eco and MPCsw, eco
The following derivation of the MPCfw, eco and MPCsw, eco is cited from Verbruggen (in prep.). Because acute and chronic toxicity data are available for algae,
Daphnia, and fish, an assessment factor of 10 can be applied to the lowest
NOEC or EC10. This is the EC10 of 11 µg.L-1 for Micropterus salmoides. The resulting MPCfw, eco is 1.1 µg.L-1. Because chronic data are available for additional taxonomic groups for the marine environment, the same assessment factor can be applied for the MPCsw, eco, which is 1.1 µg.L-1 too.
3.3.2 MPCfw, secpois and MPCsw, secpois
Phenanthrene has a BCF > 100 L.kg-1, thus assessment of secondary poisoning is triggered. Therefore, toxicological data on birds and mammals should be used to derive an MPCoral, min from which the MPCfw, secpois and MPCsw, secpois can be derived. However no studies with population relevant endpoints for mammals and birds could be found. The EPA ECOTOX Database does contain NOELs for birds and mammals, but the underlying studies did not examine population relevant endpoints and/or only applied the PAH in a single dose and mostly only one concentration was tested.
As an alternative approach the MPCfw, secpois is derived in a similar way as the TDI for phenanthrene.
The TDI of phenanthrene was based on the toxicity of the aromatic C9-16 fraction of TPH (Total Petroleum Hydrocarbon) because phenanthrene is part of this fraction (Baars et al., 2001). On the same grounds, it can be presumed that the underlying studies can be used to derive an MPCoral, min for phenanthrene. The
TDI is based on studies with 90 days administration of naphthalene, fluorene, anthracene, fluoranthene and pyrene (TPHCWG, 1997). Considering population relevant endpoints, the lowest NOEL for rats from these studies was
50 mg.kgbw-1.d-1 for changes in body weight from a study with naphthalene. With a conversion factor of 20 to calculate a NOECoral in mg.kgfood-1 and an assessment factor of 90 for 90 days studies the MPCoral is 11 mg.kgfood-1. The lowest NOEL for mice was 250 mg.kgbw-1.d-1 for changes in body weight and food consumption from a study with fluoranthene. With a conversion factor of 8.3 to calculate a NOECoral in mg.kgfood-1 and an assessment factor of 90, the MPCoral is 23 mg.kgfood-1. The MPCoral, min of 11 mg.kgfood-1 is used to calculate the
MPCfw, secpois and MPCsw, secpois. With the BCF of 1750 L.kg-1and BMF1 and BMF2 of 1, the MPCfw, secpois and MPCsw, secpois are both 6.3 µg.L-1.
3.3.3 MPCwater, hh food
Derivation of MPCwater, hh food for phenanthrene is triggered (Table 5). This derivation is based on the TDI of 0.040 mg.kgbw-1.day-1. MPChh, food = 0.1 x TLhh x BW / 0.115 = 2.4 mg.kgfood-1, where the TLhh is the TDI, BW is a body weight of 70 kg, 0.115 kg is the daily consumption of fishery products. With a BCF of 1664 L.kg-1 and a BMF1 of 1, the resulting MPC
water, hh food is then: 2.4 / (1664*1) = 1.5 µg.L-1. The MPC
water, hh food is valid for the freshwater and saltwater compartment.
3.3.4 Selection of the MPCfw and MPCsw
The MPCfw and the MPCsw are determined by the lowest MPCfw/sw derived. Therefore, both the MPCfw and the MPCsw are 1.1 µg.L-1.
Phenanthrene has a log Kp, susp-water ≥ 3; expression of the MPCwater as MPCsusp, water is required. The MPCsusp, water is calculated according to: MPCsusp, water = MPCwater, dissolved X Kp, susp-water, Dutch standard
For this calculation, Kp,susp-water,Dutch standard is calculated from the log Koc of 4.292 as given in Table 3. With an fOC,susp, Dutch standard of 0.1176 the
Kp, susp-water, Dutch standard can be calculated to 2305 L.kg-1. With this value, both the MPCsusp, fw and the MPCsusp, sw are 2.5 mg.kgdwt-1.
3.4 Derivation of MPCdw, hh
No A1 value and DW standard are available for phenanthrene. With the TDI of 0.040 mg.kgbw-1.day-1 an MPCdw, hh, provisional can be calculated with the following formula: MPCdw, hh, provisional = 0.1 x TLhh x BW / uptakedw where the TLhh is the TDI, BW is a body weight of 70 kg, and uptakedw is a daily uptake of 2 L. As described in section 2.2 water treatment is currently not taken into account. Therefore the MPCdw, hh = the MPCdw, hh, provisional and becomes: 0.1 x 0.040 x 70 / 2 = 0.14 mg.L-1.
3.5 Derivation of MACeco
The following derivation of the MACeco is cited from Verbruggen (in prep.). There are no reliable acute toxicity data for fish or other vertebrates and for aquatic plants. However, from two fish species tested and one aquatic plant (i.e. studies that were considered unreliable because only nominal concentrations were reported), these groups do not appear particularly sensitive. Therefore, the MACfw, eco and the MACsw, eco can be derived from a species sensitivity distribution (Figure 2). The HC5 of the acute toxicity data is 67 µg.L-1, which is above the
lowest value of 41 µg.L-1 for Chironomus riparius. The HC
50 is 307 µg.L-1. The goodness-of-fit is accepted at all significance levels. The number of toxicity data and the taxonomic diversity is high and the differences in species sensitivity are low, which is characteristic of narcotic effects. The MACfw, eco should be
protective of any acute effects. However, the values used in the SSD are 50% effective concentration. Therefore, an assessment is made between the 50% and 10% effective concentrations (EC50 and EC10). A direct comparison can be made for eight species from four taxonomic groups (Table 8). The ratio between the EC50 and EC10 varies widely. Moreover, such data have not been generated for the most sensitive taxonomic group, which are the insects. Therefore, an assessment factor of 10 is applied to the HC5 (acute) to derive the MACfw, eco. The MACfw, eco is thus 6.7 µg.L-1. Because of the number of marine data, including non standard species such as annelids and molluscs, an extra
assessment factor for the MACsw, eco is not necessary. The MACsw, eco is 6.7 µg.L-1 too.
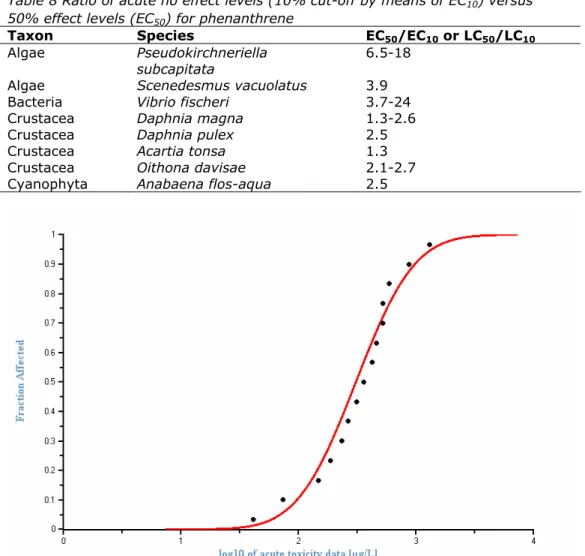
Table 8 Ratio of acute no effect levels (10% cut-off by means of EC10) versus
50% effect levels (EC50) for phenanthrene
Taxon Species EC50/EC10 or LC50/LC10
Algae Pseudokirchneriella
subcapitata 6.5-18
Algae Scenedesmus vacuolatus 3.9
Bacteria Vibrio fischeri 3.7-24
Crustacea Daphnia magna 1.3-2.6
Crustacea Daphnia pulex 2.5
Crustacea Acartia tonsa 1.3
Crustacea Oithona davisae 2.1-2.7
Cyanophyta Anabaena flos-aqua 2.5
Figure 2 Species sensitivity distribution for the acute toxicity of phenanthrene to aquatic organisms
3.6 Derivation of the NC
Negligible concentrations are derived by dividing the MPCs by a factor of 100. This gives an NCfw of 11 ng.L-1 and an NCsw of 11 ng.L-1
3.7 Derivation of the SRCwater, eco
The following derivation of the SRCwater, eco is cited from Verbruggen (in prep.). The SRCwater, eco is equal to the geometric mean of the chronic toxicity data and is 43 µg.L-1. The SRC
water, eco is valid for the salt- and freshwater environment.
3.8 Lipid approach
In Verbruggen (in prep.), ERLs were also calculated on the basis of internal lipid concentrations. In this approach all individual toxicity data for all examined PAHs were recalculated to internal lipid concentrations and concentrations were expressed on a molar basis. The obtained dataset was set out in a species sensitivity distribution and the values for HC5 and HC50 have been recalculated to concentrations for the individual PAHs in water, sediment and soil. More details on this approach can be found in Verbruggen (in prep.). With this method an MPCfw, eco of 0.68 µg.L-1 was calculated after application of an assessment factor of 5 to the HC5. The HC50 of 38 µg.L-1 was taken over as the SRCwater, eco. These values are comparable to the derived ERL values for freshwater.
4
Toxicity data and derivation of ERLs for sediment
4.1 Toxicity data
An overview of the selected sediment toxicity data for phenanthrene as reported by Verbruggen (in prep.) is given in Table 9. These values are recalculated to standard sediment with 10% organic matter. The crustaceans Rhepoxynius
abronius and Schizopera knabeni are marine species while the annelid Limnodrilus hoffmeisteri inhabits mostly brackish sediments. The rest of the
species live in freshwater sediments.
Table 9. Phenanthrene: selected chronic sediment toxicity data for ERL derivation Chronica NOEC/EC10 Taxonomic group (mg.kgdwt-1) Annelida Limnodrilus hoffmeisteri 168 a Lumbriculus variegatus 26 Crustacea Hyalella azteca 167 b Rhepoxynius abronius 122 c Schizopera knabeni 7.8 d Insecta Chironomus riparius 91 e
a most sensitive parameter (sediment egestion). b geometric mean of 339, 113, and 122 mg.kg
dw, standard sed-1, recalculated to standard
sediment with 10% organic matter, for the most sensitive parameter (length).
c geometric mean of 125 and 120 mg.kg
dw, standard sed-1, recalculated to standard sediment
with 10% organic matter.
d most sensitive parameter (reproduction). e geometric mean of 84, 114, and 79 mg.kg
dw, standard sed-1, recalculated to standard
sediment with 10% organic matter for the parameter emergence/mortality in a 28-d study.
4.2 Derivation of MPCsediment
The following derivation of the MPCsediment is cited from Verbruggen (in prep.). With six chronic data from three taxonomic groups equally distributed over freshwater and marine species, a minimum assessment factor of 10 can be applied to derive the MPCsediment, fw and MPCsediment, sw. The resulting value is 0.78 mg.kgdwt -1 for Dutch standard sediment.
Both the MPCsediment, fw and the MPCsediment, sw are 0.78 mg.kg dwt-1 for Dutch standard sediment.
4.3 Derivation of NCsediment
The NCsediment, fw is set a factor of 100 lower than de MPCsediment, fw at
7.8 µg.kg dwt-1 for Dutch standard sediment. The NCsediment, sw is 7.8 µg.kg dwt-1 for Dutch standard sediment.
4.4 Derivation of SRCsediment, eco
The following derivation of the SRCsediment, eco is cited from Verbruggen (in prep.). The SRCsediment, eco is derived from the geometric mean of the benthic data and is 63 mg.kgdwt-1 for Dutch standard sediment.
The SRCsediment, eco is 63 mg.kg dwt-1 for Dutch standard sediment. The SRCsediment, eco is valid for the marine and the freshwater environment.
4.5 Lipid approach
With the lipid approach as briefly described in Section 3.8, Verbruggen (in prep.) calculated an MPCsediment, fw of 0.78 mg.kg dwt-1, after application of an
assessment factor of 5 to the HC5. An HC50 of 44 mg.kg dwt-1 was taken over as the SRCsediment, eco. Both values were normalised for Dutch standard sediment. These values are comparable to the derived ERL values for sediment.
5
Toxicity data and derivation of ERLs for soil
5.1 Toxicity data
An overview of the selected soil toxicity data for phenanthrene as reported by Verbruggen (in prep.) is given in Table 10.
Table 10. Phenanthrene: selected chronic soil toxicity data for ERL derivation
Chronica NOEC/EC10
Taxonomic group (mg.kgstandard soil-1)
Bacteria nitrification 154 Macrophyta Sinapsis alba 98 a Trifolium pretense 88 a Lolium perenne 645 a Annelida Eisenia fetida 36 b Eisenia veneta 92 Enchytraeus crypticus 87 c Insecta Folsomia candida 37 d Folsomia fimetaria 72 c
a Most sensitive endpoint (fresh weight).
b Most sensitive endpoint (total offspring) derived from presented data based on time
weighted average concentrations.
c Most sensitive endpoint (reproduction) corrected for time weighted average
concentrations.
d Geometric mean of 33 and 41 mg.kg
dwt-1 for most sensitive endpoint (reproduction)
corrected for time weighted average concentrations. 5.2 Derivation of MPCsoil
5.2.1 MPCsoil, eco
The following derivation of the MPCsoil, eco is cited from Verbruggen (in prep.). Chronic toxicity data for phenanthrene in soil are available for annelids,
collembola, terrestrial plants, and microbial processes. The EC10 for reproduction of Eisenia fetida is the lowest EC10 or NOEC. This value is almost equal to the geometric mean of 33 and 41 mg.kgdwt, standard soil-1 for the springtail Folsomia
candida. Because chronic data are available for 8 species and 1 terrestrial
process, covering all trophic levels, an assessment factor of 10 can be applied to derive the MPCsoil, eco. The MPCsoil, eco is thus 3.6 mg.kgdwt-1 for Dutch
standard soil.
The MPCeco for soil is 3.6 mg.kgdwt-1 for Dutch standard soil.
5.2.2 MPCsoil, secpois
Phenanthrene has a BCF > 100 L.kg-1 and therefore secondary poisoning is triggered.
An indicative MPCsoil, secpois can be calculated from the indicative MPCoral of 11 mg.kgfood-1 as calculated in Section 3.3.2. The MPCsoil, secpois, TGD can be calculated with the method as described in Van Vlaardingen and Verbruggen (2007). This calculation has been performed with an estimated BCF value of 380 L.kg-1, based on the log Kow. The calculated MPCsoil, secpois, TGD is:
Dutch standard soil. Jager (Jager, 1998) reported BCF values for earthworms ranging from 9 to 40 L.kg-1. This indicates that the calculated MPC
soil, secpois is most likely a worst case estimate.
5.2.3 MPCsoil, hh food
For the derivation of the MPCsoil, hh food, the TDI of 0.040 mg.kgbw-1.day-1 can be used as TLhh. With the method as described in van Vlaardingen and Verbruggen (2007), specific human intake routes are allowed to contribute 10% of the human toxicological threshold limit. Four different routes contributing to human exposure have been incorporated: consumption of leafy crops, root crops, milk and meat. Uptake via root crops was determined to be the critical route. The calculated MPCsoil, hh food is 1.85 mg.kgdwt-1 for Dutch standard soil.
5.2.4 Selection of the MPCsoil
The lowest MPCsoil is the MPCsoil, hh food, this sets the MPCsoil to 1.9 mg.kgdwt-1 for Dutch standard soil.
5.3 Derivation of NCsoil
The NCsoil is set a factor of 100 lower than de MPCsoil at 0.019 mg.kgdwt –1 for Dutch standard soil.
5.4 Derivation of SRCsoil, eco
The following derivation of the SRCsoil, eco is cited from Verbruggen (in prep.). The SRCsoil, eco is derived from the geometric mean of the data for the eight species and is 90 mg.kgdwt-1 for Dutch standard soil.
5.5 Lipid approach
With the lipid approach as briefly described in Section 3.8, Verbruggen (in prep.) calculated an MPCsoil, eco of 0.76 mg.kg dwt-1 was calculated, after application of an assessment factor of 5 to the HC5. The HC50 of 44 mg.kg dwt-1 was taken over as the SRCsoil, eco. Both values are normalised for Dutch standard soil. These values are comparable to the derived ERL values for soil.
6
Derivation of ERLs for groundwater
6.1 Derivation of MPCgw
6.1.1 MPCgw, eco
Since groundwater-specific ecotoxicological ERLs are absent, the surface water MPCfw, eco is taken as a substitute. Thus the MPCgw, eco = MPCfw, eco = 1.1 µg.L-1.
6.1.2 MPCgw, hh
The MPCgw, hh is set equal to the MPCdw, hh: 0.14 mg.L-1.
6.1.3 Selection of the MPCgw
The lowest MPCgw sets the MPCgw this is the MPCgw, eco: 1.1 µg.L-1.
6.2 Derivation of NCgw
The NCgw is set a factor 10 lower than the MPCgw: 11 ng.L-1.
6.3 Derivation of SRCgw, eco
7
Derivation of ERLs for air
7.1 Derivation of MPCair
7.1.1 MPCair, eco
No data are available to derive an MPCair, eco.
7.1.2 MPCair, hh
Since only an unbound TCA for phenanthrene in air is available, an MPCair, hh cannot be derived.
7.1.3 Selection of the MPCair
No MPCair can be derived.
7.2 Derivation of NCair
8
Comparison of derived ERLs with monitoring data
Surfacewater
The RIWA (Dutch Association of River Water companies) reports monitoring data for phenanthrene in the Rhine and Meuse basins. The total concentrations for the years 2006-2010 are given in Table 11. These values cannot be directly compared with the ERLs derived in this report that expressed as dissolved concentrations. However, presuming a concentration of suspended matter in surface water varying between 15 and 30 mg.L-1 and the K
p, susp-water, Dutch standard given in Section 3.3.4, the fraction of the total concentration sorbed to
suspended matter is only 3 to 6%. The total concentration is therefore
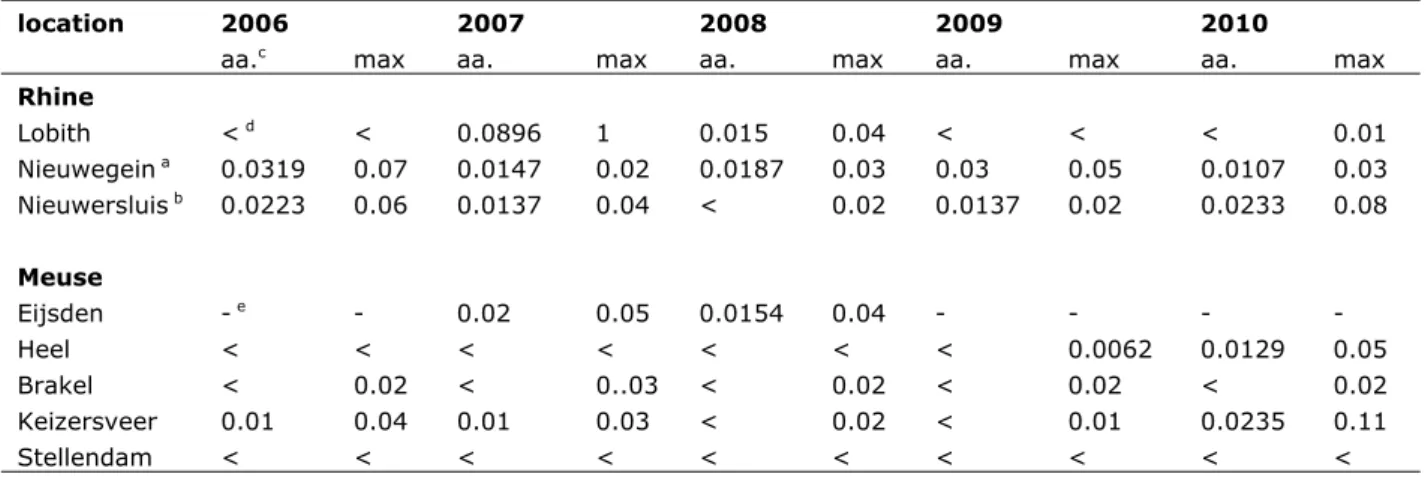
representative for the dissolved fraction. It can be concluded that none of these values exceeds the newly derived MPC or MAC for freshwater, but the NCwater of 11 ng.L-1 is exceeded in many cases.
Table 11 Total concentrations (µg.L-1) of phenanthrene in surface water of the
Rhine and Meuse for the years 2006-2010. Source: RIWA
location 2006 2007 2008 2009 2010
aa.c max aa. max aa. max aa. max aa. max
Rhine Lobith < d < 0.0896 1 0.015 0.04 < < < 0.01 Nieuwegein a 0.0319 0.07 0.0147 0.02 0.0187 0.03 0.03 0.05 0.0107 0.03 Nieuwersluis b 0.0223 0.06 0.0137 0.04 < 0.02 0.0137 0.02 0.0233 0.08 Meuse Eijsden - e - 0.02 0.05 0.0154 0.04 - - - - Heel < < < < < < < 0.0062 0.0129 0.05 Brakel < 0.02 < 0..03 < 0.02 < 0.02 < 0.02 Keizersveer 0.01 0.04 0.01 0.03 < 0.02 < 0.01 0.0235 0.11 Stellendam < < < < < < < < < < a Lek canal. b Amsterdam-Rhine canal. c aa. = annual average.
d < = below limit of detection/quantification. e - = not reported.
The Dutch Ministry of Infrastructure and Environment does present monitoring data for total concentrations of phenanthrene in water and sediment on their website (www.waterbase.nl). For the years 2001 to 2010 maximum peak values for surface water were reported up to 3.1 µg.L-1. These values do not exceed the MACeco derived in this report. For suspended matter, the average of the
concentrations reported for 2001 to 2010 did not exceed the MPCsusp, fw or MPCsusp, sw.
For remote mountain lakes in the Pyrenees, alps and central Norway, dissolved water concentration for phenanthrene are reported ranging from 0.096 to 0.176 ng.L-1 (Vilanova et al., 2001). In these water samples, phenanthrene counted for 31 to 45% of the total PAH concentration. For the marine
environment, background concentrations have been agreed for several regions of the North-East Atlantic. The background concentration of phenanthrene ranges from 0.262 to 0.636 ng.L-1 (OSPAR, 2005). These values are lower than the NCs for fresh- and saltwater.
Sediment
For sediment, over the years 2001 to 2010 the reported concentrations
exceeded the new derived MPCsediment in four occasions: 3.39 mg.kgdwt-1 (Sas van Gent, 2001), 1.2 mg.kgdwt-1 (Sas van Gent 2006), 2.7 mg.kgdwt-1 (Sas van Gent, 2009) and 0.79 mg.kgdwt-1 (Bovensluis, 2002). Most of the other reported values exceed the newly derived NCsediment. Concentrations in North Sea
sediment are also collected for the OSPAR convention. Actual concentrations are not report for phenanthrene but in the assessment report for 2008/2009
(OSPAR, 2009b) it can be seen that the concentration in almost all samples exceed the OSPAR "Background Assessment Concentration" of 32 µg.kgdwt-1 normalised to 2.5% TOC (OSPAR, 2009a). Normalised to Dutch standard sediment, this value would be about a factor 10 lower than the MPCsediment derived in this report but exceeding the NCsediment. The trends for concentrations of phenanthrene in North Sea sediment over the period 2003-2007 are in general stable and rarely declining.
Soil
In the year 2000, the AW2000 project examined the concentrations of many contaminants in agricultural soil and soils in nature reserves in the Netherlands, which were not exposed to local sources of contamination, in order to determine their background values in the Netherlands (Lamé et al., 2004b). The median concentration of phenanthrene in the upper soil (0-0.1 m) was determined at 10 µg.kgdwt-1 for Dutch standard soil. In the lower soil (0.5-1.0 m) the median was determined at 0.004 µg.kgdwt-1 for Dutch standard soil. These values are comparable to the estimated natural background concentration of 1-10 µg.kgsoil-1 for individual PAHs as determined by Wilcke (2000). It seems in contradiction that soils in European high mountain areas, recently examined on their PAH concentration (Quiroz et al., 2011) showed higher concentrations. For phenanthrene, the average concentrations were 117 µg.kg-1, 72 µg.kg-1, 256 µg.kg-1 and 120 µg.kg-1 for Montseny (Spain), Pyrenees (French-Spanish border), Alps (Austria) and Tatras (Slovania) respectively. However, the actual concentration is correlated to the altitude and these high concentrations are attributed to condensation effects at higher altitudes caused by the lower temperatures. When this correlation is extrapolated to sea level, the estimated value is comparable to those determined within the AW2000 project (Lamé et al., 2004a) and by Wilcke (2000). The maximum concentrations monitored in the AW2000 project are 1.16 mg.kgdwt-1 and 0.093 mg.kgdwt-1 for the upper and lower soil respectively normalised to Dutch standard soil. These values do not exceed the derived MPC value for soil but are higher than the NCsoil. The 80% level in the upper soils was 0.022 mg.kgdwt-1 meaning that at least 20% of the uppers soil samples exceed the NCsoil. In the lower soils, the 90% level of 0.018 mg.kgdwt-1 was close to the NCsoil. From this can be concluded that the newly derived NCsoil will be exceeded in many areas with a relatively low exposure of PAHs.
Sum of PAHs
The observations reported above are based on the reported concentrations for phenanthrene alone. It should be considered that phenanthrene will not occur on its own but as part of the mixture of PAHs. Therefore, the occurrence of mixture toxicity should be considered when performing a risk assessment. PAHs are a large group of substances of which the mechanisms of toxicity are comparable. Therefore, the risk assessment for every environmental compartment should be based on concentration addition for every PAH determined and not on a single PAH like phenanthrene alone.
9
Conclusions
In this report, the risk limits Negligible Concentration (NC), Maximum Permissible Concentration (MPC), Maximum Acceptable Concentration for ecosystems (MACeco), and Serious Risk Concentration for ecosystems (SRCeco) are derived for phenanthrene in water, groundwater, sediment and soil. The MPC for water and suspended matter are higher than the current valid ERLs. The MPC for sediment is also higher than the current valid ERL. These differences are due to a more extensive dataset on ecotoxicology in combination with the more recent methodology for derivation of ERLs. Monitoring data suggests that currently the NCwater derived in this report will be exceeded in the Dutch surface waters. Also, the MPCsediment could be exceeded in some cases and the NCsediment is likely to be exceeded in many cases. Besides that, it should be mentioned that phenanthrene will not occur on its own but as part of the mixture of PAHs. For a substance group like PAHs, additive effects (mixture toxicity) should not be ruled out and the total group of PAHs should be assessed by application of
concentration addition, at least for ecotoxic effects. The ERLs that were obtained are summarised in the table below. For the soil compartment, it can be
concluded that the NCsoil will be exceeded in many cases, including soils with a relatively low exposure to PAHs.
Table 12. Derived MPC, NC, MACeco, and SRCeco values for phenanthrene
ERL unit value
MPC NC MACeco SRCeco
freshwater a µg.L-1 1.1 1.1 x10⁻² 6.7 43
freshwater susp. matter b mg.kg
dwt-1 2.5
drinking water human health c mg.L-1 0.14
saltwater µg.L-1 1.1 1.1 x10⁻² 6.7 43
saltwater susp. matter mg.kgdwt-1 2.5 freshwater sediment d mg.kg dwt-1 0.78 7.8 x10⁻³ 63 saltwater sediment d mg.kg dwt-1 0.78 7.8 x10⁻³ 63 soil e mg.kg dwt-1 1.9 1.9 x10⁻² 90 groundwater µg.L-1 1.1 1.1 x10⁻² 43 air mg.m-3 n.d. a From the MPC
fw, eco, MPCfw, secpois and MPCfw, hh food the lowest one is selected as the ‘overall’
MPCwater.
b Expressed on the basis of Dutch standard suspended matter. c As stated in the new WFD guidance, the MPC
dw, hh is not included in the selection of the
final MPCfw. Therefore, the MPCdw, hh is presented as a separate value. d Expressed on the basis of Dutch standard sediment.
e Expressed on the basis of Dutch standard soil.
References
Anonymous. 1998. Basisrapportage derde voedselconsumptiepeiling. Zeist: TNO. Baars A, Theelen R, Janssen P, Hesse J, van Apeldoorn M, Meijerink M, Verdam
L, Zeilmaker M. 2001. Re-evaluation of human-toxicological maximum permissible risk levels. Bilthoven, The Netherlands: National Institute of Public Health and the Environment (RIVM). Report no. 711701025. Baussant T, Sanni S, Jonsson G, Skadsheim A, Børseth JF. 2001a.
Bioaccumulation of polycyclic aromatic compounds: 1. Bioconcentration in two marine species and in semipermeable membrane devices during chronic exposure to dispersed crude oil. Environ Toxicol Chem. 20: 1175-1184.
Baussant T, Sanni S, Skadsheim A, Jonsson G, Børseth JF, Gaudebert B. 2001b. Bioaccumulation of polycyclic aromatic compounds: 2. Modeling
bioaccumulation in marine organisms chronically exposed to dispersed oil. Environ Toxicol Chem. 20: 1185-1195.
Bihari N, Fafandel M, Piskur V. 2007. Polycyclic aromatic hydrocarbons and ecotoxicological characterization of seawater, sediment, and mussel
Mytilus galloprovincialis from the gulf of Rijeka, the Adriatic Sea,
Croatia. Arch. Environ. Contam. Toxicol. 52: 379-387.
Bleeker EAJ, Verbruggen EMJ. 2009. Bioaccumulation of polycyclic aromatic hydrocarbons in aquatic organisms. Bilthoven: RIVM. Report no. 601779002.
Burkhard LP, Lukasewycz MT. 2000. Some bioaccumulation factors and biota-sediment accumulation factors for polycyclic aromatic hydrocarbons in lake trout. Environmental Toxicology and Chemistry. 19: 1427-1429. Cailleaud K, Budzinski H, Le Menach K, Souissi S, Forget-Leray J. 2009. Uptake
and elimination of hydrophobic organic contaminants in estuarine copepods: An experimental study. Environ.Toxicol.Chem. 28: 239-246. Carlson RM, Oyler AR, Gerhart EH, Caple R, Welch KJ, Kopperman HL, Bodenner
D, Swanson D. 1979. Implications to the aquatic environment of
polynuclear aromatic hydrocarbons liberated from Northern Great Plains coal. Duluth, MN: U.S. EPA Report no. U.S. EPA report EPA-600/3-79-093.
Casserly DM, Davis EM, Downs TD, Guthrie RK. 1983. Sorption of organics by
Selenastrum capricornutum. Water Research. 17: 1591-1594.
Cheikyula JO, Koyama J, Uno S. 2008. Comparative study of bioconcentration and EROD activity induction in the Japanese flounder, red sea bream, and Java medaka exposed to polycyclic aromatic hydrocarbons. Environ. Toxicol.: 354-362.
De Maagd PG-J. 1996. Polycyclic aromatic hydrocarbons: fate and effects in aquatic environment. Utrecht, Utrecht University.
Djomo JE, Garrigues P, Narbonne JF. 1996. Uptake and depuration of polycyclic aromatic hydrocarbons from sediment by the zebrafish (Brachydanio
rerio). Environ Toxicol Chem. 15: 1177-1181.
Duxbury CL, Dixon DG, Greenberg BM. 1997. Effects of simulated solar radiation on the bioaccumulation of polycyclic aromatic hydrocarbons by the duckweed Lemna gibba. Environ.Toxicol.Chem. 16: 1739-1748.
Eastmond DA, Booth GM, Lee ML. 1984. Toxicity, accumulation, and elimination of polycyclic aromatic sulfur heterocycles in Daphnia magna. Arch. Environ. Contam. Toxicol. 13: 105-111.
EC. 2001. Ambient air pollution by polycyclic aromatic hydrocarbons (PAH). Position paper prepared by the working group on polycyclic aromatic
hydrocarbons. Luxembourg: Office for official publications of the european communities. Report no. KH-41-01-373-EN-N.
EC. 2003. Technical Guidance Document on risk assessment in support of Commission Directive 93/67/EEC on risk assessment for new notified substances, Commission Regulation (EC) No 1488/94 on risk assessment for existing substances and Directive 98/8/EC of the European
Parliament and of the Council concerning the placing of biocidal products on the market. Ispra, Italy: European Commission Joint Research Centre.
EC. 2011. Common implementation strategy for the Water Framework Directive (2000/60/EC). Guidance document No. 27. Technical guidance for deriving environmental quality standards. Brussels: European Commission.
EU. 2004. Directive 2004/107/EC of the European Parliament and of the Council of 15 December 2004 relating to arsenic, cadmium, mercury, nickel and polycyclic aromatic hydrocarbons in ambient air. Official Journal of the European Union. European Union.
Fan CW, Reinfelder JR. 2003. Phenanthrene accumulation kinetics in marine diatoms. Environmental Science & Technology. 37: 3405-3412.
Frank AP, Landrum PF, Eadie BJ. 1986. Polycyclic aromatic hydrocarbon rates of uptake, depuration, and biotransformation by Lake Michigan Stylodrilus
heringianus. Chemosphere. 15: 317-330.
Freitag D, Ballhorn L, Geyer H, Korte F. 1985. Environmental hazard profile of organic chemicals. An experimental method for the assessment of the behaviour of organic chemicals in the ecosphere by means of simple laboratory tests with 14C labelled chemicals. Chemosphere. 14: 1589-1616.
Geyer H, Politzki G, Freitag D. 1984. Prediction of ecotoxicological behaviour of chemicals: Relationship between n-octanol/water partition coefficient and bioaccumulation of organic chemicals by alga Chlorella.
Chemosphere. 13: 269-284.
Halling-Sørensen B, Nyholm N, Kusk KO, Jacobsson E. 2000. Influence of nitrogen status on the bioconcentration of hydrophobic organic compounds to Selenastrum capricornutum. Ecotoxicology and Environmental Safety. 45: 33-42.
Hansler RJ, Van Herwijnen R, Posthumus R. 2008. Indicatieve
milieukwaliteitsnormen voor prioritaire stoffen. Bilthoven: RIVM. Report no. 601782012.
Jager T. 1998. Mechanistic approach for estimating bioconcentration of organic chemicals in earthworms (Oliochaeta). Environmental Toxicology and Chemistry. 17: 2080-2090.
Jonker MTO, Van der Heijden SA. 2007. Bioconcentration factor hydrophobicity cutoff: An artificial phenomenon reconstructed. Environmental Science & Technology. 41: 7363-7369.
Jonsson G, Bechmann RK, Bamber SD, Baussant T. 2004. Bioconcentration, biotransformation, and elimination of polycyclic aromatic hydrocarbons in sheepshead minnows (Cyprinodon variegatus) exposed to
contaminated seawater. . Environ.Toxicol.Chem. 23: : 1538-1548. Kalf DF, Crommentuijn GH, Posthumus R, Van de Plassche EJ. 1995. Integrated
environmental quality objectives for polycyclic aromatic hydrocarbons (PAHs). Bilthoven: RIVM. Report no. 679101018.
Klimisch HJ, Andreae M, Tillman U. 1997. A systematic approach for evaluating the quality of experimetnal toxicological and ecotoxicological data. Regulatory Toxicology and Pharmacology. 25: 1-5.
Lamé FPJ, Brus DJ, Nieuwenhuis RH. 2004a. Achtergrondwaarden 2000 - Bijlage Rapport 1 AW2000: Datasheets voor de geanalyseerde stoffen. Utrecht: Nederlands Instituut voor Toegepaste Geowatenschappen. Report no. NITG 04-2420A.
Lamé FPJ, Brus DJ, Nieuwenhuis RH. 2004b. Achtergrondwaarden 2000 - Hoofdrapport AW2000 fase 1. Utrecht: Nederlands Instituut voor Toegepaste Geowatenschappen. Report no. NITG 04-2420-A. Landrum PF. 1988. Toxicinetics of organic xenobiotics in the amphipod,
Pontoporeia hoyi: Role of physiological and environmental variables.
Aquat. Toxicol. 12: 245-271.
Landrum PF, Lotufo GR, Gossiaux DC, Gedeon ML, Lee JH. 2003.
Bioaccumulation and critical body residue of PAHs in the amphipod, Diporeia spp.: Additional evidence to support toxicity additivity for PAH mixtures. Chemosphere 51: 481-489.
Landrum PF, Poore R. 1988. Toxicokinetics of selected xenobiotics in Hexagenia
limbata. J. Great Lakes Res. 14: 427-437.
Lee JH, Landrum PF, Koh CH. 2002. Toxicokinetics and time-dependent PAH toxicity in the amphipod Hyalella azteca. Environmental Science & Technology. 36: 3124-3130.
Lepper P. 2005. Manual on the Methodological Framework to Derive
Environmental Quality Standards for Priority Substances in accordance with Article 16 of the Water Framework Directive (2000/60/EC). Schmallenberg, Germany: Fraunhofer-Institute Molecular Biology and Applied Ecology.
Lijzen JPA, Baars AJ, Otte PF, Rikken MGJ, Swartjes FA, Verbruggen EMJ, van Wezel AP. 2001. Technical evaluation of the intervention values for soil/sediment and groundwater - Human and ecotoxicological risk assessment and derivation of risk limits for soil, aquatic sediment and groundwater. Bilthoven, the Netherlands: National Institute of Public Health and the Environment (RIVM). Report no. 711701023.
Lu PY, Metcalf RL, Plummer N, Mandel D. 1977. The environmental fate of three carcinogens: Benzo-(a)-pyrene, benzidine, and vinyl chloride evaluated in laboratory model ecosystems. Arch. Environ. Contam. Toxicol. 6: 129-142.
McLeese DW, Burridge LE. 1987. Comparative accumulation of PAHs in four marine invertebrates. In: Capuzzo JM, Kester DR (Eds.) Oceanic Processes in Marine Pollution. pp. 110-117. Malabar, FL, Robert E. Krieger.
Neff JM, Anderson JW, Cox BA, Laughlin JRB, Rossi SS, Tatem HE. 1976. Effects of petroleum on survival, respiration and growth of marine animals. Sources, Effects and Sinks of Hydrocarbons in the Aquatic Environment. pp. 515-539. Arlington, USA, American Institute of Biological Sciences. Newsted JL, Giesy JP. 1987. Predictive models for photoinduced acute toxicity of
polycyclic aromatic hydrocarbons to Daphnia magna, Strauss (Cladocera, crustacea). Environ.Toxicol.Chem. 6: 445-461.
Nfon E, Cousins IT, Broman D. 2008. Biomagnification of organic pollutants in benthic and pelagic marine food chains from the Baltic Sea. Science of the Total Environment. 397: 190-204.
Niimi AJ, Palazzo V. 1986. Biological half-lives of eight polycyclic aromatic hydrocarbons (PAHs) in rainbow trout (Salmo gairdneri). Water Research. 20: 503-507.
Okay OS, Karacik B. 2008. Bioconcentration and phototoxicity of selected PAHs to marine mussel Mytilus galloprovincialis. Journal of Environmental Science and Health Part A. 43: 1234-1242.