National Institute for Public Health and the Environment
P.O. Box 1 | 3720 BA Bilthoven www.rivm.com
Environmental risk limits for organotin
compounds
Colophon
© RIVM 2012
Parts of this publication may be reproduced, provided acknowledgement is given to the 'National Institute for Public Health and the Environment', along with the title and year of publication.
This investigation has been performed by order and for the account of Ministry of Infrastructure and the Environment (I&M), Directorate General of the Environment (DGM), Directorate of Sustainable production (DP), within the framework of project 607711, soil quality, prevention and risk assessment.
R. van Herwijnen
Contact:
René van Herwijnen
Expertise Centre for Substances
rene.van.herwijnen@rivm.nl
Abstract
Environmental risk limits for organotin compounds
RIVM has derived environmental risk limits (ERLs) for three organotin
compounds: dibutyltin, tributyltin and triphenyltin. These are the most widely used organotin compounds. Dibutyltin has several uses, for example in the plastic PVC and in printer toner. Tributyltin and triphenyltin are mainly used for wood conservation and as antifouling. Triphenyltin was also used as plant protection product for potatoes. The use as antifouling has been banned within Europe since 2003, and there is no authorisation anymore for the use of triphenyltin as plant protection product.
Intervention values for soil
The environmental risk limits have been derived because they are needed to determine intervention values for soil and groundwater. In case an intervention value is exceeded, the (polluted) soil will be considered for remediation. For this purpose, ERLs for groundwater and soil are required. ERLs for soil were not available and have been derived for this report. ERLs for water were already derived within other frameworks and have been adopted. ERLs for surface water and sediment are also reported in this report because they are related to soil and groundwater. In this way a complete overview of the available ERLs for each compound is given.
The derived environmental risk limits for soil and groundwater One of the derived ERLs is the Serious Risk Concentration (SRC). At this concentration, harmful effects for soil organisms are expected. The determined SRCs for soil are 28; 0.052 and 0.24 milligram per kilogram dry weight soil for dibutyltin, tributyltin and triphenyltin respectively. For groundwater, the SRCs are respectively 50; 0.046 and 0.40 microgram per liter.
Direct and indirect effects
The SRC is based on the annual average concentrations in soil, water and sediment. For this report, two routes of exposure have been examined: direct exposure of water or soil organisms, and indirect exposure of birds or mammals consuming water or soil organisms (food chain). Indirect exposure of humans where it concerns intervention values is evaluated in a separate report (Brand et al., 2012).
Keywords:
dibutyltin, triphenyltin, tributyltin, groundwater, water, soil, environmental risk limits
Rapport in het kort
Milieurisicogrenzen voor organotinverbindingen
Het RIVM heeft in opdracht van het ministerie van Infrastructuur en Milieu (I&M), milieurisicogrenzen voor drie organotinverbindingen in (grond)water, sediment en bodem vastgesteld. De drie meest voorkomende verbindingen in het milieu zijn: dibutyltin, tributyltin en trifenyltin. Dibutyltin wordt in
verscheidene toepassingen gebruikt, bijvoorbeeld in de kunststof pvc en in printertoners. Tributyltin en trifenyltin zijn voornamelijk gebruikt als middel om hout te conserveren en om te voorkomen dat er onder water op de romp van schepen organismen groeien (aangroeiwerend middel). Trifenyltin werd ook gebruikt als gewasbeschermingsmiddel in de aardappelteelt. Het gebruik als aangroeiwerend middel is in Europa sinds 2003 niet meer toegestaan en trifenyltin heeft ook geen authorisatie meer als gewasbescheringsmiddel. Interventiewaarden bodem
De milieurisicogrenzen zijn afgeleid omdat ze nodig zijn om de zogeheten interventiewaarden te bepalen. Als een interventiewaarde wordt overschreden, komt de (vervuilde) bodem in aanmerking voor sanering. Voor dit doel zijn alleen milieurisicogrenzen voor grondwater en bodem nodig. De
milieurisicogrenzen voor de individuele organotins in bodem waren nog niet beschikbaar en zijn voor dit onderzoek afgeleid. Milieurisicogrenzen voor water waren al eerder afgeleid binnen andere kaders en zijn overgenomen. De milieurisicogrenzen voor oppervlaktewater en sediment zijn ook in het rapport vermeld, omdat deze aan bodem en grondwater zijn gerelateerd. Dit geeft een volledig overzicht.
De milieurisicogrenzen voor bodem en grondwater
Een van de afgeleide milieurisicogrenzen is het Ernstig Risiconiveau (ER). Dit is de concentratie waarbij schadelijke effecten van de stof voor de bodem te verwachten zijn. De bepaalde ER’s voor bodem zijn 28; 0.052 en 0.24 milligram per kilogram drooggewicht bodem, voor achtereenvolgens dibutyltin, tributyltin en trifenyltin. Voor grondwater zijn de ER’s respectievelijk 50; 0,046 en
0,40 microgram per liter. Directe en indirecte effecten
Het ER is gebaseerd op de jaargemiddelde concentraties in bodem, water en sediment. Hiervoor zijn in dit rapport twee routes onderzocht: de directe effecten op waterorganismen en de indirecte effecten op vogels en zoogdieren via het nuttigen van de waterorganismen (voedselketen). Effecten voor mensen bij interventiewaarden worden in een separaat rapport geëvalueerd.
Trefwoorden:
Contents
Summary 9 1 Introduction 11 1.1 Project framework 11 1.2 Current MPCs 11 1.3 Methodology 11 1.3.1 Data collection 12 1.3.2 Data evaluation 12 1.3.3 Physico-chemical data 131.3.4 Species of organotin compounds 13 1.4 Status of the results 14
2 Dibutyltin 15
2.1 Data sources 15
2.2 Substance information 15
2.2.1 Information on production and use 15 2.2.2 Identification 15
2.2.3 Physico-chemical properties 15
2.2.4 Behaviour and distribution in the environment 17 2.2.5 Bioconcentration and biomagnification 17
2.3 Risk limits for water 17 2.3.1 Aquatic toxicity data 17
2.3.2 Treatment of fresh- and saltwater toxicity data 18 2.3.3 Derivation of the MPCwater 18
2.3.4 Derivation of the MACwater, eco 18 2.3.5 Derivation of the SRCwater 19 2.4 Risk limits for groundwater 19 2.5 Risk limits for sediment 19
2.5.1 Derivation of the MPCsediment, eco 19 2.5.2 Derivation of the SRCsediment, eco 20 2.6 Risk limits for soil 20
2.6.1 Soil toxicity data 20 2.6.2 Derivation of the MPCsoil 20 2.6.3 Derivation of the SRCsoil 21
2.6.4 Geometric mean of MPC and SRC 21
3 Tributyltin 23
3.1 Data sources 23
3.2 Substance information 23
3.2.1 Information on production and use 23 3.2.2 Identification 23
3.2.3 Physico-chemical properties 25
3.2.4 Behaviour and distribution in the environment 27 3.2.5 Bioconcentration and biomagnification 27
3.3 Risk limits for water 27 3.3.1 Aquatic toxicity data 27
3.3.2 Treatment of fresh- and saltwater toxicity data 28 3.3.3 Derivation of the MPCwater 28
3.3.5 Derivation of the SRCwater 30 3.4 Risk limits for groundwater 31 3.5 Risk limits for sediment 31
3.5.1 Derivation of the MPCsediment, eco 31 3.5.2 Derivation of the SRCsediment, eco 32 3.6 Risk limits for soil 32
3.6.1 Soil toxicity data 32
3.6.2 Derivation of the MPCsoil, 32 3.6.3 Derivation of the SRCsoil 33
3.6.4 Geometric mean of the MPC and SRC 34
4 Triphenyltin 35
4.1 Data sources 35
4.2 Substance information 35
4.2.1 Information on production and use 35 4.2.2 Identification 35
4.2.3 Physico-chemical properties 36
4.2.4 Behaviour and distribution in the environment 38 4.2.5 Bioconcentration and biomagnification 38
4.3 Risk limits for water 38 4.3.1 Aquatic toxicity data 38
4.3.2 Treatment of fresh- and saltwater toxicity data 40 4.3.3 Derivation of the MPCwater 40
4.3.4 Derivation of the MACwater, eco 40 4.3.5 Derivation of the SRCwater 40 4.4 Risk limits for groundwater 41 4.5 Risk limits for sediment 41 4.5.1 Sediment toxicity data 42 4.5.2 Derivation of the MPCsediment 42 4.5.3 Derivation of the SRCsediment, eco 42 4.6 Risk limits for soil 42
4.6.1 Soil toxicity data 42 4.6.2 Derivation of the MPCsoil 43 4.6.3 Derivation of the SRCsoil 43
4.6.4 Geometric mean of MPC and SRC 43
5 Conclusions 45
Literature 47
List of abbreviations 53
Appendix 1. Data on Koc studies 55
Appendix 2. Detailed soil toxicity data for tributyltin 61 Appendix 3. Detailed soil toxicity data for triphenyltin 67
Summary
In this report, the RIVM presents Environmental Risk Limits (ERLs) for organotin compounds in surface water, groundwater, sediment and soil. The organotin compounds involved are dibutyltin, tributyltin and triphenyltin. Dibutyltin compounds are used in various applications like stabiliser in PVC and charge regulator in printer toner; tributyltin and triphenyltin are/were mainly used in biocidal applications like antifouling and wood preservation. The use of tributyltin and triphenyltin as antifouling is not allowed anymore since 2003. Based on the data from ERL derivation for other frameworks and additional information obtained from the open literature, ecotoxicological environmental risk limits for the three organotins in groundwater and soil have been derived that can be used to set intervention values for contaminated soils. ERLs for fresh and salt surface water and sediment are also presented when available to give a complete overview of the available ERLs. The methods used are in accordance with the methodology of the WFD (Water Framework Directive) and INS (International and National environmental quality standards for Substances in the Netherlands).
For the setting of intervention values, two types of ERL are considered, each representing a different protection aim:
- The Maximum Permissible Concentration for ecosystems (MPCeco) - the concentration in an environmental compartment at which no effect to be rated as negative is to be expected for ecosystems. Separate MPCeco values are derived for the freshwater and saltwater environment;
- Serious Risk Concentration for ecosystems (SRCeco) - the concentration in (ground)water, sediment or soil at which possibly serious ecotoxicological effects are to be expected.
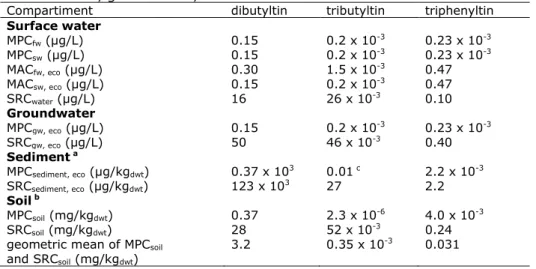
The MPCwater is equivalent to the long-term water quality standards that is indicated as AA-EQS in the WFD-guidance. Where applicable, ERLs are derived for freshwater and saltwater. An overview of the ERLs is presented in Table 1. It should be mentioned that these ERLs are only based on direct exposure of water or soil organisms and indirect exposure of birds or mammals consuming water or soil organisms (food chain). Indirect exposure of humans has not been assessed.
Table 1. Environmental risk limits for the ecosystem for organotin compounds in surface water, groundwater, sediment and soil
Compartiment dibutyltin tributyltin triphenyltin
Surface water MPCfw (µg/L) 0.15 0.2 x 10⁻³ 0.23 x 10⁻³ MPCsw (µg/L) 0.15 0.2 x 10⁻³ 0.23 x 10⁻³ MACfw, eco (µg/L) 0.30 1.5 x 10⁻³ 0.47 MACsw, eco (µg/L) 0.15 0.2 x 10⁻³ 0.47 SRCwater (µg/L) 16 26 x 10-3 0.10 Groundwater MPCgw, eco (µg/L) 0.15 0.2 x 10⁻³ 0.23 x 10⁻³ SRCgw, eco (µg/L) 50 46 x 10-3 0.40 Sediment a MPCsediment, eco (µg/kgdwt) 0.37 x 10³ 0.01 c 2.2 x 10⁻³ SRCsediment, eco (µg/kgdwt) 123 x 103 27 2.2 Soil b MPCsoil (mg/kgdwt) 0.37 2.3 x 10⁻⁶ 4.0 x 10⁻³ SRCsoil (mg/kgdwt) 28 52 x 10-3 0.24
geometric mean of MPCsoil
and SRCsoil (mg/kgdwt) 3.2 0.35 x 10
-3 0.031 n.d. = not derived
a Sediment values are expressed for Dutch standard sediment with 10% organic matter. b Soil values are expressed for Dutch standard soil with 10% organic matter.
1
Introduction
1.1 Project framework
In this report, Environmental Risk Limits (ERLs) for surface water (freshwater and marine), groundwater, sediment and soil ecosystems are derived for three organotin compounds: dibutyltin, tributyltin and triphenyltin. More details on the compounds are given in the individual chapters. The aim of this report is to present ERLs that are relevant for the setting of intervention values for soil contamination. The intervention values are evaluated in a separate report (Brand et al., 2012). ERLs for fresh and salt surface water and sediment are also presented when available to give a complete overview of the available ERLs. In this report, only ERLs relevant for the ecosystem are considered; the risk for humans is not considered because this risk is approached differently for the setting of intervention values for soil. The following ERLs are considered: - Maximum Permissible Concentration for ecosystems (MPCeco) - the
concentration in an environmental compartment at which no effect to be rated as negative is to be expected for ecosystems. Separate MPCeco values are derived for the freshwater and saltwater environment;
- Serious Risk Concentration for ecosystems (SRCeco) - the concentration in (ground)water, sediment or soil at which possibly serious ecotoxicological effects are to be expected. The SRCeco is valid for the freshwater and saltwater compartment.
1.2 Current MPCs
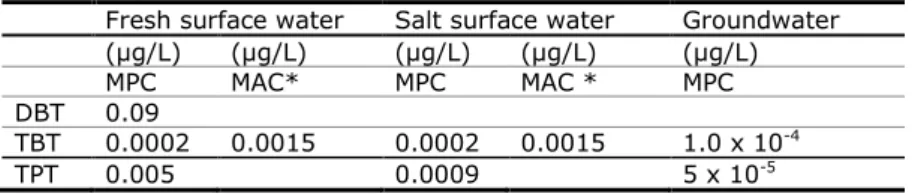
Risk limits at the time of publication of this report are given in Table 2. Actual risk limits can be found at the website ‘Risico’s van stoffen’
(http://www.rivm.nl/rvs/). For the aquatic environment, no new ERLs are derived, but ERLs derived in other frameworks are adopted. For soil, new ERLs are derived since no ERLs are available.
Table 2. Risk limits for the three organotin compounds at the time of publication of this report
Fresh surface water Salt surface water Groundwater (µg/L) (µg/L) (µg/L) (µg/L) (µg/L)
MPC MAC* MPC MAC * MPC
DBT 0.09
TBT 0.0002 0.0015 0.0002 0.0015 1.0 x 10⁻⁴
TPT 0.005 0.0009 5 x 10⁻⁵
* MAC = Maximum Acceptable Concentration for short term exposure
1.3 Methodology
The methodology for risk limit derivation is described in detail in the INS-guidance document (Van Vlaardingen and Verbruggen, 2007), which is further referred to as the INS-Guidance. The methodology is based on the Technical Guidance Document (TGD), issued by the European Commission and developed in support of the risk assessment of new notified chemical substances, existing
substances and biocides (EC, 2003), and on the Manual for the derivation of Environmental Quality Standards in accordance with the Water Framework Directive (Lepper, 2005). The European guidance under the framework of WFD is currently being revised; the final draft has been approved recently (March, 2011) by the Strategic Coordination Group under the European Water Directors. The terminology is harmonised as much as possible and the new guidance is followed in the case it deviates from the INS-guidance.
1.3.1 Data collection
For the water compartment, ERLs for all three compounds have recently been derived within other frameworks (EC, 2005, ICBR, 2009, Van Herwijnen et al., 2012). These ERLs have been adopted where available. In those cases that an aquatic ERL was not derived in these reports, the collected dataset was used for additional derivation. For soil toxicity data and soil/sediment sorption data, an on-line literature search has been performed using Scopus (www.scopus.com). The search for soil toxicity data was performed on 8 April 2011. Additionally, a search for soil/sediment sorption data of dibutyltin and tributyltin was performed on 19 August 2011. The latter search was performed because sorption data were necessary for the application of equilibrium partitioning.
1.3.2 Data evaluation
Soil ecotoxicity studies were screened for relevant endpoints (i.e. those endpoints that have consequences at the population level of the test species) and thoroughly evaluated with respect to the validity (scientific reliability) of the study. A detailed description of the evaluation procedure is given in section 2.2.2 and 2.3.2 of the INS-Guidance and in the Annex to the draft EQS-guidance under the WFD. In short, the following reliability indices (Ri) were assigned, based on Klimisch et al. (1997):
Ri 1: Reliable without restriction
’Studies or data […] generated according to generally valid and/or internationally accepted testing guidelines (preferably performed according to GLP), or in which the test parameters documented are based on a specific (national) testing guideline […], or in which all parameters described are closely
related/comparable to a guideline method’
Ri 2: Reliable with restrictions
’Studies or data […] (mostly not performed according to GLP), in which the test parameters documented do not totally comply with the specific testing guideline, but are sufficient to accept the data or in which investigations are described which cannot be subsumed under a testing guideline, but which are nevertheless well documented and scientifically acceptable’
Ri 3: Not reliable
’Studies or data […] in which there are interferences between the measuring system and the test substance, or in which organisms/test systems were used which are not relevant in relation to the exposure (e.g. unphysiologic pathways of application), or which were carried out or generated according to a method which is not acceptable, the documentation of which is not sufficient for an assessment and which is not convincing for an expert judgment’
Ri 4: Not assignable
’Studies or data […] which do not give sufficient experimental details and which are only listed in short abstracts or secondary literature (books, reviews, etc.)’
Citations
In case of (self-)citations, the original (or first cited) value is considered for further assessment, and an asterisk is added to the Ri of the endpoint that is cited.
All available studies are summarised in data-tables that are included as annexes to this report. These tables contain information on species characteristics, test conditions and endpoints. Explanatory notes are included with respect to the assignment of the reliability indices.
In the aggregated data tables only one effect value per species is presented. When for a species several effect data are available, the geometric mean of multiple values for the same endpoint is calculated where possible.
Subsequently, when several endpoints are available for one species, the lowest of these endpoints (per species) is reported in the aggregated data table.
1.3.3 Physico-chemical data
The aquatic ERLs for dibutyltin and tributyltin are adopted from other reports and some additional data have also been adopted. The physico-chemical data in these reports are however limited. Therefore, for the physico-chemical data of these substances, the original sources have been checked where possible and supplemented with sources as indicated in the INS-guidance.
1.3.4 Species of organotin compounds
All three organotin compounds are available in different species that could have a different toxicity. Therefore, endpoints for toxicity are not pooled for the different species and the endpoint for the most toxic species is selected where available.
1.3.5 Correction for the use of laboratory feed in bird and mammal test
In the assessment factors that are applied to use toxicity data for birds and mammals for the assessment of secondary poisoning, a factor of three is involved. This correction factor is applied to correct for the difference in calorific value of the feed used in the laboratory trials in comparison to the feed
consumed by wild animals in the field. This value is based on the consumption of fish for the assessment in aquatic ecosystems. This value is however also used for the assessment in soil ecosystems and is currently under discussion for this approach since the calorific value of earthworms is lower than that for fish. Based on this, the exposure through secondary poisoning in soil ecosystems might be underestimated using the factor of three. The factor of three is used for as long as no alternative value is decided upon but the assessments for secondary poisoning in soil ecosystems should be re-evaluated when a new value becomes available.
1.4 Status of the results
The results presented in this report have been discussed by the members of the scientific advisory group for the INS-project (WK-INS). It should be noted that the ERLs in this report are scientifically derived values, based on
(eco)toxicological, fate and physico-chemical data. They serve as advisory values for the Dutch Steering Committee for Substances, which is appointed to set the Environmental Quality Standards (EQSs). ERLs should thus be
2
Dibutyltin
2.1 Data sources
For dibutyltindichloride, aquatic ERLs have been derived by the ‘Internationale Commissie ter Bescherming van de Rijn – ICBR’ (International Commission for the Protection of the Rhine) according to the requirements of the Water
Framework Directive. These ERLs are adopted in Dutch legislation and therefore these ERLs are also adopted in this report. The derivation of these ERLs has been reported in the report ‘Afleiding van milieukwaliteitsnormen voor
Rijnrelevante stoffen’ (ICBR, 2009). In ICBR (2009), the ecotoxicological ERLs are expressed for dibutyltindichloride. In this report, the ERLs are expressed as the DBT-cation.
2.2 Substance information
2.2.1 Information on production and use
Dibutyltin compounds are being used as stabilisers in PVC, as catalysers for polymers and as coating for glass. Other uses are as regulator for the charge in printer toner or as stabiliser of press ink.
2.2.2 Identification
Information on the identification of dibutyltindichloride is presented in Table 3.
Table 3. Identification of dibutyltindichloride
Chemical name Dibutyltindichloride
Synonyms DBT, dibutyltin CAS-number 683-18-1 EC-number 211-670-0 Structural formula
Sn
Cl
Cl
CH
3C
H
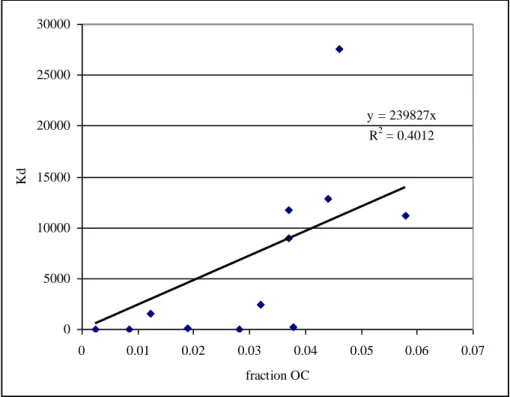
3 Molecular formula C8H18Cl2Sn SMILES code CCCCSn(Cl)(Cl)CCCC 2.2.3 Physico-chemical propertiesPhysico-chemical properties of dibutyltindichloride are presented in Table 4. Since the ERLs for DBT in soil and sediment are calculated via equilibrium partitioning, a literature search was performed on sorption parameters of DBT in soils and sediments. Since only two studies with soils were available, also results from studies with sediments were used. The available studies are validated and the reliable endpoints are used to determine the average log Koc. Brief details of the studies are given in Appendix 1. The Koc in ICBR (2009) originates from a citation in the citation based on only two references. Only one of these references could be retrieved and is included in the studies assessed in
Appendix 1. Figure 1 shows the correlation between the sorption constant Kd and the fraction organic carbon for the reliable endpoints given in Appendix 1. From this figure, it can be seen that the sorption of a soil is influenced by the faction of organic carbon. Therefore, the derived ERLs for soil and sediment are
normalised standard Dutch soil with 10% organic matter and application of equilibrium partitioning, based on the Koc, is considered acceptable.
y = 239827x R2 = 0.4012 0 5000 10000 15000 20000 25000 30000 0 0.01 0.02 0.03 0.04 0.05 0.06 0.07 fraction OC Kd
Figure 1. Correlation between sorption constant Kd and the fraction organic
carbon
Table 4. Physico-chemical properties of dibutyltindichloride Bold values are used for ERL derivation.
Parameter Unit Value Remark Ref.
Molecular weight [g/mol] 303.85
Water solubility [mg/L] 320 20°C, pH 2.5, exp.
according to OECD 105 EU-ECB (2000b)
92 exp. 20°C US-EPA (2009)
47.5 EU-ECB (2000b)
pKa [-] n.a.
Log KOW [-] 1.5 ICBR (2009)
1.56 a MlogP Biobyte (2006)
1.56 ClogP Biobyte (2006)
0.97 EU-ECB (2000b)
Log KOC [-] 4.62 b average of 12 log Koc
values see Appendix 1
5.07 ICBR (2009)
Vapour pressure [Pa] 0.16 exp. 25°C ICBR (2009); EU-ECB
(2000b)
Melting point [°C] 42 exp. US-EPA (2009)
Boiling point [°C] 135 exp. US-EPA (2009)
Henry’s law constant [Pa.m3/mol] 1-1.38 25°C ICBR (2009) a It should be noted that in ICBR (2009) calculated log Kow values of 1.89 and 5.33 are reported for DBT-dichloride and DBT-oxide respectively.
b Considering the poor correlation between Kd and fraction organic carbon, the log Koc is based on the average log Koc values, rather than the slope of the fitted line.
2.2.4 Behaviour and distribution in the environment
Selected environmental properties of dibutyltin are presented in Table 5.
Table 5. Selected environmental properties of dibutyltin
Parameter Unit Value Remark Ref.
Hydrolysis half-life DT50 [d] - ICBR (2009)
Degradation DT50 [d] 122 in soil RPA (2005)
Photolysis half-life DT50 [d] 0.6 RPA (2005)
Biodegradability inherently biodegradable RPA (2005)
Relevant metabolites none ICBR (2009)
2.2.5 Bioconcentration and biomagnification
In ICBR (2009) bioconcentration factors of 12-135 L/kg have been reported. Considering the maximum BCF of 135 L/kg, the risk of secondary poisoning is assessed for dibutyltin.
2.3 Risk limits for water
In ICBR (2009), aquatic risk limits have been derived for dibutyltindichloride. These risk limits are taken over in this report where available, except for human fish consumption.
2.3.1 Aquatic toxicity data
The selected fresh- and marine aquatic toxicity data for freshwater and marine species, reported in ICBR (2009), are given in Table 6 and Table 7. All these studies were evaluated for ICBR (2009) unless stated otherwise; it is however not indicated which were considered valid. Therefore, it is presumed that this involves only the studies adopted in the selected data tables.
Table 6. Dibutyltin: selected freshwater toxicity data for ERL derivation expressed for dibutyltindichloride
Chronic NOEC/EC10 Acute L(E)C50
Taxonomic group (µg/L) Taxonomic group (µg/L)
Algae Algae
Scenedesmus obliquus 2.4 Ankistrodesmus falcatus acicularis 17400 Scenedesmus obliquus 89.4 a
Crustacea
Daphnia magna 534 b
Pisces Pisces
Oncorhychus mykiss 48.6 Leuciscus idus 600
Poecilia reticulata 1800 Oryzias latipes 2933 c a Geometric mean of 80 and 100 µg/L
b Geometric mean of 900 and 317 µg/L
c Geometric mean of 5800, 1023, 3249, 981 and 11476 µg/L
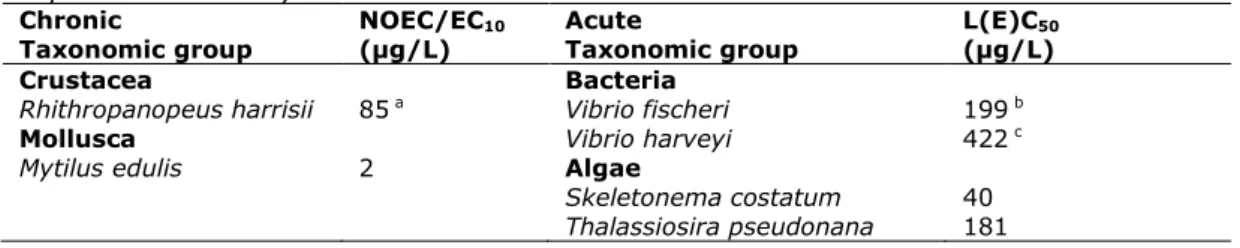
Table 7. Dibutyltin: selected toxicity data for marine species for ERL derivation expressed for dibutyltindichloride
Chronic NOEC/EC10 Acute L(E)C50
Taxonomic group (µg/L) Taxonomic group (µg/L)
Crustacea Bacteria
Rhithropanopeus harrisii 85 a Vibrio fischeri 199 b
Mollusca Vibrio harveyi 422 c
Mytilus edulis 2 Algae
Skeletonema costatum 40 Thalassiosira pseudonana 181
Chronic NOEC/EC10 Acute L(E)C50
Taxonomic group (µg/L) Taxonomic group (µg/L)
Pisces Rotifera
Cyprinodon variegatus d 453 Brachionus plicatilis 625
a Geometric mean of 72.1 and 101 µg/L b Geometric mean of 182 and 217 µg/L c Geometric mean of 380, 440 and 450 µg/L
d In ICBR (2009) the endpoint for this species was tabulated under freshwater; the experiment is however performed in diluted seawater with a salinity of 15‰. Since the fresh- and saltwater datasets are combined (see below), this does not affect the results. 2.3.2 Treatment of fresh- and saltwater toxicity data
In ICBR (2009), it is statistically shown that there is no significant difference between fresh- and saltwater data (p = 0.14 and p = 0.46 for acute and chronic, respectively). Therefore, the two datasets were combined.
2.3.3 Derivation of the MPCwater
2.3.3.1 Derivation of the MPCwater, eco
In ICBR (2009), a PNEC for fresh surface water of 0.2 µg/L expressed for dibutyltindichloride has been derived on the basis of the NOEC of 2 µg/L for mollusc with an assessment factor of 10 because chronic data are available for an algae, a crustacean and fish. This value expressed for the dibutyltin cation as 0.15 µg/L is taken over as the MPCfw, eco. For the marine environment, the same MPC of 0.2 µg/L expressed for dibutyltindichloride has been derived, using an assessment factor of 10 because toxicity data were available for two specific marine taxonomic groups. This value expressed as 0.15 µg/L for the dibutyltin cation is taken over as the MPCsw, eco.
2.3.3.2 Derivation of the MPCwater, secpois
In ICBR (2009), a quality standard for animals eating aquatic organisms has been calculated of 0.22 µg/L for the dibutyltin cation. The calculated MPC is based on a NOEC of 30 mg/kgfood for growth reduction (FH-IME, 2007) from a 90 days oral study with rats. An assessment factor of 90 (resulting in an MPCoral, min of 0.3 mg/kgfd), a BCF of 135 L/kg and an additional assessment factor of 10 has been applied. The reason for the additional assessment factor is unknown. Since this value is higher than the MPCs for fresh and salt surface water based on direct ecotoxicity, these MPCs can be considered to be protective for secondary poisoning.
2.3.3.3 Selection of the MPCwater
The MPCwater, secpois is higher than the MPCs for fresh and salt surface water, based on direct ecotoxicity; these MPCs can be considered to be protective for secondary poisoning. The MPCfw and MPCsw are 0.15 µg/L.
2.3.4 Derivation of the MACwater, eco
In ICBR (2009), a PNEC for short-term exposure has been derived by dividing the lowest acute toxicity value of 40 µg/L for an algae, by a factor of 1000. This factor has been used according to Lepper (2005) because dibutyltin has a BCF >100 L/kg and therefore a potential to bioaccumulate, and an additional assessment factor of 10 was applied over the standard assessment factor of 100. The derived value of 0.04 µg/L expressed for dibutyltindichloride was not put forward as final value because it was lower than the PNEC for fresh surface water. Currently, in accordance with the coming new guidance for derivation of
quality standards under the Water Framework Directive, the additional
assessment factor of 10 for bioaccumulating substances is not applied anymore because bioaccumulation is not considered relevant for short-term exposure toxicity. Therefore the MACfw, eco is set in line with the current methodology expressed for the dibutyltin cation at 0.3 µg/L.
For the saltwater environment, also no MAC has been proposed because it was lower than the PNEC. Since the datasets for fresh- and saltwater are combined, the MACsw, eco is based on the combined dataset with an additional assessment factor of 10 because no acute endpoints are available for specific marine
species. The MACsw, eco is 0.03 µg/L for the dibutyltin cation. However, this value is lower than the MPCsw, eco, this is deemed unrealistic. Therefore, the MACsw, eco is set equal to the MPCsw, eco at 0.15 µg/L.
2.3.5 Derivation of the SRCwater
2.3.5.1 Derivation of the SRCwater, eco
The SRCwater, eco is calculated as the geometric mean of the chronic endpoints given in Table 6 and Table 7 and expressed for the dibutyltin cation: 50 µg/L. 2.3.5.2 Derivation of the SRCwater, secpois
For the SRCeco, oral, the NOEC of 30 mg/kgfood for growth reduction of rats, as used for the MPC for secondary poisoning, is used as representative for rats. Correction for laboratory feed (assessment factor 3) and correction from subchronic to chronic (assessment factor 3) results in an NOEC for rats of 3.3 mg/kgfood. In addition, a LOAEL of 2.2 mg/kgbw/d for the dibutyltin cation is available for maternal food consumption and fetal development of cynomolgus monkeys (macaque) exposed from day 20 to 50 during pregnancy (Ema et al., 2007). This is considered a chronic endpoint. Conversion to food with a factor 20 and after application of an assessment factor of 3 to correct for laboratory feed and a factor 10 to convert from LOAEL to a NOAEL, the NOEC for monkeys is 1.5 mg/kgfood. The SRCeco, oral is equal to the geometric mean of the NOEC values for rats and monkeys and is 2.2 mg/kgfood. With this value and the BCF of 135 L/kg, the SRCwater, secpois is 16 µg/L.
2.3.5.3 Selection of the SRCwater
The SRCwater is determined by the lowest value, this is the SRCwater, secpois of 16 µg/L.
The SRCwater is valid for the fresh- and saltwater environment.
2.4 Risk limits for groundwater
The MPCgw, eco and SRCgw, eco are equal to the MPCfw, eco and SRCfw, eco and are 0.15 µg/L and 50 µg/L respectively for the dibutyltin cation.
2.5 Risk limits for sediment
2.5.1 Derivation of the MPCsediment, eco
In ICBR (2009) a quality standard for sediment of 23.5 µg/kgdwt (and 51.1 µg/kgwwt) has been derived from the PNEC for water using equilibrium partitioning. In this calculation, an additional assessment factor of 10 has been used since the log Kow for DBT-oxide is higher than 5. This assessment factor
corrects for other exposures than via (pore)water which should be considered for high Kow values. Calculation of this value in ICBR (2009) does however contain an error since conversion from wet- to dry sediment should give a higher concentration rather than a lower concentration. Application of the additional assessment factor of 10 is considered not necessary since the maximum BCF of 135 L/kg indicated that the contribution of ingestion is not significant. Use of the log Koc value derived in this report (this value is preferred since it is based on endpoints for more (different) soils) results in a value of 0.37 mg/kgdwt for Dutch standard soil.
2.5.2 Derivation of the SRCsediment, eco
An SRCsediment, eco has not been derived in ICBR (2009); application of equilibrium partitioning on the SRCwater, eco provides a value of 123 mg/kgdwt for Dutch standard sediment with 10% OM expressed for the dibutyltin cation. This calculation has been performed with the log Koc derived in this report (see section 2.2.3). The additional assessment factor of 10 as applied in ICBR (2009) for substances with a log Kow > 5 is not applied for the reason given above.
2.6 Risk limits for soil
2.6.1 Soil toxicity data
No soil toxicity data are available from the public literature.
2.6.2 Derivation of the MPCsoil
2.6.2.1 Derivation of MPCsoil, eco
Since no soil toxicity data are available, the MPCsoil, eco is calculated from the MPCfw, eco given above and the Koc value derived in this report using equilibrium partitioning. The calculated MPCsoil, eco is 0.37 mg/kgdwt for the dibutylin cation in Dutch standard soil with 10% organic matter.
2.6.2.2 Derivation of the MPCsoil, secpois
A BCF has been reported higher than 100 L/kg; therefore, secondary poisoning is triggered. An MPCsoil, secpois can be calculated from the MPCoral, min of
0.3 mg/kgfd given above with the method as described in Van Vlaardingen and Verbruggen (2007). A BCF for earthworms is not available and the use of a QSAR on the basis of the log Kow is considered not appropriate considering the large difference between the log Kow values of dibutyltindichloride and
bioaccumulation characteristics of dibutyltin. Therefore, the use of the BCF for fish of 135 L/kg is considered the best alternative. The calculated MPCsoil, secpois is 3.8 mg/kgdwt for the dibutylin cation in Dutch standard soil with 10% organic matter.
2.6.2.3 Selection of the MPCsoil
Since the MPCsoil, secpois is higher than the MPCsoil, eco (more than a factor of 10), it can be considered that the MPCsoil, eco is protective for secondary poisoning. Therefore, the MPCsoil is set by the MPCsoil, eco: 0.37 mg/kgdwt for the dibutylin cation in Dutch standard soil with 10% organic matter.
2.6.3 Derivation of the SRCsoil
2.6.3.1 Derivation of the SRCsoil, eco
Since no soil toxcitiy data are available, the SRCsoil, eco is calculated from the SRCfw, eco given above, using equilibrium partitioning. The calculated SRCsoil, eco is 123 mg/kgdwt for the dibutylin cation in Dutch standard soil with 10% organic matter.
2.6.3.2 Derivation of the SRCsoil, secpois
For the SRCeco, oral, the geometric mean of the values for rats and monkeys of 2.2 mg/kgfood as determined above is used. With this value, the SRCsoil, secpois, as calculated with the method as described in Van Vlaardingen and Verbruggen (2007), is 28 mg/kgdwt for Dutch standard soil.
2.6.3.3 Selection of the SRCsoil
Since the SRCsoil, secpois is lower than the SRCsoil, eco, the SRCsoil will be 28 mg/kgdwt for dibutyltin cation in Dutch standard soil.
2.6.4 Geometric mean of MPC and SRC
The geometric mean of the MPCsoil and SRCsoil is 3.2 mg/kgdwt for the dibutyltin cation. Since this value is based on two different routes of exposure, it is not equivalent to an HC20.
3
Tributyltin
3.1 Data sources
For tributyltin compounds, aquatic ERLs have been derived by the European Commission under the Water Framework Directive (EC, 2005). The ERLs for tributyltin expressed for the TBT-ion are adopted as the ERLs for all tributyltin compounds.
3.2 Substance information
3.2.1 Information on production and use
Tributyltin compounds are being used for wood preservation, antifouling in marine paints and for antifungal action in textiles and industrial water systems. The use of tributyltin as antifouling has been banned since 2003 in the EU (RIVM, 2010, Norway, 2008) and other biocidal use should have ceased before September 2006 (Norway, 2008). Other uses are still allowed and
bis(tributyltin)oxide as well as tributyltin chloride are registered under REACH. Further marketing and use restrictions are currently under consideration within the REACH framework (Norway, 2008) and tributyltin is placed on the REACH candidate list for inclusion in Annex XIV (www.echa.europa.eu). This means that only use in closed systems will be allowed.
3.2.2 Identification
Information on the identification of different species of tributyltin presented in EC (2005) are given in the tables below. Details on three different forms of tributyltin are presented, in the environment; all three will become available as the tributyltin-cation.
Table 8. Identification of the tributyltin cation
Chemical name Tributyltin cation
Synonyms TBT, tri-n-butyltin CAS-number 36643-28-4 EC-number - Structural formula
Sn
+CH
3CH
3C
H
3 Molecular formula C12H28Sn SMILES code CCCCSn(CCCC)CCCCTable 9. Identification of tributyltin hydride
Chemical name Tributyltin hydride
Synonyms TBT, tri-n-butyltin hydride
CAS-number 688-73-3 EU-number 211-704-4 Structural formula
SnH
CH
3CH
3C
H
3 Molecular formula C12H29Sn SMILES code CCCCSn(CCCC)CCCCTable 10. Identification of tributyltin chloride
Chemical name Tributyltin chloride
Synonyms TBT-Cl, tri-n-butyltinchloride; Tributylchlorostannane
CAS-number 1461-22-9 EC-number 215-958-7 Structural formula
Sn
CH
3CH
3C
H
3Cl
Molecular formula C12H28ClSn SMILES code CCCCSn(Cl)(CCCC)CCCCTable 11. Identification of bis(tributyltin)oxide Chemical name Bis(tributyltin)oxide
Synonyms TBT, tributyltin oxide
CAS-number 56-35-9 EC-number 200-268-0 Structural formula Sn C H3 C H3 CH3 O Sn CH3 CH3 C H3
Molecular formula C24H54OSn
3.2.3 Physico-chemical properties
Physico-chemical properties of different species of tributyltin presented in EC (2005) are summarized in the tables below. Since the ERLs for TBT in sediment are calculated through equilibrium partitioning and the Koc in EC (2005)
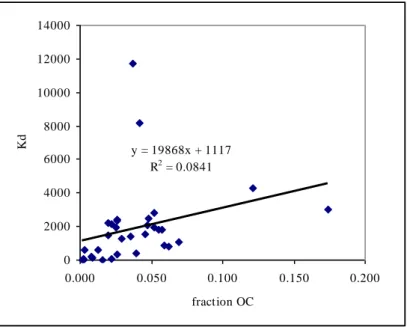
originates from only two unavailable studies, a literature search is performed on sorption parameters of TBT in soil and sediments. Like the case for DBT, the studies are validated and the reliable endpoints are used to determine the average log Koc. Brief details if the studies are given in Appendix 1. Figure 2 shows the correlation between the sorption constant Kd and the fraction organic carbon for the endpoints for tributyltin given in Appendix 1. From this figure, it can be seen that the sorption of a soil to some extent is influenced by the faction of organic carbon. Therefore, the derived ERLs for soil and sediment are normalised standard Dutch soil with 10% organic matter, and application of equilibrium partitioning, based on the Koc, is considered acceptable.
y = 19868x + 1117 R2 = 0.0841 0 2000 4000 6000 8000 10000 12000 14000 0.000 0.050 0.100 0.150 0.200 fraction OC Kd
Figure 2. Correlation between sorption constant Kd and the fraction organic carbon
Table 12. Physico-chemical properties of tributyltin hydride
Parameter Unit Value Remark Ref.
Molecular weight [g/mol] 291.09
Water solubility [mg/L] 5.3 25°, estimated
from log Kow of 4.00 US EPA (2009)
pKa [-]
Log KOW [-] 4.00 estimated ClogP Biobyte (2006)
7.35 estimated US EPA (2009)
4.1 experimental SRC (2011)
Log KOC [-] n.a. see TBT-Cl
Vapour pressure [Pa] 766.6 experimental, 25°C US EPA (2009)
5.3 estimated, 25°C US EPA (2009)
Melting point [°C] 80 experimental US EPA (2009)
Boiling point [°C] 250 estimated US EPA (2009)
122.5-113.5 HSDB (2005)
Henry’s law constant [Pa.m3/mol] 42 x 103 25°C, calculated: mw x vp/ws
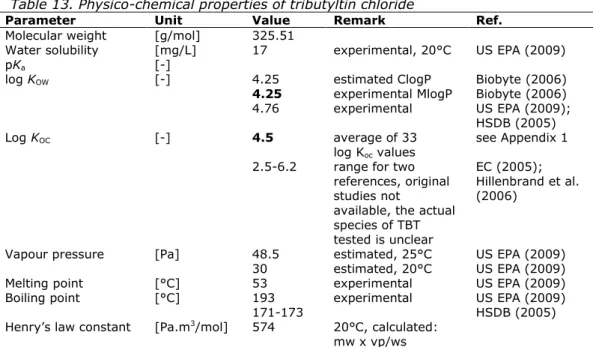
Table 13. Physico-chemical properties of tributyltin chloride
Parameter Unit Value Remark Ref.
Molecular weight [g/mol] 325.51
Water solubility [mg/L] 17 experimental, 20°C US EPA (2009)
pKa [-]
log KOW [-] 4.25 estimated ClogP Biobyte (2006)
4.25 experimental MlogP Biobyte (2006)
4.76 experimental US EPA (2009);
HSDB (2005)
Log KOC [-] 4.5 average of 33
log Koc values see Appendix 1 2.5-6.2 range for two
references, original studies not
available, the actual species of TBT tested is unclear
EC (2005); Hillenbrand et al. (2006)
Vapour pressure [Pa] 48.5 estimated, 25°C US EPA (2009)
30 estimated, 20°C US EPA (2009)
Melting point [°C] 53 experimental US EPA (2009)
Boiling point [°C] 193 experimental US EPA (2009)
171-173 HSDB (2005)
Henry’s law constant [Pa.m3/mol] 574 20°C, calculated: mw x vp/ws
* This value of 4.5 is used where necessary since this value is located within the range as reported in EC (2005) and is based on a large number of studies. Considering the poor correlation between Kd and fraction OC, the log Koc is based on the average log Koc values, rather than the slope of the fitted line.
Table 14. Physico-chemical properties of bis(tributyltin)oxide
Parameter Unit Value Remark Ref.
Molecular weight [g/mol] 596.12
Water solubility [mg/L] 19.5 Experimental, temperature
unknown US EPA (2009) 4 HSDB (2005) 18-61.4 EC (2005) 0.75 pH 6.6 EC (2005), Hillenbrand et al. (2006) 31 pH 8.1 EC (2005) 4 pH 7, 20°C) Hillenbrand et al.(2006), Norway (2008) pKa [-]
Log KOW [-] 4.38 estimated ClogP Biobyte (2006)
3.84 experimental US EPA (2009)
4.05 estimated US EPA (2009)
3.85 EC (2005)
3.2-3.8 EC (2005)
Log KOC [-] n.a. see TBT-Cl
Vapour pressure [Pa] 0.001 20°C, experimental US EPA (2009)
Melting point [°C] < -45 EU-ECB (2000a)
Boiling point [°C] 220-230 EU-ECB (2000a)
173 EU-ECB (2000a)
180 EU-ECB (2000a)
Henry’s law
constant [Pa.m
3/mol] 0.15 20°C, calculated with water solubility of 4 mg/L: mw x vp/ws
* In EC (2005), also a value of 30 mg/L for a pH of 2.6 is reported. This value seems not realistic for this pH. In the latest version of the original reference (Hillenbrand et al., 2006); this value is not included anymore.
3.2.4 Behaviour and distribution in the environment
Selected environmental properties of tributyltin are presented in Table 15.
Table 15. Selected environmental properties of tributyltin
Parameter Unit Value Remark Ref.
Hydrolysis half-life DT50 [d] no information
Degradation DT50 [d] 20-35 in freshwater Hillenbrand (2006) Photolysis half-life DT50 [d] no information
Biodegradability not readily biodegradable US EPA (2009) Relevant metabolites none
Bis(tributyltin) oxide has been considered as a PBT substance and fulfils the PBT critera (Norway, 2008), and is placed on the REACH candidate list for inclusion in Annex XIV (www.echa.europa.eu). Since this substance transforms to the tributyltin cation in the environment, it can be concluded that the TBT-cation also fulfils the PBT criteria.
3.2.5 Bioconcentration and biomagnification
In EC (2005), bioconcentration factors for fish are reported of 2600 and
52000 L/kg. The latter value is for liver only. For molluscs, values ranging from 1000 to 11400 L/kg are reported, and for a crustacean a value of 500-4400 L/kg is reported. In EC (2005), a BCF of 6000 L/kg is used to assess the risk of secondary poisoning and human health through fish consumption. In
Van Herwijnen et al. (2012), it is stated that TBT does not biomagnify. It should be noted that the BCF for triphenyltin is determined to be 3500 L/kg
(Van Herwijnen et al., 2012). This value is lower than that for TBT; this is in contradiction with, as is reported in Van Herwijnen et al. (2012), that the biomagnification potential of triphenyltin is higher than for TBT. Therefore the value of 6000 L/kg for TBT is considered very high and should be seen as a worst case estimate.
3.3 Risk limits for water
In EC (EC, 2005), aquatic risk limits have been derived for the tributyltin ion. These risk limits are taken over in this report where applicable.
3.3.1 Aquatic toxicity data
The fresh- and saltwater toxicity data selected in EC (2005) are given in Table 16 and Table 17 respectively.
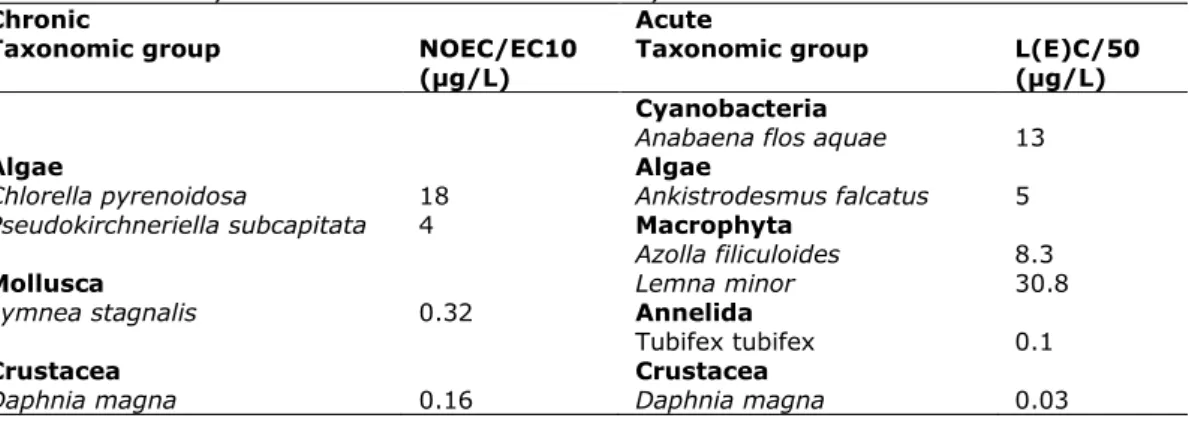
Table 16. Tributyltin: selected freshwater toxicity data for ERL derivation
Chronic Acute
Taxonomic group NOEC/EC10
(µg/L) Taxonomic group L(E)C/50 (µg/L) Cyanobacteria
Anabaena flos aquae 13
Algae Algae
Chlorella pyrenoidosa 18 Ankistrodesmus falcatus 5 Pseudokirchneriella subcapitata 4 Macrophyta
Azolla filiculoides 8.3
Mollusca Lemna minor 30.8
Lymnea stagnalis 0.32 Annelida
Tubifex tubifex 0.1
Crustacea Crustacea
Chronic Acute Taxonomic group NOEC/EC10
(µg/L) Taxonomic group L(E)C/50 (µg/L)
Insecta Insecta
Hexagenia sp. 0.5 Chironomus plumosus 0.05
Pisces Pisces
Oncorhynchus mykiss 0.04 Ictalurus punctatus 12 Pimephales promelas 0.17 Oncorhynchus mykiss 1.28
Poecilia reticula 0.01 Phoxinus phoxinus 0.69
Amphibia
Rana temporaria 1.65
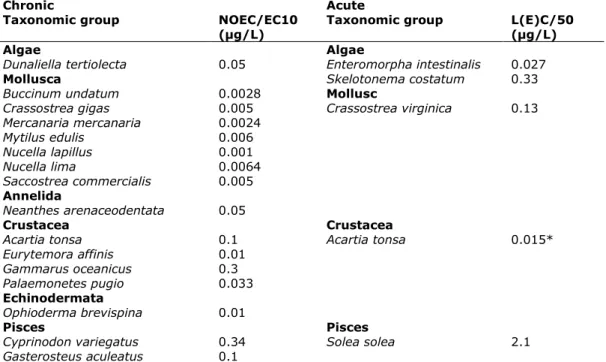
Table 17. Tributyltin: selected saltwater toxicity data for ERL derivation
Chronic Acute
Taxonomic group NOEC/EC10
(µg/L) Taxonomic group L(E)C/50 (µg/L)
Algae Algae
Dunaliella tertiolecta 0.05 Enteromorpha intestinalis 0.027
Mollusca Skelotonema costatum 0.33
Buccinum undatum 0.0028 Mollusc
Crassostrea gigas 0.005 Crassostrea virginica 0.13 Mercanaria mercanaria 0.0024 Mytilus edulis 0.006 Nucella lapillus 0.001 Nucella lima 0.0064 Saccostrea commercialis 0.005 Annelida Neanthes arenaceodentata 0.05 Crustacea Crustacea
Acartia tonsa 0.1 Acartia tonsa 0.015*
Eurytemora affinis 0.01 Gammarus oceanicus 0.3 Palaemonetes pugio 0.033 Echinodermata Ophioderma brevispina 0.01 Pisces Pisces
Cyprinodon variegatus 0.34 Solea solea 2.1
Gasterosteus aculeatus 0.1
* In EC (2005) a value of 0.0015 µg/L is tabulated, but in the text a value of 0.015 is used to derive the MAC-QS. Verification in the original reference revealed that the latter value is the correct one.
3.3.2 Treatment of fresh- and saltwater toxicity data
In EC (2005), it is reported that there is no difference between fresh- and saltwater data, and the two datasets were combined. From Table 16 and
Table 17 can however be seen that a difference between the two datasets is not unlikely (p = 0.076). Also, at the level of taxonomic groups, there seems to be a difference, for example for molluscs and algae.
3.3.3 Derivation of the MPCwater
3.3.3.1 Derivation of the MPCwater, eco
In EC (2005), a quality standard for fresh surface water of 0.2 ng/L has been derived on the basis of the HC5 of a Species Sensitivity Distribution (SSD) with an assessment factor of 4. For this SSD, it has been considered that plants are missing, but the quality standard derived through this method is preferred over one derived through the assessment factor method. The quality standard from the SSD is taken over as the MPCfw, eco. For the saltwater environment, the same quality standard of 0.2 ng/L has been derived because a comprehensive data set
on marine species is available. This quality standard is taken over as the MPCsw, eco.
3.3.3.2 Derivation of the MPCwater, secpois
In EC (2005), a quality standard for animals eating aquatic organisms has been calculated of 38 ng/L. The calculated quality standard is based on a reproduction NOAEL of 0.34 mg/kgbw/d for rats from a long term study, a conversion factor of 20, an assessment factor of 30 (resulting in an MPCoral, min of 0.23 mg/kgfd) and a BCF of 6000 L/kg. The value of 38 ng/L is taken over as the MPCfw, secpois. The BMF2 for the marine environment is set at 1; therefore, this value is also valid for the marine environment.
3.3.3.3 Selection of the MPCwater
The MPCfw and MPCsw are determined by the lowest value: 0.2 ng/L.
3.3.4 Derivation of the MACwater, eco
In EC (2005), a MAC-QS has been derived by dividing the lowest acute toxicity value, of 0.015 µg/L for Acartia tonsa, by a factor 10. This factor was used because the large dataset on freshwater and marine taxonomic groups shows that the other groups do not have a higher acute sensitivity to TBT-compounds. The dataset does however fulfil the requirements to perform an SSD:
- Fish: Ictalurus punctatus
- A second family of fish: Oncorhynchus mykiss and others - A crustacean: Daphnia magna and Acartia tonsa
- An insect: Chironomus plumosus
- A family in a phylum other than Arthropoda or Chordata: Crassostrea
virginica
- A family in any order of insect or any phylum not already represented:
Anabaena flos-aquae
- Algae: Ankistrodesmus falcatus and others - Higher plants: Lemna gibba
The use of an SSD is preferred since all data are involved. The SSD determined with ETX (Van Vlaardingen et al., 2004) is shown in Figure 3. The calculated HC5 is 0.010 µg/L, with a two sided 90% confidence interval of 0.0013 - 0.041 mg/L. The goodness of fit is accepted at all levels by the three statistical tests available in the program.
Figure 3 Species Sensitivity Distribution for tributyltin (acute data)
Nevertheless, for freshwater, the value of 1.5 ng/L derived in EC (2005), is taken over as the MACfw, eco. For the saltwater environment no MAC has been derived in EC (2005) and the MACsw, eco will be based on the SSD. Since acute toxicity data are available for one specific marine species (Crassostrea virginica), the MACsw, eco is derived from the HC5 by an assessment factor of 50 at
0.2 ng/L.
3.3.5 Derivation of the SRCwater
3.3.5.1 Derivation of the SRCwater, eco
The SRCwater, eco is determined by the HC50 of 46 ng/L from the SSD. 3.3.5.2 Derivation of the SRCwater, secpois
For the SRCeco, oral, the NOAEL of 0.34 mg/kgbw/d for rats from a long term study, as used for the MPCs for secondary poisoning, is used as representative for rats. Conversion to food (factor 20) and correction for laboratory feed (assessment factor 3) results in an NOEC for rats of 2.3 mg/kgfood. In addition, endpoints for two more species are available.
For mice, a NOAEL of 0.38 mg/kgbw/d for the tributyltin cation is available for testicular sperm head counts in mice orally exposed to TBT-O for 4 weeks during the premature period (Kumasaka et al., 2002). In contradiction, Yan et al. (2009) and Chen et al. (2008) reported much lower NOAELs of < 0.45 µg/kgbw for the tributyltin cation from a similar test with mice exposed to TBT-Cl once every three days. Apart from the different test substance, there is also a difference in the vehicle used. Kumasaka et al. (2002) used a solution in 0.2% ethanol while the other two studies used a solution with an ethanol: 0.85% sodium chloride ratio of 1:10 (v:v). In the case of Kumasaka et al. (2002), it can be questioned if the ethanol concentration was high enough to enable a full
solubility of the TBT-O. Presuming a vehicle volume of 5 µl/g as used in the other two studies, the doses would exceed the water solubility of TBT-O at a neutral pH, and at a lower pH as in the stomach the solubility will be even lower. If the substance would not be fully dissolved, this could influence the uptake and actual exposure of the mice tested. Considering this and the fact that a different substance is tested, the endpoint from Yan et al. (2009) and Chen et al. (2008) is selected. This is considered a chronic endpoint. Conversion to food with a factor 8.3 and after application of an assessment factor of 3 to correct for laboratory feed, a correction for daily exposure (factor 3) and an assessment factor of 10 to correct from LOAEL to NOAEL, the NOEC for mice is
0.04 µg/kgfood. For mice, a second NOEC of 19.5 mg/kgfood expressed for the TBT-cation is available for maternal toxicity of mice exposed during pregnancy (Baroncelli et al., 1990). This is also considered a chronic endpoint. Application of an assessment factor of 3 to correct for laboratory feed results in an NOEC of 6.5 mg/kgfood. Penza et al. (2011) reported a not-dose-related but significant effect on the fat/bodyweight ratio of mice exposed through diet at a
concentration of 5 µg/kgdiet for a period of three months. Since this effect is not dose-related (higher and lower concentrations showed no significant effects), it is unclear if this effect is caused by tributyltin or just an artefact. The first value for mice is most critical and will be used for the SRCwater, secpois. It should be noted that the fact that the selected endpoint for mice is much lower than that for rats as used for the MPCwater, secpois indicates that the MPCwater, secpois is probably underprotecting. This also involves the ADI as used in EC (2005). Furthermore a chronic NOEC of 24 mg/kgfood is available for hatchability of
Coturnix coturnix eggs of which the parents were exposed for six weeks in the
egg laying period (Coenen et al., 1992). Correction for laboratory feed results in an SRCoral for birds of 8 mg/kgfood. The geometric mean of the values for rats, mice and birds is 0.09 mg/kgfood. With this value and the BCF of 6000 L/kg, the SRCwater, secpois is 15 ng/L. Considering the fact that this value is based on a worst-case BCF, this value can also be considered worst-case. A more realistic approach would be to use the fish BCF for triphenyltin since this compound is considered to have a higher bioaccumulation potential than TBT. With the BCF of 3500 L/kg for triphenyltin, the SRCwater, secpois is 26 ng/L. The latter value is preferred.
3.3.5.3 Selection of the SRCwater
The SRCwater is determined by the lowest value; this is the SRCwater, secpois of 26 ng/L.
The SRCwater is valid for the fresh- and saltwater environment.
3.4 Risk limits for groundwater
The MPCgw, eco and SRCgw, eco are equal to the MPCfw, eco and SRCfw, eco and are 0.2 ng/L and 46 ng/L respectively.
3.5 Risk limits for sediment
3.5.1 Derivation of the MPCsediment, eco
In EC (2005), a quality standard for sediment of 0.02 µg/kgdwt has been derived from the quality standard for fresh surface water using equilibrium partitioning and a log Koc of 3.0. For Dutch standard soil with 10% OM, this value is 0.01 µg/kgdwt. Since this log Koc is relatively low compared to the range of
log Koc values tabulated in Appendix 1, the MPCsediment, eco should be seen as a worst case estimate.
3.5.2 Derivation of the SRCsediment, eco
An SRCsediment, eco has not been derived in EC (2005); application of equilibrium partitioning on the SRCwater, eco provides a value of 27 µg/kgdwt for Dutch
standard soil with 10% OM. This calculation has been performed with the log Koc of 4.0 derived in this report.
3.6 Risk limits for soil
3.6.1 Soil toxicity data
Selected soil toxicity data are given in Table 18; details on these endpoints are tabulated in Appendix 2.
Table 18. Tributyltin: selected soil toxicity data for ERL derivation
Chronic Acute
Taxonomic group NOEC/EC10 (mg/kgdwt)
Taxonomic group L(E)C/50 (mg/kgdwt)
Microbial processes Microbial processes e respiration/dehydrogenase/
ATP content 12 Potential nitrification 65
Potential nitrification 221 Potential nitrification 279
Macrophyta Macrophyta
Avena sativa 1395 f
Brassica rapa 37.4 a Brassica rapa 63 g
Annelida Annelida
Eisenia fetida 7.2 b Eisenia fetida 7.9 h Eisenia andrei 2.4 c
Collembola
Folsomia candida 55.6 d
a Geometric mean of EC10 values of 205.2, 9.5, 26.1, 9.3, 72.0, 137.8, 9.0 and 91.3 mg/kgdwt for Dutch standard soil
b Geometric mean of 7.6, 10.3 and 4.8 mg/kgdwt for Dutch standard soil
c Most sensitive endpoint reproduction; geometric mean of 4.7, 5.1, 1.1, 0.2, 5.2, 1.0, 6.1, 8.7 and 2.1 mg/kgdwt for Dutch standard soil
d Lowest geometric mean of 70.2, 26.4, 29.1, 72.6, 61.8, 110.4, 18.2, 89.9, 209.6 and 30.6 mg/kgdwt for mortality expressed for Dutch standard soil
e Endpoints for microbial processes derived from tests with different soils are considered as endpoints from different species, considering the different microbial populations present in the different soils
f Geometric mean of 1159, 1907 and 1227 mg/kgdwt for Dutch standard soil g Geometric mean of 64, 55 and 70 mg/kgdwt for Dutch standard soil h Geometric mean of 13.5 and 4.6 mg/kgdwt for Dutch standard soil
3.6.2 Derivation of the MPCsoil,
3.6.2.1 Derivation of the MPCsoil, eco
Chronic soil toxicity data are available for producers (Brassica rapa), consumers (Eisenia sp. and Folsomia candida) and bacterial processes. With chronic data representing three trophic levels, an assessment factor of 10 can be applied to
lowest value of 2.4 mg/kg. This results in an MPCsoil, eco of 0.24 mg/kgdwt for Dutch standard soil with 10% organic matter.
3.6.2.2 Derivation of the MPCsoil, secpois
A BCF has been reported higher than 100 L/kg therefore secondary poisoning is triggered. An MPCoral, min can be detrmined from the lowest NOAEL of
< 0.45 µg/kgbw for mice given in Section 3.3.5.2. This value can be considered a chronic LOAEL. Conversion to food with a factor 8.3 and after application of an assessmentfactor of 10 to correct from LOAEL to NOAEL, correction for daily exposure (factor 3) and an assessmentfactor of 30 gives an MPCoral, min of 0.004 µg/kfood. From this value, an MPCsoil, secpois can be calculated with the method as described in Van Vlaardingen and Verbruggen (2007). A BCF for earthworms is not available and the use of a QSAR on the basis of the log Kow is considered not appropriate considering the bioaccumulation characteristics of TBT. Therefore, the use of the BCF for fish is considered the best alternative. The Kow value used was 4.06 as it was the average of the experimental values for the three TBT-species given in section 3.2.3. The Henry's law constant used was 106 Pa/m3/mol as the geometric mean of the values for the three TBT-species. With the log Koc value of 4.5 and the worst case BCF of 6000 L/kg, the calculated MPCsoil, secpois is 1.4 ng/kgdwt for Dutch standard soil with 10% organic matter. This value is much lower than the MPCsoil, eco of 0.24 mg/kgdwt.
Considering the fact that this value is based on a worst-case BCF, this value can also be considered worst-case. A more realistic approach would be to use the fish BCF for triphenyltin since this compound is considered to have a higher bioaccumulation potential than TBT. With the BCF of 3500 L/kg for triphenyltin, the MPCsoil, secpois is 2.3 ng/kgdwt for Dutch standard soil with 10% organic matter. The latter value is preferred.
3.6.2.3 Selection of the MPCsoil
Since the worst-case MPCsoil, secpois is lower than the MPCsoil, eco, the first will set the MPCsoil at 2.3 ng/kgdwt for Dutch standard soil with 10% organic matter.
3.6.3 Derivation of the SRCsoil
3.6.3.1 Derivation of the SRCsoil, eco
The SRCsoil, eco is calculated as the geometric mean of the chronic toxicity data in Table 18. The SRCsoil, eco is 13 mg/kgdwt for Dutch standard soil with 10%organic matter.
3.6.3.2 Derivation of the SRCsoil, secpois
For the SRCeco, oral, the geometric mean of the values for rats, mice and birds of 0.09 mg/kgfood as determined above is used for calculation of the SRCsoil, secpois. With use of the log Koc value of 4.5 and a fish BCF of 6000 L/kg, the calculated SRCsoil, secpois would be 31 µg/kgdwt for Dutch standard soil with 10% organic matter. Considering the use of the worst-case BCF, this value should also be seen as worst-case. A more realistic approach would be to use the fish BCF for triphenyltin since this compound is considered to have a higher bioaccumulation potential than TBT. With the BCF of 3500 L/kg for triphenyltin, the SRCsoil, secpois is 52 µg/kgdwt for Dutch standard soil with 10% organic matter. The latter value is preferred.
3.6.3.3 Selection of the SRCsoil
The SRCsoil is set by the lowest value, this is the SRCsoil, secpois of 52 µg/kgdwt for Dutch standard soil with 10% organic matter.
3.6.4 Geometric mean of the MPC and SRC
4
Triphenyltin
4.1 Data sources
Triphenyltin compounds are triphenyl derivatives of tetravalent tin. They are lipophilic and have low solubility in water. Since triphenyltin compounds are believed to dissociate in the environment and remain unchanged, data available for all triphenyltin compounds (triphenyltin chloride, -acetate, -hydroxide) are evaluated. The ERLs will be expressed in concentration of the dissociated cation. In Van Herwijnen et al. (2012), aquatic risk limits have been derived for
triphenyltin. These risk limits are adopted in this report where applicable.
4.2 Substance information
4.2.1 Information on production and use
Triphenyltin compounds have been used extensively as algicides and molluscicides in antifouling products since the 1960s. Use of triorganotins in antifouling paints has been restricted in many countries because of their catastrophic effects on the oyster industry and more general effects on the aquatic ecosystem. Triphenyltin is used as a non-systemic fungicide with mainly protective action.
4.2.2 Identification
Information on the identification of different species of triphenyltin are presented in the tables below.
Table 19. Identification of triphenyltin
Chemical name Triphenyltin
Synonyms Fentin, TPT
Structural formula
Sn+
Molecular formula C18H15Sn
SMILES code c1ccccc1[Sn+](c2ccccc2)c3ccccc3
Table 20. Identification of triphenyltin chloride
Chemical name Triphenyltin chloride
Synonyms Fentin chloride, TPTCl
CAS number 639-58-7 EC number 211-358-4 Structural formula Sn Cl Molecular formula C18H15SnCl SMILES code Cl[Sn](c1ccccc1)(c2ccccc2)c3ccccc3
Table 21. Identification of triphenyltin hydroxide
Chemical name Triphenyltin hydroxide
Synonyms Fentin hydroxide, TPTH
CAS number 76-87-9
EC number 200-990-6
Structural formula
Sn OH
Molecular formula C18H16SnO
SMILES code O[Sn](c1ccccc1)(c2ccccc2)c3ccccc3
Table 22. Identification of triphenyltin acetate
Chemical name Triphenyltin acetate
Synonyms Fentin acetate, TPTAc
CAS number 900-95-8
EC number 212-984-0
Structural formula
Sn Ac
Molecular formula C20H18O2Sn
SMILES code O=C(C)O[Sn](c1ccccc1)(c2ccccc2)c3ccccc3
4.2.3 Physico-chemical properties
Physico-chemical properties of triphenyltin are presented in the following tables for different ionic forms.
Table 23. Physico-chemical properties of triphenyltin chloride Bold values are used for ERL derivation.
Parameter Unit Value Remark Ref.
Molecular weight [g/mol] 385.5 HSDB (2005)
Water solubility [mg/L] 40 20°C HSDB (2005)
1.2 10°C, pH 7.5, distilled water* Inaba et al. (1995) 0.6 10°C, pH 7.5, seawater* Inaba et al. (1995) 0.99 estimated from log Kow of 4.19,
25°C US EPA (2009)
1 25°C, from experimental database US EPA (2009) 0.078 estimated from fragments US EPA (2009)
pKa [-] n.a.
Log KOW [-] 3.56 estimated - ClogP Biobyte (2006)
4.19 experimental - MlogP Biobyte (2006)
4.19 HSDB (2005)
Log KOC [-] 3.89 Experimental calculated from
Freundlich log Kd of 1.81 and fom of 1.43%, 1/n = 0.793
Sun et al. (1996) 3.5 QSAR Sabljic hydrophobics Van Vlaardingen and
Verbruggen (2007)
5.7 MCI method US EPA (2009)
3.6 Kow method US EPA (2009)
5.09;
4.73 Laboratory experiment with field sediment; calculated from log Kd and %oc