Report no. 607504006
Acute Aquatic Risk Indicator for Pesticides
R. Luttik and D.F. Kalf
September 1998
This research has been carried out on beiialf of the Directorate-General for Environmental Protection of the Ministry of Housing, Spatial Planning and the Environment in the framework of project 607504 "Mapping Ecotoxicological Effects of Substances". National Institute of Public Health and the Environment, P.O. Box 1, 3720 BA Bilthoven, tel. 31-30-2749111, fax 31-30-2742971.
MAILING LIST
I - 10 Directoraat-Generaal Milieubeheer, Directie Stoffen, Veiligheid en Straling, d.t.v. Dr D.W.G. Jung
II - 20 Directoraat-Generaal Milieubeheer, Directie Drinkwater, Water en Landbouw, d.t.v. Drs M. van de Gaag
21 Directeur-Generaal Milieubeheer, H.A.P.M. Pont
22 Plv. Directeur-Generaal Milieubeheer, Dr Ir B.C.J. Zoeteman 23 Plv. Directeur-Generaal Milieubeheer, Mr G.J.R. Welters 24 Plv. Directeur-Generaal Milieubeheer, Drs P.E. de Jongh
25 Dr H. Koepp, Federal Biological Research CenU"e for Agriculture and Forestry (BBA) Braunsschweig, Germany
26 Dr J. Carley, Environmental protection Agency, Washington, USA
27 Dr D.R. Forney, Dupont Agricultural Products Company, Chestertown, USA 28 Dr V. Gutsche, Institut fur Folgeabschatzung im Pflanzenschutz,
Kleinmachow, Germany
29 Dr V. Hodge, Pest Management Regulatory Agency, Ottawa, Canada 30 Dr Y. Ishii, National Institute of Agro-Environmental Sciences, Ibaraki,
Japan
31 Prof Dr J-M. Jouany, Faculte Medecine et Pharmacia, Verrieres-le-Buisson, France
32 Dr E. Kiefer, Novartis Crop Protection Ltd., Bazel, Switserland
33 Dr T. Yokoyama, Ministry of Agriculture, Forestry and Fisheries, Japan 34 Dr A. Hart, MAFF Central Science Laboratory, UK
35 Dr M.R. Thomas, MAFF Cental Science Laboratory, UK 36 Dr N. Grandy, OECD, France
37 Dr J. Richards, OECD, France
38 Ir R. Merkelbach, DLO Staring Centrum, Wageningen 39 Ing G. Bor, DLO Staring Centrum, Wageningen 40 Ir Paul v/d Brink, DLO Staring centrum, Wageningen 41 Ing G. Verstappen, RIZA, Lelystad
42 Drs K. v/d Guchte, RIZA, Lelystad
43 Dr Ir H. de Heer, Ministerie LNV, Den haag 44 Ir G.C. Maan, Ministerie LNV, Den haag
45 Dr T. Brock, DLO Staring Centrum, Wageningen 46 Drs M. Beek, RIZA
47 Ing W.W.M. Brouwer, PD, Wageningen 48 Ir J.WJ. van Esch, IKC Landbouw, Ede
49 Depot van Nederlandse publicaties en Nederlandse bibliografie 50 Directie RIVM
51 Sectordirecteur Stoffen en Risico' s 52 Sectordirecteur Milieuonderzoek 53 Sectordirecteur Toekomstverkenningen
54 Hoofd Centrum voor Stoffen en Risicobeoordeling 55 Hoofd Laboratorium voor Ecotoxicologle
56 Hoofd Laboratorium voor water en drinkwateronderzoek 57 Hoofd Laboratorium voor Bodem en Grondwateronderzoek 58 Hoofd Afdeling Voorlichting en Public Relations
60 Dr. D. van de Meent, ECO 61 Drs. T. Aldenberg, LWD 62 Drs. W. Ligtvoet, LWD 63 L- J.B.H.J. Linders, CSR 64 Ir A. van der Linden, LBG 65 Dr J. Notenboom, ECO 66 Drs E. van de Plassche, CSR 67 Drs M.H.M.M. Montforts, CSR 68 Dr Ir M.A.G.T. van den Hoop, LAC 69 R.J. Uewis, LWD
70 Dr Ir J.J.B. Bronswijk, LBG 71 Drs H. Noordijk, LLO 72 h- L.G. Wesselink, LAE 73 Drs G.J. Eggink, LSO 74 Dr A.M. Breure, ECO 75 Dr O. Klepper, ECO
76 Drs A. van de Bovekamp, LAE 77 Drs S.A. van Esch, MNV 78 Dr J.A. Hoekstra, MNV 79 Drs P. Lagas, MNV 80 Dr Ir E. Lebret, CCM 81 Drs J.H. Canton, ECO 82-83 Auteurs 84 Bureau Rapportenregistratie 85 Bibliotheek RIVM 86-110 Bureau Rapportenbeheer
CONTENTS ABSTRACT 5 SAMENVATTING 6 SUMMARY 6 1. INTRODUCTION 7 2. METHOD 8 2.1. Toxicity 8 2.2 Drift and dosage 8
2.3. Predicted Environmental Concentration (PEC) 9
2.4. Sales data 9 2.5. Acute aquatic risk indicator 9
3. RESULTS 10 3.1. Toxicity data 10 3.2. Size of application areas 11
3.3. Acute aquatic risk indicators 11 3.4. The most important compounds 13
3.4.1. Algae 13 3.4.2. Daphnids 13 3.4.3. Fish 14 4. DISCUSSION 16 5. CONCLUSIONS 18 REFERENCES 19 ACKNOWLEDGEMENT 20 APPENDIX 21
ABSTRACT
Since the introduction of the Multi Year Crop Protection Plan in the Netherlands the amount of pesticides used in the Netherlands has decreased with approximately 50%. One of the questions raised some years ago was: does a substantial decrease of the amount of pesticides used by the farmers have a proportional enhancement in the quality of the aquatic environment. To answer the raised question an indicator for the acute risk of pesticides in the aquatic environment was developed. This indicator is the quotient of the predicted environmental concentration and the toxicity for a certain group of organisms, which is scaled for the area treated with a compound and includes all the pesticides used since 1984. The risk for algae and daphnids has declined by 40% and for fish by 15%. Less than 20 pesticides accounted for approximately 85% of the height of the indicator.
SAMENVATTING
De acute aquatische risico-indicator voor bestrijdingsmiddelen kan beschouwd worden als een indicator voor de toxische dmk van bestrijdingsmiddelen op het aquatische milieu.-De indicator is gebaseerd op alle bestrijdingsmiddelen die in Nederland gebruikt worden of werden sinds 1984. Voor elk bestrijdingsmiddel werd het quotiënt van de voorspelde concentratie (PEC) in het oppervlaktewater en de toxiciteit voor een bepaalde groep van waterorganismen, vermenigvuldigd met de relatieve oppervlakte waarop de stof werd toegepast (ten opzichte van al het met bestrijdings-middelen behandeld agrarisch areaal). De indicator is berekend voor elk jaar sinds het in werking treden van het MJPG. De druk op algen en daphnia's is
verminderd met 40% en voor vissen met 15%. Minder dan twintig
bestrijdingsmiddelen zijn verantwoordelijk voor ongeveer 85% van de hoogte van de indicator. De bestrijdingsmiddelen die met meer dan 10% bijdragen aan de indicator waarde zijn fentin-acetaat en monolinuron bij de algen, fentin-acetaat, ethyl-parathion en fosalone bij de daphnia's en captan en lambda-cyhalothrin bij de vissen. De
grootste winst voor het aquatische milieu kan bereikt worden door deze bestrijdings-middelen niet meer te gebruiken en te vervangen door bestrijdingsbestrijdings-middelen met een lagere PEC/TOX verhouding te hebben.
SUMMARY
The Acute Aquatic Risk Indicator for Pesticides can be considered as an indicator for the effects of pesticides on the aquatic ecosystem or on particular groups of species (e.g. algae, daphnids or fish). This indicator is based on all the pesticides that are used in the Netherlands or were used since 1984. For every compound the quotient of the predicted environmental concentration and the toxicity for a certain group of
organisms is multiplied by the relative area treated with a compound. The indicator value is calculated for every year since the introduction of the Multi Year Crop Protection Plan in the Netherlands.
The risk for algae and daphnids has declined by 40% and for fish by 15%. Less than 20 pesticides accounted for approximately 85% of the height of the indicator. The pesticides that contributed in 1996 more than 10% to the indicator value for algae are fenfin-acetate and monolinuron, for daphnids fentin-acetate, parathion (ethyl) and phosalone and for fish captan and lambda-cyhalothrin. The greatest benefit for the aquatic ecosystem can be obtained by abondoning the use of these pesticides, even in case other pesticides are used, provided that their PECATOX quotients are lower.
1. INTRODUCTION
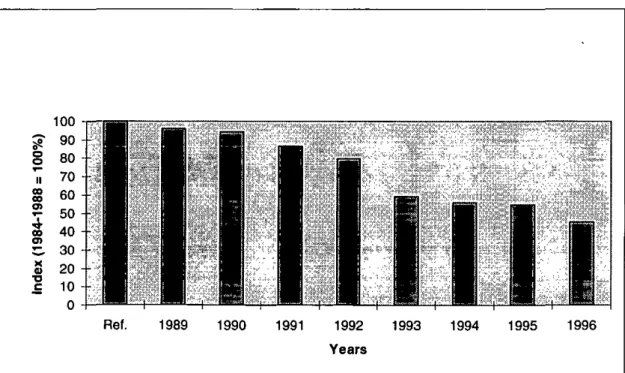
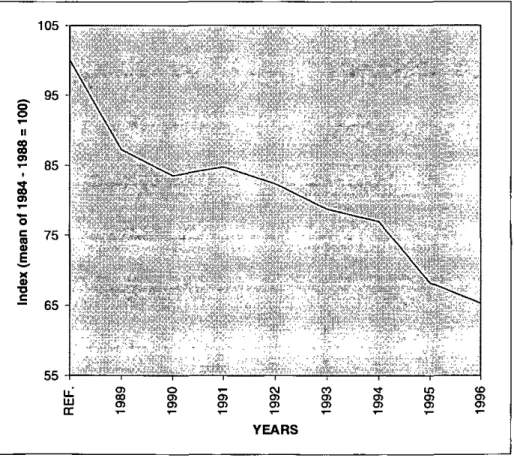
Since the introduction of the Multi Year Crop Protection Plan in the Netherlands the amount of pesticides used in the Netherlands has decre'ased-with approximately 50% (Figure 1). One of the questions,raised some years ago was: does a substantial .. decrease of the amount of pesticides used by the fanners have a proportional enhancement in the quality of the aquatic environment. In the first instance two arguments were found that were pointing in another direction. First, the decline (50% according to the NEFYTO) in kilograms can be attributed for the main part to the decrease in use of two soil fumigants (metam-sodium and 1,3-dichloropropene). These fumigants are hardly influencing the quality of the adjacent surface water (ditches) because they are injected into the soil and have a high volatility. Second, old pesticides (mosdy broad spectmm compounds with high dosages) are replaced by modem pesticides (more specific working mechanisms and relative highly toxic). To answer the raised question an indicator for the acute risk of pesticides in the aquatic environment was developed. This indicator is the quotient of the predicted
environmental concentration and the toxicity for a certain group of organisms, which is scaled for the area treated with a compound:
PEC Area treated with 1 compound TOX Area treated with all compounds
In 1997 this risk indicator was based on 31 of the pesticides used in the Netherlands (Milieubalans, 1997). In this report the risk indicator includes all the pesticides used since 1984.
Ref. 1989 1990 1991 1992 Years
1993 1994 1995 1996
Figure 1 Total use of agricultural pesficides in the Netherlands according to the NEFYTO (see also chapter 2.4.). The reference period is defined as the average tonnage of 1984 to 1988, which is indexated at 100%.
2. METHOD 2.1. Toxicity
Data were collected for algae (EC50), daphnids (E(L)C50) and fish (LC50). In. ^ principle the data available at the Centre of Substances and Risk assessment (CSR) of the National Institute of Public Health and the Environment were used (files,
handbooks and reports). These data were complemented with data from the data base AQUIRE. When more than one data was available for one of the groups (e.g. algae) for one pesticide the geometric mean was used in the calculation of the risk indicators. Sometimes for algae only a NOEC value was available. This value was extrapolated to an EC50 value by using the following relationship: NOEC = EC50/3.
When no data were available for a certain pesticide the geometric mean of the
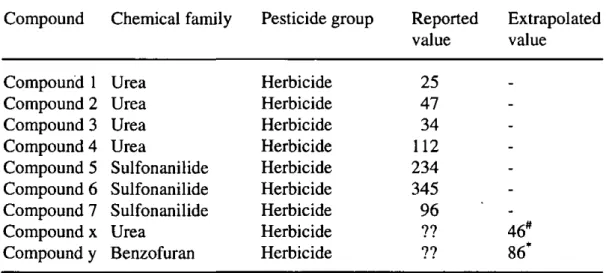
chemical family (according to the Pesticide Handbook) was used (see compound x in Table 1) and when no data for the chemical family were available the geometric mean of the pesticide group was used (e.g. insecticide or fungicide, see compound y in Table 1).
Table 1 Example calculation for missing toxicity data.
Compound Chemical family Pesticide group Reported Extrapolated value value Compound 1 Urea Compound 2 Urea Compound 3 Urea Compound 4 Urea Compound 5 Sulfonanilide Compound 6 Sulfonanilide Compound 7 Sulfonanilide Compound x Urea Compound y Benzofuran Herbicide Herbicide Herbicide Herbicide Herbicide Herbicide Herbicide Herbicide Herbicide 25 47 34 112 234 345 96 ?? ?? _ -46* 86*
# = average value of ureas, * = average value of herbicides.
2.2 Drift and dosage
The DLO Winand Staring Centre (Wageningen, The Netherlands) provided estimates (calculated with ISBEST 3.0) of the mean drift percentage (see appendix) and the mean dosage for a number of pesticides. The calculation procedure takes into account the use on different crops (with different drift percentages), the use indoors (no drift to surface water) and the applicafion methods and is not based on measurements.
The indicator is based on 297 pesticides that were or are still used in the Netherlands in the period 1984 to 1996. However, ISBEST 3.0 could only provide data for 206 pesticides. When no data were available for a pesticide (91 pesticides) this gap was filled in the same way as was done for the missing toxicity data. When no data were available for a certain compound the geometric mean of the chemical family
(according to the Pesticide Handbook) was used and when no data for the chemical family were available the geometric mean of the pesticide group was used.
2.3. Predicted Environmental Concentration (PEC)
The percentage of drift was used to estimate the concentration in the Dutch standard ditch. The standard ditch is defined to be adjacent to the sprayed field, with a width and a depth of 1.0 and 0.25 meter, respectively . The dosage for the PEC calculation is expressed in mg/m^. When the dosage is 20 mg/m^ and the drift is 5% the PEC in the ditch will be (20 * 0.05) / 250 = 0.004 mg/1.
2.4. Sales data
Data on the amount of agricultural pesticides (kg) sold in the Netherlands are
available at the Plant Protection Service (Wageningen, The Netherlands). These data are confidential. However, they can be used for calculations, but it is not allowed to publish them in this report. The sales data are partly provided by the NEFYTO. The period 1984 to 1988 is used as the starting point/reference period of the Multi Year Crop Protection Plan. Since 1992 the data of the NEFYTO are adjusted by the Plant Protection Service for the proportion of the market that is not represented by the NEFYTO (in 1992 9%, in 1993 15%, in 1994 18%, and in 1995 and 1996 16%). For the calculafion of the acute aquatic risk indicator values the adjusted data are used. 2.5. Acute aquatic risk indicator
With the mean application rate and the sales data (kilograms sold in the Netherlands) it is possible to calculate the numbers of hectares that have been treated by one
product in one year. No correction has been made for repeated applications. For every compound the PEC/L(E)C50 was calculated. This quotient was multiplied by the area treated with the compound divided by the area treated with all compounds (an
example is given in Table 2). The indicator value was calculated for every year since the reference period (1984 to 1988) for daphnids, algae and fish. For the reference period the mean yearly value for this period was used and indexated at 100%. The other years (1989 to 1996) are expressed in percentages of this reference value. Table 2 Description of the calculation of the Indicator value.
Compound 1 (PECd / LC50ci) * (AREAci / AREAtotai) = OUTCOMEd Compound 2 (PECc2 / LC50c2) * (AREAc2 / AREAtotai) = OUTCOMEc2
= I
-Compound n (PECct, / LC50cn) * (AREAcn / AREA,o,ai) = OUTCOMEcn X all compounds = Indicator value
3. RESULTS 3.1. Toxicity data
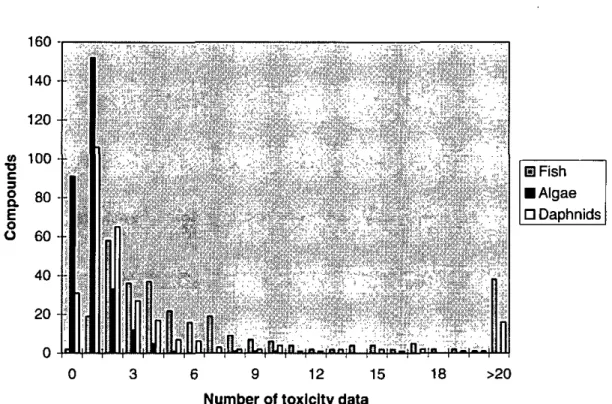
For the 297 compounds causing drift (compounds with'no drift to surface'water were omitted) 5391 toxicity data were found: for algae 306 (69% of-the compounds), for daphnids 1427 (90% of the compounds) and for fish 3658 (99% of the compounds, only two compounds were missing). On average the geometric means, the values used in the calculation for the risk indicators, for algae, daphnids and fish, are based on 0.8, 3.6 and 9.2 toxicity tests, respectively. In the appendix the number of toxicity studies found for each compound for algae, daphnids and fish are presented. A summary of this information can be found in Figure 2.
140 •• 120 -« 100 --C 1 8 0 -E o Ü 60 • 4 0 2 0 -O-JIJ ' n n n n iiHiiiiiiiLniiini El Fish • Algae D Daphnids 6 9 12 15 Number of toxicity data
18 >20
Figure 2 Number of available toxicity data for a compound for algae, daphnids and fish
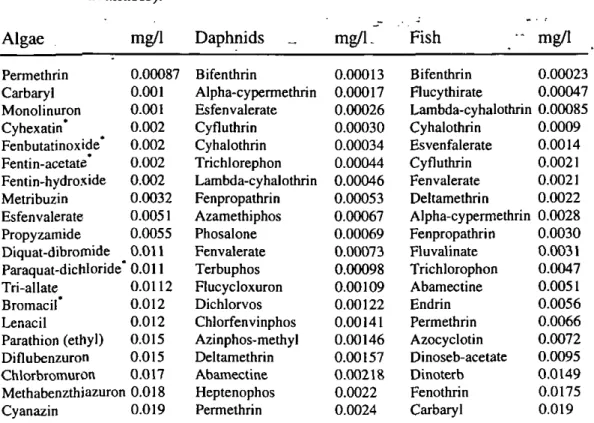
In Table 3 the toxicity ranking (top 20 compounds) is presented for every group (algae, daphnids and fish). For algae the toxicity is ranging between 0.00087 mg/1 for the most toxic pesticide (permethrin) and 30000 mg/1 for TCA. For daphnids the most toxic pesticide is bifenthrin with 0.00013 mg/1 and 4347 mg/1 for TCA. For fish the most toxic pesticide is also bifenthrin with 0.00023 mg/1 and 5946 for dikegulac-sodium.
For five of the 20 pesticides (cyhexatin, fenbutatinoxide, fentin-acetate, paraquat-dichloride and bromacil) with the highest toxicity for algae the toxicity value is extrapolated as described in the chapter 2.1.
Table 3 Geometrie mean toxicity data for the 20 most toxic compounds for every group of organisms (* = estimated, no toxicity data for species group available).
Algae mg/1 Daphnids mg/1 Fish mg/1
Permethrin Carbary! Monolinuron Cyhexatin Fenbutatinoxtde Fentin-acetate Fentin-hydroxide Metribuzin Esfen valerate Propyzamide Diquat-dibromide Paraquat-die hi or ide Tri-allate Bromacil Lenacil Parathion (ethyl) Diflubenzuron Chlorbromuron 0.00087 0.001 0.001 0.002 0.002 0.002 0.002 0.0032 0.0051 0.0055 O.OH ' 0.011 0.0112 0.012 0.012 0.015 0.015 0.017 Methabenzthiazuron 0.018 Cyanazin 0.019 Bifenthrin Alpha-cy permethrin Esfen valerate Cyfluthrin Cyhalothrin Trichlorephon Lambda-cyhalothrin Fenpropathrin Azamethiphos Phosalone Fenvalerate Terbuphos Flucycloxuron Dichlorvos Chlorfenvinphos Azinphos-methyl Deltamethrin Abamectine Heptenophos Permethrin 0.00013 0.00017 0.00026 0.00030 0.00034 0.00044 0.00046 0.00053 0.00067 0.00069 0.00073 0.00098 0.00109 0.00122 0.00141 0.00146 0.00157 0.00218 0.0022 0.0024 Bifenthrin Fluey thirate Lambda-cyhalothrir Cyhalothrin Esvenfalerate Cyfluthrin Fenvalerate Deltamethrin Alpha-cy permethrin Fenpropathrin Fluvalinate Trichlorophon Abamectine Endrin Permethrin Azocyclotin Dinoseb-acetate Dinoterb Fenothrin Carbaryl 0.00023 0.00047 I 0.00085 0.0009 0.0014 0.0021 0.0021 0.0022 1 0.0028 0.0030 0.0031 0.0047 0.0051 0.0056 0.0066 0.0072 0.0095 0.0149 0.0175 0.019
3.2. Size of application areas
In Table 4 the percentages of the total area treated with pesticides for a certain
compound is given for the reference period and for 1996 (only the 15 compounds with highest % of the total area). The average 'total' area was 12.4 million hectares in the reference period (11.5 - 13.1 million hectares) and 14.6 million hectares in 1996. In practise the number of hectares are smaller, because sometimes a compound is used more than 1 time on a hectare and some hectares are treated with more than one active ingredient, either simultaneously or at different times in the year.
3.3. Acute aquatic risk indicators
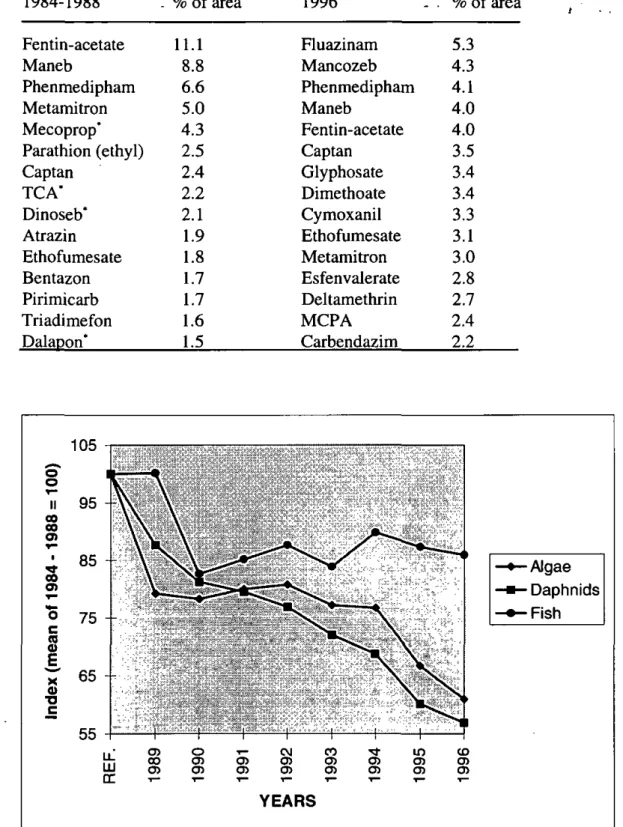
In Figure 3 the aquatic risk indicator is presented for the acute local situation for fish, daphnids and algae. The risk for algae and daphnids has declined by 40% and the risk for fish only by 15%.
The sharp drop for fish in 1990 is caused by the ban of dinoseb in that year. The decrease over the years of the risk for daphnids and algae can be attributed to a drop in the use of fentin-acetate, but this pesticide is still contributing for approximately 35% to the height of the risk indicator for algae and daphnids. The two reasons for this are the relatively high PEC/L(E)C50 quotient and the large area in which fentin-acetate is used (11 % of the total area in the reference period and 4% in 1996).
Table 4 The percentages of the 'total' area treated with pesticides (see chapter 3.2) for the 15 compounds with the highest % of the 'total' area (* = estimated, no mean dosage for compound available).
1984-1988 Fentin-acetate Maneb Phenmedipham Metamitron Mecoprop' Parathion (ethyl) Captan TCA' Dinoseb' Atrazin Ethofumesate Bentazon Pirimicarb Triadimefon Dalaoon* - % of area 11.1 8.8 6.6 5.0 4.3 2.5 2.4 2.2 2.1 1.9 1.8 1.7 1.7 1.6 1.5 1996 Fluazinam Mancozeb Phenmedipham Maneb Fentin-acetate Captan Glyphosate Dimethoate Cymoxanil Ethofumesate Metamitron Esfenvalerate Deltamethrin MCPA Carbendazim . % of area 5.3 4.3 4.1 4.0 4.0 3.5 3.4 3.4 3.3 3.1 3.0 2.8 2.7 2.4 2.2 105 o o 00 00 O) 00 O) c X V • Ö c YEARS Algae •Daphnids Fish
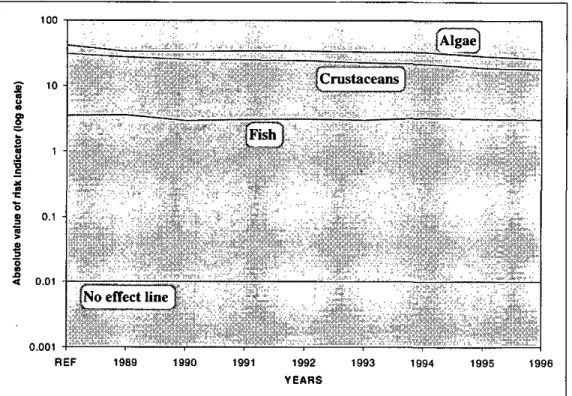
The line for fish may suggest that the aquatic risk is higher for fish than for the two other groups, because the line for fish is above the other two lines, but the contrary is true. The absolute figure for fish is a factor ten lower than for algae and daphnids as can be seen in figure 4. In the figure a "no effect line" is presented. This line
represents the level where for each compound the predicted environmental' concentration equals the no effect concentration for the aquatic ecosystem
(PEC/NECeco = 1). The NECeco is defined as the L(E)C50 divided by 100 (10 for the step of 50% effect to no effect (NOEC) and 10 for the step one species to more and other species). 100 10 1 S 0.1 -< 0.01 0.001 Crustaceans
iNo e^ect line
REF 1989 1990 1991 1992
YEARS
1993 1994 1995 1996
Figure 4 Absolute values of indices for Algae, Daphnids and Fish and the "No effect line".
3.4. The most important compounds 3.4.1. Algae
In Table 5 the compounds which contribute 1 or more percent to the acute index value for algae for the reference period and 1996 are presented. Only 12 or 13 compounds contribute more than 1%. For both periods fentin-acetate is the highest contributor: in the reference period 65.4 % and in 1996 40.6%. Note that for four of the compounds mentioned in this table no toxicity data are available for algae, which probably will increase the uncertainty.
3.4.2. Daphnids
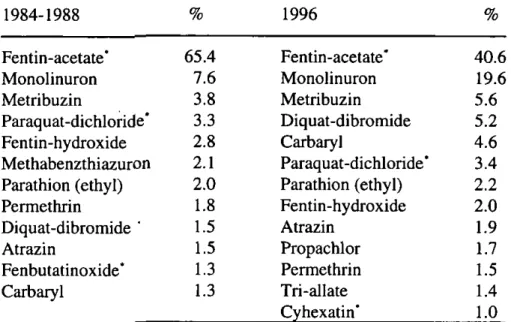
In Table 6 the compounds which contribute 1 or more percent to the height of the acute index value for daphnids for the reference period and 1996 are presented. In the
reference period only 5 and in 1996 only 11 compounds contribute more than 1%. For both periods fentin-acetate is the highest contributor: in the reference period 55.4 % and in 1996 35.1%.
Table 5 Compounds that contribute more than 1% to the index value for Algae (* = estimated, no toxicity data available).
1984-1988 % 1996 % Fentin-acetate' Monolinuron Metribuzin Paraquat-dichloride' Fentin-hydroxide Methabenzthiazuron Parathion (ethyl) Permethrin Diquat-dibromide ' Atrazin Fenbutatinoxide* Carbaryl 65.4 7.6 3.8 3.3 2.8 2.1 2.0 1.8 1.5 1.5 1.3 1.3 Fentin-acetate' Monolinuron Metribuzin Diquat-dibromide Carbaryl Paraquat-dichloride' Parathion (ethyl) Fentin-hydroxide Atrazin Propachlor Permethrin Tri-allate Cyhexatin' 40.6 19.6 5.6 5.2 4.6 3.4 2.2 2.0 1.9 1.7 1.5 1.4 1.0
Table 6 Compounds that contribute more than 1% to the height of the index value for Daphnids. 1984-1988 % 1996 % Fenfin-acetate Parathion (ethyl) Maneb Chlorfenvinphos Azinphos-methyl 55.4 12.4 10.4 6.5 5.0 Fentin-acetate Parathion (ethyl) Phosalone Esfenvalerate Maneb Chlorfenvinphos Lambda-cyhalothrin Azinphos-methyl Deltamethrin Fluazinam Carbaryl 35.1 13.3 10.4 7.9 7.9 4.2 3.6 3.2 1.4 1.3 1.1 3.4.3. Fish
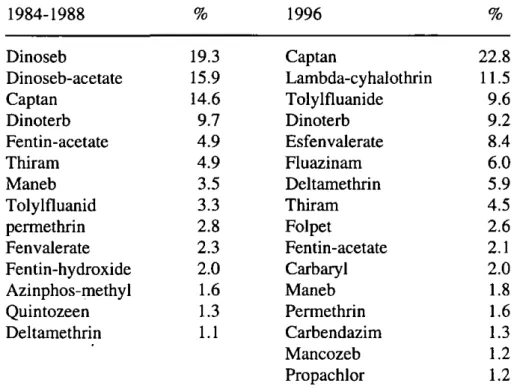
In Table 7 the compounds which contribute 1 or more percent to the height of the acute index value for fish for the reference period and 1996 are presented. In the reference period 14 and in 1996 16 compounds do contribute more than 1%. In the
reference period dinoseb, dinoseb-acetate and captan are the highest contributors: between 15 and 20%. In 1996 captan is the highest contributor with 22.8% and the lambda-cyhalothrin (new on the market since 1992) on the second place with 11.5%. Dinoseb and dinoseb-acetate are not mentioned in the table of 1996 because both products are not sold, anymore in the Netherlands.
Table 7 Compounds that contribute more than 1 % to the height of the index value for Fish.
1984-1988 Dinoseb Dinoseb-acetate Captan Dinoterb Fentin-acetate Thiram Maneb Tolylfluanid permethrin Fenvalerate Fentin-hydroxide Azinphos-methyl Quintozeen Deltamethrin % 19.3 15.9 14.6 9.7 4.9 4.9 3.5 3.3 2.8 2.3 2.0 1.6 1.3 1.1 1996 Captan Lambda-cyhalothrin Tolylfluanide Dinoterb Esfenvalerate Fluazinam Deltamethrin Thiram Folpet Fentin-acetate Carbaryl Maneb Permethrin Carbendazim Mancozeb Propachlor % 22.8 11.5 9.6 9.2 8.4 6.0 5.9 4.5 2.6 2.1 2.0 1.8 1.6 1.3 1.2 1.2
4. DISCUSSION
In this report aquatic risk indicators are calculated for three groups of organisms, algae, daphnids and fish, the traditional-species tested for legislative purposes. But it is also possibleto perform this calculation with an "L(E)C50" for the ecosystem by using either the 95th percentile (according to Aldenberg and Slob, 1993) of all the available acute data (not only algae, daphnids and fish) or by using the lowest available value divided by ten or hundred.
When a crifical concentration for aquatic ecosystems is defined as the lowest value that is calculated for either algae, daphnids or fish, then the risk for the aquafic ecosystem has declined by approximately 35% (see Figure 5) since the reference period 1984 to 1988. Please note that by using an index it is not necessary to define an extrapolation factor, because of the relative scale. Figure 5 should be considered with caution, because only three different species groups are included in the calculation. In 1996 only 18 of the 223 pesticides that were causing drift to surface water did contribute for more than 1% to the index value for the aquatic ecosystem, together they account for ± 86% (Table 8). The five pesticides with the highest score are fentin-acetate, monolinuron, parathion (ethyl), carbaryl and phosalone. The Centre for Agriculture and Environment in Utrecht developed the "Milieumeetlat" and although they are using a different method (fixed dosage of 1 kg/ha and fixed drift percentage of 1 % for each pesticide) fentin-acetate was also one of their top five pesticides (Reus andFaasen, 1995). 105 • _ 95
-1
II 7 8 5 -3 o g 7 5 -0) K 0) •D ^ 6 5 55 -u u D \ \ ,V
•,—, ' , . • • ' ^1 '. ' • -. m J O) . ^ 1 o 1 — " ^ ^ \ 1 YEARS ; CO O) ^—-, \ 1 o> \ 1 i n ^Table 8 Compounds that contribute more than 1% to the index value for the aquatic ecosystem (* = estimated, no toxicity data available).
1996 % Fentin-acetate' Monolinuron Parathion (ethyl) Carbaryl Phosalone Diquat-dibromide Maneb Metribuzin Esfen valeraat 26.3 12.6 7.0 6.0 4.6 4.0 4.0 3.6 3.5 Paraq u at-dichloride Captan Chlorfenvinfos Lambda-cyhalothrin Atrazin Azinfos-methyl Permethrin Propachloor Fentin-hydroxide 2.3 2.0 1.9 1.6 1.5 1.4 1.2 1.2 1.2
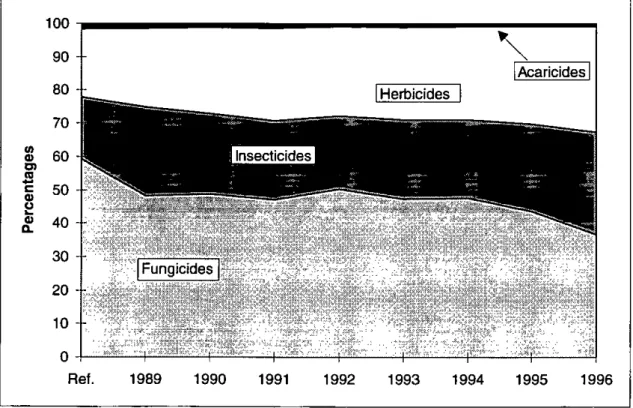
In this report it was decided to calculate the indices for all the compounds that were in one way or another causing drift to the adjacent ditch. It is also possible to perform these calculations for a specific group of compounds, e.g. fungicides or herbicides. In Figure 6 the relative contribufion of five pesticide groups (herbicides, acaricides, fungicides, insecticides and others) are presented.
Ref. 0) <D O) CO *^ c o o Q. 90 80 70 60 50 40 30 20 10 0 -^ Fungicides i H -h r ^ e c t i c i d e ^ ^ ^ ^ H 1 f Herbicides
n
' • V i ' <• ! 1 \ Acaricidesn
H 1 1989 1990 1991 1992 1993 1994 1995 1996Figure 6 The contribution of four pesficide groups to the index for a particular year. In the period under consideration the contribution of fungicides has dropped from 59% to 37% and has raised for insecticides and herbicides from approximately 20% to 31%. Acaricides only contribute for 1 or 2% to the index. Pesticides not belonging to these four groups contribute less than 1%.
Till now it is assumed that application methods and management methods did not change over the period. This resulted in the use of a standard set of drift data which did not change since the reference period. In the.past few years much attention has . been paid to drift reduction. Better application and management methods are s becoming available as well as protective measures like spray free zones or
windbreaks. The method described in this report is able to cope with changes in drift percentages.
The index described in this report does not give any information about the quantity of surface water that is contaminated by pesticides. This depends on the total area of agricultural use and on the water/land ratio.
5. CONCLUSIONS
A) The risk for the aquatic ecosystem (acute situafion) has declined by
approximately 35% in surface water influenced by drift of pesticides since the reference period 1984 - 1988.
The risk for algae and daphnids has declined by 40% and for fish by 15%. B) In 1996 only 18 pesticides from the 223 pesticides that were causing drift to
surface water contributed more than 1% to the index value for the aquatic ecosystem, together they accounted for 86%. The same holds for the individual groups of organisms (algae, daphnids and fish)
C) The pesticides that contributed in 1996 more than 10% to the index value for the aquatic ecosystem are fentin-acetate 26% and monolinuron 13%. For algae these pesticides are acetate 41% and monolinuron 20%, for daphnids fentin-acetate 35%, parathion (ethyl) 13% and phosalone 10% and for fish captan 23% and lambda-cyhalothrin 12%.
D) The greatest benefit for the aquatic ecosystem can be obtained by abondoning the use of these pesticides, even incase other pesticides are used, provided that their PEC/TOX quotients are lower.
REFERENCES
Aldenberg, T. and W. Slob (1993) Confidence limits for hazardous concentrations based on logistically distributed NOEC toxicity data. Ecotoxicol. Environ. Saf." 25: 48-63. - . . . .-Reus, J.A.W.A and R. Faasen (1995) Kilo's of milieubelasting? II Berekening van
doelgerichte reductiepercentages voor bestrijdingsmiddelen. Centmm voor Landbouw en Milieu en Rijksinstituut voor Integraal Zoetwaterbeheer en afvalwaterbehandeling, Utrecht, november 1995.
ISBEST 3.0 G. Bor and R.C.M. Merkelbach. Beschrijving van het Informatiesysteem Bestrijdingsmiddelen ISBEST 3.0. DLO Staring Cenü-e Report number 638, Wageningen, The Netherlands.
ACKNOWLEDGEMENT
We thank Rob Merkelbach and Gerrit Bor of the DLO Staring Centre for providing data on the average dosage and-average drift values, and Willem Birouwer of the Plant Protection Service for giving us the possibility to use the sales data for the
calculations.
We thank Paul v/d Brink, Gert Eggink, Ton v/d Linden, Rob Merkelbach, Jos Nooten-boom and Govert Verstappen for their scientific input at the start of the project, and Kees van Leeuwen, Dik v/d Meent, Ton v/d/ Linden, Jos Nootenboom, Erik van de Plassche, Rob Merkelbach and Paul van der Brink for comments on earlier versions of this report.
APPENDIX
In this appendix the average drift percentages as provided by the DLO Winand Staring Centre are presented .and the number of toxicity studiesfound for the three different species groups (algae, daphnids, and fish). Due to the confidential nature of the sales data it is also not possible to present the mean dosage for each pesticide.
Compound 1 -naftylacetic acid 2,4-D abamectin acephate acionifen alachtor alpha-cypermethrin alloxydim amitraz amitrole ammonium sulfamate anilazine anthraquinone asulam atrazine azaconazole azamethiphos azinphos-methyl azocyclotin Bacillus thuringiensis benazolin bendiocarb benfuracarb benodanil benomyl bentazone benzoylprop-ethyl bifenox bifenthrin bioallthrin bitertanol borax bromacil bromophos bromophos-ethyl bromoxynil bromuconazole broomfenoxim broompropylate buminaphos bupirimate buprofezin butocarboxim butoxycarboxim captafol captan carbaryl carbendazim carbetamide carbofuran carbophenothion Average drift (%) 6.80 -' 4.40 '• 0.10 -1.80 5.00 no data no data no data 7.30 0.20 no data 5.00 no data 5.00 5.00 17.00 no data 9.10 7.80 no data 5.00 no data no data no data 1.00 5.00 no data 5.00 0.10 no data 3.20 no data no data no data no data 5.00 no data 5.00 8.80 5.00 2.30 0.10 0.10 no data no data 7.30 7.10 3.50 5.00 1.30 no data
Number of toxicity studies Algae 1 • 1 - -'-'' no data 1 1 2 1 no data 1 2 no data 2 no data no data 10 1 no data 3 no data no data no data 1 1 no data 1 2 no data 1 2 no data 1 no data no data no data 1 1 2 2 1 2 1 1 1 no data 1 1 1 2 2 2 no data Daphnids 1 10 2 3 1 5 1 2 1 2 no 5 1 2 7 1 1 5 1 no 1 4 1 no 4 2 no 3 4 4 4 1 1 no 1 25 1 2 1 2 1 2 2 1 4 3 51 6 1 30 4 data data data data data Fish 3 48-3 ' 16 2 10 2 1 3 5 3 6 2 9 25 6 11 70 3 2 4 4 2 2 37 3 2 6 2 33 6 2 6 2 1 7 2 6 3 no data 4 2 3 2 14 23 160 24 1 45 11
Compound carboxin chlofentezin chloralhydrate chlorbromuron chlorfenvinphos chlorflurenol (methyl) chloridazon chlormequat chlorothalonil chlorotoluron chloroxuron chlorpropham chlorpyrifos chlorthal chlorthiamid clodinafop clopyralid cloquintoceet copper-hydroxide copper-oxychloride crimidine cyanazine cycloate cycloxydim cyfluthrin cyhalothrin cyhexatin cymoxanil cypermethrin cyproconazole cyprofuram cyromazine dalapon daminozide deltamethrin desmedipham desmetryn diallate diazinon dicamba dichlobenil dichlofenthion dichlofluanid dichlorprop dichlorprop-p dichlorvos dichloran dicofol dienochlor diethofencarb difenoconazole Average drift (%) . no data 3.70 no data 5.00 4.00 no data 4.40 5.20 4.10 5.00 no data 5.00 3.40 no data no data 5.00 5.00 5.00 no data 13.00 no data 5.00 no data 5.00 no data 5.00 3.60 5.00 6.90 5.00 no data 0.20 no data 1.10 4.90 0.10 5.00 no data 2.10 4.90 0.10 no data 6.50 no data 5.00 0.20 no data 5.00 0.20 2.70 7.70
Number of toxicity studies Algae 2 1 • -1 1 • 3 no data 1 no data no data 2 2 1 no data no data no data 3 2 4 1 no data no data 2 no data 1 2 1 no data 1 no data 1 1 2 no data 2 1 1 1 no data 1 3 1 no data 1 1 no data 1 1 1 1 1 no data Daphnids 1 2 no 1 5 no 2 1 4 1 2 1 8 1 no 1 1 2 1 2 no 10 2 2 6 6 3 1 6 1 1 2 4 3 16 1 2 no 29 5 10 6 1 no no 20 1 3 2 2 1 data data data data data data data Fish 2 4 •.. no data 15 10 3 7 6 31 13 7 3 72 3 1 4 2 4 3 7 1 20 1 2 7 5 17 3 18 6 2 5 14 3 9 2 4 2 64 9 34 12 4 1 2 30 4 17 4 2 1
Compound difenoxuron difenzoquat diflubenzuron diflufenican dikegulac dimethachlor dimethoate dimethomorph dinocap dinoseb dinoseb-acetate dinoterb diquat-dibromide dithianon diuron DNOC dodemorph dodine endosulfan endothal endrin epoxyconazole EPTC esfenvalerate ethephon ethiofencarb ethirimol ethofumesate etridiazole etrimfos fenaminosulf fenarimol fenbutatin oxide fenchlorazole (ethyl) fenfuram fenitrothion fenmedifam fenothrin fenoxaprop-P-ethyl fenoxycarb fenpiclonil fenpropathrin fenpropimorph fentin acetate fentinhydroxide fenvalerate ferbam fluazifop-butyl fluazifop-p-butyl fluazinam flucycloxuron Average drift (%) 5.00 no data 5.00 5.00 0.10 no data 5.00 no data no data no data no data 5.00 4.90 9.50 0.70 5.00 0.20 no data no data no data no data 5.00 5.00 5.00 0.50 5.00 no data 5.00 0.10 6.70 no data 1.30 3.50 5.00 no data no data 5.00 no data 5.00 6.80 no data 0.20 5.00 5.00 5.00 4.90 no data no data 5.00 4.80 0.10 Number c Algae 2 1 4 1 no data 1 4 no data no data 2 1 1 1 1 1 no data 1 1 no data no data no data 1 1 1 no data no data 2 no data 1 1 1 1 no data 1 no data 8 1 no data 1 1 1 3 1 no data 1 1 1 no data 2 1 1 tf toxicity studies Daphnids 1 1 12 1 no data 1 24 2 1 2 1 1 4 2 11 7 1 3 85 3 50 1 5 2 1 1 1 2 1 2 3 2 2 1 no data 38 3 no data 2 3 1 1 1 2 8 15 1 no data 2 2 2 Fish 2 2 10 4 4 4 35 2 5 50 2 3 16 7 26 17 2 3 132 17 94 3 25 9 2 5 2 5 2 7 5 7 15 3 1 223 4 2 5 8 4 5 6 2 18 49 1 3 2 2 2
Compound flucythrinate fluorchioridon flurenol fluroxypyr flutolanil tau-fluvalinate folpet formaldehyde formothion fosetyl-aluminium fuberidazole furalaxyl glufosinate-ammonium glyphosate glyphosate-trimesium guazatine haloxyfop_ethoxyethyl heptenophos hexazlnone hexythiazox imazalil imazamelhabenz imidacloprid ioxynil iprodione isofenphos isoproturon kasugamycin lambda-cyhalothrin lenacil lindane linuron malathion maleic-hydrazide mancozeb maneb MCPA mecoprop mecoprop/mecoprop-P mefluidida mepiquatchloride metalaxyl metaldehyde metamitron metazachlor methabenzthiazuron methamidophos methiocarb methomyl methoxychlor metiram Average drift (%) no data no data no data 5.00 4.90 no data 4.90 0.10 5.00 3.70 no data 1.10 2.00 4.40 4.90 no data 4.80 2.80 no data 1.30 0.20 no data no data 5.00 4.80 ' no data 5.00 6.10 5.00 4.30 5.00 4.80 0.40 5.00 5.00 5.00 4.80 no data 4.90 no data no data 1.90 no data 4.90 4.80 5.00 0.10 0.10 0.20 no data 6.10
Number of toxicity studies Algae no data 1 no data 1 1 no data 2 2 1 1 no data 1 1 3 no data no data 1 no data no data no data 1 1 1 1 2 1 no data no data 1 1 3 4 1 no data 1 1 1 no data 2 no data no data 1 no data no data 1 1 no data no data 3 no data 1 Daphnids 1 1 2 2 1 3 2 1 2 1 1 1 2 3 no data 1 2 1 3 2 2 1 1 2 2 3 1 1 4 1 50 4 53 no data 1 3 4 1 1 no data 1 2 no data 2 1 1 2 3 17 22 1 Fish 5 4 7 • -6 2 6 15 9 4 2 2 4 4 19 2 1 5 3 21 3 3 2 2 2 5 6 8 2 4 3 132 6 142 4 10 12 7 3 5 2 1 3 1 2 3 3 7 14 59 45 4
Compound methidathion metobromuron metolachlor metoxuron metribuzin metsulfuron-methyl mevinphos monolinuron myclobutanil nitrothal-isopropyl nuarimol omethoate oxadixyl oxamyl oxycarboxin oxydemeton-methyl paclobutrazol paraquat-dichloride parathion (ethyl) penconazole pencycuron pendimethalin pentachlorphenol permethrin phosalone phosphmidon phosmet phoxim piperonyl butoxide pirimicarb pirimiphos-methyl plifenate prochloraz procymidone propham profenofos prometryn propachlor propamocarb-hydrochloride propaquizafop propazine propetamphos propiconazole propoxur propyzamide prosulfocarb pyrazophos pyrethrins pyridaben pyridate Average drift (%) 8.80 5.00 5.00 5.00 5.00 5.00 4.40 5.00 6.80 no data 6.80 3.50 no data 0.20 no data 5.10 0.10 4.80 4.70 4.80 5.00 5.00 no data 3.80 6.10 5.00 no data no data 1.00 5.30 1.40 no data 3.20 4.30 5.00 no data 5.00 5.00 2.50 5.00 5.00 no data 5.00 5.60 5.00 5.00 4.50 1.00 0.10 5.00
Number of toxicity studies Algae 2 1 2 2 no data no data no data no data 9 no data 2 no data 3 no data 3 3 no data 1 no data Daphnids 4 1 3 2 4 1 15 3 1 1 1 2 2 2 1 5 1 7 47 3 2 1 91 50 2 24 13 2 10 3 1 no data 2 no data 9 no data 3 2 no data 1 2 3 3 13 1 1 4 1 1 1 Fish 8 17 6 4 9 2 8 7 2 2 4 7 4 7 2 8 1 22 57 7 4 4 140 55 8 23 64 11 11 4 7 1 3 3 8 3 10 4 4 3 5 4 8 28 3 3 7 2 4 4 •
Compound pyrifenox pyrimethanil quinmerac quintozene quizalofop-ethyl rimsulfuron S-methopren sethoxydim simazine sodiumdimethyldithiocarbamate sulfotep TCA tebuconazole teflubenzuron terbufos terbulryn terbutylazin tetrachlorvinphos tetramethrin thiabendazole thiocyclam thiodicarb thiofanox thiometon thiophanate-methyl thiram tolclofos-methyl tolylfluanid tri-allate triadimefon triadimenol triazophos trichlorfon trichloronate triclopyr tridemorph triflumizole trifluralin triforine validamycin vamidothion vinclozolin zineb Average drift (%) 6.70 no data 5.00 no data 5.00 5.00 no data 5.00 2.00 no data no data no data 5.00 0.30 no data 5.00 5.00 no data no data no data 0.10 no data no data 5.00 3.80 7.50 4.60 7.00 5.00 8.70 5.50 6.00 0.10 0.10 4.90 5.00 0.20 no data 3.30 5.00 7.40 4.60 5.00 Number ol Algae no data 1 1 no data 1 1 no data no data 1 2 no data 1 1 1 1 5 3 no data no data no data 1 1 no data 1 1 4 2 1 1 no data 1 1 no data no data 1 1 1 1 no data no data 1 1 1 f toxicity studies Daphnids no 1 1 1 1 1 2 1 9 1 2 3 2 1 6 4 2 no no 2 1 1 no 1 2 19 1 2 3 2 1 1 39 no 3 1 no 17 1 no 1 1 2 data data data data data data data Fish 1 3 - 2 2 7 4 13 5 25 4 7 8 6 2 30 15 9 6 4 1 5 5 2 10 3 14 5 2 5 3 2 2 94 5 19 2 4 45 2 1 1 5 5