Urbanisation, Industrialisation and Sustainable development | RIVM
23
0
0
Hele tekst
(2) RIVM report 402001 015. page 2 of 23. Abstract Industrialisation and urbanisation are two important transformations that shaped the past century. These transformations will continue in the new century and create policy challenges because the use of land, materials and energy will increasingly meet natural limits or be constrained by intergenerational equity arguments. New local and international institutional arrangements will be needed to meet these challenges. Increased public participation and involvement of private companies could help to find the balance between the different perspectives on sustainable development. The UN can show leadership because of the global character of many environmental problems and the growing need for environmental and social minimum requirements in the global liberalised market..
(3) RIVM report 402001 015. page 3 of 23. Contents 1. Introduction 5 2. Sustainability: balancing its social, economic and ecological dimensions 3. Global sustainability and the changing role of industry. 7. 10. 4. Local sustainability: balancing environmental, social and economic targets in urban areas 15 5. Challenges for policy making in the new millennium References 23. 22.
(4) RIVM report 402001 015. page 4 of 23. About the authors Fred Langeweg is deputy director of the Environment division of RIVM. His background is environmental technology and ecology. He was project leader of the first National Environmental Outlook ‘Concern for Tomorrow’ (RIVM, 1988) and advises UNEP in developing Global Environment Outlooks. Henk Hilderink is research fellow at RIVM and the University of Groningen. He is a mathematician and demographer modeller. He is the author of 'World Population in Transition' (Hilderink, 2000) which describes the inter-linkage of the demographic transition with socioeconomic and environmental conditions Rob Maas is heading the bureau for Environmental Assessment of RIVM. As an economist he is responsible for scenario development and policy advice. As chairman of the Task Force Integrated Assessment Modelling he co-ordinates the scientific support to the UN-Convention on Long Range Transboundary Air Pollution..
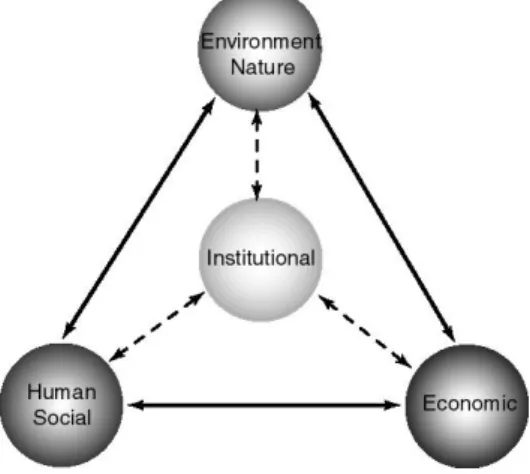
(5) RIVM report 402001 015. 1.. page 5 of 23. Introduction. The UNESCO “World Culture Report” states that only 14% of the global population mentions the environment spontaneously when asked to list their country’s major social problems. Eastern Europe and Africa place environmental problems very low on this priority list. About 50% of all people in different regions consider environmental pollution as a serious problem. Environmental problems at the global level are perceived to be more important then the local ones. About two thirds of the people interviewed in all regions are in favour of strengthening international organisations and funding mechanisms to combat environmental pollution. The public interest in environmental problems in the classical sense is generally declining. A more comprehensive approach to sustainable development is taking its place. The Brundtland-Commissions concept of sustainability is introduced in the 1987 report called “Our Common Future. It relates environment to development issues like demography, population growth, social cohesion, economic development and health status. This report was followed by Agenda 21 which was accepted during the UNCED conference in Rio de Janeiro in 1992. Agenda 21 contains a practical list of subjects and issues relevant to sustainable development. Sustainable development as advocated in Agenda 21, generated an overwhelming number of initiatives for indicator development. The UN Commission on Sustainable Development (UNCSD) started an initiative to assist countries in assessing national sustainability. The World Bank took a similar initiative by developing a methodology to address sustainable development from an economic perspective. Others used the Bank’s methodology as a starting point to broaden the scope to social, ecological and institutional domains. The UN Development Program (UNDP) uses indicators for measuring human development and poverty as a method to highlight the social dimension of sustainable development. Sustainable development can be characterised as the dynamic interaction between environmental, social and economic values and the corresponding institutional arrangements (see figure 1.1).. Figure 1.1 Characterisation of sustainable development: the interaction between economic, environmental, human and institutional domains.
(6) RIVM report 402001 015. page 6 of 23. Several UN-reports like the “Global Environment Outlook” (UNEP, 1999), “Critical Trends” (CSD) and “Bending the Curve” (UNEP Global Scenario Group, 1998) analysed these dimensions of sustainable development. The picture arising from these reports is that the policy emphasis at the global level should be on: n. n. n. n. population, migration and the distribution of health and wealth (social domain); biodiversity and nature protection, as a proxy for the ecological carrying capacity of the biosphere (ecological domain); the eco-efficiency of the use of natural resources in particular water, land and energy (economic domain); the use of effective and efficient policy instruments (institutional domain).. The domains in figure 1.1 not only contain the different priorities that have to be combined, they also represent a certain view on ‘how the world works’ and what policy tools can best be applied. While ‘the ecologist view’ will often favour strict rules, emission ceilings and fences in order to protect species, ‘the economist view’ will favour pricing mechanisms that improve eco-efficiency and competitiveness. The ‘sociologist view’ will focus on equity, social cohesion, education and use of democratic and participatory decision mechanisms. The resulting institutions are often a (local) compromise between the parties involved and their perspectives on the world..
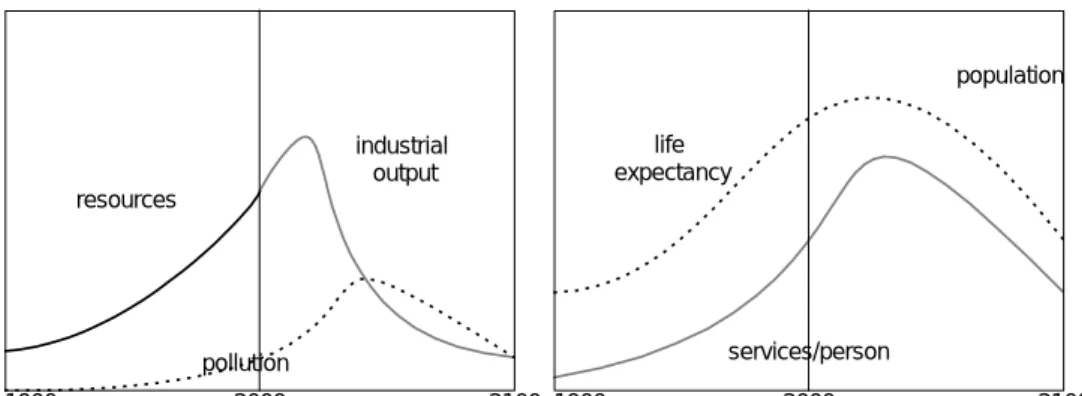
(7) RIVM report 402001 015. 2.. page 7 of 23. Sustainability: balancing its social, economic and ecological dimensions. The influence of the human species on the global ecosystem has increased considerably in the past century. The land area occupied by human activities has doubled, 30% of the terrestrial natural area has disappeared. About 40% of the land area has been domesticated by 2000. The population densities and agricultural productivity have more than doubled. Agricultural societies have transformed into societies based on industry and trade. While the world economy has grown since 1900 by an average of 3% per year, the use of energy and materials increased at almost the same rate. The concentration of CO2 in the atmosphere has increased by 25-30%. While in some areas nitrogen- and phosphate-concentrations in soil and water have increased and caused a loss of biodiversity, in other areas overexploitation has lead to erosion and salinisation. Myers (1979, 1984) estimates the loss of biodiversity at 5-10% and the loss of fertile soil at 20%. These losses are practically – at least within the new millennium - irreversible. “Limits to Growth” (Meadows et al, 1972), published almost thirty years ago, was one of the first computerised model based analyses of sustainable development. It created an unexpected societal response originating from its warning that a sudden and uncontrollable decline in both population and industrial production was imaginable within the next hundred years. Some politicians took this warning as a serious sign to develop new policies towards sustainability. Others criticised its conclusions as an irrealistic and irresponsible prediction of doom. The books main message however is still relevant: exponential growth in a closed system may not be sustainable because of natural limits that will be encountered. Although now it has become clear that more ores and fossil fuels are available in the earthsurface, than expected 30 years ago, the general idea that exponential material growth is not sustainable in a system that has physical limits still holds. The current view is however that capacity of ‘ecosystem sinks’ pose sharper limits to growth than the availability of ‘nonrenewable resources’. In other words: the challenge is not to find new fossil resources, but to keep them in the ground, or to stretch the use of these resources over a much longer period of time. Twenty years after the publication of “Limits to Growth” the analyses were redone. The results were published in “Beyond the Limits” (Meadows, 1991) based on an improved model with updated inputs. Re-analysis of the business as usual scenario of the first report basically arrived at the same conclusion. Industrial output and population keep on growing until a combination of environmental and resource constraints are faced. Meeting these constraints eliminates the capacity of the capital sector to sustain investments. As a result food supply and health services also decline and death rates rise. A major criticism on the first report was that the availability of natural resources was considerably underestimated. Doubling the available resources in the baseline scenario however does not change the main conclusion. In that case growth can be prolonged for some time, but increasing pollution will set limits to growth..
(8) RIVM report 402001 015. page 8 of 23. population life expectancy. industrial output resources. services/person. pollution 1900. 2000. 2100 1900. 2000. 2100. Figure 2.1 The Business as Usual Scenario presented in “Beyond the Limits” indicating overshoot and collapse due to exponential growth. The update of the conclusions still shows the in-sustainability of the current use of resources and levels of pollution. To avoid overshoot and collapse significant reductions in material and energy flows are required according to this updated analysis. The positive message of “Beyond the Limits” was that such a change is possible, provided that a comprehensive change in policies and practices is implemented. These policies include family planning, limiting the material standard of living to a level that is less than 50% higher than the 2000 level, and developing and implementing technologies to conserve resources, protect agricultural land, increase land yields and abate pollution. This ‘sustainability scenario’ suggests that it might be possible to arrive at stable social and economic conditions at service levels substantially higher as compared to 2000. The earlier this policy starts the higher the ultimate sustainable service level will be.. resources. industrial output life expectancy. population. pollution services/person 1900. 2000. 2100. 1900. 2000. 2100. Figure 2.2 The Sustainability scenario from “Beyond the Limits”: stable social, economic and ecological conditions due to implementing population policies and eco-efficient use of resources from 1995 on. The analysis carried out in both reports is based on a model representing the world on average. It does not take into account the differences in and between various regions. Supported by UNEP and the Nippon Foundation a group of independent scientists (the Global Scenario Group) carried out a comprehensive (regionalised) scenario study (SEI, 1998). This study distinguishes three families of scenarios:.
(9) RIVM report 402001 015. n. n. n. page 9 of 23. Conventional Worlds assuming that current trends will prevail; Barbarization in which unfavourable social change occurs moving towards great human misery and collapse of civilised norms; Great transitions showing change towards a higher stage of human civilisation.. The study distinguishes the interactions between ten major world regions. These ten regions are grouped in three categories: the OECD countries, the countries in transition in the former Soviet Union and Central and Eastern Europe, and the developing countries. The Group has elaborated two scenario’s belonging to Conventional Worlds in more detail. One is a business as usual or ‘reference’ scenario (R), representing current trends towards globalisation, industrial development and homogenisation of cultures. The other, the ‘Policy Reform’ scenario (PR) uses the same assumptions but in addition it assumes strong action to achieve sustainability. Sustainability was predefined as 25% less hunger, use of unsafe water and illiteracy in 2050 as compared to 1995. In both scenarios the world economy will grow by about a factor four till 2050. The Policy Reform scenario however assumes a substantial reduction of national and international inequity.. Table 2.1. Some characteristics of the use of natural resources in Conventional Worlds scenario’s presented in “Bending the Curve”. Regions. Forest area (% of land) Water stress (% of population) 1995 2050-R 2050-PR 1995 2050-R 2050-PR Developing 29 20 27 35 55 43 Transitional 39 35 35 4 10 2 Developed 33 32 32 33 40 13 World 31 26 30 33 51 38 R is reference scenario and PR is Policy Reform scenario towards sustainability. In terms of environmental pollution the achievements of the Policy Reform scenario are substantial. In the Reference situation the use of fertilizers, emissions of sulphur and carbon and the generation of toxic waste double or even triple. In the Policy Reform scenario the 1995 levels can be maintained or even reduced substantially. But also in this scenario the use of land and water will still cause considerable deforestation and water shortages, especially in developing countries (see table 2.1). The reduction of socio-economic inequity in the Policy Reform scenario would be a major step forward in promoting stability and human security. However, additional steps are required to arrive at a well-balanced economic, social and ecological sustainable development. The remainder of this paper focuses on the role of industrialisation and urbanisation in global and local sustainable development. Industrialisation and urbanisation are two major transitions of the 20th century that will shape the world in the new century..
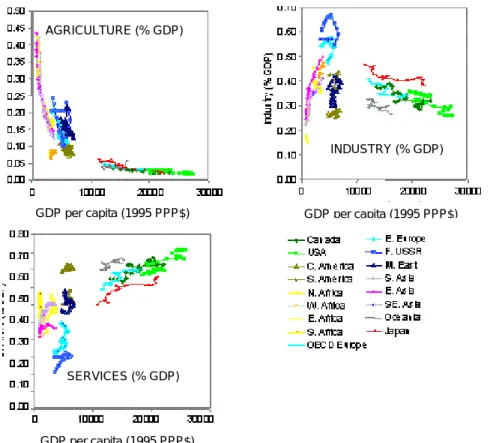
(10) RIVM report 402001 015. 3.. page 10 of 23. Global sustainability and the changing role of industry. The structure of the global economy has changed considerably in the past century and this transformation will continue. After the industrial revolution in the last half of the nineteenth century, GDP in developed regions was dominated by industrial production instead of agriculture. The development of new energy resources, in particular steam and later electricity, promoted this type of economic growth and change. Services became of an increasing importance after World War II and are now dominating the GDP in the advanced economies. The composition of GDP and GDP-levels per capita are strongly interrelated. An analysis of regional GDP-figures for the period 1970 to 1995 indicates that at low GDP-levels the agricultural share is up to 50%. At higher levels however its share is decreasing to a few percent only. The share of the service sector is increasing almost linearly with GDP-levels. The former communist European countries are an exception to this rule showing a low share of in their economy, and a higher share of industry (see figure 3.1).. AGRICULTURE (% GDP). INDUSTRY (% GDP). GDP per capita (1995 PPP$). GDP per capita (1995 PPP$). SERVICES (% GDP). GDP per capita (1995 PPP$). Figure 3.1 Shares of agriculture, industry and services as a function of GDP per capita (Source: Van Vuuren, 1999). The industrial share in the economy is showing a Kuznetz-type of relationship with the size of GDP. It first rises with increasing GDP to 50-60% and then falls to a level of 25-35% in the current most advanced market economies. The European economies in transition are an.
(11) RIVM report 402001 015. page 11 of 23. exception again to the rule. They show a relatively high share of industry. The ‘information age’ may cause major changes in the structure of the economy. E-commerce could result in an increased consumer-orientation of companies and global agglomerates of enterprises focusing on specific product mixes. In the future further shifts towards a service economy at both the global and the regional level are to be expected. In a globalizing world, developing countries could take an increasing share in the global production of food and consumer goods. If regional markets are fully liberalised and if active transfer of knowledge and technology occurs, Western Europe for instance might loose its prominent position in the world market. Although economies - when they progress - transform from an agricultural phase via an industrial phase towards a service and knowledge oriented economy, this does not mean that at any stage the absolute level of nutrient or material throughput is decreasing. Industrial and urban economies grow because agricultural productivity is increasing. A sound rural economy is a prerequisite for a sound urban economy. Likewise the workers in the service sector are the main consumers of industrial products. The decline of the material- and energy-intensity of the economy is often used by economists as a proxy for sustainable development. In general its relationship with GDP per capita is assumed to have a reversed U-shape (the so-called Kuznetz-curve). The shape of this curve is determined from the rate of transfer to a service economy, substitution of materials by more efficient and renewable ones and development of more efficient technologies. A substantial decrease of the material intensity due to these factors is expected in the future. E.g. the intensity of the use of metals could decrease by a factor 10 in the 21st century (van Vuuren, 1999). Over the last hundred years the intensity of the use of metals has sharply increased. The building of cities, heavy industry and all kinds of machinery and appliances have contributed to this growth. Now this trend seems to be reversed: the intensity of use (per $) is decreasing, although the total consumption is still increasing. In most industrialised countries, demand for metals has levelled off. In developing countries however the demand for iron and steel is still increasing. Being at a per capita level of about 20% of the industrialised world, the potential for growth is still enormous. Transfer of technology to developing countries will enhance this process. Future projections suggest an increase of the total use of metals by a factor of three to five sometime in the new millennium due to the factors mentioned. Even a drastic improvement in the ecoefficiency of the economy is not sufficient to cause an absolute decrease in materials use. Only in the second half of the 21st century an absolute decrease could be possible, due to a decrease in the world population..
(12) RIVM report 402001 015. page 12 of 23. 2.0E+08. 2.0E-06. 1.5E+08 Hist. 1.5E-06. Hier Ega 1.0E-06. Ind. Consumption (ton). Intensity of use (kton/ ppp$). 2.5E-06. MedAlloy Hist. 1.0E+08. Hier Ega Ind. 5.0E+07 5.0E-07. 0.0E+00 1900. 1950. 2000. 2050. 2100. 0.0E+00 1900. 1950. 2000. 2050. 2100. Figure 3.2 Global material intensity and total global use of medium-scarce metals (Cu, Pb, Zn, Sn, Ni) from 1900 to 2100 under different scenario assumptions (van Vuuren et al,, 1999). Transfer of technology to developing countries helps to reduce the increase in total material use: compare the results of an egalitarian approach (Ega) with an individualistic free market approach (Ind). The share of iron and steel production in the total energy consumption varies between 5 and 10% in future projections, being 7.4% in 1995. Energy oriented policies as requested under the Climate Convention, may have a substantial effect on the use of materials. A study by ECN focussing on Western Europe estimates the effect of carbon emission taxes on the use of materials and the subsequent emissions of greenhouse gases (ECN, 1998). Materials production generates about 30% of the Western European greenhouse gas emissions. The tax will mainly reduce energy related CO2 emissions. About one third of this reduction will be attributable to the materials system. The main mechanisms leading to this reduction are: •. increasing energy- and materials efficiency;. •. substitution of inputs such as less iron and steel, more secondary aluminium and more renewables like wood;. •. increased recycling and re-use.. This study emphasises the need for an integrated analysis of the energy and material components of the economy and its response to efficiency oriented incentives.. The Global Scenario Group (Raskin et al., 1998) expects an increase of the global final energy demand by a factor 2.4 until 2050 in its Reference scenario. This factor is reduced to less then 2 in its policy reform scenario. Industry is responsible for about 40% of the total final demand. The intensity of energy use is assumed to drop dramatically in both scenarios, i.e. by one third (business as usual) up to two thirds (Policy Reform scenario) from the 1995 level of 12 MJ per dollar purchasing power parity of GDP. The current regional differences in the energy intensities are substantial. Asia and the Pacific region, and Eastern Europe and the Former Soviet Union are still a factor five less efficient than OECD countries. These differences are assumed to level off in the course of the 21st century. According to conventional wisdom a Kuznetz-shaped curve, with an absolute decrease in global energy use in a growing economy, seems hardly feasible. Bending the trends in environmentally harmful activities requires well-tuned action in the “techno-sphere” and the “socio-sphere”..
(13) RIVM report 402001 015. page 13 of 23. Technological innovations may lead to substantial savings of energy and material use and to reductions in emissions to the environment, but they should be developed within a comprehensive framework in which the fulfilment of the ultimate needs is taken as a starting point and be backed by changes in behaviour. Three kinds of innovation can be distinguished (NRP, 1999): n. n. n. System optimisation focussing on improving existing products, processes and infrastructure (e.g. improving energy efficiency); System redesign in which the original design is partially changed leaving the original system in place (e.g. hydrogen economy/ renewable energy systems); Function innovation oriented at newly designed technological (and social) systems that fulfil human needs more efficiently (e.g. create comfort by other means than heating).. function innovation 10+ improved environmental efficiency (factor). system optimization. system redesign. 5. 2. 5. 10. 20. time horizon (in years). Figure 3.3 Efficiency improvement and diffusion time of three kinds of environment-oriented system innovations (NRP, 1999). The diffusion time and the rate of increase in environmental efficiency differ for each type of innovation. Function innovation might deliver the desired efficiency improvement by a factor 10 to 20, but it may take several decades to achieve full diffusion in society of such an innovation. Governments and international organisations play a crucial role in starting such an innovation process by investing in research and development and education. System optimisation and redesign diffuse faster but create lower efficiency improvements. Governments could set challenging future emission ceilings or legally binding efficiency standards to trigger technological and behavioural change. Financial and economic instruments like pricing, taxing, subsidies and investment policies could also stimulate this outcome. Function innovation will require a long development time, but at the same time it needs vision, initiatives and leadership now! It will become more and more difficult to influence technological developments in the future, as the share of governments and large firms in research and development is decreasing. Research in the field of medicines, biotechnology, nano-technology, new materials and information technology is more and more taking place in small (start-up) firms, which sell there marketable innovations to large international companies. Without.
(14) RIVM report 402001 015. page 14 of 23. governmental interference technological development is more likely to be focussed on human needs like health, pleasure and efficiency, than on the protection of non-marketable common goods. While markets are more and more liberalised and state companies are privatised and national regulations decentralised in many countries, industry shows a tendency towards a further centralisation and globalisation. The question arises whether the current international organisations focussed on environmental and social aspects of sustainability are strong enough to counterbalance the economic power of multinational industries. Up to now WTO is mainly focussed on removing trade barriers. The more global markets are free, the more important general agreements on minimum requirements for social, cultural and environmental protection will become. UN-actions are legitimate because of the transboundary nature of environmental problems, the fact that the global environment is a common property and that no other body can protect environmental (and social and cultural) values against the increasing power of the global market. Decisions that affect the environment and intergenerational equity call for more openness and clarity. UN-action could contribute to coherence by untangling the complexity and removal of inconsistencies with other UN-actions and actions by the nations (e.g. reduction of subsidies that are harmful for the environment. For many environmental problems the UN is the adequate level to agree upon effective policy instruments. UNEPs GEO-2000 warns that especially waterand food-scarcity might cause political tensions and increasing numbers of ‘environmental’refugees. Most of these tensions can be identified already now. A more pro-active role of the Security Council could help to avoid wars and refugees. Up to now environment protocols and conventions are the result of negotiations among 188 countries, and their compliance remains basically voluntary. For some environmental topics voluntary covenants between a limited number of responsible key-players might be faster to agree upon and more effective. For some environmental problems negotiations could be focussed on a “G15” level for each problem: almost 80% of the greenhouse effect is caused by 15 countries, 75% of the forests are in 15 countries, 40% of the plant species are uniquely found in 15 countries, etc. It could even be efficient and effective to develop an UN-covenant with the 10 largest oil companies (together their market share is almost 50%), or the 10 largest carmanufacturers, whose total world market share is 70%, according to the Fortune 500 list..
(15) RIVM report 402001 015. 4.. page 15 of 23. Local sustainability: balancing environmental, social and economic targets in urban areas. In complex agricultural societies administrative centres and trading places grew into urban communities. The size of the cities depended heavily on the agricultural productivity and the organisational quality of the society. More than 2000 years ago the number of large cities was limited to about twenty. This number increased rapidly after the medieval period to over a thousand cities having more than a hundred thousand inhabitants. Especially after the industrial revolution cities became the engines for economic growth. Most of the cultural heritage of nations is found in cities. Specialisation and expansion of industries and services have led to a complex network of cities of various sizes. Nowadays urban areas are no longer limited to welldefined city boundaries. New modes of transport and communication have caused a wider spatial diffusion of urban activities: industries have become more footloose, services are no longer confined to the core of the cities and high income groups leave the neighbourhoods with the highest density and the poorest environmental quality. This is the way metropolitan areas have developed in advanced countries. Accessibility, social segregation, lack of social cohesion, air pollution in street canyons, traffic-noise and the loss of non-urban landscapes are the main challenges for the future. In less advanced countries many cities are surrounded by informal settlements of low-income groups, with poor access to clean water and urban facilities. Spatial and infrastructure planning are often lacking or lagging behind, which could harm the attractiveness of cities for economic activities, despite the large potential (labour and consumer) market. The World Development Report 1999/2000 (World Bank, 1999) states that urbanisation and economic growth go hand in hand in all parts of the world, with the exception of Africa. According to the World Bank the African pattern of urbanisation without growth is caused by the subsidies on food and trade that favoured urban consumers over rural producers. Poverty will thus remain to be the main problem of cities in Africa. The share of urban residents is steadily increasing and could ultimately become 80-90% of the world population. Much of the urbanisation is taking place in areas where water is scarce. Now 2.5 billion people live in areas where annually more than 50% of the available water is used. In 2020 it is expected that 4 billion people live in such areas. The Global Scenario Group (Raskin et al., 1998) has explored future urbanisation-trends up to the year 2050. As compared to 1995 the total population in developing regions will almost double to about 8 billion. Already now most urban dwellers live in developing countries. The population in the developed part of the world will only slightly increase to less than 1.5 billion. In advanced countries about 90 % of the population will live in urban areas. The urbanisation rate in less advanced countries will almost double in this fifty years period to about 70 %..
(16) RIVM report 402001 015. 12. Rural least developed Rural less developed Rural more developed Urban least developed Urban less developed Urban more developed. 10 population in billions. page 16 of 23. 8 6 4 2 0 1950. 1960. 1970. 1980 1990 year. 2000. 2010. 2020. 2030. Figure 4.1 The share of urban population from 1950 till 2030 according to the UN World Population Prospects 1998 The determination of causal mechanisms explaining urbanisation is still in its early stages. An older UN-study (UN, 1980) suggested that income level and growth is positively associated with rural out-migration. An average additional $100 per capita of GDP corresponds with a migration of about 0.3% of the rural inhabitants to the urban areas. Most of the economic growth in the developed world is caused by the shift from agriculture to industry and services. The urban environment is well suited to accommodate this growth. Its energy and material efficiency is high and it provides flexible and productive labour forces. In the developed world, some 60 percent of GDP is generated in urban areas (WRI, 1996). Some other factors are playing a substantial additional role in the developing world. Rural-to-urban migration accounts for 40 to 60 percent of the total urbanisation in these regions. On top of this process, high fertility rates of the low income groups in the urban population is speeding up urbanisation.. 100% 90%. Urbanization. 80% 70% 60% 50% 40% 30% 2. R = 0.611. 20% 10% 0% 0. 5000. 10000 15000 20000 25000 GDP per capita (PPP). 30000. 35000. Figure 4.2 Regression analyses of urbanisation rate and GDP per capita in US$ Purchasing Parity Power, 1997 (Source: World Bank, 1999).
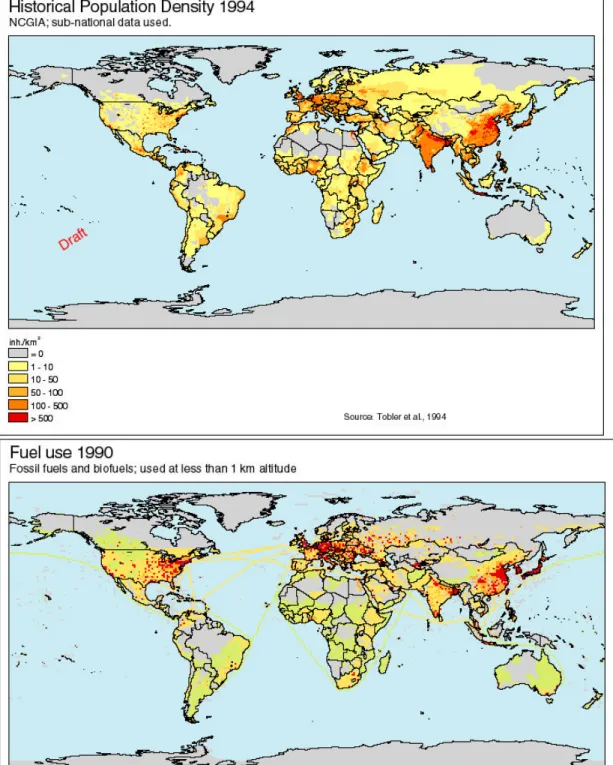
(17) RIVM report 402001 015. page 17 of 23. Figure 4.3 Densities of population and the use of primary energy. Urbanisation is characterised by high population densities and high densities in the use of primary energy. The spatial distribution of these indicators shows high densities in large parts of Asia, Northwest Europe and some parts of the Americas and Africa. High population density.
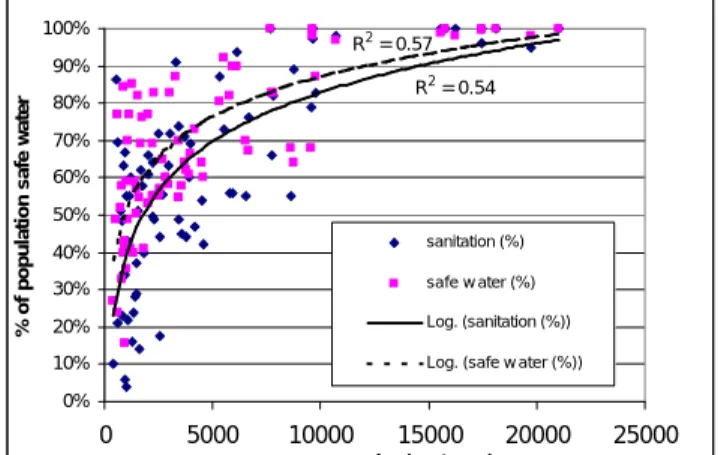
(18) RIVM report 402001 015. page 18 of 23. and high densities of human activities are a potential source of local environmental problems if no appropriate measures are taken. Insufficient investments in urban infrastructure and inadequate urban planning and management may result into a variety of environmental problems. Water supply and sanitation, waste disposal, and urban air quality are the main environmental problems associated with urbanisation, although the variability both among cities and within city quarters are significant. The size and rate of control of these problems are related to GDP. Inadequate water supply, sanitation and waste disposal are crucial causes of death due to infectious and parasitic diseases. Air pollution can cause respiratory and circulatory diseases. Water-related problems and point-sources of airborne emissions are gradually solved when GDP increases and means for investments become available for water supply, sanitation and the substitution of fuels that contribute to local air pollution (such as coal). While air pollution due to point sources is decreasing, air pollution due to traffic is increasing with GDP. In advanced countries traffic is now the main source of air pollution in cities. In many developing countries decreases in the population exposure to particulate matter due to the use of cleaner fuels, are now substituted by an increase in photochemical smog, mainly caused by traffic. In some advanced countries, measures are underway to implement the cleanest car-technologies and to redesign the urban traffic and transport system, in order to reduce high population exposure in street canyons.. 100%. R2 = 0.57. % of population safe water. 90% R2 = 0.54. 80% 70% 60% 50%. sanitation (%). 40% 30%. safe w ater (%). 20%. Log. (sanitation (%)). 10%. Log. (safe w ater (%)). 0%. 0. 5000. 10000. 15000. 20000. 25000. GDP per capita (US$PPP). Figure 4.4 Regression analyses of safe water access and sanitation and GDP per capita in US$ Purchasing Parity Power, 1993. Many urban areas in developing regions are not yet capable to cope with these types of infrastructural problems. Higher levels of energy use may cause severe air pollution problems affecting human health and nature. The highest levels of sulphur and nitrogen emissions per km2 are nowadays occurring in Western and Central Europe, South East Asia and the eastern part of North America. Emissions of particulate matter are following similar spatial patterns. Considerable effects on public health are associated with these types of air pollution. Currently the loss of about half a healthy life year per inhabitant is associated with air pollution in Western Europe. This loss may be considerably higher in parts of Asia..
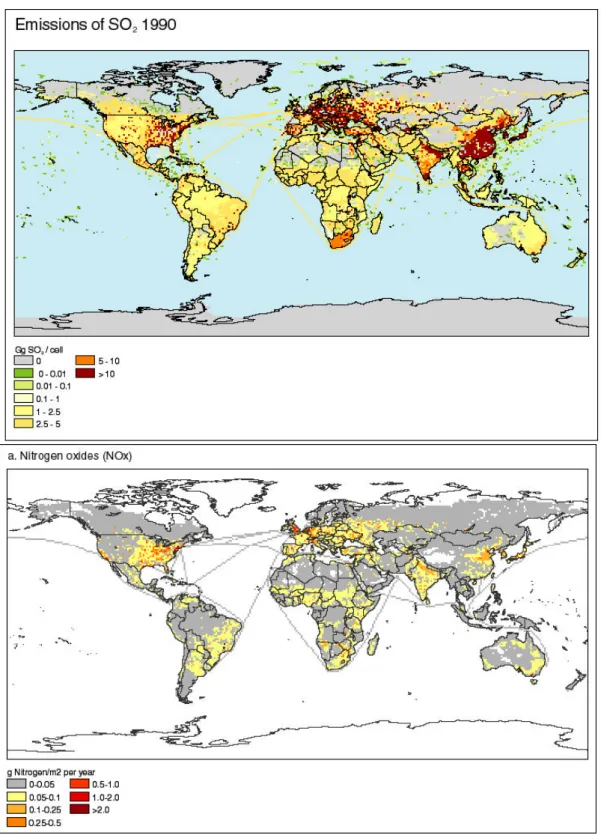
(19) RIVM report 402001 015. page 19 of 23. Figure 4.5 Densities of emissions of sulphur and nitrogen compounds into the air. Urbanisation processes appear to be of great importance from an environmental perspective. Development of metropolitan areas at the sub-regional or even the regional level is going to play a dominant role in future land use. Investments in roads, railways, waterways, harbours and airports plays a crucial role in the accessibility of cities and the network of cities that may arise in metropolitan areas. The protection of landscapes and natural parks and forests in metropolitan areas will require a strict land use plan and in some cases ownership of such ‘commons’ by governmental organisations. Segregation within urban areas requires investments to upgrade the.
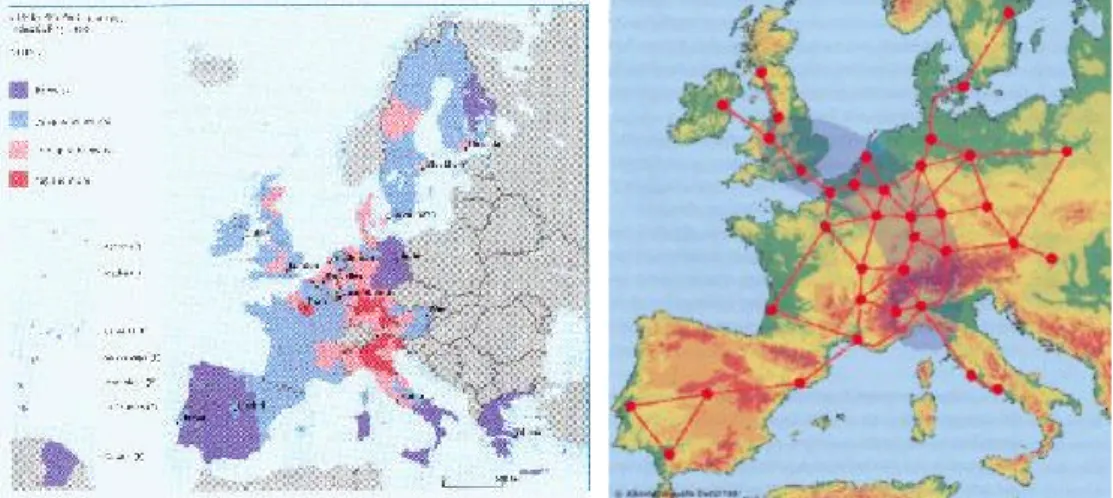
(20) RIVM report 402001 015. page 20 of 23. attractiveness of city quarters for companies and middle and high income classes. In order to balance all relevant economic, social and environmental aspects comprehensive urban and infrastructural planning will be needed. The right balance between the different domains will differ in time and space. Even the choice of relevant local indicators for sustainable development shows very different results among cities and stakeholders, and depends on prevailing perspective on sustainability. It seems important to acknowledge these differences, for instance by facilitating public participation in the definition of indicators and desirable futures. Lessons from several local sustainability debates are that every town develops it own set of indicators and that the content of what ‘sustainability’ means changes over time and space. Harmonisation of indicators seems less important than the interactive process of public participation, communication and experimental forms of local partnership focused on integrated planning. In the future most of the economic metabolism will take place in cities. Two factors are crucial for a sustainable development: (1) technological optimisation of the urban metabolism, aimed at the reduction of material and energy losses and an increase of the reliance on renewable resources; and (2) the future life style of the urban resident. Pricing, product information, education and infra-structural urban planning all are ways to influence the consumer towards a sustainable life style. Both in advanced and in less advanced countries further improvements in the efficiency of the use of energy and materials and the use of land can contribute to the protection of the surrounding ecosystems. The challenge is to define investment programs that will improve the economic attractiveness of cities (accessibility, urban facilities) and at the same time reduce unemployment and poverty and the pressure on the environment. Policy studies carried out in the framework of UNEPs Global Environment Outlook (GEO 2000, 1999) underscore the global need for local action. In the absence of policy measures the emission of sulphur and nitrogen compounds to the air will at least triple in the next three decades in continental Asia. To stabilise these emissions at its current levels a comprehensive urban policy is required. It will have to contain the accelerated introduction of clean technologies in energy production and transport, fuel switching, increasing transportation efficiency and promoting investments in public transport systems. Both in North America and Europe substantial reductions are underway with the new protocol on acidification, eutrophication and ground level ozone under the UN Convention on Long-Range Transboundary Air Pollution. In both advanced and developing countries uncontrolled urbanisation is major problem. A strict spatial planning together with clear property rules and land-pricing mechanisms could be part of the solution. Spatial planning tools could be developed as to optimise land-use for rural and urban purposes. Methods are being developed in the European Union and used in some of its member states. In May 1999 the European Ministers responsible for spatial planning adopted the European Spatial Planning Perspective (Ministry of VROM, 1999). Common policies are proposed in this document with regards to spatial planning at a European scale. This planning perspective aims at narrowing the spatial differences in welfare and prosperity, optimising business environments and providing a common spatial framework. It defines three main goals to be reached: n. Polycentric spatial development and a new urban-rural relationship. n. Parity of access to infrastructure and knowledge. n. Prudent management of the natural and cultural heritage. The European urban system is dominated by a high intensity economic area between London and Milan, in which the generation of GDP per capita is relatively high (see Figure 4.6a). This spatial trend is most likely to prevail in the next decades. The European spatial structure consists.
(21) RIVM report 402001 015. page 21 of 23. of several core areas of global importance supported by a number of highly competitive metropolitan regions outside these areas. An integrated transport, environment and regional development should mitigate the negative effects of increasing traffic volumes. Trans-European Networks for transport and telecommunications are an important component of such a policy (see Figure 4.6b). Implementing this policy requires substantial (private and public) investments and interregional co-operation.. Figure 4.6 Distribution of GDP per capita of regions in the European Union (a) and the European urban network and its central area of global importance (b) (VROM, 1999) If one applies the subsidiarity-principle (which means that political actions are only taken at a more centralised level, when those actions cannot be taken more effectively at a more decentralised level), the role of the UN for local governments is very limited. Subsidiarity seems crucial to maintain cultural differences and a maximum of (local) freedom. The UN could help in capacity building, stimulate local initiatives and information exchange via the Internet and disseminate successful local experiences, as is currently already done by Habitat and UNEP. The UN could for instance effectively exchange information between mega-cities, e.g. via a council of mayors of the top 50-mega-cities of the world. Globalisation of the economy causes cities to compete with each other on their economic, social and ecological attractiveness. Competitive mega-cities will continue to grow, the other ones may stagnate or decline. The Woodrow Wilson Centers report (1999) concludes that: “how the world’s mega-cities are managed in the coming decades will shape patterns of economic growth, the settlement of vast populations and the social and political stability of many developing countries”..
(22) RIVM report 402001 015. 5.. page 22 of 23. Challenges for policy making in the new millennium. Sustainable development requires economic efficiency, social equity, human security and ecological stability and recovery. Substantial transfers of knowledge, technology and financial resources are needed from advanced to less advanced regions to promote sustainable development at a global scale. Ecological efficiency calls for a reduction of the intensity of the use of materials and energy by a factor of ten to twenty. Global diffusion of the best available technology may achieve a reduction by a factor of about two as a global average. Higher increase of efficiency requires R&Dinvestments in new processes and technologies. Their full diffusion through society may require decades at the least. Economic instruments like tax reduction schemes and subsidies can be used to speed up this process of innovation. Multinational companies, now generating a substantial part of the world’s gross product, need to play a prominent role in this search for sustainability. Strengthening international bodies for the protection of environmental, cultural and social values could become necessary to counterbalance the unwanted effects of economic globalisation. The process of urbanisation seems to be associated with economic growth and the sectoral composition of the economy. Cities are becoming part of metropolitan areas with regional and even global webs of economic centres connected with each other by transport systems. Poverty remains the main urban problem in developing regions. Local sustainability requires a more efficient use of water resources, materials, energy and land as well as the development of an attractive environment for economic activities. This requires an adequate system of comprehensive urban and infrastructure planning, taking into account accessibility as well as the protection of the cultural and ecological heritage. Both the management of future uncertainties, as well as diversity of perspectives on sustainable development could be acknowledged by finding ways to increase public participation in designing desirable sustainable futures. International co-operation at the regional and even the global level is required both in the public and the private sector. Globalisation of economies, self-determination, sustainable use of resources and an adequate material standard of living are also contributing to human security and will reduce the risk of conflict and war. For this reason it could be assumed that citizens from all over the world will gradually accept a further globalisation of governance. New international institutional arrangements could also involve multinational corporations and international financing..
(23) RIVM report 402001 015. page 23 of 23. References Gielen D.J., Pieters, J.H.M. (1999) Instruments and Technologies for Climate Change Policies, ECN, Petten Hammond, Allen (1998) Which World? Scenarios for the 21st Century. Global Destinies, Regional Choices, Island Press/Shearwater Books Hilderink, H.B.M. (2000) ‘World Population in Transition: an integrated regional modelling framework’, PhD Thesis University Groningen. Langeweg, Fred (1998) The Implementation of Agenda 21: “Our Common Failure”, The Science of the Total Environment 218 p227-238 Meadows Donella H. et al (1972) The Limits to Growth, Universe Books, New York Meadows. Donella H, Meadows Dennis L, Randers Jorgen (1992) Beyond the Limits, Global collaps or a sustainable future, EarthScan Publications Ltd, London Myers, Norman (1984) GAIA, An atlas of planet management, Gaia books, London NRP, Dutch National Research Programme on Global Air Pollution and Climate Change (1999) Major Shifts in Societal Trends and Their Impacts on Climate Change, report no.: 410 200 012, Bilthoven Raskin. P., Gallopin, G., Gutman P., Hammond A. and Swart R. (1998) Bending the Curve: Toward Global Sustainability. A report of the Global Scenario Group, SEI/PoleStar Series report no. 8 UN (1980) Patterns of urban and rural population growth, United Nations, New York. UNEP (1999) Global Environment Outlook 2000. EarthScan Publications Ltd, London Van Vuuren, D.P, Strengers, B.J, and de Vries, H.J.M. (1999) Long-term Perspectives on the World Metal Use, A Model-based Approach, RIVM report 461502 021, Bilthoven VROM Ministry of Housing, Spatial Planning and Environment (1999) Spatial Perspectives in Europe, The Hague Woodrow Wilson Center (1999) Environmental Change and Security project; Population, Urbanization, Environment and Security, a summary of the issues, Issue 5, ISSN 1091-9988 World Bank (1995) Monitoring Environmental Progress; A Report on Work in Progress, ESD series World Bank (1999) Entering the 21st Century: World Development Report 1999/2000, Oxford University Press WRI (1996) World Resources 1996-1997: the urban environment, Oxford University Press.
(24)
Afbeelding

+7


GERELATEERDE DOCUMENTEN
Voor een bedrijf zonder recirculatie van drainagewater en daarmee ook geen bassinwaterlozingen, is de totale potentiële emissie in grammen is het hoogst voor afvoer van het restant
In overeenkomst met het onderzoek van Katsoulos et al (2009) had Clinoptiloliet een verhogend effect op het vetgehalte van de melk en een verlagend effect op het celgetal en werden
The effects taken into account in the present research are the volumetric forces, drag, stress gradient, added mass and the history
The director, on the other hand, is forced to follow the tumbling period of the rods but undergoes an artificial transition from kayaking to wagging due to its inability to follow
the values obtained from this study for all 1200 kg/m 3 LWFC tests lie below the lowest design bond stress specified in BS EN 1992-1-1
This paper explains the architecture of solution, the safety integration model, and customized A3 architecture for the interactive communication of information.. The
Religious organizations seem to be an adequate and important agent in understanding the current state of our participation society due to their scope, place in communities
Through the efforts of Pereisc, della Valle and Kircher, the approach to Egypt changed and the first steps towards Egyptology were made but especially on the area of what
