1
The rationale of spatial
economic top sector policy
PBL Netherlands Environmental
Assessment Agency
2 The rationale of spatial economic top sector policy
This report is the translation of the Dutch PBL publication ‘De ratio van ruimtelijk-economisch topsectorenbeleid’ (2012)
© PBL Netherlands Environmental Assessment Agency The Hague, 2013
This report was written at the request of the Dutch Ministry of Economic Affairs, Directorate Regional and Spatial economy.
Corresponding author
otto.raspe@pbl.nl
Authors
Otto Raspe, Anet Weterings (PBL)
Margreet Geurden-Slis, Gusta van Gessel (CBS)
Supervisor
Dorien Manting
Acknowledgements
The authors thank Hans van Amsterdam and Stephaan Declerck (PBL) as well as the centre for policy statistics (Centrum voor Beleidsstatistiek) of Statistics Netherlands (CBS) for their contributions towards the analyses involved in this report.
Graphics
Hans van Amsterdam and Allard Warrink
Translation
Serena Lyon
This publication can be downloaded from: www.pbl.nl/en. Parts of this publication may be reproduced, providing the source is stated, in the form: Raspe O et al. (2012; English translation 2013), The rationale of spatial economic top sector policy, The Hague: PBL Netherlands
Environmental Assessment Agency.
PBL Netherlands Environmental Assessment Agency is the national institute for strategic policy analyses in the fields of the environment, nature and spatial planning. We contribute to improving the quality of political and administrative decision-making, by conducting outlook studies, analyses and evaluations in which an integrated approach is considered paramount. Policy relevance is the prime concern in all our studies. We conduct solicited and unsolicited research that is both independent and always scientifically sound.
3
4
The rationale of spatial economic top sector policy
1 Introduction
Cities and clusters are important from an economical point of view. According to various national and international studies, agglomeration economies mean that businesses in urban areas and clusters are more productive, experience greater growth and are more innovative than businesses located in non-urban areas.1 However, this does not apply to
every type of business; nor is every type of urban area a dynamic motor for economic growth: there can even be considerable differences in the functioning and performance of regional economies within the Netherlands.
A region’s performance is partly related to its economic structure; a region in which there are many growth sectors will, for example, often experience high economic growth (a compound effect). However, the type of commercial activity in the local area also provides businesses with a form of economic power. The presence of other activities affects, for example, the extent to which a company can profit from knowledge
spillovers, or the size of a local specialised labour market or supply and demand market. Various aspects of the business environment also affect the functioning and performance of companies, or the extent to which a region is considered an attractive location for a company. Examples are accessibility (by road, public transport and air), the presence of centres of expertise, the quality of the labour force and the availability of various facilities. In summary, economic success is driven to a large extent by the regions, or can be related to the regional context in which businesses operate.
The finding that regions are important to the economy2 therefore raises the question of
whether, and if so how, spatial economic policy can contribute to the success of urban economies and clusters. The Dutch Ministry of Economic Affairs (EZ) has posed an additional question regarding the rationale behind national spatial economic policy; if the regions are important, does this mean that they themselves are responsible for their development, or should we be looking at an active role for the national government?3
This is an interesting question, particularly in light of the government’s recent top sectors policy, which barely touches on the spatial economic perspective.
This question is addressed in this memorandum. To find the answer, we have investigated the pros and cons of spatial economic policy, both in general and more specifically in relation to the top sectors. Both the philosophy of the top sectors policy and the choice of top sectors are beyond the scope of this memorandum. We are primarily interested in presenting the facts and figures related to the top sectors and their spatial distribution: information that until now has not been addressed in the top sectors debate. With this in mind, PBL Netherlands Environmental Assessment Agency, together with Statistics Netherlands, quite literally has ‘mapped’ the top sectors (see Appendix 1 for further explanation). However, before presenting these facts and figures, top sectors policy is first described from a historical perspective.
5
2 Top sectors approach in perspective
Roughly speaking, spatial economic policy has been developed over the last few decades with two types of objectives in mind.4 The first of these has been to remove regional
disadvantages or to support sectors – often those experiencing difficulties – in specific regions. Through this equity policy, the government has aimed to reduce welfare disparities between regions. The second objective has focused on the strengths and potentials of individual regions. Through this efficiency policy, the government has aimed to stimulate productivity (added value per employee) and export.
The equity policy has played a particularly dominant role in the Netherlands. Up until 2000, it was the cornerstone of almost every spatial economic policy document. Very often it was the only objective, although it was sometimes supplemented with elements of efficiency. This trend changed with the 2004 policy document Pieken in de Delta (Peaks in the Delta) by the Ministry of Economic Affairs, in which the equity policy was completely renounced. Since then, spatial economic policy has focused mainly on the growth capacity of the Dutch economy and on improving the competitive position of the Netherlands.5 With Pieken in de Delta, the government aimed to stimulate economic
growth in every region by making use of region-specific opportunities that would have an effect at the national level. This policy was based on the region and the strong sectors in those regions.6 The Ministry of EZ has continued this focus on efficiency in its top sector
approach described in the recent Bedrijfslevennota policy document (EZ, 2011). This policy focuses on reinforcing the competitive position of the Netherlands, based on the ambition to make the Netherlands one of the strongest knowledge economies in the world.7 Of note is the fact that this focus is mainly on the sectors (the nine top sectors),
and to a much lesser extent on the regions. Another focus of this top sector policy is the decentralisation of spatial economic policy. Although the Bedrijfslevennota does state that strong clusters are partly responsible for the success of the top sectors, it goes on to emphasise the need for good cooperation between centralised and decentralised
administrative divisions – each operating according to its own responsibilities – to enable businesses to excel and the Dutch economy to flourish (EZ, 2011: 9). It states that decentralised government authorities are in a better position than national government to assess what the regional clusters need to compete successfully. The Bedrijfslevennota therefore shows national government withdrawing from the field of the regional economy
8. This transition can also be seen in the Structuurvisie van Infrastructuur en Milieu
(IenM, 2012) and the Bestuursakkoord (BZK, 2011), in which the provinces are considered to be responsible for facilitating the regional knowledge triangle, business location policy, the regional business environment and the spatial integration of
commercial activities and centres of expertise. National government retains responsibility for the development of a coherent policy agenda for the nine top sectors – in other words, an agenda that encompasses the full breadth of government policy. However, what exactly does this mean? This policy agenda may contain regional elements, but there is no mention of how these are to be further defined by the Ministry of EZ’s top teams9. The Structuurvisie Infrastructuur en Ruimte is the most specific: given the
concentration of top sectors in the urban regions surrounding the main ports, Brain Port and green ports and a number of valleys, national government will focus on
strengthening the spatial economic structure and on investment in infrastructure in these regions (IenM, 2012: 6-7).10
The most recent spatial economic policy documents, therefore, have abandoned the equity objectives of spatial economy policy. It is no longer about removing regional disadvantages; rather the focus is on the strength and potential of certain sectors in the regions (efficiency). There is however an important difference between the two
efficiency-oriented policy documents. Whereas Pieken in de Delta is based on the
6 perspective in the Bedrijfslevennota focuses mainly on a sectoral approach, with much less importance attached to the region.
Lacuna
There is a lacuna in both policy documents. One point of criticism regarding Pieken in de Delta is that although this policy document addresses the main sectors in each region, it lacks knowledge of and consideration for how these regional peaks relate to one another at the national level: which regions are truly important in a particular sector (peak)? There is also a lack of international perspective in this policy document: are the Dutch peaks the same as the European peaks? The approach missing in Pieken in de Delta is in fact central to the top sector approach in the Bedrijfslevennota: the strongest and most important sectors at the international level. However, much less developed in this policy document is where these sectors are concentrated exactly. It is therefore possible that much of the cluster potential and agglomeration power remains hidden in the top sector policy. It is also possible that the regions will be much less involved in policy –
involvement that, in the peaks policy, was considered so positive, particularly in the form of the regional cooperation between companies, organisations and research institutions.11
Without information on the spatial concentration of the top sectors, therefore – information based not on the relative specialisations of the regions but on the real concentration of business locations – it will be difficult for national government to
estimate the potential of the various regions and to implement effective spatial economic policy.
7
3 Which information is required?
We believe there are three fundamental elements required to fill the lacunas described above. First of all, information is required about the spatial distribution of the top sectors: where are the top sectors concentrated in the Netherlands? The regions characterised by a strong concentration of business locations in a particular top sector are of potential interest to national top sector policy. After all, it is the quality of the regional business environment that is largely responsible for the functioning and needs of the companies in a particular top sector. In addition, clusters of companies develop for a reason (see Text Box 2). The assumption is that companies that are located in clusters and agglomerations profit from urbanisation and localisation economies, and are therefore more productive and innovative than other companies.12 Secondly,
concentrations of companies are particularly interesting if the cluster also has a certain mass. In addition to the number of business locations (which is already taken into account in the concentration), mass mainly concerns the number of jobs in the cluster. From a national point of view, large clusters are often more interesting than small clusters, as a lot of policy is based on stimulating, creating or maintaining employment opportunities. Thirdly, regional specialisation also plays a role. If there is a high level of specialisation within a cluster in a region, then it will probably be easier to tally regional policy with national top sector policy, as the top sector will already be a primary focus area from the regional point of view.
These three elements should be considered in relation to one another. In our opinion, the concentration of businesses in the top sectors is the main issue, followed by the
combinations of concentration with mass and with specialisation. Most interesting are the regions that combine a high concentration of top sectors with both a large job mass and a strong specialisation in the sector within the regional economy. The three elements taken together therefore identify regions that are so strongly linked to a top sector that they are very important to successful top sector policy. In addition, it is also easy for national government and the region to act in unison as there is a mutual interest: a top sector is a primary focus area at both the national and the regional level. However, it is not always the case that only those regions that score highly in the combination of concentration, mass and specialisation are of interest to top sector policy. Regions with a high concentration and a strong specialisation in a top sector but a lower mass are also potentially interesting. These are regions with a cluster of lots of small companies. In fact, cluster theory describes mass in terms of the number of business locations, not the number of jobs: a large number of jobs can also be due to one large company in a region. However, regions with a high concentration and a high mass but with no strong specialisation are also potentially interesting. These are often the larger regions or urban conurbations with a high diversity in economic activities. In such cases, a relative
specialisation in a top sector is not easily discerned, although there are, in absolute terms, a lot of jobs in this sector. Finally, a sector may be important in a region due to a strong relative specialisation even if there is not a high concentration, in particular if there are a relatively high number of jobs in this sector. This often concerns a relatively large company in a region that does not otherwise provide many jobs.
By mapping these three elements for the top sectors (see Appendix 2), PBL and CBS have been able to provide a wealth of information on the spatial distribution and
concentration of the top sectors. The spatial distribution, the extent of clustering and the mass in terms of number of jobs are clearly defined for each top sector and each region. The research strategy is described in Text Box 1.
8 Text Box 1 The research strategy13
The PBL Netherlands Environmental Assessment Agency and Statistics Netherlands have mapped the information relating to the three top sector elements described above. The information was collected at the micro – business location – level. The extent of clustering was determined by measuring the distance between a business location and all the other business locations in the same top sector. This resulted in a cluster score for each business location. The main advantage of this method is that clustering was not calculated based on pre-determined administrative divisions. This indicator is further described in Appendix 1. The result was a map of the Netherlands in which each dot shows a business location in a top sector; the cluster score is shown by giving each business location a colour. The maps for all the top sectors are shown in Appendix 2. The redder the dot, the higher the cluster index; in other words, the more companies there are in the same top sector in the vicinity. The greener the dot, the lower the cluster index; in other words, the fewer similar companies there are in the vicinity. The dots vary not only by colour, but also by size according to the number of jobs. The result, therefore, is an absolute concentration pattern that also shows the number of jobs of each business location. To see whether very strong clustering is indeed taking place, a separate map was produced showing only the scores that are very high compared with the benchmark population. It should be noted that the terms clustering (or clusters) and concentration are both used to indicate the spatial pattern of the top sectors.
The maps provide a wealth of information on the spatial distribution and concentration of the top sectors. Aggregating this cluster information by COROP (coordination commission regional research programme) region and comparing this with the regional specialisation shows which regions are strongly concentrated and specialised in the top sectors. The mass in terms of number of jobs is also given for each region. We have named these graphs ‘bubble graphs’ (the axes show the average cluster index and the relative specialisation (location quotient)), and each bubble varies in size depending on the number of jobs. The graph also displays two lines that cross the axes. The horizontal line is the average cluster index of the benchmark population: if a top sector in a region has a higher score than the benchmark, the concentration in the region is higher than that of the benchmark sector. The vertical line refers to the specialisation of a region and represents the national average (with a location quotient of one); a region to the right of the line is relatively over-represented, whereas a region to the left of the line is relatively under-represented compared with the sector structure in the Netherlands. The regions that combine a high concentration of top sectors with a high mass of jobs and a strong specialisation in this sector in the regional economy – in other words the interesting regions in terms of national top sector policy – are found in the upper right quadrant of the bubble graphs. Regions in the bottom left quadrant are much less interesting; they are less concentrated and less specialised. Regions in the upper left quadrant have a high concentration, may have a high mass (and therefore possibly be interesting due to this combination), but are not highly specialised. Regions in the bottom right quadrant have a low concentration, possibly a high mass, and a strong specialisation. These may be important sectors for the region, but compared with other regions the number of business locations in a particular area is low.
9
4 The spatial effect of the top sectors: analysis results
Where are the top sectors concentrated in the Netherlands?
The maps in Appendix 2 show the spatial distribution of the top sectors, the extent of clustering and the size of the business locations. The maps therefore also provide information about the type of cluster, such as a cluster of lots of small businesses (also called Marshallian clusters in the literature) or clusters consisting of one or a few large companies surrounded by lots of smaller companies (also called hub and spoke clusters in the literature).14 The maps also provide information about the location of isolated
(unclustered) large companies.
Broadly speaking, the maps show the following clusters for each top sector:
Agro & Food. The broad Agro & Food sector is most strongly concentrated in the four large cities of the Randstad (Amsterdam, Rotterdam, The Hague and Utrecht). This is mainly due to the fact that the broadly-defined sector also includes the related retail trade. Primary production in the Agro & Food top sector (narrow definition) is most concentrated in the Randstad and Noord-Brabant. The strongest cluster is in Westland and Den Haag.
Life Sciences & Health. The highest concentrations of the Life Sciences & Health top sector are found in Amsterdam, Rotterdam, Utrecht and Leiden. There are also clusters around Amsterdam (Amstelveen and Ouder-Amstel) and around Utrecht (Zeist, Bunnik, Houten and Nieuwegein), as well as in Het Gooi. The only cluster outside the Randstad is in Nijmegen.
High-tech Systems and Materials. The Manufacturing Industry sub-sector is concentrated in the Randstad, Midden-Nederland and Noord-Brabant. There are also a relatively large number of manufacturing business locations in Twente and in Limburg. A very strong cluster of the Manufacturing Industry sub-sector is found in Zuid-Holland (Rotterdam, Schiedam and Krimpen aan den IJssel). The Brain Port activities in this top sector are mainly concentrated in Zuid-Holland, in the Eindhoven region, and in Amsterdam. Smaller clusters are also found in Delft, Nieuwegein, Gouda and Zoetermeer. Finally, the High-tech Services sub-sector is found mainly in the large cities, with the highest clustering in Amsterdam.
Chemicals. The Chemicals top sector is concentrated mainly in the Randstad, the centre of the Netherlands and Noord-Brabant, in particular in Rotterdam, Tilburg-Waalwijk, Amsterdam, Zaanstreek and Amersfoort.
Horticulture & Propagation Materials. The Horticulture & Propagation Materials top sector is mainly concentrated in the province of Zuid-Holland. There are also clusters in Kop van Holland, Betuwe, Brabant and Noord-Limburg, although Westland stands out the most.
Logistics. The Logistics top sector is mainly concentrated in and around the main ports of Rotterdam and Amsterdam, with strong clustering in Rotterdam, Zwijndrecht and Dordrecht, and in Amsterdam, Aalsmeer, Amstelveen and Haarlemmermeer.
Water. The Water top sector is mainly concentrated in the southern part of Zuid-Holland, around Amsterdam and in the west of Friesland, that is in Rotterdam, Werkendam, Krimpen aan den IJssel, Capelle aan den IJssel, Ridderkerk, Amsterdam, Zaanstad, Aalsmeer, Sudwest Fryslan and Harlingen. Creative Industry. The Media and Entertainment sub-sector of the Creative
Industry top sector is concentrated most strongly in Amsterdam, Het Gooi and Utrecht. The Culture and Services sub-sectors are most concentrated in the four major cities, in particular in Amsterdam.
Energy. The Energy top sector is concentrated mainly in Zuid-Holland, in particular in the municipality of Rotterdam. However, strong clustering is also seen in the regions around Amsterdam and Eindhoven.
10 Regions of interest to national government
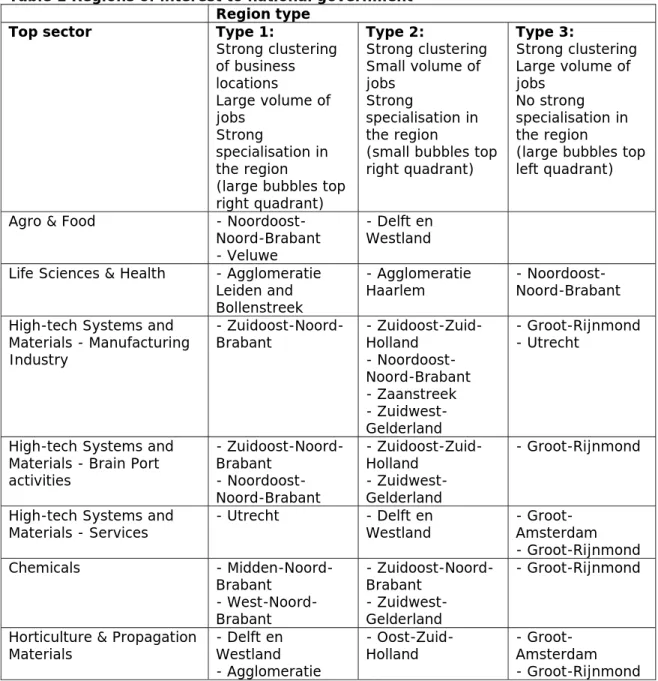
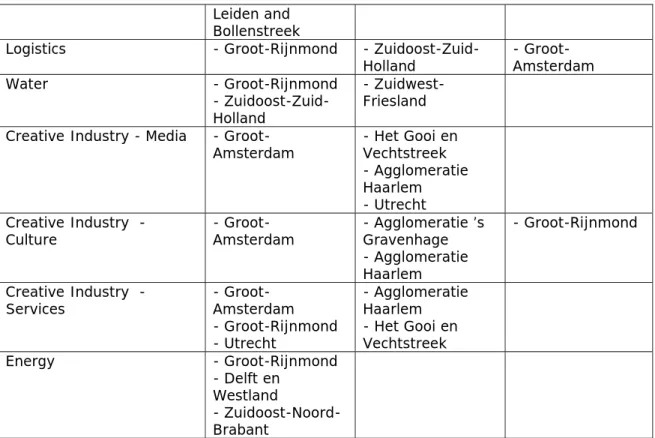
Regions that are potentially interesting to national government display a high level of clustering of the top sectors, with a relatively large number of jobs, in addition to which the top sector concerned is a major contributor to the regional economy (specialisation). However, the other two types of regions may also be of interest. Table 1 therefore provides a summary by region type of the regions that are potentially interesting in each top sector. The table shows that the top sectors can be present in all three of the region types. This means, therefore, that all the region types may be relevant in the spatial implementation of top sector policy. It is also possible that a top sector is represented in more than one region, or that several top sectors are represented in a single region. Table 2 lists the interesting top sectors in each region. This shows clearly which top sectors are important at the national level; this may be more than one or two in some regions. The districts as applied by the Ministry of EZ are used in Table 2, making it possible to see which areas are important to the various top sectors in which district. Table 1 Regions of interest to national government
Region type
Top sector Type 1:
Strong clustering of business locations Large volume of jobs Strong specialisation in the region
(large bubbles top right quadrant) Type 2: Strong clustering Small volume of jobs Strong specialisation in the region
(small bubbles top right quadrant) Type 3: Strong clustering Large volume of jobs No strong specialisation in the region
(large bubbles top left quadrant)
Agro & Food - Noordoost-Noord-Brabant - Veluwe
- Delft en Westland Life Sciences & Health - Agglomeratie
Leiden and Bollenstreek
- Agglomeratie
Haarlem - Noordoost-Noord-Brabant High-tech Systems and
Materials - Manufacturing Industry
-
Zuidoost-Noord-Brabant - Zuidoost-Zuid-Holland - Noordoost-Noord-Brabant - Zaanstreek - Zuidwest-Gelderland - Groot-Rijnmond - Utrecht
High-tech Systems and Materials - Brain Port activities - Zuidoost-Noord-Brabant - Noordoost-Noord-Brabant - Zuidoost-Zuid-Holland - Zuidwest-Gelderland - Groot-Rijnmond
High-tech Systems and Materials - Services - Utrecht - Delft en Westland - Groot-Amsterdam - Groot-Rijnmond Chemicals - Midden-Noord-Brabant - West-Noord-Brabant - Zuidoost-Noord-Brabant - Zuidwest-Gelderland - Groot-Rijnmond
Horticulture & Propagation
Materials - Delft en Westland - Agglomeratie
-
Oost-Zuid-Holland - Groot-Amsterdam - Groot-Rijnmond
11 Leiden and
Bollenstreek
Logistics - Groot-Rijnmond -
Zuidoost-Zuid-Holland - Groot-Amsterdam
Water - Groot-Rijnmond
- Zuidoost-Zuid-Holland
- Zuidwest-Friesland Creative Industry - Media -
Groot-Amsterdam - Het Gooi en Vechtstreek - Agglomeratie Haarlem - Utrecht Creative Industry - Culture - Groot-Amsterdam - Agglomeratie ’s Gravenhage - Agglomeratie Haarlem - Groot-Rijnmond Creative Industry -
Services - Groot-Amsterdam - Groot-Rijnmond - Utrecht - Agglomeratie Haarlem - Het Gooi en Vechtstreek Energy - Groot-Rijnmond - Delft en Westland - Zuidoost-Noord-Brabant
Table 2 Interesting top sectors by district Region Type 1:
Strong clustering of business locations Large volume of jobs Strong specialisation in the region
(large bubbles top right quadrant)
Type 2:
Strong clustering Small volume of jobs Strong specialisation in the region
(small bubbles top right quadrant)
Type 3:
Strong clustering Large volume of jobs No strong
specialisation in the region
(large bubbles top left quadrant)
North Water
(Zuidwest-Friesland) East Agro & Food narrow
(Veluwe)
High-tech Systems and Materials –
Manufacturing industry (Zuidwest-Gelderland) High-tech Systems and Materials – Brain Port (Zuidwest-Gelderland) Horticulture (Zuidwest-Gelderland)
High-tech Systems and Materials – Brain Port (Arnhem-Nijmegen)
North
wing Creative Industry – Culture (Groot-Amsterdam) Creative Industry – Services (Groot-Amsterdam) Creative Industry – Chemicals (Zaanstreek) Creative Industry – Culture (Utrecht, Agglomeratie Haarlem, Zaanstreek, Het Gooi en Vechtstreek, Agglomeratie
Agro & Food narrow (Utrecht)
Energy (Groot-Amsterdam)
12 Media
(Groot-Amsterdam, Het Gooi en Vechtstreek) Life Sciences & Health (Utrecht, Agglomeratie Haarlem) High-tech Systems and Materials – Services (Utrecht) ‘s-Gravenhage) Creative Industry – Services (Utrecht, Agglomeratie Haarlem) Creative Industry – Media (Utrecht, Agglomeratie Haarlem) Energy (IJmond)
Life Sciences & Health (Zaanstreek)
Water (Zaanstreek)
and Materials – Brain Port (Utrecht) High-tech Systems and Materials – Services (Groot-Amsterdam) High-tech Systems and Materials – Manufacturing Industry (Utrecht, Groot-Amsterdam) Life Sciences & Health (Groot-Amsterdam) Logistics (Groot-Amsterdam, Utrecht) Horticulture (Groot-Amsterdam) South
wing Agro & Food narrow (Delft en Waterland) Creative Industry – Culture (Groot-Rijnmond,’s- Agglomeratie ’s-Gravenhage) Creative Industry – Services (Agglomeratie ’s-Gravenhage, Groot-Rijnmond) Energy (Delft en Westland, Groot-Rijnmond) Life Sciences & Health (Agglomeratie Leiden en Bollenstreek) Logistics (Groot-Rijnmond) Horticulture (Delft en Westland, Agglomeratie Leiden en Bollenstreek) Water (Groot-Rijnmond, Zuidoost Zuid-Holland) Creative Industry – Services (Delft en Westland)
High-tech Systems and Materials –
Manufacturing Industry (Zuidoost-Zuid-Holland) High-tech Systems and Materials – Services (Delft en Westland, Oost-Zuid-Holland)
High-tech Systems and Materials – Brain Port (Delft en Westland, Oost-Zuid-Holland)
Life Sciences & Health (Agglomeratie Leiden en Bollenstreek) Logistics (Zuidoost-Zuid-Holland) Horticulture (Oost-Zuid-Holland) Water (Zuidwest-Friesland) Chemicals (Groot-Rijnmond) High-tech Systems and Materials – Manufacturing Industry (Groot-Rijnmond) High-tech Systems and Materials – Services (Agglomeratie ’s-Gravenhage, Groot-Rijnmond) High-tech Systems and Materials – Brain Port (Groot-Rijnmond, Utrecht) Life Sciences & Health (Groot- Rijnmond) Water (Agglomeratie ‘s-Gravenhage) South-east
Agro & Food narrow
(Noordoost-Noord-Chemicals (Midden-Noord-Brabant)
Agro & Food narrow
(Zuidoost-Noord-13 Brabant) Chemicals (Midden-Noord-Brabant, West-Noord-Brabant) High-tech Systems and Materials – Brain Port (Zuidoost-Noord-Brabant)
High-tech Systems and Materials –
Manufacturing Industry (Zuidoost-Noord-Brabant) High-tech Systems and Materials – Services (Zuidoost-Noord-Brabant) Brabant) High-tech Systems and Materials – Brain Port (Noordoost-Noord-Brabant)
Life Sciences & Health (Noordoost-Noord-Brabant) The power of agglomerations
Although top sectors are found throughout the Netherlands, they are particularly
common in agglomeration areas, as can be seen on the spatial distribution pattern maps in Appendix 2. Although it is mainly the primarily service-oriented top sectors that are found in the agglomerations, the industrial and logistics top sectors are found there too. Some regions are mainly of interest due to the localisation benefits (based on the clustering of similar business types), as well as the broader urbanisation benefits that they offer companies (see Text Box 2). As can be seen in Table 1, Groot-Amsterdam and Groot-Rijnmond are important regions for several top sectors. In conclusion, the spatial dimension of the top sectors is characterised by specific geographical clusters as well as strong cities and agglomerations.
Valleys
As described in the policy documents Bedrijfslevennota and the Structuurvisie
Infrastructuur en Ruimte, the ‘valleys’, as well as the main ports, green ports and Brain Port, are also important at the national level. The main valleys are the Energy Valley in Groningen, the Food Valley in Wageningen, the Health Valley in Nijmegen, the
Maintenance Valley in West-Brabant and Midden-Brabant, the Utrecht Science Park, and nanotechnology in Twente and Delft. The identification of such valleys is based on the success model of Silicon Valley, a concentration of technology companies in the San Francisco Bay Area in the American state of California. Regions often attempt to copy this success model, in the hope that a valley in the region will herald the start of great things. There has been, at the regional level in particular, a proliferation of all kinds of valleys in recent years, a few of which are referred to in national policy documents. The question is whether these valleys are also visible in the top sector maps. In other words, are there clear Life Sciences & Health clusters around Arnhem-Nijmegen, Agro & Food clusters around Ede-Wageningen, Energy clusters around Groningen-Delfzijl, High-tech Systems and Materials clusters in Twente and Delft and Maintenance clusters (a sub-sector of High-tech Systems and Materials) around West-Brabant and Midden-Brabant? This is explored below for each valley.
Energy Valley Groningen
The Energy top sector is mainly clustered in Zuid-Holland (around Rotterdam–Den Haag), around Amsterdam and around Utrecht and Eindhoven. There are also more isolated, smaller clusters of energy activities, for example around Arnhem. Groningen and Delfzijl are less prominent as a valley; there are relatively few clusters of energy companies in these regions. However, the Groningen region stands out due to the relatively large proportion of jobs in the energy sector (almost 10% of the total in the Netherlands), while the Delfzijl region has a relatively high degree of specialisation as there are relatively few other types of economic activity in the region. In summary, therefore, the Energy Valley in Noord-Nederland is not so much a cluster of business locations, but more a concentration of a few large companies.
14 Food Valley Wageningen
The Agro & Food (narrow definition) top sector is concentrated in the Veluwe and, to a lesser extent, the Zuidwest-Gelderland region. This may point to a concentration of agro & food companies around Food Valley Wageningen. However, the cluster pattern covers a much larger area as agro & food companies appear to cluster in the Zuid-Zuid-Holland (including Westland)–Veluwe (including Ede-Wageningen)–Noordoost-Noord-Brabant triangle. Food Valley Wageningen, as this cluster is called in the policy documents (the name is based mainly on the available agro & food expertise and technology in the area around Wageningen University), should therefore not be defined too narrowly in
geographical terms. The potential would be much greater if the whole of the triangle were to be considered.
Health Valley Nijmegen
The Life Sciences & Health top sector is clustered mainly in the Randstad around Amsterdam, Leiden and Utrecht and in parts of Zuid-Holland (around Rotterdam–Den Haag). There are also a few smaller clusters, such as Oss, Eindhoven and Arnhem– Nijmegen. There is a relatively high level of clustering in Health Valley Arnhem–
Nijmegen, but this is clearly isolated compared with the clusters in the Randstad. Over four per cent of the total number of jobs in the life sciences in the Netherlands is related to the Arnhem–Nijmegen region. Though not insignificant, there are clearly other regions in the Netherlands that are more important to the Life Sciences & Health top sector, both in terms of number of business locations and jobs (mass).
Technology Valley Twente
The Twente region mainly stands out due to the Brain Port and manufacturing high tech activities, rather than the technology service industry. There is a relatively strong specialisation in Brain Port activities in the region, with over 8.5 % of jobs in these activities in the Netherlands related to this region. The same applies to the
manufacturing industry; over 7 % of jobs in the high tech manufacturing industry are in the Twente region. Despite this, however, the level of clustering is relatively low. There are therefore relatively few high tech companies located relatively near to one another in Twente. Such clusters do however exist around Eindhoven and in the Randstad. Twente mainly has a few relatively large companies in this top sector.
Maintenance Valley in West-Brabant and Midden-Brabant
Maintenance Valley represents several developments taking place at the same time and all related to maintenance, in particular aircraft maintenance. It is therefore difficult to relate each of these activities to a top sector. The High-tech Systems and Materials top sector, and in particular the Manufacturing Industry sub-sector, is most related to this valley as this includes high tech maintenance. About seven per cent of the high tech manufacturing jobs in the Netherlands are related to the Midden-Brabant and West-Noord-Brabant regions. However, the high tech manufacturing industry is concentrated in a much larger area, in particular the whole of Noord-Brabant and the Randstad.
Summary
From the point of view of the top sectors, it is important to view the valleys from a national perspective. They are in fact not always the primary focal point of the top sectors themselves, as was made clear above15, but are more important to the regions
themselves, as the sectors concerned represent a relatively high level of specialisation in the regional economy. Nevertheless, the sector in which the region aims to stand out as a valley is often part of other, more powerful, regions. These are often larger urban regions (agglomerations) that in addition to the cluster advantages of similar companies in the vicinity also offer agglomeration advantages that follow from the presence of a large number and variety of other types of companies.
15 Which top sectors are highly concentrated?
Not every top sector has the same level of clustering: some sectors are strongly
clustered in certain regions, while other sectors are spread more evenly throughout the Netherlands. It is therefore useful to look not only at the spatial distribution patterns, but to also compare the level of clustering of the top sectors. To do this, the average level of clustering was calculated for each sector. The higher the average cluster index score, the stronger the level of clustering in a sector; the lower the average cluster index score, the lower the level of clustering in a sector. The average score can also be compared with the benchmark scores for all business locations in manufacturing and services. The clustering values (please also refer to Appendix 2) are shown in Figure 1. In particular:
Services are much more clustered than companies in the manufacturing industry, as reflected in the average value of the cluster index, and in particular the
maximum value. This means that there are regions in the Netherlands in which lots of service companies are located close to one another, in particular in the cities.
Clustering is particularly high in the Creative Industry top sector (compared with services in general and with the other top sectors). Within Creative Industry, the strongest clustering is in the Media sub-sector, followed by Culture then Services. High-tech – Services displays less clustering than services in general.
The Horticulture & Propagation Materials, Life Sciences & Health, Logistics, Energy and Water top sectors are all more clustered than industry in general.
The High-tech Systems and Materials, Chemicals and Agro & Food top sectors are all less clustered than industry in general.
16 Conclusion
The top sectors are not distributed evenly throughout the Netherlands, but concentrated in regions that often contain more than one top sector. One important conclusion for top sector policy is that linking a top sector with a specific region does not reflect the fact that a top sector may be important in several regions. Linking a top sector with a specific region also fails to take into account the fact that several top sectors may be important in a particular region.
Text Box 2 Why are regions important to companies?
To answer the question why regions are important to companies, we need to consider the role of agglomeration economies. Agglomeration economies are the benefits experienced by companies due to clustering, by profiting from the proximity of other companies. These benefits can be the result, for example, of a larger and more specialised labour market and the corresponding increase in ‘matching’ opportunities, the specialisation of the supply market (input sharing) and the presence of industry-specific expertise – all of which can result in knowledge spillovers.16
Three types of agglomeration economies are often defined: 1) external benefits
experienced by all companies in the area (unrelated to the sector to which they belong), 2) external benefits experienced by all companies within the same sector, and 3)
external benefits due to the variety of sectors in the area. These benefits are called urbanisation economies, localisation economies (or Marshall’s externalities) and Jacobs’ externalities, respectively. Urbanisation economies develop with the size and density of an urban area (benefits due to the concentration of economic, social, political and cultural organisations in densely-populated urban areas, but also due to the presence of universities, research institutions, consumer-oriented facilities, trade organisations and government agencies); localisation benefits are the result of regional concentrations of companies in the same sector (specialised clusters), and Jacobs’ externalities are due to the presence of a variety of sectors in a region. These last two agglomeration economies relate, for example, to the question whether a specialised economic structure benefits the economic performance of a region, or whether a varied economic structure would be better. Is potential knowledge spillover and labour market mobility greater, for example, between the same types of companies, or different types of companies? ‘Related variety’ is increasingly considered to be important: sectors that are related through a common knowledge or technology base. The idea is that spillovers mainly take place between sectors with some kind of overlap rather than between totally unrelated sectors. Agglomeration economies are mainly the result of interactions between companies – these may take the form of trade relations, but also informal, incidental and unintentional interactions, and face-to-face contact is often very important. People need face-to-face contact to be able to exchange personal and complex information, to build trust and to make a continuous and accurate assessment of the potential of constantly-changing business relations. Refining products and services, working together, completing business transactions and – possibly most important – learning from one another and being able to improve through comparison with others (peers) all rely strongly on the opportunities provided by personal contact.
In addition to these economic structure variables, there are all kinds of location factors that also play a role. Examples are accessibility (by road, rail, water and air), the knowledge infrastructure, the labour market (human capital), and so on.17
17
5 Arguments for a national regional-economic policy
It is clear that many companies cluster in specific regions, their spatial distribution mainly dependent on the benefits of being in the proximity of other companies and certain regional circumstances. This also applies to the companies in the top sectors. Who, therefore, is responsible for top sector policy? Does national government have a role in facilitating such clusters, or are the regions themselves responsible for this? On the one hand, it is efficient to allow regions to take the lead in regional economic policy. After all, local authorities and market parties have a better understanding of local
conditions: conditions that may vary greatly and that national government may not be in a position to judge as well as the regions. Clusters and business dynamics within the clusters (such as spin-offs) are often locally embedded in networks of companies, government agencies and centres of expertise (regional innovation systems). The exact ingredients and success factors of economic policy therefore require a tailor-made approach. Making regional stakeholders responsible for such an approach means that there will be less chance (at least that is the idea) that a lack of information on local conditions and interaction mechanisms will result in the wrong choices being made. On the other hand, national government has, with its top sector policy, taken on the responsibility of producing a coherent agenda across the full breadth of government policy. This government policy plays a role at national level between the various departments, as well as between the various national and decentralised government agencies. In the case that the top sectors are strongly linked to a specific region, the success of top sector policy will be highly dependent on those regions. In this case, top sector policy is inextricably linked to the region. Some top sectors are very specifically linked to one or several regions, as far as the concentration of lots of business locations combined with the number of jobs and regional specialisation are concerned. Examples are the creative industry (Groot-Amsterdam), Life Sciences & Health (Agglomeratie Leiden), Horticulture & Propagation Materials (Westland and Agglomeratie Leiden), Logistics (Groot-Rijnmond), Energy (Groot-Rijnmond) and, to a lesser extent, the High-tech – Brain Port activities (Eindhoven region). In these cases, regional policy is a logical component of a coherent national policy agenda. National government does however have another important role to play as far as top sector policy is concerned – in the supra-regional view that is required to improve the competitive position of many of the top sectors. The regions do not usually look very far across their borders when drawing up policy, and it is more likely that their ‘outlook’ ends at the administrative borders of their region than that they tailor their policy activities to the larger context in which they operate – exceptions excluded. The spatial distribution patterns (see Appendix 2) indicate that policy should focus on the supra-regional strength of the top sectors. However, as these distribution patterns do not always correspond with the administrative limits of municipalities or provinces, clusters of top sectors go beyond the level of the local and regional decision-making power of policymakers.
The analysis also shows that the top sectors are rarely linked to a single region. For example, the high tech industry is often linked to the Eindhoven Brain Port, while it is also highly concentrated in parts of Zuid-Holland. The service-related high tech activities, on the other hand, are strongly linked to Groot-Amsterdam and Utrecht. This means that there is potentially great synergy between these spatially separated clusters – synergy that can only be made use of by taking a supra-regional approach. It is also possible to ask why the Eindhoven Brain Port focuses so strongly on the Eindhoven-Leuven-Aachen triangle when there are many similar companies elsewhere in the Netherlands.
What is possibly more important is the fact that the Dutch regions can only compete nationally and internationally if they are able to provide the top sector companies with an excellent business environment. Examples of such an environment are a good physical infrastructure and knowledge infrastructure and all kinds of aspects relating to quality of life. However, other features of the regional economic structure also play a role, such as
18 the presence of clusters in the area, the labour market (human capital) and urbanisation (agglomeration force) features. Very often, the aspects that produce an internationally-competitive business environment are available in varying quantities in a region. The question then arises whether it is wise for a region to invest in those qualities that it is lacking, or whether it would be better to ‘borrow’ these qualities from other regions. For example, compared with the major competitors of top sector companies, Dutch regions are relatively small and less urbanised. As a result, Dutch regions lack agglomeration force (see Raspe et al., 2012; Thissen et al., 2011). Regions could focus policy on increasing mass and density, but they could also borrow some of the required agglomeration force from nearby regions using the ‘borrowed size’ concept, or from major agglomerations elsewhere through good links (possibly international). Other qualities that are lacking in a particular region could also be ‘compensated’ through good partnerships with other regions (‘borrowed qualities’). For example, the high tech cluster in the Eindhoven Brain Port could compensate for its average public knowledge
infrastructure score through good partnerships with those Dutch regions that are strong in this area, such as Noord-Holland and Zuid-Holland. Recent research carried out by PBL (Raspe et al., 2012b) showed that although many of the competitors of Noord-Brabant do less well in private R&D, they score well in public R&D, examples being Oxford, Paris, Cologne and Rhône-Alpes. However, compared to regions with a very strong private knowledge infrastructure, such as Munich or Tuebingen, Noord-Brabant does not do that well in public R&D either. There are plenty of examples of features for which excellent links could compensate for local ‘weaknesses’.18
19
6 Conclusion and discussion
There is certainly a rationale behind spatial economic government policy, as identified in the previous section. Therefore, the national government could link its spatial economic vision more strongly to the top sector policy than it currently does. After all, both ‘borrowed size’ and ‘borrowed qualities’ require a national vision on the competitive position of Dutch regions. Certainly if national government is responsible for this
competitive position, and if the regions are important to the success of economic policy, it would be illogical to make the regions solely responsible for regional economic policy. However, as the success of top sector policy is partly determined by the region, it would make sense for national government and the region to act together. Which roles are to be taken by each party will vary as the regional situation differs for each top sector; this is beyond the scope of this memorandum. One issue that reinforces this rationale is international competition, in which many companies in the top sectors attempt to take part. PBL studies into the competitive position of the top sectors indicate that the
elements required for an internationally-competitive business environment in the regions are not consistent within the Netherlands, and that Dutch regions are particularly lacking in agglomeration force. Furthermore, many Dutch clusters are relatively small compared with the most competitive regions elsewhere in Europe. There is no region where both public and private knowledge infrastructures are well-developed, and international connectivity is important to almost all the top sectors, even in regions situated relatively far away from Schiphol airport.
These are a few examples that lead to the conclusion that top sector policy would certainly benefit from a spatial economic vision at the national level: a vision based on powerful agglomerations and the crucial links between them to utilise the synergy that exists between the regions. Only then will the whole (Dutch competitive power) be greater than the sum of its parts (the regions). It is national government that can make this happen. Our conclusion, therefore, is that national government could form a more prominent spatial economic vision regarding the top sectors. This conclusion leads to a number of important discussion points.
A national spatial economic strategy should take into consideration medium-sized, small and new companies
The top sectors consist of large, medium-sized and small companies, as shown in the maps in Appendix 2. Clusters may be made up of a concentration of small companies, or a large company surrounded by small companies. We note here that large companies, in particular multinationals, are generally perfectly capable of building up their own regional and international networks. Large companies are also better equipped to invest in
knowledge, for example, as they have more resources and greater capacity. Large companies also find it easier to maintain good relationships with the ministries and politicians in The Hague, and therefore also find it easier to apply for subsidies, for example.
At the same time, it is mainly the small and medium-sized enterprises and new and young companies that benefit most from good local and regional conditions. These are the companies that benefit from a location in an agglomeration or a cluster: they are more dependent on their external networks and surroundings, even if the chance of survival in this more competitive environment is lower. It is therefore the small and medium-sized companies that would particularly benefit from an ‘internationalisation shift’.
In summary, spatial economic policy that focuses on strong regions needs to take small, medium-sized and new companies into account. It is often these companies,
furthermore, that challenge the established order. This means that top sector policy must also have enough elements of ‘backing challengers’, and not just ‘picking’ or ‘backing’ winners. However, the question of what these elements consist of remains.
20 A national spatial economic strategy should contain elements of resilience In our analysis, we have looked for the regions with strong concentrations of top sector companies. After all, we wanted to discover the most powerful regions corresponding to a top sector, not the most powerful sector in a region (as the sector may be much more dominant in another region). This is the lacuna in the previously-discussed Pieken in de Delta policy. One of the results of this choice is that the Randstad and Noord-Brabant were found to be the most powerful regions for the top sectors. However, this does not alter the fact that there may also be reasons to look at those regions in which the concentration of business locations is less, but in which a relatively large number of jobs are related to a particular sector, making the sector important to the region. This often concerns one or several large companies in regions in which there are very few other significant economic sectors. This makes these regions susceptible to events that affect these companies or sectors. The departure or loss of these crucial companies could be a reason for national government to implement active policy in these regions. The focus in this case is not so much on growth potential and the international competitive position of the top sectors, but on the resilience of regions to deal with economic setbacks or crises. It is not immediately obvious what the best policy would be in such cases, as relatively little information is available regarding the regional and national impact of such setbacks and the best policy options. PBL, together with Statistics Netherlands (CBS), has
therefore begun researching the economic resilience of regions and their susceptibility to the closure of large companies, for example. Although the results of this research will not be available until the summer of 2013, it is possible to put forward the discussion point that a national spatial economic strategy must also contain elements of resilience. Again, this raises the question of what these elements should be.
More research is required into the functional links between the regions The ‘valleys’ do not always represent the primary concentration points of a top sector. What, therefore, is their purpose and role in a spatial economic vision? Given that the valleys represent primarily regional specialisations, they should be seen in relation to clusters of companies elsewhere. For example, we have seen that Food Valley
Wageningen does not just include the Ede–Wageningen or West-Gelderland region, but in fact an area that stretches across the whole of the Randstad, Noord-Brabant and
Gelderland. Given the lack of knowledge about the actual relationships between, for example, the University of Wageningen as a centre of expertise and the companies in the regions further away from Ede–Wageningen, this represents an important research question. The overly narrow geographical definition of the valleys, as well as their proliferation, does not in fact contribute to the potential of spatial clustering in the top sector companies. It would therefore make more sense to base a spatial economic vision for the top sectors on the maps of the actual distribution of business locations.
21 Notes
1 See Text Box 2 for an explanation.
2 The Dutch policy focus on regional competitive power also fits in with recent policy ideas at the
European level. Place-based development (Barca, 2009) assumes that the development of regional conditions can produce more local growth, and that this is different in each region. This is often linked to ‘smart’ specialisation: not every region can specialise in the same sectors, as the market for these sectors is limited (and the positions on the market often already defined). Smaller, non-specialised regions therefore need to focus on facilitating supply sectors and investing in networks with other regions, and should not aim to achieve more than this.
3 This is also called the ‘subsidiarity principle’, which in this case means that government decisions
should be taken at the most suitable level. In other words, the principle that a centralised or higher level of government should not do what can be done by a lower level of government.
4 See Raspe & van Oort (2007) for an overview of industrial economic and spatial economic policy
in recent decades.
5 See Ministry of Economic Affairs (2004: 17).
6 It is sometimes claimed that the shift from equity to efficiency policy is also the main difference
between regional economic and spatial economic policy. However, this claim is mainly related to the naming of policy documents, a change that took place at the same time as the shift from equity policy to efficiency policy (see Raspe & van Oort 2007: the policy document Ruimtelijk Economisch
Beleid, dynamiek in netwerken published in 1999 spoke for the first time of spatial economic policy
rather than regional economic policy). We would like to emphasise that it is the change from equity to efficiency that is relevant, rather than the name of the policy, as the two concepts are not so very different. Within national policy, both regional economic policy and spatial economic policy focus on ‘all factors that are important to the business environment in a region’. Specific areas are also sometimes mentioned, such as main ports or Brain Ports, or it sometimes applies to every region.
7 See Ministry of Economic Affairs (2011: 7).
8 See Ministry of Infrastructure and the Environment (2012: 10) and Bestuursakkoord (2011: 42).
In the light of the subsidiarity principle (note 3) this is much more about the fact that it is the ‘turn’ of the regional authorities, and whether national government needs to introduce additional policy.
9 The core philosophy of business policy is ‘demand driven’: the companies – represented in the top
teams – indicate where the main bottlenecks lie and what the government could do to help. This has contributed to ‘the region’ being regarded as being less relevant as an entity. This is also related to the fact that fewer SMEs are represented in the top teams, and that there is much less emphasis on new, young and small enterprises, while the regions and local embedding are particularly important to these companies. Large companies and multinationals are much more likely to have their own networks and are less dependent on their location for their essential networks.
10 The Bedrijfslevennota policy document by the Ministry of Economic Affairs also includes an
appendix with a vision of the ‘northern wing’ of the Netherlands (also called the Amsterdambrief), in line with the previous port vision and the vision of the Brain Port.
11 See Geerding et al. (2010) and OECD (2010).
12 The question whether a location in a cluster or agglomeration makes a company more innovative
or productive, and whether this is a region with an exceptional business dynamic (for example because there are more start-ups), is the subject of a PBL/CBS research programme. The analysis, however, is beyond the scope of this memorandum.
13 The literature dealing with clusters is extensive, and various definitions are provided. In this
memorandum and in the maps we assume a cluster index that indicates the clustering or concentration of similar types of business locations. After all, we are interested in the spatial patterns of the top sectors. These patterns do not provide information about the functional relationships between these and other companies.
14 See Markusen (1996).
15 It is certainly relevant, as far as the valleys are concerned, to investigate whether the relevant
economic activities also benefit from clustering at the international level. Based on international research, Thissen et al. (2012) concluded that the Netherlands would benefit more from policy that focuses on regional economic diversification than from policy that focuses on concentration or cluster-formation. Cluster orientation and concentration would however seem to be useful in
22
specific sectors. Thissen et al. (2012) name the high-tech manufacturing and knowledge-intensive service sector as sectors that are cluster-sensitive.
16 See for example Raspe (2012) for a further explanation of agglomeration economies.
17 See Weterings et al. (2011), Raspe et al. (2012a) and Thissen et al. (2011) for an overview and
description of these factors.
18 See Raspe et al. (2012a) for more examples and arguments regarding borrowed size and
23
References
Centraal Bureau voor de Statistiek [Statistics Netherlands] (2012a), Monitor topsectoren; Uitkomsten eerste meting, The Hague: CBS.
Centraal Bureau voor de Statistiek [Statistics Netherlands] (2012b), Monitor topsectoren; Methodebeschrijving en tabellenset, The Hague: CBS.
Barca, F. (2009), An agenda for a reformed cohesion policy. A place-based approach to meeting European Union challenges and expectations, Independent report prepared at the request of the Commissioner for regional Policy, Brussels: European Commission. Geerding, M., P. Krauss, J. Krebbekx, R van der Mark, M. Soentken & M. van der Wilt
(2010) Pieken in de Delta; evaluatie subsidieregeling, The Hague: Berenschot. Markusen, A. (1996), ‘Sticky places in slippery space: a typology of industrial districts’,
Economic Geography 72: 293–313.
Ministerie van Binnenlandse Zaken en Koninkrijksrelaties [Ministry of the Interior and Kingdom Relations] (2011), Bestuursakkoord 2011-2015: Vereniging van Nederlandse Gemeenten, Interprovinciaal Overleg, Unie van Waterschappen en Rijk, The Hague: Ministry of BZK.
Ministerie van Economische Zaken [Ministry of Economic Affairs] (2004), Pieken in de Delta, The Hague: Ministery of EZ.
Ministerie van Economische Zaken [Ministry of Economic Affairs] (2011), Naar de top; Het bedrijfslevenbeleid in actie(s), The Hague: Ministery of EZ.
Ministerie van Infrastructuur en Milieu [Ministry of Infrastructure and the Environment] (2012), Structuurvisie Infrastructuur en Ruimte; Nederland concurrerend, bereikbaar, leefbaar en veilig, The Hague: Ministery of IenM.
OECD (2010), National place-based policies in the Netherlands, Paris: OECD.
Raspe, O. (2012), ‘De economie van de stad in de mondiale concurrentie’, pp. 20-24 in Raad voor de Leefomgeving en Infrastructuur (2012), Essays Toekomst van de Stad, The Hague: RLI.
Raspe, O. & M. van den Berge (2010), De ruimtelijke structuur van de clusters van nationaal belang, The Hague: PBL Netherlands Environmental Assessment Agency. Raspe, O. & F. van Oort (2007), Ruimtelijk-economisch beleid in de kenniseconomie,
Rotterdam/The Hague: NAi Uitgevers/Ruimtelijk Planbureau.
Raspe, O., A. Weterings & F. van Oort (2010), De economische kracht van de Noordvleugel van de Randstad, The Hague: PBL Netherlands Environmental Assessment Agency.
Raspe, O., A. Weterings & M. Thissen (2012a), De internationale concurrentiepositie van de topsectoren, The Hague: PBL Netherlands Environmental Assessment Agency. Raspe, O., A. Weterings, M. Thissen & D. Diodato (2012b), De concurrentiepositie van de
topsectoren in Noord-Brabant, The Hague: PBL Netherlands Environmental Assessment Agency.
Scholl, T & T. Brenner (2011), Testing for Clustering of Industries Evidence from micro geographic data, Working papers on Innovation and Space 2011-02, Marburg: Philipps Univeristy Marburg, Department of Geography.
Sorenson, O. & P.G. Audia (2000), ‘The Social Structure of Entrepreneurial Activity: Geographic Concentration of Footwear Production in the United States, 1940–1989’, The American Journal of Sociology 106 (2): 424–462.
Thissen, M., A. Ruijs, F. van Oort & D. Diodato (2011), De concurrentiepositie van Nederlandse regio’s; regionaal-economische samenhang in Europa, The Hague: PBL Netherlands Environmental Assessment Agency.
Weterings, A., O. Raspe & M. van den Berge (2011), The European Landscape of
knowledge-intensive foreign-owned firms, The Hague: PBL Netherlands Environmental Assessment Agency.
24
Appendix 1 Measuring clusters
Two methods were used to map the spatial concentration of sectors: location quotients and a cluster index at the business location level. Both methods are explained in this appendix. The second part of the appendix provides further information about the data used to measure the top sector clusters.
Methods for measuring clusters
Location quotients are the most commonly applied method in spatial economics for measuring the spatial concentration of sectors. A location quotient is calculated using the following equation1
:
(0.0)
, ,/
/
s r r s r sVest
Vest
LQ
Vest
Vest
Where:= the number of business locations in region r and sector s = the total number of business locations in region r
= the number of business locations in sector s in the Netherlands = the total number of business locations in the Netherlands
The proportion of business locations in a region in a particular sector was compared with the proportion of business locations in the sector at the national level. If the proportion of business locations in a sector is the same at the regional level as at the national level, the location quotient is one. If the proportion is lower in the region compared with the national level, the score is less than one (under-representation). If the proportion is higher in the region, the location quotient is greater than one (over-representation). The location quotient therefore provides an indication of whether the number of business locations in a particular sector in a particular region is higher or lower than average. The location quotient can therefore be regarded as the degree of specialisation.
Although the location quotient is useful for understanding the spatial distribution of sectors, it does have two drawbacks. First of all, the location quotient is calculated at the regional level, which means that a regional division has to be chosen. The calculated values are therefore highly dependent on the chosen divisions; if the regional divisions are changed, the calculated scores will also change (the scale effect). Furthermore, use is often made of administrative zones when drawing up regional divisions, so that the question arises whether this corresponds to actual business practise (the zoning effect). Secondly, location quotients underestimate the level of sector clustering in regions that contain lots of companies in different sectors, such as large cities. Although the absolute number of business locations in a sector in these regions may be high, the location quotient will be low as lots of other activities also take place in these regions.
To compensate for these limitations, we have also used a cluster index at the business location level, in addition to the location quotient, to determine the spatial concentration of top sectors. This cluster index was developed by Scholl & Brenner (2011) and is based on the address of every business location that carries out activities related to the top sectors. The spatial dimension of the cluster depends on the spread of business locations in the sector, rather than on predetermined regional divisions. Furthermore, the
concentration is first calculated based on the spatial distribution of business locations in the sector concerned, after which it is compared with the distribution of companies in general. This also makes it possible to detect clusters in regions in which many different activities take place.
The basic idea behind the cluster index was based on earlier work by Sorenson & Audia (2000) that measured the proximity of each business location in relation to every other
, s r
Vest
rVest
sVest
Vest25 location in a sector. Sorenson & Audia (2000) calculated the sum of the reciprocal of the distances
D
i between a business location and every other location in the same sector:(0.0) 1 , 1,
1
( (
))
1
J i i j j j iD
f d
J
1 ,( (
f d
i j))
represents every possible function, whereby the reciprocal of the distance between two points is calculated so that the distance between points that are closer to each other weighs more heavily than larger distances1. Scholl & Brenner (2011) showedthat the simple hyperbolic function 1 ,
(
d
i j)
is the most suitable for an index to measure sector clustering.
We therefore also used this function.
Because the sum of the right-hand side of the equation (1.2) increases with the number of observations J, an average is calculated so that the values for
D
i can be compared between sectors.
The term
1
1
J
means that the index is independent of the number of business locationsin a sector.
The method for calculating
D
i is shown further based on the example in Figure B1.1.Figure B1.1
For business location B in this example, the average inversed distance
D
i is:(0.0)
1
1
1
1
0.052
1
3
10
km
25
km
60.5
km
km
The higher the value of
D
i for a business location, the more other locations there are belonging to the same sector in the vicinity. Comparing the four business locations in the example in Figure B1.1,D
i is highest for location A (0.055), followed by B and C, and location D has the lowest score (0.02).
1
Scholl and Brenner (2011) used the orthodromic distance – the distance between two points is corrected for the curvature of the Earth. This correction is not made here as it has little effect on the distances within the Netherlands.