Netherlands Environmental Assessment Agency, July 2009
Policy Studies
Long term climate goals call for immediate investment in new transporttechnology
To meet long-term climate targets, developed countries should reduce greenhouse gas emission with 65 to 95% compared to 2000 levels. If the transport sector should match these reductions three crucial condi-tions need to be fulfilled: (1) substantial changes in travel behaviour, travel demand and public acceptance, (2) availability of zero-carbon or low-carbon fuels, (3) availability of advanced vehicle technology. The measures that are currently available for the period until 2020 do not have sufficient potential to meet the long-term climate targets. To meet the goals, there is a need for parallel investments in ‘new’ technologies (electricity, hydrogen) which, in the future, could be decarbonised to a large extent. Since these new tech-nologies have long lead and implementation times, a policy strategy should be developed today, which ensures that experience is gained and cost reductions are induced. A similar conclusion can be drawn for the Dutch climate policy programme Schoon en Zuinig: Most transport measures in the Dutch policy programme that contribute substantially to the emission reduction target for 2020 create little incentive for the development of vehi-cle technology and low-carbon fuels, which are needed in the long term.
CO
2
emission
reduction
in transport
Confronting
medium-term and
long-term options
CO2 emission reduction in transport
Confronting medium-term and
long-term options for achieving climate
targets in the Netherlands
A. Hoen (PBL), K. Geurs (PBL),
H. de Wilde (ECN), C. Hanschke (ECN), M. Uyterlinde (ECN)
This report is registered at the Energy research Centre of the Netherlands under report number ECN-B--09-015
CO2 emission reduction in transport
© Netherlands Environmental Assessment Agency (PBL), July 2009 PBL publication number 500076009
Corresponding Author: A. Hoen; Anco.Hoen@pbl.nl
This report was jointly written by the Netherlands Environmental Assessment Agency (PBL) and the Energy research Centre of the Netherlands (ECN). ECN - report number ECN-B--09-015 Parts of this publication may be reproduced, providing the source is stated, in the form:
Netherlands Environmental Assessment Agency: Title of the report, year of publication.
This publication can be downloaded from our website: www.pbl.nl/en or from the ECN website http://www.ecn.nl/publications/. A hard copy may be ordered from: reports@pbl.nl, citing the PBL publication number.
The Netherlands Environmental Assessment Agency (PBL) is the national institute for strategic policy analysis in the field of environment, nature and spatial planning. We contribute to improving the quality of political and administrative decision-making by conducting outlook studies, analyses and evaluations in which an integrated approach is considered paramount. Policy relevance is the prime concern in all our studies. We conduct solicited and unsolicited research that is both independent and always scientifically sound.
Office Bilthoven PO Box 303 3720 AH Bilthoven The Netherlands Telephone: +31 (0) 30 274 274 5 Fax: +31 (0) 30 274 44 79 Office The Hague PO Box 30314 2500 GH The Hague The Netherlands Telephone: +31 (0) 70 328 8700 Fax: +31 (0) 70 328 8799 E-mail: info@pbl.nl Website: www.pbl.nl/en
Abstract 5
Long term climate goals call for immediate investment in new transport technology
To meet long-term climate targets, developed countries should reduce greenhouse gas emissions with 65 to 95% compared to 2000 levels. If the transport sector should match these reductions three crucial conditions need to be fulfilled: (1) substantial changes in travel behaviour, travel demand and public acceptance, (2) availability of zero-carbon or low-carbon fuels, (3) availability of advanced vehicle technology. The measures that are currently available for the period until 2020 do not have sufficient potential to meet the long-term climate targets. To meet these goals, there is a need for paral-lel investments in ‘new’ technologies (electricity, hydrogen) which, in the future, could be decarbonised to a large extent. Since these new technologies have long lead and implemen-tation times, a policy strategy should be developed today, which ensures that experience is gained and cost reductions are induced. A similar conclusion can be drawn for the Dutch climate policy programme Schoon en Zuinig: Most transport measures in the Dutch policy programme that contribute substantially to the emission reduction target for 2020 create little incentive for the development of vehicle technology and low-carbon fuels, which are needed in the long term.
Keywords: transport, CO2, climate, options
Contents 7
Contents
Abstract 5 Summary 9 Main conclusions 9 Purpose of the report 111 Introduction
13
2 Transport and climate change: trends and uncertainties
15
2.1 Trends in CO2 emissions in the Netherlands 15 2.2 Future emissions from transport 15
2.3 Oil price 17 2.4 Policy targets 19 2.5 Concluding remarks 20
3 The long term (2050)
23
3.1 Contribution from transport to long-term climate targets 23 3.2 Passenger cars and light-duty vehicles 24
3.3 Heavy-duty road vehicles 28 3.4 Aviation 29
3.5 Other transport modes 29 3.6 Trading schemes 30
3.7 Summary of options for 2050 31
4 The medium term: 2020
33 4.1 Fuel efficiency 33 4.2 Vehicle efficiency 35 4.3 Driving efficiency 36 4.4 Distance travelled 37
4.5 Qualitative assessment of options for 2020 37
5 Barriers for successful climate policy in transport
41
5.1 The European context 41
5.2 Life-cycle analysis and carbon leakage 42 5.3 Inelastic transport demand 42
5.4 Slow vehicle stock replacement 44 5.5 Welfare costs and indirect effects 44 5.6 Real world versus testing 45
6 Main conclusions and discussion
47
6.1 Main conclusions 47
6.2 Topics for further discussion 48
References 50 Colophon 53
Summary 9 To meet long-term climate targets, developed countries
should reduce greenhouse gas emission with 65 to 95% com-pared to 2000 levels. The European Commission and some individual Member States, including the Netherlands, have set intermediate climate targets for 2020 in an attempt to bring long-term targets closer.
The main question of this report is whether current Dutch climate targets for the transport sector, and the measures currently (considered to be) implemented to reach 2020 targets will indeed help to bring long-term targets within reach.
To asses this, a review was carried out of the emission reduc-tion potential in the transport sector, by the year 2050. First, the crucial conditions for reaching a (near) zero CO2 emission transport sector were identified. Next, the transport meas-ures as adopted by the Dutch Government to reach certain targets by 2020 were subjected to a qualitative assessment, to identify whether current transport measures provide synergy between medium-term and long-term targets. The criteria used were effectiveness, cost-effectiveness, flexibility, technological innovation, secondary benefits, and sustainabil-ity issues.
This report has based its analysis on the assumption that the transport sector should reduce its emissions with 65 to 95%1
compared to 2000, the same as in other sectors. The ques-tion of whether equal burden sharing over sectors is the most efficient strategy for achieving long-term climate targets, is not answered in this report. The report does elaborate on various cost calculation methods that can result in very differ-ent targets for differdiffer-ent sectors.
The report considers the transport sector as a whole. It should be noted, however, that most information presented here focuses on road transport and light-duty transport (pas-senger cars) in particular.
1 The global CO2 reduction targets for 2050, required to keep the
temperature increase below two degrees as advised by Stern (2006) and IPCC(2008), respectively, results in emission reductions of 65 -95% for the transport sector; taking into account the expected doubling in transport volume (King 2007), and assuming an equal share of emission reductions over all sectors.
Main conclusions
Long term (2050)
The transport sector, like other sectors, faces the major
challenge of meeting long-term targets for reducing emis-sions by 65 to 95%, compared to 2000 levels, especially since the transport volume is expected to double between 2000 and 2050.
Further incremental improvements of conventional Inter-
nal Combustion Engine (ICE) technologies could result in maximum efficiency gains of about 50%, and could only lead to a stabilisation of transport emissions. This makes clear that a long-term emission reduction target of 65 to 95% cannot be achieved merely by improving conventional technology. Reaching the long term target with a substan-tial share of conventional technology would thus require a substantial reduction of transport volume.
However, several options are available to decarbonise
transport to a large extent. There are three crucial condi-tions for achieving CO2 reduccondi-tions of 65 to 95% in the transport sector:
Substantial changes in travel behaviour, travel demand 1.
and public acceptance;
Availability of zero-carbon or low-carbon fuels; 2.
Availability of advanced vehicle technology. 3.
The first criterion is difficult to control, but nonetheless
crucial for the success of climate policy. Much attention in the debate on mitigation of climate change in the trans-port sector is given to the technical potential of future technology. The way this potential could be realised highly depends on public acceptance and the willingness of people to alter their mobility behaviour.
The long-term emission reduction potential for the Nether-
lands also highly depends on successful international coop-eration and agreement, and on the resulting effectiveness of European climate policies, as these will be essential for the introduction of advanced vehicle technologies and low-carbon fuels.
For passenger car transport, both electricity and hydrogen
in combination with Battery Electric Vehicles (BEVs) and Fuel Cell Electric Vehicles (FCEVs) have the potential for achieving a long-term CO2 reduction target in the range of 65 to 95%. Only when combinations of low-carbon energy carriers and advanced vehicle technology become avail-able at a large scale, this target could be met. Therefore, policymakers should adopt an integrated approach for the energy and transport sectors, aimed at facilitating
a smooth transition towards the production of both advanced vehicles and a low-carbon energy carrier. Both the electricity and hydrogen pathway for passenger
car transport are characterised by long development and implementation trajectories. No ‘winning’ technology can be identified with certainty at this time, although the classic chicken-and-egg problem associated with the avail-ability of the fuel infrastructure seems much more promi-nent for the hydrogen route. Decarbonisation of both technologies relies heavily on Carbon Capture and Storage (CCS) and/or massive implementation of renewable energy sources, especially wind.
The large-scale utilisation of electricity and hydrogen in
transport could be complemented by second generation biofuels, applied in vehicles with advanced internal com-bustion engines. The total amount of biofuels available will be limited, however. For this reason, biofuels should pref-erably be applied in subsectors or niches where they could not be (easily) substituted with electricity or hydrogen; for example, in long-haul trucking and shipping.
The technical potential for emission reduction in road
freight transport, aviation and shipping, is smaller than in passenger car transport. To achieve emission reductions of 65 to 95%, these transport modes depend stronger on biofuels and changes in mobility demand and behaviour (improved logistics in freight transport and reduced air travel). Relatively little information is available for these modes and additional research is recommended.
Short term (2020)
There is limited additional technical potential, on top of the
measures proposed in the Dutch policy programme Schoon en Zuinig, to reduce transport emissions. This is partly explained by the fact that replacing vehicle stocks takes time, thereby limiting the pace at which clean technologies can penetrate the vehicle fleet. Furthermore, it is observed that the additional reduction potential relates to mobility behaviour or vehicle choice, imposing additional barriers with respect to public and political acceptance.
About 70% of the Dutch 2020 CO
2 reduction target for
transport requires measures that depend on successful international cooperation and agreement (e.g. sustain-ability criteria for biofuels, and CO2 emission limits for vehi-cles). Meeting Dutch targets for 2020, thus, highly depends on the success of European climate policy. This stresses the need for a strong presence and substantive contribu-tions by Dutch policymakers in Brussels.
The Dutch Government considers a 10 to 20% share of
biofuels by 2020. If supported by policies to assure sustain-ability criteria, the Netherlands could obtain the 10 to 20% share by imports and national production. However, with a global view, it is questionable whether a short term high share of biofuels in transport is attainable under sustain-ability criteria currently considered. In addition, adopting large shares of biofuels before 2020 may hold the risk of lock-in, particularly for biodiesel, where the production process greatly differs between first and second genera-tion fuels. Advanced biofuels will not enter the market in large quantities before 2020. These fuels have a better potential for reducing CO2 emissions and meeting sustaina-bility criteria. The long-term robustness of CNG can also be
questioned in light of the limited climate benefits, unless CNG is gradually replaced by green gas.
Synergy 2020 and 2050 policies
To achieve the challenging long-term climate targets for
transport, very different measures are needed in addition to those currently included in the Dutch policy programme. The reason for this is that most measures that contribute substantially to the emission reduction target for 2020 create little incentive for the development of vehicle technology and low-carbon fuels, which are needed in the long term. For this purpose, an innovation programme is included in the policy programme, investigating the possibilities for sustainable transport and alternative fuels beyond 2020. This report recommends that additional research is carried out to analyse the effectiveness of the Dutch innovation strategy. This effectiveness is crucial for the success of long-term mitigation strategies.
Given the ambitious emission reduction targets, and the
limited potential of short-term measures, it is clear that these measures should be complemented by parallel investments in ‘new’ technologies (electricity, hydrogen) which, in the future, could be decarbonised to a large extent. Since these new technologies have long lead and implementation times, a policy strategy should be devel-oped today, which ensures that experience is gained and cost reductions are induced. This strategy should allow for these new technologies to reach their full implementation in time. At a limited total budget, overinvestment in incre-mental improvement of conventional technologies may hinder investments in, and success of long-term, essential alternatives.
CO
2 emission legislation for passenger cars and vans is a measure that does create a certain synergy with long-term targets. The synergy may come from increased shares of hybrids and plug-in hybrid vehicles, which require similar battery technology as future Battery Electric Vehicles. Nevertheless, it is important to consider the inclusion of stronger incentives for the development of more disrup-tive innovadisrup-tive clean technologies, which are essential for reaching the ambitious, long-term targets.
Reduction in transport demand (through, for example,
road pricing and mobility management) is robust and no-regret, since it contributes to both the short-term and the long-term climate targets. Over the last decades, however, transport demand has been closely linked to economic and demographic growth, and the success of policies that aim to reduce mobility has not been equivocal.
Some technical measures that can be applied in current
vehicle technology, as well as future vehicle technologies, are also robust or no-regret. Examples are energy efficient tyres, weight reduction, aerodynamics, tyre pressure indi-cators, and energy-efficient air conditioners.
Purpose of the report
This report is meant to contribute to the debate between poli-cymakers and research groups on the steps that need to be taken to meet long-term climate targets. This reports shows that the current focus on intermediate targets for the year 2020 needs to be extended to include the long-term targets.
Summary 11 Although measures taken for the period up to 2020 may bring
long-term emission targets closer, there may be trade-offs when measures which are implemented now will prove to be insufficient to meet long-term targets. Although these trade-offs are difficult to determine, it is important to address them, since ignoring them could hinder a smooth transition to low-carbon energy consumption.
A confrontation of medium and long term options to meet climate goals can also be found in the report ‘Schoon en Zuinig in breder perspectief’ (Clean and Efficient in a broader per-spective) (PBL, 2009). That report focuses on the Netherlands as a whole, including all sectors, whereas this report gives a more in depth analysis for the transport sector.
Introduction 13 Transport is an integral part of today’s society. It is important,
as it fills the basic need of going from one location to another. This need is shared by passenger and freight transport. As economies continue to grow, the demand for transportation tends to increase correspondingly. Private car ownership gives a freedom of movement which is highly valued. As the world economy grows, trade increases, and more and more goods are being moved. Reduced mobility impedes develop-ment, while greater mobility is a catalyst for development. Therefore, mobility is a reliable indicator of development (Rodrigue et al., 2006). Apart from being of critical impor-tance in today’s society, transport is also responsible for a number of (negative) external effects, such as congestion, air pollution and carbon dioxide emission (an important green-house gas).
In recent years, the need for mitigation of climate change has been more and more acknowledged by policymakers, perhaps also instigated by the release of Al Gore’s ‘An inconvenient truth’ and the 2007 IPCC assessment reports. Europe has set ambitious targets for the short term and the long term, to reduce the anthropogenic emissions of greenhouse gasses. Several European Member States have set their own climate targets, which are even more ambitious than those set for Europe as a whole. The Netherlands is one of these countries. For the year 2020, the Netherlands has set the target of reducing greenhouse gas emissions by 30%, compared to 1990 levels. In addition, the Dutch Government also has committed itself to an energy saving tempo of 2%, per year, and a share of 20% renewable energy, by 2020. The Netherlands has also set specific targets per sector, including one for the transport sector.
In a first assessment on the attainability of the Dutch climate targets, the potential for emission reduction in the period between 2010 and 2020 was evaluated by ECN and MNP (ECN/ MNP, 2007). This study showed that if climate policy in the European Union is very successful, an emission reduction of 13 to 17 Mt CO2 equivalents, by 2020, would be attainable in the transport sector. With a less successful European policy, but a still heightened effort compared to current policy, the emis-sion reduction potential would decrease to between 9 and 14 Mt CO2 equivalents. Apart from the substantial bandwidth (9 to 17 Mt), the study stressed that it should not be interpreted as a final assessment, and that more research needed to be done, to assess the real contribution to emission reduction from the transport sector. Important uncertainties, such
as scenario assumptions, oil price developments, definition of costs, and the reduction potential of biofuels, were only partly addressed in the assessment. The policy programme Clean and Efficient has set an emission reduction target for the transport sector of 13 to 17 Mt CO2 by 2020 (VROM, 2007). Very recently an update of the assessment was carried out by ECN and PBL, based on a new emission projection and recent information on the progress of European and Dutch policy. This update concluded that the emission reduction potential of the policy programme Schoon en Zuinig is between 9 and 15 Mton in 2020 (ECN/PBL, 2009), comparable to the original evaluation.
This report is structured around three issues that give more insight into the relation between the medium-term and long-term climate targets for the Dutch transport sector. These issues are positioned around the three following questions:
1. What greenhouse gas (CO2) emission reductions are fea-sible in the long run (2050) in the transport sector? What type of measures are required to meet long-term targets? 2. Which measures for 2020 are considered by the Dutch
government for the transport sector and how effective and efficient are they?
3. How do 2020 measures relate to 2050 targets? Do the medium-term oriented measures aid (sufficiently) in meeting 2050 targets?
Question 1
Current medium-term targets (2020) are a stepping stone towards long-term targets. Cross-sector CO2 emission reduc-tions of 65 to 95%, compared to 2000 levels, are expected to be needed in the long term to mitigate global warming. Since transport volume is expected, approximately, to double in this period, an additional effort is required of this sector. This report will look at the available options for the transport sector to meet long-term climate targets. Different possible futures are considered by looking at scenarios, and the main barriers to realise these scenarios are identified.
Question 2
This report will also look at transport measures that are cur-rently being implemented or considered by the Dutch Govern-ment, to meet medium-term targets (2020). The Dutch policy programme Schoon en Zuinig contains a number of transport measures that will be subjected to a qualitative assessment. The qualitative assessment will score the measures on a number of criteria, including effectiveness, flexibility (lock-in
risk), cost effectiveness, and incentive for technological innovation.
The issue of Dutch dependence on international (European) cooperation and agreement on climate policy is included in the analysis. Co-benefits and trade-offs for other sustain-ability issues (air quality, energy security, etc.) following from climate measures in the transport sector, will also be addressed.
Question 3
The central question in this report is whether the measures currently considered and prepared by the Dutch Government to meet the 2020 climate targets either (1) help (substan-tially) to meet long-term emission reduction targets, or (2), to a certain extent, may distort meeting long-term targets. The reason for addressing this issue is that there are possi-ble trade-offs between medium-term and long-term climate targets. Significant investments in technologies that can reduce emissions by 2020, but which are nevertheless insuf-ficient for meeting long-term reduction requirements, might cause technology lock-in. Once these technologies have a substantial market share, the chances diminish for other, innovative and more effective measures (currently not avail-able) to enter the market. Lock-in entails needing a bigger effort to meet 2050 targets.
In answering these main questions, much attention was given to uncertainties associated with long-term predictions and analyses. Apart from identifying main barriers, the co-benefits of climate policy were also mapped, where possible. Cost esti-mates of (long-term) transport climate policy have not been quantified in this report. However, the cost-assessment issue was addressed, qualitatively, from the perspective of social welfare economics. CO2 abatement measures in transport may result in behavioural changes associated with welfare costs, which are difficult to quantify.
Answering, or at least addressing these questions will improve the understanding of the impact of Dutch climate targets for transport, and of the challenges for policymakers.
Transport and climate change: trends and uncertainties 15 A good way of expressing to which extent a certain sector
affects the climate system, is through the so-called radiative forcing potential. Radiative forcing or warming potential is determined by the different emission compounds that are emitted from the transport sector. Transport produces a variety of emissions, ranging from direct greenhouse gas emissions (mainly CO2) to O3, NOx, VOC and CO, which indirectly influence warming, and particulates (PM). Some of these components have a warming effect, whereas others have a cooling effect. As the lifetime of components differs, so does their impact on warming and cooling. When all these effects are taken into account, the contribution from trans-port to global warming is approximately 15% (Fuglestvedt et al., 2008). Moreover, considering that the share in total worldwide greenhouse gas emissions from transport is expected to rise to between 30 and 50%, by 2050 (whereas today it is around 20-25%), the radiative forcing is expected to increase.
The transport sector is an important contributor to green-house gasses emissions. Globally, contributions currently amount to nearly 20%, but are expected to increase to almost 30%, mainly due to the economic growth in China and India (IPCC, 2008). In Europe (EU27), transport has a share of around 22% in the total of greenhouse gas emissions (EEA, 2008). Between 1990 and 2005, the share of road transport in all transport-related CO2 emissions increased by 32% (DG TREN, 2008), to a total of 72%.
Trends in CO
2.1
2emissions in the Netherlands
The amount in greenhouse gas emissions from transport in the EU27 was approximately 990 Mt, in 2005 (EEA, 2008). The reported CO2 emissions from transport in the Netherlands, in the same year, were 40 Mt (PBL, 2008a), which in a global perspective is not substantial, but on a national level corre-sponds to 20% of total greenhouse gas emissions.The reported Dutch transport emissions of 40 Mt have an uncertainty margin of about 4%, implying that the Dutch emis-sions are likely1 to be between 38 and 42 Mt CO2 (PBL, 2008a).
Transport emissions in the Netherlands have grown by over 30%, since 1990. This does not mean that attempts to reduce CO2 emissions have been unsuccessful. Without the measures that have been implemented since 1990, CO2 emissions would likely have been higher. According to Van Dril and Elzenga (2005), if it was not for the measures formulated in the Neth-erlands’ Climate Policy Implementation Plan (VROM, 1999), by 2010, the emissions from transport would be 1.0 to 1.4 Mt CO2 higher.
Future emissions from transport
2.2
To be able to say anything about the potential emission reduc-tions within the transport sector, it is necessary to estimate future emissions. A common approach for policy evaluation purposes is to construct emission scenarios based on current legislation. Such scenarios are often referred to as projections which provide the basis against which the effects of addi-tional measures are offset.
In 2006, the study Welfare, Prosperity and Quality of the Living Environment (WLO) was completed (CPB/MNP/RPB, 2006). The study assessed the long-term effects of the current policy, given the international economic and demographic context of the Netherlands. By exploring how land use and various aspects of the living environment might develop in the long run (2040), the study showed when policy objectives might come under pressure, and which new issues might emerge. Four scenarios were constructed, varying around two key uncertainties: (1) the extent to which countries are prepared to cooperate, and (2) the reform of the public sector. This is illustrated in Figure 2.1.
1 ‘Likely’ is an IPCC term which means that the probability that green-house gas emissions of transport are between 38 and 42 Mton greater than 66%.
Transport and climate
change: trends and
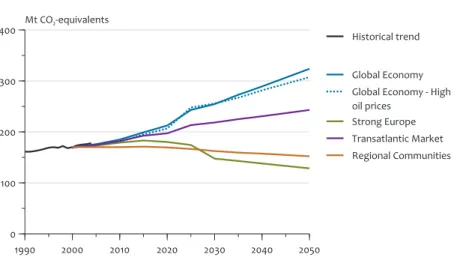
Differences in assumptions on economic growth, demo-graphic growth and the reform of the public sector also impact greenhouse gas emissions, as is shown in Figure 2.22.
Most apparent is the substantial difference between the pro-jected emissions in Global Economy (GE) and Strong Europe (SE). Emissions roughly vary between 125 and 325 Mt. The key uncertainties around which the WLO scenarios were constructed also impact developments within the transport sector. Larger demographic growth, for example, will lead to a larger growth in mobility. And larger economic growth will lead to higher incomes and to people buying larger cars that emit more CO2. Also, economic growth will increase trade in transported goods which also increases emissions. Figure 2.3 shows how the differences in the four WLO scenarios resulted in different CO2 emission projections for the transport sector.
2 The year furthest into the future, in the WLO scenarios, is 2040. For the purpose of this study, the emissions in 2050 have been calculated based on a linear extrapolation between 2030 and 2040
It is clear that the emission dispersal in the WLO scenarios is also significant for the transport sector.
Before looking in some more detail at the emission trends for the transport sector according to the WLO scenarios, it is important to note that the SE and RC scenarios are not strictly based on the then current legislation. In SE, fairly ambitious climate policy for the energy and transport sectors was assumed, after 2020, which makes this scenario rather unsuitable for business-as-usual analyses. In both SE and RC, additional emission legislation, limiting NOx and particulate matter emissions from road vehicles, was assumed. These measures, however, do not significantly influence emissions of greenhouse gasses from the transport sector.
For the transport sector, the additional policy in the SE scenario is a gradual lowering of CO2 emissions from pas-senger cars, per kilometre, to a level of 120 g/km (the level is currently around 160 g/km). The EC has recently implemented legislation requiring new passenger cars to have a CO2 emis-sion limit of up to 130 g/km as of 2015, with an agreement to
Orientation of the four WLO scenarios in relation to international cooperation and public-sector involvement.
Figure 2.1 Key uncertainties of scenarios
International cooperation
Private
Responsibilities ResponsibilitiesPublic
National sovereignty
Global Economy
Transatlantic Market
Strong Europe
Regional Communities
Trend in total CO2 emissions in the Netherlands for the period from 1990 to 2050, for the four WLO scenarios.
Figure 2.2 1990 2000 2010 2020 2030 2040 2050 0 100 200 300
400 Mt CO2-equivalents Historical trend
Global Economy Global Economy - High oil prices
Strong Europe Transatlantic Market Regional Communities
Transport and climate change: trends and uncertainties 17 assure 10 g/km lower emissions via additional measures (e.g.
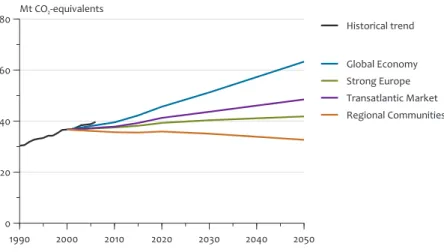
energy efficient tyres). Figure 2.3 shows that this measure is insufficient to create a downward trend as result of the fairly high mobility growth (40% between 2000 and 2020).
Figure 2.3 excludes the emissions from aviation and sea shipping. Officially, the emissions from these sources are not attributed to individual countries. Therefore, the Netherlands is not formally accountable for these emissions. It should be noted, however, that the share in global greenhouse gas emissions from these sectors are far from negligible (see textbox Aviation and Sea Shipping).
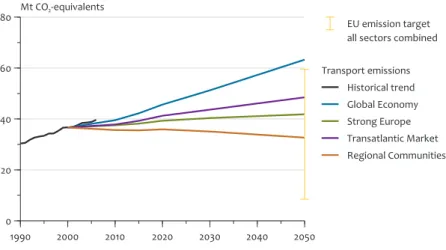
Figure 2.3 clearly shows the substantial range for expected emissions in 2020 and 2050. According to the WLO study, CO2 emissions from transport in 2050 might vary roughly between 30 and 65 Mt. This is an indication of the substantial uncer-tainty (by over a factor of 2) that is the result of differences in underlying assumptions.
Oil price
2.3
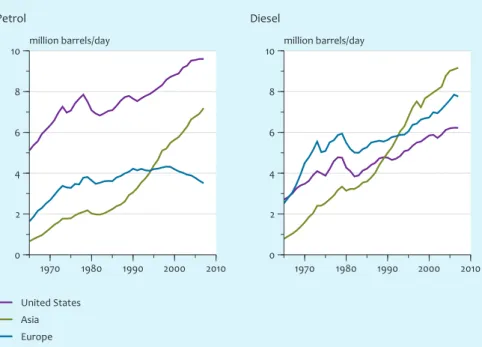
The oil price has a large impact on CO2 emissions from the transport sector, and also influences the impact of CO2 reduction policies. As oil prices increase, the price of refinery products for passenger cars and trucks (petrol, diesel, LPG) also increases. Consequently, consumers and companies have to spent more on transport and will try to reduce additional fuel expenses.
In the short term, a high oil price will result in reduced car use and in an increase in fuel-efficient driving. Consumer driving (e.g. social visits and shopping) will react much stronger than business-related driving.
Moreover a high oil price will stimulate consumers to buy more energy-efficient vehicles. This effect takes place at a medium time scale, related to the replacement rates of passenger cars. In addition, a high oil price will increase the availability of fuel-efficient vehicles, since technical measures for improving fuel efficiency will become more cost effective.
Trend in CO2 transport emissions (excluding sea shipping and aviation) for the period of 1990 to 2050, for four WLO scenarios. Figure 2.3 1990 2000 2010 2020 2030 2040 2050 0 20 40 60
80 Mt CO2-equivalents Historical trend
Global Economy Strong Europe Transatlantic Market Regional Communities
CO2 emission from transport
Currently, hardly any greenhouse gas emissions from shipping and aviation are attributed to individual countries. As a result, there have been few policy measures implemented which aim to reduce emissions from these sectors. Both sectors, nonetheless, have a substantial share in global greenhouse gas emissions. It is estimated that aviation is responsible for approximately 4% of global CO2 emissions and that this share is expected to increase to 5%, by 2020. The climate impact is estimated to be 2 to 4 times greater than from the CO2 emissions alone because at great altitude emissions result in increased radiative forcing (IPCC, 1999).
Shipping emissions are estimated to contribute 4% to global greenhouse gas emissions (IMO, 2007). The climate impact of sea shipping may increase if regulations for the treatment of exhaust emissions from ships is tightened or the sulphur content of fuel is lowered. Recently, the International Maritime Organization (IMO) has agreed on a step-wise lowering of the sulphur content of fuel for global shipping (IMO, 2008). This will result in a decrease of particle emissions, which have a cooling effect (Annema, 2007).
The European Commission currently considers including avia-tion and possibly also sea shipping in the European Emission Trading Scheme (EU-ETS).
Furthermore, a high oil price will stimulate transport compa-nies to improve the load factor of transport, for instance, by improving logistics, and by bringing about structural effects, such as a shift from delivery on demand towards a less fre-quent delivery of goods, driven by stock levels.
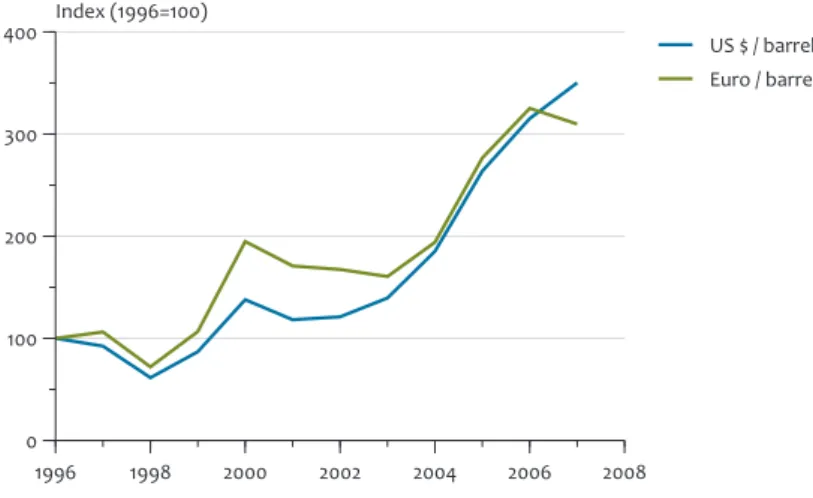
The trend in oil prices is a fundamental input for scenarios. The historical trend, from 1997 to 2003, was used for estab-lishing oil prices per WLO scenario. As Figure 2.4 shows, oil prices have increased substantially, since 2003. In two scenar-ios, the oil price was fixed on the 2003 level, up to 2040. In the other two scenarios, the oil price was increased, slightly, to between 28 and 30 $2000 per barrel. As oil prices have increased substantially, a ‘high price’ variant was also developed with a peak in the period between 2005 and 2007 of 48 $2000 per barrel, decreasing to 38 $2000 per barrel in 2010, and ending at 45 $2000 per barrel in 2040.
After the oil price peaked to over 150 $/barrel, it dropped to 120 $/barrel by late July of 2008, and, by the end of 2008, the price had dropped to levels below 50 $/barrel. This makes clear that oil prices are very volatile and its future develop-ment is unclear. Since the costs of new oil projects are in the range of 60 to 70 $/barrel (Fugro, 2008), oil prices are not expected to go much below 40 $/barrel, structurally. An oil price of 22.5 $2000 per barrel is in real Euro terms equiva-lent with a 38 $2007 per barrel and the high oil price variant with 48 $2000 per barrel in 2007 and comparable level in 2040, is equivalent with 82 $2007. One could argue that a large part of
the actual increase in market price, in dollars, is an effect of the weakening dollar.
Table 2.1 shows the mean relation between the crude oil price and the fuel price at fuel stations, based on an analysis of his-torical data from 2002 to 2005. The tax levels of January 2008 are used in this table (different fuel tax for petrol and diesel and a VAT of 19%; each year, fuel tax levels are corrected for inflation). The $ 40 level was applied in the GE scenario of the WLO, the $ 65 level in the GE High Prices (GE HP) variant and the $ 120 level applies to the situation of mid 2008. At the higher oil prices of 65 and 120 $/barrel, the petrol prices rise with 12% and 39%, and for diesel prices this is 18% and 62%, compared to the petrol price level at oil prices of 40 $/barrel. According to Geilenkirchen et al. (2009 in preparation), a fuel price increase of 1% will lead to a decline in passenger car fuel consumption on the long term of 0.6% to 0.8%. Assuming that fuel prices remain at least at GE HP fuel price levels, the con-sumption by passenger cars will be at least 7 to 11% lower than was calculated for the GE scenario. However, if fuel prices stay at the high level of mid 2008, consumption on the long term can be expected to be around 20% lower than in the GE scenario. Considering that the emissions from passenger cars in GE will be approximately 26 Mt CO2 in 2020, the effect of higher oil prices on emissions could be 2 to 8 Mt.
Influence of exchange rates on oil prices (yearly mean levels, real prices).
Figure 2.4 1996 1998 2000 2002 2004 2006 2008 0 100 200 300 400 Index (1996=100) US $ / barrel Euro / barrel Oil prices
Relation between oil price and transport fuel price
Oil price Petrol price Diesel price $/barrel €/barrel €/GJ €/GJ(excl. tax) €/GJ €/litre €/GJ(excl. tax) €/GJ €/litre
40 29.2 5.0 10.0 37.2 1.22 8.9 23.3 0.84
65 47.5 8.1 13.6 41.4 1.36 12.5 27.6 0.99
120 87.6 15.0 22.1 51.6 1.69 21.0 37.7 1.35
Relation between oil price and transport fuel price (at fuel stations) in the Netherlands (2007 prices)
Transport and climate change: trends and uncertainties 19
Policy targets
2.4
Climate policy targets have been set both by the European Commission and by the Dutch Government. The European targets are for the medium term (2020) and the long term (2050 and beyond). The Dutch climate targets focus on 2020. This paragraph will give an overview of European and Dutch climate targets, and, for the latter, also of the specific sector targets laid out in the Dutch Clean and Efficient policy programme. For convenience, since this report focuses on the medium to long term, it ignores the Kyoto protocol, which sets emission reduction targets for the period from 2008 to 2012.
Europe 2.4.1
Policy targets for 2020
In January 2008, the European Commission announced its Energy and Climate policy package. An important aspect of these proposals is the introduction of an EU wide cap for companies in the European Union Emission Trading Scheme (EU ETS). If the proposal is passed, individual Member States would no longer have a specific target for the sectors involved in ETS (Olivier et al., 2008). Since all European companies would trade in the reformed ETS, national govern-ments would no longer control the emission output of their country’s companies. Moreover, it would become irrelevant in which country emission reduction takes place. The ETS system with an EU wide cap would ensure (if properly monitored) a drop in EU emissions of 21% by 2020, compared to 2005. Moreover, the system would ensure that mitigation meas-ures are implemented where they are cheapest. Countries with relatively energy-efficient ETS companies, such as in the Netherlands, would invest less in mitigation measures, since it would be more economical for them to buy CO2 rights. The actual emission reduction would then occur in countries with less energy-efficient companies that could implement still relatively cheap mitigation measures.
In essence, Member States, including the Netherlands, would lose control over the emissions from the industry and energy sector. For the Netherlands, this would amount to approxi-mately 50% of national greenhouse gas emissions (Olivier et al., 2008).
In the Energy and Climate package, the European Commis-sion also sets targets for sectors outside of the ETS. The most important of these so-called non-ETS sectors are transport, households and the built environment. The targets for these sectors differ per Member State. The Netherlands would need to reduce emissions from non-ETS with 16% by 2020, compared to 2005. Assuming an equal distribution of emis-sion reduction over non-ETS sectors means that the European Commission would require the Netherlands to reduce 13 Mt in emissions from the transport sector, by 2020.
Policy targets for 2050 and beyond
In the long term, the European Commission wants to limit the atmospheric concentration of CO2 to 450 parts per million (ppm). It is expected that such concentrations would limit the global temperature increase to a maximum of 2 degrees Celsius. Stern (2006) concluded that, for industrial countries,
this would entail an emission reduction of 60 to 80%, com-pared to 1990 levels. The Bali Action Plan, signed in December 2007, also acknowledges the need for drastic emission reduc-tions, based on the Fourth Assessment Report of the IPCC (2007). This report speaks of emission reduction requirements for industrialised countries of 85 to 95% by 2050, compared to the year 2000, to ensure atmospheric CO2 concentrations of no more than 450 ppm.
Combining the targets named in Stern (2006) and IPCC (2007), translates into a long-term emission reduction target of approximately 65 to 95%, compared to the year 2000. This is the bandwidth for the long-term (2050) emission reduction requirement that is used throughout this report.
The Netherlands 2.4.2
The Netherlands also has formulated climate policy targets for the year 2020. These targets were first put down in the coalition agreement, in early 2007. The targets are threefold:
30% greenhouse gas emission reduction, compared to 1990 1.
levels;
energy saving of 2% per year, up to 2020; 2.
20% share of renewable energy. 3.
These targets are more ambitious than the European targets. In 2007, ECN and MNP (now PBL) calculated in a preliminary assessment that this would entail an emission reduction of 97 Mt (all sectors) in the Global Economy Scenario with a high oil price correction (see Section 2.3). The feasible contribution of the transport sector was 9 to 14 Mt, in the case of less suc-cessful EU policy, and 13 to 17 Mt, with sucsuc-cessful EU policy. The main difference between these so-called ‘EU low’ and ‘EU high’ policy scenarios is the assumption on CO2 emission legislation for passenger cars. In ‘EU low’ it is assumed that, by 2015, new cars and vans will have an emission factor of 130 g CO2/km and that this will remain constant from then on. In ‘EU high’, new passenger cars have an emission factor of 95 g CO2/km, by 2020.
Figure 2.5 shows the contribution from the transport sector in these two EU scenarios. In ‘EU low’, 60 to 65% (9 to 14 Mt) of the required reduction for ‘non-ETS’ sectors comes from transport. If EU policy is more successful, transport contrib-utes 65 to 70% (13 to 17 Mt) to the required reduction for ‘non-ETS’ sectors.
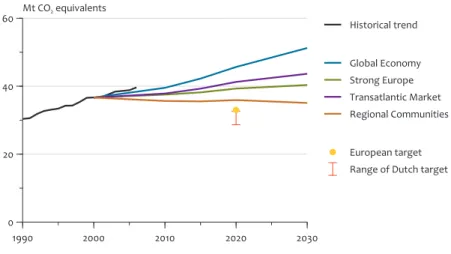
The Dutch Government set the transport target at 13 to 17 Mt by 2020. Both the Dutch and European targets for the transport sector are given in Figure 2.6. It follows that the EU target, set at -16% compared to 2005, is comparable with the lower limit of the bandwidth of the Dutch reduction target of 13 to 17 Mt.
It is clear from Figure 2.6 that in the GE scenario with high oil prices, which was used for the evaluation, a substantial effort would be required, to bring the targets within reach. The trend in GE points upwards, but should turn around to an absolute downward trend, in a matter of years. For illustrational purposes only, Figure 2.6 also contains the CO2 emissions in TM and RC. It is clear that, in these two sce-narios, the effort needed for reaching the targets would be smaller. It is, however, not entirely fair to compare the target
of 13 to 17 Mt with the projected emissions in TM and RC, since it is based on the effects of available measures in the GE scenario. This scenario has relatively high growth, accompa-nied by high emissions, therefore, the potential for emission reduction through specific measures is also relatively high. In other words, if the TM or RC scenarios had been used in the evaluation, than the reduction potential would not have been as high as 13-17 Mt. The same applies to the SE scenario, which incorporates some climate related policies that reduces the reduction potential of specific additional climate measures.
Concluding remarks
2.5
What hopefully has become apparent from this chapter is that forecasts on future emissions are inherently uncertain. Scenario assumptions, such as demographic and economic growth, oil-price developments, spatial planning, and the
willingness to cooperate on international level, determine the demand for mobility and the potential for success of public policy. In assessing the potential for CO2 reduction in the transport sector, it is essential to recognise these uncertainties and integrate them in the analyses. Moreover, it is not uncommon in ex- ante evaluations that, from a series of scenarios, ultimately only one scenario is selected. The ex-ante evaluation of the policy programme Schoon en Zuinig of the Dutch Government is an example of a single-scenario evaluation, based on the Global Economy scenario (ECN/ MNP, 2007). The reasoning behind choosing the scenario with the highest demographic and economic growth, and, consequently, also the highest environmental pressure, is that illustrates the worst-case scenario. If enough of the meas-ures from this scenario are taken ‘in reality’, this provides the highest chance for the targets to be met.
Share of transport in emission reduction required to meet Dutch and European climate targets. ‘Other’ represents the built environment, agriculture and households.
Figure 2.5
EU low policy scenario EU high policy scenario 0
10 20
30 Mt CO2 equivalents National reduction Other sectors Transport Bandwidth national policy effect
CO2 emission reduction non-ETS sectors 2020
Dutch emission target 'Schoon en Zuinig' EU emission target -20%
EU and Dutch emission reduction targets for the transport sector (excluding sea shipping and aviation) compared to ‘current legislation trends’ in CO2 emissions in GE and TM.
Figure 2.6
1990 2000 2010 2020 2030
0 20 40
60 Mt CO2 equivalents Historical trend
Global Economy Strong Europe Transatlantic Market Regional Communities European target Range of Dutch target
Transport and climate change: trends and uncertainties 21 However, it should be noted that in a scenario with high
demographic and economic growth the emission reduction potential of measures is also large. GE, for example, is a sce-nario with high economic growth and technological advance-ment. Expensive, but effective technological measures might be more successfully implemented in this scenario than in that of Regional Communities. A fair assessment of the reduc-tion potential of measures, therefore, should include calculat-ing the effects for all available scenarios. This would provide a more accurate estimate of uncertainties.
In the very recent update of the assessment ECN and PBL a different approach was adopted including a more integrated approach of the scenario uncertainties ranging from GE to RC (ECN/PBL, 2009).
Also note that the uncertainty about future developments is the reason behind having more than one scenario. The WLO scenarios provide four different, but just as likely future worlds, in which the different dilemmas can be assessed that society and policymakers could be confronted with. Choosing only one of these scenarios, could exclude relevant dilemmas from the analysis.
The Dutch Government aims to achieve the ‘non-ETS’ climate target mainly through transport measures. For this target, a set of measures was adopted, based on the assumption that EU climate policy for this sector would be successful. However, if the EU climate policy would be unsuccessful, then meeting the Dutch climate targets would be at risk and addi-tional measures would be needed at the naaddi-tional or EU level. This situation could occur when negotiations on CO2 limits for road vehicles were to be delayed or sustainability criteria for biofuels could not be agreed upon in time (see also Chapters 3 and 4).
The next two chapters will examine the ways and the meas-ures by which long-term (2050) and medium-term (2020) emission reduction targets might be achieved.
The long term (2050) 23
Contribution from transport to
3.1
long-term climate targets
Combining the estimates of Stern (2006) and IPCC (2007) results in a long-term emission reduction requirement for industrialised countries of 65 to 95%, compared to 2000 (see Section 2.4.1). One of the logical questions on how to reach these targets, would be that of how large the contribution from the transport sector should be.
The total amount of emissions allowed from all sectors combined, in 2050, with a required overall reduction of 65%, amounts to approximately 60 Mt CO2 eq. An emission reduction of 95% would allow for a total in emissions from all sectors combined of approximately 10 Mt CO2 eq. This can be compared with the emissions projected for the transport sector, for 2050, which are 35 to 65 Mt, representing the range between the scenarios Regional Communities and Global Economy. Therefore, at emission reductions of 95%, it is inevitable that the transport sector would have to contrib-ute to the mitigation of CO2 eq emissions (even more so when aviation and sea shipping would be added to these numbers). At emission reductions of 65%, however, it is theoretically pos-sible to apply all mitigation measures to non-transport sectors (see also Figure 3.1).
These numbers and Figure 3.1 both indicate that the way miti-gation measures are distributed over the sectors could have dramatic implications for the long-term policy strategy for the transport sector. With close to zero emissions from other sectors, in 2050, the transport sector could suffice with a sta-bilisation of emission at 2000 levels. Since transport emissions may double up to 2050, due to mobility growth, even stabili-sation would still require a substantial effort. As will be shown in Section 3.2, the stabilisation of emission reductions would be feasible with optimisation of conventional vehicle tech-nology. If less ambitious targets would be set for the other sectors and transport would have to contribute equally to the overall targets, conventional vehicle technologies would no longer be feasible and a transition towards new advanced technologies, such as electric vehicles or fuel cell vehicles, would be a necessity for maintaining current mobility needs. One of the criteria for burden sharing between sectors for achieving emission targets is the cost-effectiveness of meas-ures. Achieving targets at the lowest costs (to society) may be viewed as a sound principle. Chapter 5 will show, however, that different cost calculation methods can result in very dif-ferent outcomes, and most likely also in a difdif-ferent distribu-tion of sector targets. If governments want to reach climate targets at the lowest cost possible they would need to know
The long term (2050)
3
Emission projection for including transport (excluding aviation and sea shipping) in the Netherlands and emission reduction targets for all sectors combined in 2050.
Figure 3.1 1990 2000 2010 2020 2030 2040 2050 0 20 40 60 80 Mt CO2-equivalents Transport emissions Historical trend Global Economy Strong Europe Transatlantic Market Regional Communities EU emission target all sectors combined
the marginal cost curve, including welfare costs, of all avail-able measures in all sectors.
Finding the marginal cost curve of CO2 mitigation measures for all sectors is widely beyond the scope of this report. From this point on, we have assumed that the transport sector and other sectors have to contribute 65 to 95%, compared to 2000 levels.
The options for achieving long-term emission reductions of 65 to 95% in the transport sector are described in the follow-ing sections. A rough back-castfollow-ing approach was chosen, meaning that barriers have been identified in the different pathways to long-term emission reductions.
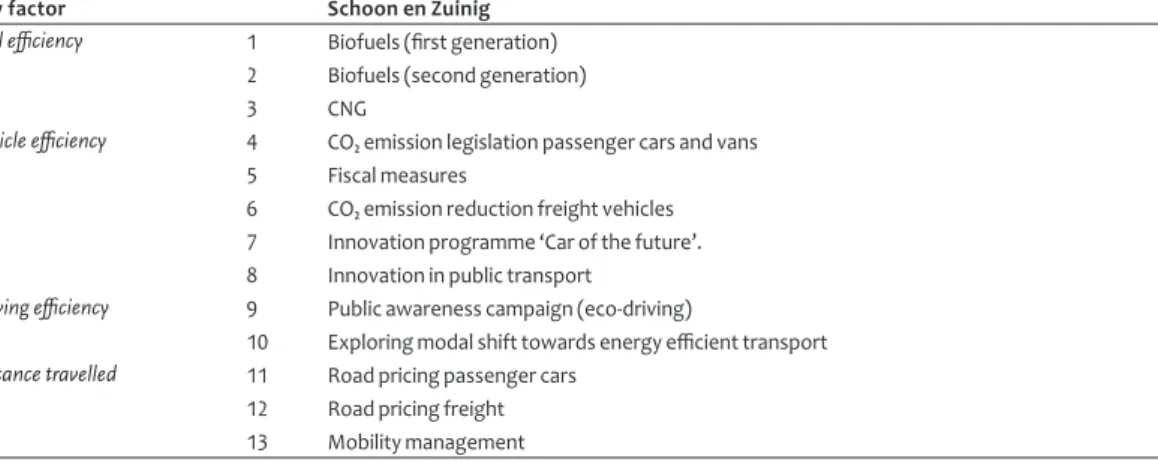
The options, or pathways, considered can be split into four categories (King, 2007):
Fuel CO
2 efficiency, referring to the amount of CO2 associ-ated with each unit of energy stored in the fuel. All CO2 emitted during the life cycle of the fuel should be included, namely (1) extraction or farming of the primary energy sources, (2) transport to fuel production and processing plants, (3) conversion of energy sources into road fuel, (4) fuel distribution to filling stations, (5) fuel use in vehicles (exhaust emissions).
Vehicle efficiency, referring to how efficiently a vehicle
engine converts the fuel into energy for propulsion. Engine efficiency, aerodynamics and weight are important factors determining vehicle efficiency.
Driving efficiency, referring to how efficiently a driver uses
the car over a given distance. Avoiding rush hours, limiting transported weight, reducing the maximum speed and smoother driving will all increase driving efficiency. Distance travelled, since every kilometre travelled requires
energy, reducing the amount of kilometres will limit energy consumption and, therefore, CO2 emissions.
Passenger cars and light-duty vehicles
3.2
Fuel efficiency and vehicle efficiency 3.2.1
When reviewing long-term climate targets and emission reduction of up to 95%, the discussion on fuels becomes very prominent. New fuel types play a crucial role in bringing long-term targets within reach. These should be very low-carbon or zero-carbon fuels, meaning that well-to-tank CO2 emissions are very limited. Thus, a substantial part of the climate mitiga-tion challenge is shifted towards the energy producmitiga-tion and refinery sectors.
Electricity cannot be used in conventional Internal Combus-tion Engine Vehicles (ICEVs). High bioethanol blends require modifications to conventional cars. Battery electric vehicles (BEVs) or fuel-cell electric vehicles (FCEVs) will have to enter the market in substantial amounts, to ensure that emission reductions of 65 to 95% are realised.
Since fuel CO2 efficiency and vehicle efficiency are closely intertwined, in this report they are both considered together. A few scenarios (combinations of vehicle types and fuel types) for the long term will be discussed. These are:
BEVs in combination with electricity from (1) fossil fuel with
carbon capture and storage (CCS) and (2) biomass, solar, wind, hydro, nuclear and others;
FCEVs in combination with hydrogen from (1) fossil fuel
with CCS and (2) biomass, solar, wind, hydro, nuclear and others;
ICEVs hybrids in combination with advanced biofuels;
It should be made clear that these scenarios do not cover the complete range of options available for 2050 and beyond. They are used here to illustrate which important barriers may be encountered, and what the range in reduction potential roughly is.
BEVs in combination with low-carbon electricity Battery electric vehicles
Cars with electric engines on board can be divided into hybrids, plug-in hybrids, and all-electric vehicles. Only the last two categories store energy from the national electricity grid in on-board batteries. Depending on the size of the batteries and the use of the car, plug-in hybrids are able to drive 40 to 50% of the time powered by electricity (Passier et al., 2008). When their battery is depleted, they can switch to power generated by their on-board internal combustion engine, thereby offering a much larger driving range than all-electric vehicles. However, plug-in hybrids are inevitably more expen-sive, due to the additional internal combustion engine. Batteries are the crucial technology for electric vehicles. Bat-teries for electric vehicles need to (1) have an acceptable price and lifetime, (2) be sufficiently small per kWh (high energy density) and physically manageable, and (3) be safe (Passier et al., 2008).
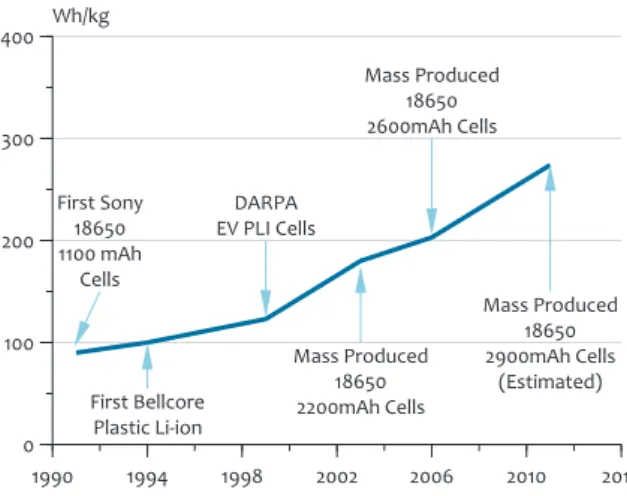
Currently, battery prices range from 10,000 - 15,000 euros, with a battery capacity of 20 to 30 kWh. Depending on the vehicle size and weight, the driving radius is limited to about 150 to 300 kilometres (BERR, 2008; Nagelhout et al., 2009). However, there is a realistic perspective that battery prices will go down at sometime in the not too distant future and that the energy density will increase especially when mass production starts (BERR, 2008). Battery research for other purposes (laptops, mobile phones) has contributed to the improvement of batteries, and this development is expected to continue in the future (see Figure 3.2). Batteries with a capacity suitable for electric cars (Li-Ion) are currently mass-produced by two suppliers, AESC (joint venture of NEC and Nissan) in Japan, and A123, an American company producing in East Asia. These type of batteries charge slowly (e.g. over-night). Batteries that can be charged faster, in combination with a long lifespan, are not expected to become available within the next three years (BERR, 2008).
Batteries in hybrids are usually operated within a narrow segment of the charge-discharge curve, to optimise energy efficiency and battery life. In contrast, plug-in hybrids and all-electric vehicles require batteries that can be discharged as deep as possible, to increase the driving radius. For compara-ble driving distances with ICEVs, the amount of power per kg should be around 400 Wh/kg.
The long term (2050) 25 Furthermore, analysis in (Kroon, 2008) indicates that the
desired increased production levels of batteries should not present fundamental problems, given the global availability of lithium, and the current and expected annual production. A large-scale introduction of electric vehicles requires an expanded electricity infrastructure with public and private charging facilities. If the business case for vehicles that use electricity is profitable, this market perspective is expected to be sufficiently attractive to stimulate the required expan-sion of the infrastructure (Hanschke et al., 2009). The classical chicken-and-egg problem (availability of electric vehicles and sufficient charging locations) is not expected to create a major barrier for the successful introduction of electric vehi-cles. It should be noted, though, that other chicken-and-egg problems remain, such as the costs of batteries – which could only go down if mass production starts – will put a break on initial sales, which in turn hinders the step up towards mass production. There also might be spatial development barriers (most likely to occur in cities) that prevent the installation of charging points at particular locations. Another barrier, and there may be more, is people’s possible unwillingness to make the transition to electric vehicles, if (in the early stages) it would entail having to park at specific locations were charg-ing points are available.
Electricity
The large CO2 reduction potential of electric (or plug-in elec-tric) vehicles is related to the fact that stationary electricity production can be largely decarbonised. This decarbonisation would require electricity generated either from renewable sources or from fossil fuels with a strong penetration of carbon capture and storage (CCS). CCS, in this case, is essen-tial to prevent the emission reduction in transport to be offset by increased emissions from power generation, either within the Netherlands or abroad.
The full potential of CCS has not yet been unequivocally quan-tified. According to a recent study by Clingendael (Van den Heuvel, 2008), the CO2 storage in the Netherlands will have to rely on the availability of depleted gas fields. In a realistic
case, the Dutch subsurface could technically store approxi-mately 35 to 40 Mt/a of CO2, for a period of 40 years (equal to the typical lifespan of a power station).
An alternative route would be electricity production from renewable sources, including wind, hydro, geothermal and photo-voltaic. Nuclear electricity production can also provide a (near) zero-emission alternative. In the Netherlands, there is potential for wind, hydro and photo-voltaic energy produc-tion, but spatial planning issues create barriers for a fast growth in production. Wind at sea is a viable option, although spatial planning is an issue, since the North Sea holds valuable nature areas, and wind parks at sea might also interfere with commercial fishing and sea shipping.
Another barrier for the large-scale introduction of electric vehicles is the electricity infrastructure required. In the Neth-erlands, many people live in flats. Therefore, only about 1.5 million households would have the option of installing home charging facilities to charge their car on their own property. Consequently, many ‘charging points’ will need to be con-structed at public locations, including employment locations. Some electric-vehicle concepts rely on the installation of battery exchange stations as a solution to the limited driving radius for electric vehicles. Large-scale implementation of the electric-vehicle infrastructure will take time. Charging points (such as water and power distribution networks and telecom-munication networks) could be designated as regulated assets, typically enabling the service provider to cover instal-lation and operating costs and achieve an adequate return on investment. This could be an incentive for utility firms to install them (BERR, 2008).
Electricity in the transport sector may also result in a benefit for electric power companies. Electric vehicles could allevi-ate the mismatch in energy production and consumption (e.g. cars could be instructed from a control centre to start charging when the wind is blowing). This so-called vehicle-to-grid (V2G) technology, therefore, is potentially very attractive to electricity companies. Off-peak energy consumption can occur through overnight charging of electric vehicles. Most
Energy density of batteries, from the past to the near future (Hansen, 2008).
Figure 3.2 1990 1994 1998 2002 2006 2010 2014 0 100 200 300 400 Wh/kg
Energy density of batteries
First Sony 18650 1100 mAh Cells First Bellcore Plastic Li-ion DARPA EV PLI Cells Mass Produced 18650 2200mAh Cells Mass Produced 18650 2600mAh Cells Mass Produced 18650 2900mAh Cells (Estimated)
cars can be fully charged from a home charging point within a maximum of 8 hours for a fully depleted battery; average recharging times are expected to be between 2 and 6 hours. For the reduction of CO2 emissions through overnight V2G electricity storage in electric vehicles, it is essential that the electricity stored is low carbon. Currently, in the Netherlands, electricity which is generated at night mostly comes from coal power plants (apart from a small contribution from wind) without CCS and with high emission levels. This is because gas power plants, which can be operated more flexible, are switched off during the night when electricity demand is low. Coal power plants cannot be fully switched off and, there-fore, operate at low power during the night. Consequently, without special regulations, additional electricity demand from charging vehicle batteries at night would increase coal power based production, associated with high levels of CO2 emissions.
If the above mentioned barriers could be overcome, and if zero-carbon electricity for the transport sector could be produced in sufficient quantities, BEVs would have substan-tial potensubstan-tial for reducing CO2 emissions from passenger car transport. The combined efficiency of the energy chain of electricity transport from the production plant to the car, battery charge, discharge, on board power electronics and electric engine, would add up to about 85%.
FCEVs in combination with low-carbon hydrogen Fuel-Cell Electric Vehicles
A fuel-cell electric vehicle uses fuel cells to convert hydrogen (or other energy carriers) into electricity, which in turn is used to propel the vehicle. Currently, fuel-cell vehicles are available only in prototype and demonstration models. The main bar-riers to commercial utilisation in the long run are:
storage of hydrogen within the vehicle: safe effective on-
board storage is one of the biggest hurdles for hydrogen-powered vehicles when aiming for a driving radius of about 500 kilometres. Compressed hydrogen in tanks would take up much space inside the vehicle and provide additional weight, which reduces vehicle efficiency. Liquid storage is only possible at very low temperatures (-253 degrees Celcius) and requires a substantial amount of energy.
operating temperature: fuel cells do not operate at tem-
peratures below freezing without additional measures. This would limit the utilisation of fuel-cell vehicles in cooler regions.
costs: the cost range found in literature is quite substan-
tial. In a literature overview, Van den Brink (2003) con-cludes that additional costs for hydrogen-powered vehicles might be 20 to 30% higher than for conventional vehicle technology. The HyWays project (2007) mentions addi-tional costs of anywhere up to 1500 euros, compared to those for conventional vehicles, after mass production has started. HyWays, furthermore, states that the uncertainty in cumulative costs between positive and unfavourable circumstances for hydrogen-powered vehicles can increase by as much as by a factor of ten (HyWays, 2007).
There are alternatives to storing hydrogen on board. One of these would be a vehicle with an on-board reformer that can
convert gasoline, ethanol, and methanol into hydrogen with efficiencies of up to 77% (Bowers et al., 2006). This would require the availability of sufficient amounts of biofuels (see below). However, it should be noted that all major companies have abandoned this approach because the technology is very complicated.
Hydrogen
Hydrogen is a potentially carbon-free energy carrier. There are several ways of producing hydrogen, and the chain emissions strongly depend on the chosen feedstock and production process. Currently, production of hydrogen from Natural Gas (by Steam Methane Reforming, SMR) seems the most affordable option, and, if combined with CCS, can lead to a reduction in total emissions of about 80%. At present, the chemical industry already produces hydrogen by means of SMR. It should be noted that it is much easier to capture CO2 in the hydrogen production process than during electric power generation because the CO2 is at high partial pressure (Keith and Farrel, 2003).
In the longer run, there are alternative methods of producing hydrogen. It can be extracted from coal by gasification com-bined with CCS. Similarly, biomass gasification can be a source of hydrogen; a promising option for the future but not yet demonstrated on a large scale. Note that that use of biomass as feedstock in this process, is in competition with other biomass feedstock uses, notably co-firing in power plants for electricity production and production of second generation biofuels.
If hydrogen would be produced by electrolysis using renewa-ble energy, this would result in a zero-emission fuel (including the chain emissions) for vehicles. With the latest technology, hydrogen production from electrolysis can be achieved at a maximum efficiency of about 75%. Subsequently, hydrogen is converted back to electricity, in the vehicle, with a lower effi-ciency. Therefore, this method is rather inefficient, compared to battery-powered electric vehicle, which has electricity from the power grid stored in a battery that subsequently powers the car with an overall efficiency of 85 to 90%.
There are several options for delivering hydrogen to fuel sta-tions, including: through pipelines; by trucks in (cryogenic) liq-uefied form or under high pressure; locally by extraction from natural gas; or by means of electrolysis. Although hydrogen production is fairly simple – it is a gas with a low heating value and a low boiling point – it is inherently expensive to trans-port, store and distribute. These are strong disadvantages for a transportation fuel (Keith and Farrel, 2003).
Internal Combustion Engine Vehicles with advanced biofuels Internal Combustion Engine Vehicles
Several studies have indicated that advanced technologies can improve the efficiency of ICE vehicles by up to 50% at increasing, but still reasonable costs, compared to total vehicle costs (Passier et al, 2008). However, it is highly unli-kely that further progress in conventional car technologies, including optimisation of ICE, hybridisation, weight reduction, improvement of tyres and aerodynamics, could improve the efficiency of cars by more than 50%. If this level of reduction would be pursued rather than higher reductions of 65 to 95%,