Gothenburg Protocol
Report of the Task Force on Integrated Assessment Modelling and the
Centre for Integrated Assessment Modelling
CIAM report 1/2007
With contributions of the Coordination Centre for Effects (CCE) and the Meteorological Synthesizing Centre-West (MSC-W)
Netherlands Environmental Assessment Agency PO Box 303
3720 AH Bilthoven The Netherlands
Tel: +31 30 274 2745 Fax: +31 30 274 4433 E-mail: info@mnp.nl Web: www.mnp.nl
International Institute for Applied Systems Analysis Schlossplatz 1
Tel: +43 2236 807 342 Fax: +43 2236 71313 E-mail: publications@iiasa.ac.at
Background document to UNECE document ‘Review of the 1999 Gothenburg Protocol’, Executive Body for the Convention on Long-range Transboundary Air Pollution (2007), ECE/EB.AIR/WG.5/2007/7. This background document is prepared by the Task Force on Integrated Assessment Modelling (TFIAM) and the Centre for Integrated Assessment (CIAM).
CONTENTS
I INTRODUCTION 9
II EMISSIONS, CONCENTRATIONS AND DEPOSITION LEVELS 13 Trends in emissions 13
Modelling deposition of acidifying and eutrophying compounds 15 Modelling population exposure 16
III EFFECTS ON HUMAN HEALTH, NATURAL ECOSYSTEMS, MATERIALS AND CROPS 19
Remaining problems 21
Ecosystem damage due to acidification and eutrophication 21 Ozone damage to crops and natural vegetation 23
Health effects of air pollution 24 Materials damage 26
IV EMISSION CEILINGS OF THE PROTOCOL 27
Implementation 27
Costs 29
Evaluation 30
V EMISSION LIMIT VALUES 31
Evaluation of technical annexes 31
Uncertainties in emissions from vehicles 31 VI SYNERGIES WITH CLIMATE POLICY 33
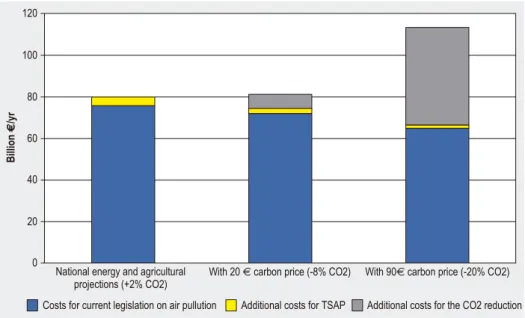
Climate change and air pollution 33 Research questions 37
Policy recommendations 37
VII CONCLUSIONS: PROGRESS TOWARDS ACHIEVING THE OBJECTIVE OF THE PROTOCOL 39
Sufficiency 39
Effectiveness 39
Ratifications 39
Towards achieving the long-term objectives 39 Further work 42
LITERATURE 47
1. Emissions of all pollutants have shown a downward trend since the signing of the Gothenburg Protocol.
2. Deposition of acidifying substances in Europe has declined since the 1980s, with positive effects on the chemical composition of soil and lakes. Nitrogen deposition remains a widespread problem for European ecosystems. Despite reductions in precursor emissions, no clear downward trend in ozone indicators for human health and ecosystems can be detected in Europe.
3. Latest scientifi c fi ndings suggest that current levels of exposure to fi ne particulate matter in Europe cause signifi cant reductions in life expectancy. Secondary aerosols, formed from precursor emissions of SO2, NOx, VOC and NH3 constitute a signifi cant fraction of PM2.5 in ambient air.
4. The benefi ts of current efforts under the Protocol exceed abatement costs. According to new scientifi c insights, however, efforts under the protocol lead to less improvement towards the ultimate objectives of the Protocol, in terms of the protection of ecosystems and health, than originally estimated.
5. To reach the ultimate goal of the Protocol - the protection of ecosystems and human health - further measures will be needed.
6. The effectiveness of the Protocol could be further improved by increasing the number of ratifi cations. There are strong synergies between the environmental objectives of the Protocol (i.e. reducing acidifi cation, eutrophication, ground-level ozone) and a reduction of health impacts from fi ne particulate matter. Extending the remit of the Protocol to cover particulate matter could increase the cost-effectiveness of pollution control strategies.
7. In addition, the cost-effectiveness of further measures needs to be analyzed in close conjunction with other policy objectives, including those on climate change, energy security, transport and agriculture.
8. In addition to available end-of-pipe emission control measures, non-technical and local measures will be of increasing relevance, especially if multiple policy objectives are pursued. Emissions from international shipping will still offer a large potential for cost-effective abatement measures. MAIN CONCLUSIONS
Other findings
1. It is estimated that most of the emission ceilings of the Protocol will be met by 2010. In many cases Parties have already reduced their emissions below the ceilings of the Gothenburg Protocol, often trig-gered by driving forces such as their accession to the EU, changes in the Common Agricultural Policy, or the implementation of EU directives on emission sources, air quality, nitrate in groundwater, etc. However, several Parties face difficulties in reaching their ceilings for NOx emissions, partly because of improved base year emission inventories, lower than envisaged efficiencies of control measures in the transport sector, and partly because of lacking implementation of measures.
2. A review of the need and the cost-effectiveness of further measures should consider some new scientific insights:
• Knowledge on the health effects of long-term exposure to air pollution is now more robust than a few years ago. Cohort studies that became available after 1999 make it possible to quantify the loss of life expectancy due to exposure to fine particulates.
• While the analyses for the Gothenburg Protocol in 1999 considered only health effects of ozone for concentration levels exceeding 60 parts per billion, new studies point out the occurrence of nega-tive health impacts at lower concentrations. These new findings would imply further abatement needs in order to achieve protection of human health.
• A more refined assessment of ecosystem-specific deposition results for sensitive ecosystems in high-er excess deposition of acidifying and eutrophying compounds than estimated before.
• The ‘ozone flux approach’, which offers a biologically realistic description of the potential effects of ozone exposure to vegetation, could offer improved estimates of the damage to crops, forest trees and natural vegetation..
• There is increased awareness of the contribution of hemispheric emission sources to ozone levels in Europe, which may counteract the positive impacts of emission reductions in Europe.
• Improved emission inventories revealed additional sources that have not been accounted for in earlier estimates. This is of special relevance for the achievement of the emission ceilings for NOx. • The real-life impacts of some emission control measures are lower than expected.
• In general, the assumptions on economic growth that were made for the Gothenburg Protocol have materialized, with few exceptions, in Eastern European countries.
• Despite current legislation, continued and even strengthened abatement efforts will be needed to keep emissions below the national emission ceilings agreed for 2010 in the longer term.
• There is a strong connection between greenhouse gas mitigation and the emissions of air pollut-ants.
• Some sectors have reduced their emissions more than others. For SO2, the largest reductions were reached for large point sources, while for NOx and volatile organic compounds (VOCs), emissions from the transport sector showed the strongest decline. NH3 emissions from agriculture have de-creased moderately. In contrast, emissions from international shipping have inde-creased more rapidly than expected and are expected to surpass the total emissions from land-based sources of SO2 and NOx by 2020.
• Studies indicate that costs to realize the Protocol obligations could turn out to be lower than origi-nally estimated. Economics of scale and technological progress can reduce real costs (estimated ex-post) by 50 percent compared to the ex-ante estimates1. In addition, some measures that are taken for other policy objectives (e.g. climate change, agriculture, biodiversity, water quality) reduce costs for air pollution control. Also the use of non-technical measures and structural changes lead to lower air pollution control costs than originally estimated on the basis of end-of-pipe measures.
1 Oosterhuis, F. (ed), 2006, Ex-post estimates of costs to business of EU environmental legislation, IVM, Amsterdam, April 2006, report commissioned by European Commission, DG Environment, Unit G.1 Sustainable Development & Economic Analysis, under a framework contract No ENV.G.1/FRA/2004/0081.
I INTRODUCTION
3. The 1999 Gothenburg Protocol is part of the stepwise process of the Convention on Long-range Transboundary Air Pollution (LRTAP) aiming in the long run at the achievement of protection of health and ecosystems by bringing deposition and concentrations of pollutants below critical loads and levels. As instruments, the Protocol employs national emission targets and sets of emission limit values that should accomplish by 2010 the agreed interim environmental objectives that are a step towards the long-term objective. Important criteria for the national emission targets in the Protocol have been cost-effectiveness, equity and environmental progress towards the long-term environmental objectives. 4. In order to maximize the cost-effectiveness of the national emission targets, a multi-pollutant/multi-effect approach has been chosen to identify, supported by the integrated assessment model RAINS, al-locations of emission reductions across Parties to meet the agreed environmental interim targets at least cost. The RAINS model was developed by the Centre for Integrated Assessment Modelling (CIAM) hosted by the International Institute for Applied Systems Analysis (IIASA) in Laxenburg, Austria. At that time, RAINS incorporated the best available knowledge of the late 1990s on the sensitivity of ecosystems, health effects, atmospheric dispersion, emission projections and abatement measures. Input to the RAINS model has been provided by a wide scientific network under the LRTAP Convention, including the vari-ous programme centres, task forces, co-operative programmes and expert groups under the EMEP Steer-ing Body, the WorkSteer-ing Group on Effects and the WorkSteer-ing Group on Strategies and Review.
5. The purpose of this document is to review the effectiveness and sufficiency of the Gothenburg Pro-tocol in the light of new scientific insights, recent trends and latest projections on economic activities.
Since 1999, significant political developments occurred in Europe. The EU welcomed 10 new Member States on 1 May 2004 (Malta, Cyprus, Estonia, Latvia, Lithuania, Poland, Czech Republic, Hungary, Slovenia, Slovakia,) and Bulgaria and Romania joined the EU on 1 January 2007. Other coun-tries, like Croatia and Turkey, have, at present, the status of accession countries. The new EU Member States had to implement the ‘acquis communautaire’ that include inter alia the full EU air quality legislation, although sometimes with considerable transitional periods. The Accession Treaties of these countries also contain national emission ceilings for 2010 that are equal to the ceilings listed in the Gothenburg Protocol – where available.
In a separate development, the geographical coverage of the Convention has been extended to the East with the accessions of Kazakhstan and Kyrgyzstan to the Convention in 2000 and 2001 respectively. There are now 51 Parties to the Convention including the European Community. Twenty-three Parties have ratified the Gothenburg Protocol so far (status April 2007). An action plan has been developed to strengthen further air pollu-tion policies in Eastern Europe, the Caucasus and Central Asia (EECCA) and to encourage protocol ratifications by countries in this region. Furthermore, exchange of information has been ini-tiated with Asian countries, including China and Japan, through the newly established Task Force on Hemispheric Transport of Air Pollution (TFHTAP).
I INTRODUCTION
RAINS: a multi pollutant multi effect framework http://www.iiasa.ac.at/rains
The RAINS (Regional Air Pollution Information and Simulation) model links sectoral developments and abatement measures for various pollutants with the environmental impacts of air pollution. RAINS considers acidification, eutrophication, ozone damage to vegetation, and health effects due to exposure to
ozone and primary and secondary particulate matter. In 2007 the RAINS model has been extended into the GAINS (Green-house Gas and Air Pollution Interactions and Synergies) model that also includes greenhouse gas emissions and structural measures that affect the activity levels.
Modelling multi-pollutant – multi-effect relationships
Economic activities Measures options Agriculture NOx emission SO2 emission Industry Energy NH4 deposition S deposition VOC emission NH3 emission Transport Exceedance CL acidification Exceedance CL Nitrogen NOy deposition O3 production NH3 policy NOx /VOC VOC policy Costs Exceedance CL ozone Targets Primary PM concentration
Other PM policy Primary PM
emission Secondary aerosols PM exposure humans SO2 policy NOx policy O3 exposure humans Impacts
In 2004, a group of peer reviewers concluded that the RAINS model was fit for its purpose to support the review and revision of national emission ceilings, provided that uncertainties were sufficiently taken into account. RAINS should be seen as an analytical rather than a prescriptive tool. However, the review-ers noted that the RAINS development had not ended, and they recommended extensions to the local and hemispheric scales. As the reviewers stated a possible bias of RAINS towards emission reductions through add-on technical solutions, it was recommended to pay more attention to the potentials for emis-sion controls offered by non-technical measures and structural changes in agriculture, transport and energy use. A systematic compilation of biases by the programmes under the Working Group on Effects (impact estimates) and Task Forces under the EMEP Steering Body (emission estimates and dispersion modelling) was also recommended. Parties to the Convention were asked to actively check and improve their data. CIAM was asked to further increase the transparency of the model by making input data and the model available via its website and to give users the possibility to provide feedback. These recommendations have been taken onboard in the work plan of the Convention. The local scale analysis has been included in the calculations based on the results of the City-Delta project. Pollution at hemispheric scale is addressed by the new Task Force on Hemispheric Transport of Air Pollution, and measures related to energy, transport and agricultural policies are now included in the new GAINS model. Uncertainties and possible
biases have become a recurring issue in the meetings of TFIAM and the expert groups dealing with emission invento-ries, effects and atmospheric dispersion. After bilateral con-sultations between CIAM and more than 30 Parties, the GAINS emission databases are now consistent with national statistics on energy, agriculture and transport and with other interna-tional data sources (e.g. UNFCCC inventory on greenhouse gas emissions).
In 2007, a new version of RAINS has become available that provides an answer to much of the critique of the 2004 review. The development of this so-called GAINS (Greenhouse Gas and Air Pollution Interactions and Synergies) model was financed by the Netherlands. Inter alia, GAINS allows better treatment of structural changes to form part of an emission control strategy. To analyze the cost-effectiveness of such structural measures, the optimization procedure has been changed. Instead of single pollutant cost curves, the GAINS optimization deals with individual abatement measures. These measures can have simultaneous effects on more than one pollutant. A review of the GAINS optimization procedure showed that the GAINS optimization in the RAINS-mode (that is without allowing for structural measures that change activity levels) produces the same results as the original RAINS optimization method. Information on the above mentioned reviews can be found at the website: http://www.iiasa.ac.at/rains.
Energy/agriculture projections
Emissions
Emission control options
Atmospheric dispersion Health and environmental impacts Driving forces Costs Environmental targets OPTIMIZATION Review of the RAINS model
I INTRODUCTION
The review of the RAINS model in 2004 recognised several simplifying assumptions and uncertainties that have impacts on model results. To safeguard the robustness of model findings, IIASA has undertaken extensive work to check the consistency and validity of input data and performed numerous sensitivity analyses with RAINS and its successor GAINS. These analyses include various sensitivity runs to investigate the robustness of policy relevant conclusions, including a relaxation of targets in “binding squares”2 and changes in external projections such
as shipping, energy use and agriculture. Modelling by EMEP has explored the sensitivity of the outcomes of atmospheric dispersion models to changes in global background concentra-tions, ecosystem-specific deposition rates, and the modelling of ozone deposition mechanisms. The inter-annual variability and extreme meteorological years might indicate potential impacts of a changing climate, although this effect is uncertain.
Inevitably, models dealing with the European scale require simplifications. For example, models derive future spatial emission patterns within countries by scaling them proportion-ally to the present emission distribution on a sectoral basis. In practice, however, countries have flexibility in how and where they achieve their emission reductions in order to meet their national ceilings. To examine uncertainties resulting from such generalizing assumptions, a growing number of countries are developing national scale integrated assessment modelling capabilities using more detailed data and spatial resolution, allowing comparison with national projections and exploring issues of scale and geographical factors within countries.
Such national integrated assessment models use emission projections broken down by sector or individual sources, and atmospheric modelling that resolves fine scale orographic effects and local scale dispersion. Such fine scale model-ling coupled with more detailed critical load data can lead to enhanced estimates of exceedance and ecosystems at risk compared with European-scale modelling. Direct modelling of urban concentrations, validated against available monitor-ing data, indicate synergies between reduction of national emissions and targeted policies to comply with the limit values for NO2 and PM10 of the Air Quality Directive of the EU - with particular emphasis on traffic emissions.
National integrated assessment activities have also demon-strated the potential for geographically targeted local meas-ures to give greater improvement in environmental protection when coupled with changes in long-range transboundary transport than is indicated by RAINS. In this context there is now a substantial capability for more detailed modelling of energy, transport and agricultural scenarios and the impacts of shipping at the national scale to support the modelling of IIASA than at the time when the Gothenburg Protocol was negoti-ated. Comparison of RAINS results with national model results has been encouraged in the past and will also be important in future work for finding the most cost effective ways for protect-ing health and ecosystems.
Addressing uncertainty
2 Binding squares are areas where meeting European wide targets for the improvement of the environmental is only possible at very high costs. These areas would require application of measures at the end of the cost curve. A small relaxation of the Euro-pean wide targets for these areas (what can be justified because of the uncertainties in depositions and estimated sensitivity of ecosystems) leads to significant cost savings.
II
EMISSIONS, CONCENTRATIONS AND DEPOSITION LEVELS
Trends in emissions
6. Since the Gothenburg Protocol, our knowledge on the emissions has significantly improved by iden-tifying a more complete range of emission sources, gathering more accurate statistics and resolving dis-crepancies between sectoral emission estimates across countries. The GAINS model can now reproduce national emission inventories of SO2 and NOx from national energy and agricultural statistics for almost all Parties with an uncertainty margin of less than 5% on average. For ammonia and VOC these uncer-tainty margins are slightly higher.
7. During the past decades emissions of SO2, NOx, VOC and particulate matter (PM) have declined sub-stantially, and are expected to decline further with progressing implementation of current legislation on emission controls. In contrast, more modest reductions have occurred for NH3. However, current levels of most emissions are two to three times higher than the pre-industrial levels. Parties that signed or rati-fied the Protocol exhibit much sharper emission reductions than the other Parties. For the latter group of countries, even an increase in emissions in the future cannot be ruled out.
8. According to the EMEP Meteorological Synthesizing Centre-West, in 2005 total emissions of SO2 of all Parties to the Convention within the geographical scope of the EMEP model amounted to approx. 15 million tons, which constituted a decrease by 65% since 1990. Overall, this decline in 2004 already match-es the reductions envisaged by the Protocol for the period 1990-2010. However, some 10% of the Partimatch-es that have ratified still need additional reductions to meet their individual ceilings for SO2 in 2010. Total emissions of NOx fell between 1990 and 2004 by 31% to 18 million tons. Thereby, a further 15% decrease in total emissions is necessary to reach the overall 2010 target. Half of the ratifying Parties need further reductions to meet their NOx ceilings by 2010. Emissions of NH3 were 7 million tons in 2004, 22% below the 1990 levels and close to the Protocol target. However, 15% of the Parties that have ratified have not reached the ceilings by 2004. Total emissions of VOC amounted to 15 million tons in 2004, which is 40% below the 1990 level, but 2-6% above the overall target of the Protocol for 2010.
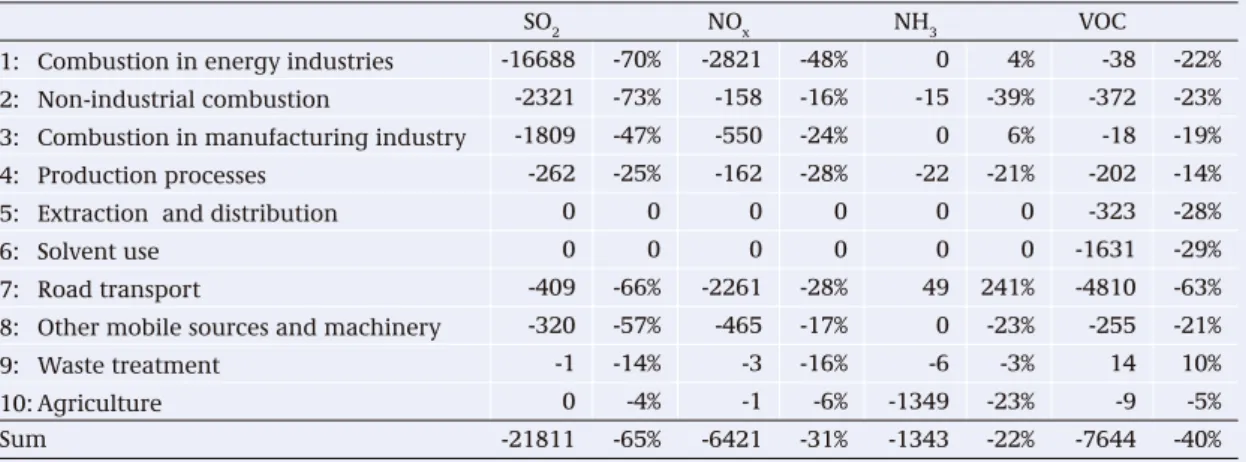
9. As indicated above, substantial emission reductions occurred in the ECE countries within the EMEP modelling domain between 1990 and 2005. On a sectoral basis, the largest declines in relative and abso-lute terms occurred for emissions from power generation, which cut SO2 emissions by 70% (or more than 16 million tons) and NOx emissions by almost 50% (or 2.8 million tons). The majority of these reductions were caused by the economic restructuring in central and eastern European countries after 1990, which led to substantially lower coal consumption. In the EU countries, the introduction of end-of-pipe emission control measures yielded significant emission cuts. Furthermore, SO2 emissions have been reduced in the domestic and industrial sectors as a consequence of the phase-out of coal. The transport sector, despite substantially increased traffic volumes, reduced its NOx and VOC emissions by 28% and 66%, respectively. NH3 emissions from agriculture and VOC emissions from solvents declined 20-30% (see Table 1).
10. An in-depth analysis of the factors that have caused the observed declines in SO2 emissions in Europe suggests that, after the signature of the Gothenburg Protocol, about one third of the emission reductions were a consequence of the declines of energy-intensive industries that have occurred with the structural changes in the European economies. Another third is linked to (autonomous) replacement of coal and oil by cleaner fuels, while the remaining third was achieved through dedicated end-of-pipe emission control measures (see Figure 1).
II EMISSIONS, CONCENTRATIONS AND DEPOSITION LEVELS 0 10000 20000 30000 40000 50000 60000 70000 1960 1965 1970 1975 1980 1985 1990 1995 2000 2005 2010 2015 2020
SO2 emission (kt p.a.)
Reductions due to control measures Reductions due to changes within sectors Red. due to changes in energy structure Actual SO2 emissions
Figure 1: SO2- emissions in Europe - 1960-2020: avoided emissions compared to hypothetical levels due to energy consumption growth. Emission reductions were caused by add-on measures, but also changes in the fuel mix and sectoral changes play a significant role. (Source: IIASA)
11. Up to 2010, baseline projections developed with the GAINS model suggest, despite the envisaged economic growth, a continued decline of all pollutants as a consequence of ongoing structural changes in the energy and agricultural systems and the progressing implementation of emission control legisla-tion (see Figure 2).
While most land-based emissions are expected to decline in the future, opposite trends are to be ex-pected for the emissions from aviation and from international shipping (see textbox).
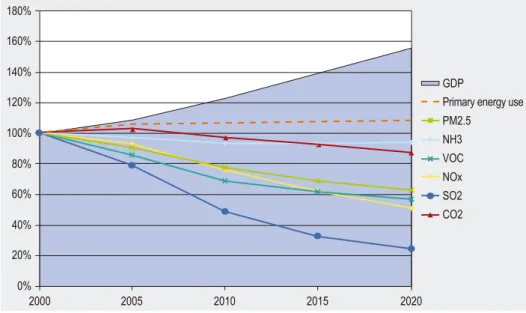
0% 20% 40% 60% 80% 100% 120% 140% 160% 180% 2000 2005 2010 2015 2020 GDP
Primary energy use PM2.5 NH3 VOC NOx SO2 CO2
Figure 2: Trends in European emissions in comparison tot the trend in GDP and primary energy use. With current legislation emissions significantly decrease, with the exception of ammonia and carbon dioxide (source: IIASA)
Modelling deposition of acidifying and eutrophying compounds
12. In the past five years, substantial improvements have been made in the modelling of air pollution. The EMEP Lagrangian dispersion model has been replaced by a more advanced Eulerian model. In ad-dition to the different modelling concept, these models differ in their spatial resolution, which has been reduced from 150*150 km to 50*50 km. Also the modelling of deposition for different ecosystem types has been improved. The new, more realistic, approach consistently estimates higher deposition to forests compared to meadows and lakes.
Table 1: Emission reductions between 1990 and 2005 by sector (in kilotons and percentage relative to 1990). Data source: GAINS model
SO2 NOx NH3 VOC
1: Combustion in energy industries -16688 -70% -2821 -48% 0 4% -38 -22% 2: Non-industrial combustion -2321 -73% -158 -16% -15 -39% -372 -23% 3: Combustion in manufacturing industry -1809 -47% -550 -24% 0 6% -18 -19%
4: Production processes -262 -25% -162 -28% -22 -21% -202 -14%
5: Extraction and distribution 0 0 0 0 0 0 -323 -28%
6: Solvent use 0 0 0 0 0 0 -1631 -29%
7: Road transport -409 -66% -2261 -28% 49 241% -4810 -63%
8: Other mobile sources and machinery -320 -57% -465 -17% 0 -23% -255 -21%
9: Waste treatment -1 -14% -3 -16% -6 -3% 14 10%
10:Agriculture 0 -4% -1 -6% -1349 -23% -9 -5%
Sum -21811 -65% -6421 -31% -1343 -22% -7644 -40%
Sea shipping has been increasing. Ship emissions are not included in the Gothenburg Protocol. Ship emissions have been abated less than land-based sources. This has resulted in a gradual increase in the share of ships in the total emissions in Europe. In most coastal regions, the contribution of ships to the deposition of sulphur is expected to increase to 20-30% of the total deposition. The total emissions of NOx and SO2 from ships will, around 2020, almost be equal to the total land-based
emis-sions. Many marine emission reduction options for SO2 and NOx are more cost-effective than additional measures on land. Ad-ditional technical and non-technical measures to reduce ship emissions could significantly reduce the total costs of meeting the environmental ambitions of the Protocol.3 Further emission
reductions on ships are currently being discussed within the International Maritime Organization (IMO).
0 2 5 10 20 30 40 70 0 2 5 10 20 30 40 70 Ship emissions: an outstanding problem
Percent of sulphur deposition from international sea shipping in 2000 (left) and in 2020, with current legislation (source: IIASA)
3 Cofala, J, et al, Analysis of Policy Measures to Reduce Ship Emissions in the Context of the Revision of the National Emissions
II EMISSIONS, CONCENTRATIONS AND DEPOSITION LEVELS
Modelling population exposure
13. In the past years, work has progressed to improve the modelling of the exposure of the European population to PM and ozone. On the basis of the City-Delta project, relationships were derived to estimate the difference between rural background PM concentrations and the background in urban areas, taking into account factors like the size of the city, the population density, urban emissions and meteorological parameters such as wind speed4. Low-level emissions from traffic and domestic heating contribute rela-tively more to the exposure of the population in cities than emissions from high stacks, making measures aimed at these sectors also more effective in reducing population exposure.
14. For SO2, the exposure of the urban population from high stacks emissions has decreased further in the past decade. The fraction of urban population that is exposed to SO2 concentrations above the EU limit values decreased to less then 1%. As such the EU limit value is close to being met. For NO2, PM10 and ozone the trends are less clear. In North and Western Europe a decrease in the most extreme ozone val-ues has been observed between 1990 and 2005. There is strong evidence that the lower percentiles in the ozone values in densely populated polluted areas of Europe have increased, in particular during winter. An important contribution to this upward trend comes from a reduced titration effect in response to the reduction of European NOx emissions. Across Europe, populations are exposed to levels of air pollution that are higher than the air quality standards set by the EU and the World Health Organization (WHO). This occurs predominantly within urban/suburban areas, although for PM10 and ozone, such exposure also takes place in rural areas. None of the ozone exposure indicators used by the European Environment Agency (EEA) show a discernable declining trend: average, as well as peak concentrations, remained fairly constant.5
15. Measurements at sea and on mountain tops suggest that background ozone in the EMEP region has increased by up to 5 ppb per decade since the 1970s. In the Mediterranean basin annual average back-ground ozone concentration range between 30 and 35 ppb, and 20-25 ppb over Northern Europe. Since a considerable share of these concentrations is caused by emissions from other continents, possible in-creases in ozone precursor emissions in other world regions would have immediate impact on European ozone levels.
In 2003, a review of the EMEP Eulerian model was organized under the auspices of the Task Force on Measurements and Modelling (EB.AIR/GE.1/2004/6). For sulphur and nitrogen deposition, it was concluded that the model was suitable for the calculations of source receptor relationships for sulphur and nitrogen deposition aimed to support European air quality strategies. For ozone, it was also concluded that the model was suitable for the assessment of vegetation exposure and for the assessment of human health effects on the regional scale. For particulate matter, it was concluded that the model underestimated observed PM10 and PM2.5 due to an incomplete description of relevant processes and emissions. However, the model was able to calculate the regional component of main anthropogenic PM fractions with enough accuracy for the
assessment of the outcome of different control measures, i.e. secondary inorganic aerosols and some primary components for which emission inventories were sufficiently reliable. Model inter-comparisons showed that the EMEP model was also state of the art for PM.
Important limitations to a sound understanding of PM disper-sion were identified. These include: uncertainties in emisdisper-sion totals (both from anthropogenic and natural/biogenic sources), the chemical composition of emissions, the contribution of particle-bound water to PM mass, and the mechanisms behind secondary organic aerosol formation. Understanding the chemical composition of ambient PM is a prerequisite for evaluating and improving the EMEP model in this area. Review of the EMEP model
4 Thunis, P., Rouïl, L., Cuvelier, C., Bessagnet, B., Builtjes, P., Douros, J., Kerschbaumer, A., Pirovano, G., Schaap, M., Stern, R. and Tarrason, L. (2006). Analysis of model responses to emission-reduction scenarios within the CityDelta project. Atmospheric
Environ-ment.
5 See: EEA, Europen exchange of monitoring information and State of the Air Quality in 2005, ETC/ACC Technical Paper 2007, in prep.; and: Steinar Larssen and Kevin Barrett (eds), Air Pollution in Europe 1990-2004, NILU, in prep.
Health impacts are most pertinent in urban areas where a major share of the European population lives.
Current European integrated assessment modelling describes the long-range transport of pollutants with a spatial resolution of 50 * 50 km. Obviously, with such a resolution assessments would systematically miss the higher pollution levels in Euro-pean cities and therefore underestimate population exposure.
To correct for local emissions, a methodology has been imple-mented in the GAINS model that starts from the hypothesis that urban increments in PM2.5 concentrations originate predomi-nantly from primary PM emissions from low-level sources within the city. The formation of secondary inorganic aerosols, as well as the dispersion of primary PM2.5-emissions from high stacks, is reflected by the background concentrations computed by the regional-scale dispersion model.
Based on the results of the City-delta model intercomparison, which brought together the 17 major European urban and
regional scale atmospheric dispersion models6, a generalized
methodology was developed to describe the local increments in PM2.5 concentrations in urban background air that originate from urban emission sources. Mathematical relationships associate these urban increments in PM levels with the spatial variations in emission densities of low-level sources in a particular city as well as city-specific meteorological and topographic factors.
In GAINS, urban background PM2.5 concentrations within cities are then derived by correcting the PM concentration value computed by the 50*50 km regional dispersion model with a “city-delta”, i.e. the increase in concentrations due to emissions in the city itself. Thereby, the City-delta approach redistributes concentrations resulting from local emissions within the 50*50 km grid cell along the variations in emission densities of the low-level sources, while in regional-scale calculations this contribution is uniformly spread out over the whole 50*50 kmgrid.
Urban scale exposure to particulate matter
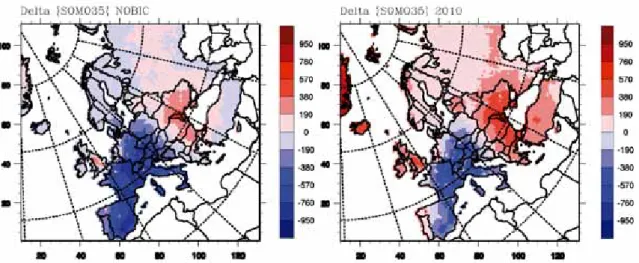
Figure 3: Hemispheric ozone developments could increase the challenge. The left figure shows the calculated effects of current legislation in Europe on the changes in the sum of the mean ozone values over 35 ppb in rural areas in 2020 assuming no increase in hemispheric concentrations. The right figure shows that when rising emissions of CH4, VOC and NOx at the global scale are assumed this would diminish the expected improvements in the sum of the maximum daily 8-hour mean ozone values over 35 ppb (SOMO35). Source: EMEP/MSC-W
6 Thunis, P., Rouïl, L., Cuvelier, C., Bessagnet, B., Builtjes, P., Douros, J., Kerschbaumer, A., Pirovano, G., Schaap, M., Stern, R. and Tar-rason, L. (2006). Analysis of model responses to emission-reduction scenarios within the CityDelta project. Atmospheric Environ-ment submitted.
16. In the model calculations made for the preparation of the Gothenburg Protocol, (hemispheric) back-ground ozone levels have been assumed to remain constant in the future. As a result, a potential increase in the background concentrations in the northern hemisphere as a consequence of increasing emissions outside the Convention domain would diminish the ozone reductions that have been envisaged from the agreed measures in the Protocol. emissions outside the Convention domain would counteract the ozone reductions that have been envisaged from the agreed measures in the Protocol.
III
EFFECTS ON HUMAN HEALTH, NATURAL ECOSYSTEMS,
MATERIALS AND CROPS
17. Critical loads for acidification and eutrophication for all of Europe were updated in 2006 by the national focal centres and compiled by the Coordination Centre for Effects (CCE). With these data, GAINS estimates that, for 2020, critical loads for acidification will still be exceeded at 11 percent of the Euro-pean ecosystem area, compared to 34 percent in 1990 and 20 percent in 2000. Exceedances of 200-500 eq/ha7 per year of the critical load for acidification will remain in Germany, Poland, the Czech Republic, Austria, France, Benelux and Denmark and will be more than 1000 eq/ha per year in the border region of Germany and the Netherlands. These revised estimates are now less optimistic than what was assumed
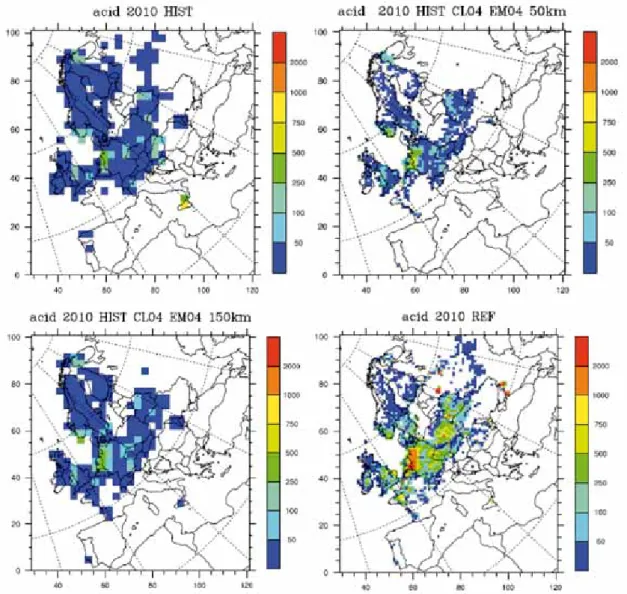
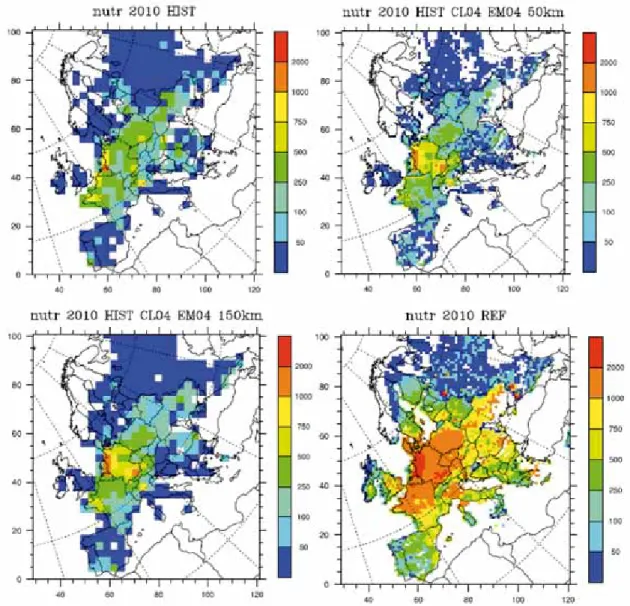
Figure 4: Factors changing ecosystem risk estimates: accumulated exceedance of critical loads of acidity (in eq/ha/ yr) in 2010 according to the methodology used for the Gothenburg Protocol (top left), with the new critical loads (bottom left), the fine resolution of 50 * 50 km grid with the new critical loads (top right) and the use of ecosystem dependent deposition rates (bottom right). Source: CCE/EMEP-MSC-W
III EFFECTS ON HUMAN HEALTH, NATURAL ECOSYSTEMS, MATERIALS AND CROPS
when the Gothenburg Protocol was negotiated. At that time, contemporary knowledge of critical loads, emission data and atmospheric dispersion characteristics suggested for the year 2010 excess of the criti-cal loads for acidification to occur at only 3 percent of the European ecosystems area (declining from 16 percent in 1990). The most important factor leading to the revised, less optimistic estimates relates to the improved modelling of sulphur and nitrogen deposition processes over forests, which now takes into account the systematically higher deposition of pollutants over rough surfaces (see Figures 4 and 5). 18. The refined assessment indicates higher and more widespread, but less uniform risks of, eutrophi-cation across Europe. It is now estimated that by 2020 nitrogen deposition will exceed critical loads for eutrophication for 53 percent of the ecosystem area, while for the Protocol negotiations excess of critical loads was envisaged for only 20 percent of the ecosystems area. Nitrogen deposition in 2020 is expected to exceed the critical loads typically by 250-750 eq/ha per year, but can reach values of more than 1000 eq/ha per year in areas with high cattle densities.
Figure 5: Factors changing ecosystem risk estimates: exceedance of critical loads of nitrogen (in eq/ha/yr) in 2010 according to the methodology used for the Gothenburg Protocol (top left), with the new critical loads (bottom left), the fine resolution of 50 * 50 km grid with the new critical loads (top right) and the use of eco-system dependent deposition rates (bottom right). Source: CCE/EMEP-MSC-W
Remaining problems
19. Since 1990, the deposition of acidifying compounds has decreased substantially and, with full com-pliance with the obligations of the Gothenburg Protocol, a further decrease in the coming years is ex-pected. While, compared to 1990s, there is now less risk of acidification to waters and forests following the decline of sulphur and nitrogen emissions, current deposition is still well above the levels needed for recovery of ecosystems (see Figure 6).
20. Slow progress in reducing nitrogen deposition maintains the widespread risk for detrimental impacts of eutrophication, such as the loss of biodiversity. In 2000, the forest area with nitrogen deposition exceeding the critical loads for eutrophication was four times larger than the forest area with excess acid deposition.
21. For ground-level ozone, only limited progress can be detected based on the recent risk indicators addressing human health (SOMO35) and vegetation (the ozone flux metrics), and there is no clear picture on the development expected for the next few years.
Ecosystem damage due to acidification and eutrophication
22. The Working Group on Effects, its six International Cooperative Programmes (ICPs) and the Task Force on Health provide the necessary information on effects on human health and the environment to assess the effectiveness of abatement measures. It was found that excess sulphur and nitrogen deposition, as well as acidified soils, imply hazards to forest ecosystems and unbalanced tree nutrition. The vegeta-tion species composivegeta-tion can be linked to nitrogen deposivegeta-tion8. There is increased evidence that high nitrogen deposition could damage forests and trees due to diseases, frost, droughts and storms9. 23. The monitoring activities under the ICP Forests and ICP Integrated Monitoring have confirmed the positive impacts of the declines in sulphur emissions over the last decade on deposition in forests eco-systems. Observations at almost all monitoring sites of ICP Waters and ICP Integrated Monitoring have shown a clear decrease in sulphate in surface waters since 1990. This has resulted in less acidic surface waters, which are now less toxic to biota, and has led to the first signs of biological recovery. No trends, however, have been detected for nitrogen deposition. Nitrogen continues to accumulate in most forest and catchment soils with risks for biodiversity changes; and nitrogen deposition remains in many regions twice above the critical loads for eutrophication. Thus, the recovery achieved by the decline in sulphur deposition could be offset by the net acidifying effects of nitrogen leaching following nitrogen saturation caused by further nitrogen deposition.
8 Sverdrup, H S. Belyazid, B. Nihlgard, L. Ericson, Modelling change in Ground Vegetation Response to Acid and Nitrogen Pollution, Climate Change and Forest Management at in Sweden 1500–2100 a.d., Water, Air & Soil Pollution, Vol 7, nr 1-3, p163-179, 2007 9 De Vries, W., J. Kros, J.W. Erisman and G. J. van Duinen, 2004. Adverse impacts of elevated nitrogen use. In J.W. Erisman et al
III EFFECTS ON HUMAN HEALTH, NATURAL ECOSYSTEMS, MATERIALS AND CROPS
Freshwater ecosystems - Acid deposition Health - Particulate Matter 0 5 10 30 70 90 95 100 0 1 2 4 6 9 12 36
Forests - Acid deposition Semi-natural ecosystems - Acid deposition 0 5 10 30 70 90 95 100 0 5 10 30 70 90 95 100
Health and vegetation - ozone Vegetation - N deposition 0 5 10 30 70 90 95 00 0 1000 2000 3000 4000 5000 6000 7000
Figure 6: Remaining problems in 2020: ozone exposure will be highest in the Mediterranean (see SOMO35 values at the top-left). Nitrogen will remain a widespread problem (see % of ecosystems not protected at the top-right). Acidifi-cation of forests and nature areas will still occur in the central zone of Europe (see % of ecosystems not protected in the middle figures). Acidification of lakes will remain problem is parts of the United Kingdom and Scandinavia (see % of ecosystems not protected at the bottom left) and significant health risks from anthropogenic PM exposure will remain in Eastern and central Europe and in parts of the Benelux and Italy (see reduced life expectancies in months at the bottom right) (Source: IIASA).
Ozone damage to crops and natural vegetation
24. After 2000, use of the ozone flux approach, a new concept for critical levels of ozone for crops and forest trees, has been developed (see textbox). This method links ozone effects to a plant’s uptake of ozone through its stomata on leaf surfaces.
25. ICP Vegetation has observed continued damage to vegetation from ozone across 17 European coun-tries between 1992 and 2006. In dry grasslands in the Mediterranean and in Southern Germany, as well as in Alpine grasslands and temperate shrub heath land, combined effects of ozone and nitrogen have been detected. The observed trends reflect the spatial and temporal variation in ozone concentrations, without marked declines or increases over time. Estimates of the economic costs of ozone damage to crops and timber in 1990 amounted at € 30 bn per year. Current estimates quantify the economic dam-age of ozone to crops in the year 2000 at roughly € 7 bn per year or 2% of the agricultural production in Europe.
Critical loads represent a steady-state maximum level of a pollutant input that can be tolerated by an ecosystem without leading to negative impacts in the long run. However, actual ecological damage occurs as a consequence of dynamic chemical and biological processes, with historic depositions, stocks of chemicals and delay times as important factors.
The modelling of the dynamics of ecosystems recovery from acidification achieved a major breakthrough in 2004. A Europe-wide dynamic acidification modelling framework is now ready to quantify damage and recovery times. Current dynamic mod-els can address nitrogen and carbon cycles and eutrophication for alternative deposition scenarios, but they require further testing prior to regional application.
With the insights from these new dynamic models, risks of continued exceedance of critical loads and levels can now be better assessed than in 1999. According to these models, acidi-fied forest and surface water sites in many regions in Europe would need many more decades for chemical and biological recovery even if the Protocol was fully implemented. In addi-tion, ecosystems may not recover to their original status.
The decrease of emissions of acidifying substances has also slowed the pace of depletion of the soil buffering capacity. At current rates, it takes now five times longer for actual damage to forests to become visible than in the 1980s. However, the current situation is still not sustainable. In (valuable) nature
areas where the buffering capacity is already depleted, recov-ery from acidification requires a period of deposition below the steady-state critical loads. Dynamic acidification models could assist to explore the levels of deposition that would allow chemical recovery within a chosen time period.
For nitrogen the situation is more complex. Field experiments under the Swedish ASTA programme have highlighted the effects of additional nitrogen loading on changes in forest vegetation in unpolluted areas. Analyses in the Netherlands and the United Kingdom have shown that with increased avail-ability of nitrogen more rare species become endangered, and dominant species more abundant. However, biodiversity is not only influenced by nitrogen, but also by changes in land use, climatic conditions and forest and nature management.
The political choice of biodiversity-based targets loads could be complex. Within the EU, characteristic species of Natura-2000 areas could be chosen as the basis for such an approach.
In the past years more information has become available on the linkages between the nitrogen and the carbon cycle. Field experiments have analyzed the effect of whole tree harvest-ing (a new forestry practice to increase the use of biomass in electricity and heat production) on nitrogen dynamics. Biomass production in forests for energy production requires more nitrogen and this could therefore influence the choice of the target loads for nitrogen.
Recovery targets of ecosystems
The flux-based approach takes into account the uptake of ozone by plants dependant on the humidity and is believed to be biologically more realistic than other approaches. For crops, this flux approach is now an accepted method and is incorporated within the Mapping Manual of the LRTAP Con-vention. The flux method for forest trees has been conceptu-ally accepted, though further work is needed to develop the methods for practical application.
The flux approach results in a more widespread spatial distribution of ozone damage to vegetation and crops over Europe compared to the traditional concentration-based AOT4010 approach, which indicated ozone damage as a
mainly Southern European problem.
The Europe-wide assessment of ozone effects has been improved with the harmonized land cover database, merged from land cover information of the Coordination Centre for Effects, the CORINE (Coordination of Information on the Environment) programme and the Stockholm Environment Institute. This harmonization has aligned work under the Working Group on Effects and the EMEP Steering Body. The same map is being used to calculate critical loads and levels for terrestrial and aquatic ecosystems, and to calculate ecosystem-specific deposition of sulphur and nitrogen and ozone fluxes to vegetation.
III EFFECTS ON HUMAN HEALTH, NATURAL ECOSYSTEMS, MATERIALS AND CROPS
Health effects of air pollution
26. In recent years, the Joint Executive Body/WHO Task Force on Health has reanalyzed the evidence on health impacts of ozone and particulate matter (PM).
27. Based on recent studies reported in the scientific literature, a new indicator for health impacts from ozone has been developed. These studies have shown effects at ozone concentrations below the previous guideline of 120µg/m3 (60 ppb) and no clear evidence of the existence of a threshold for effects. There is clear evidence for acute health effects occurring below 60 ppb (measured as the daily eight-hour mean concentration), the threshold which was used for the preparation of the Gothenburg Protocol. While a clear threshold cannot be discerned from the available studies, a pragmatic choice of a 35 ppb thresh-old has been made to account for increasing uncertainties on the effects at lower concentrations. This new SOMO35 (sum of the 8-hour mean ozone values over 35 ppb) indicator gives higher weight to me-dium ozone concentrations occurring over the entire year compared to the earlier AOT60 (accumulated concentration over a threshold of 60 ppb) approach, which put more emphasis on episodes with peak ozone.
28. The 2005 update of the global WHO Air Quality Guidelines recommends an 8-hour mean concentra-tion of 50 ppb as the air quality guideline level. In the Guidelines, it is also acknowledged that health ef-fects will occur below this level in some sensitive individuals. Based on time-series studies, the estimated number of premature deaths attributable to ozone at the guideline level of 50 ppb would be 1-2% higher compared to a level of 35 ppb (which is the base level for the SOMO35).
29. The SOMO35 health effects indicator, combined with the results of the Eulerian EMEP model, yields larger health impacts in Southern Europe compared to the earlier calculation method, which suggested more damage in the North-western and central parts of Europe.
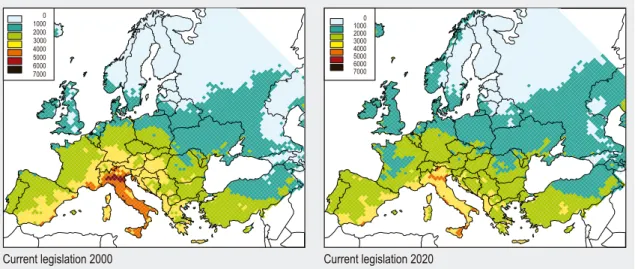
30. Calculations using the SOMO35 indicator (i.e. the sum of maximum daily 8-hour means above an ozone concentration of 35 parts per billion) result in over 20,000 premature deaths annually across Eu-rope attributable to ozone. While there are indications that the number and magnitude of ozone peak concentrations have declined over the last decade, current policies are not expected to significantly change long-term exposure and health impacts in the future (see Figure 7).
Current legislation 2000 Current legislation 2020 0 1000 2000 3000 4000 5000 6000 7000 0 1000 2000 3000 4000 5000 6000 7000
Figure 7: Ozone exposure in 2000 and 2020, with current legislation. Sum of the mean ozone values over 35 ppb in rural areas (SOMO35)
31. Scientific knowledge at the time of the Gothenburg Protocol negotiations allowed an assessment of health impacts of particulate matter only for acute effects attributable to the exposure to secondary inorganic particles that are formed from SO2, NOx and NH3 emissions. In the meantime, numerous scien-tific studies have created a large body of evidence for statistically robust associations between premature mortality and the long-term population exposure to total particulate matter.
32. The recent WHO systematic review points to the health significance of fine particles, i.e. those with a diameter less than 2.5µm (PM2.5). In particular, the effects of long-term PM exposure on mortality seem to be associated with PM2.5 rather than to coarser particles. There is currently insufficient scientific evi-dence for robust conclusions about the potencies of different particle constituencies and characteristics on health impacts.
33. The largest epidemiological long-term study in the United States that has involved several 100,000s of people for more than 20 years found an increase of 10 µg/m³ PM2.5 in ambient air associated with a six percent higher risk for premature mortality. Comparable results have been obtained by smaller Eu-ropean cohort studies. Applying the same relative risk figure to EuEu-ropean conditions, the GAINS model computes for the year 2000 an average loss of statistical life expectancy of approximately 8.6 months, or more than 214 million lost life years for the EU-27 and Norway. This is considerably more then the 5.6 million lost life years that were estimated during the preparation of the Gothenburg Protocol, which included secondary inorganic particles only and quantified only acute (short-term) mortality.
34. The critical role of PM2.5 for health impacts implies that the long-range transport of primary and secondary particulate matter makes a significant contribution to acute and chronic health problems in Europe. At urban background stations, emissions of NOx, SO2 and NH3 can contribute 20-50% to the anthropogenic fraction of PM2.5 concentrations. In busy streets the contribution from local sources (espe-cially of carbonaceous aerosols) is higher.
35. Current legislation on the emissions of primary PM and PM precursors is expected to reduce the health impacts by about one third by 2020. Further measures are readily available that could further reduce emissions and thereby the health impacts.
A wide body of scientific literature has highlighted important non-linearities in the response of ozone concentrations to changes in the precursor emissions, most notably with respect to the levels of NOx emissions. It has been shown that, at suf-ficiently high ambient concentrations of NO and NO2, lower NOx emissions could lead to increased levels of ozone peaks. In earlier analyses for the negotiations of the Gothenburg “multi-pollutant/multi-effect” Protocol in 1999, the RAINS model reflected this non-linear response through source-receptor re-lationships that describe the effect of NOx emission reductions on accumulated ozone concentrations above 60 ppb in form of quadratic polynomials11. A re-analysis of the latest Eulerian
model results with a focus on the likely emission levels for the year 2020 suggests that such non-linearities will become less important for three reasons: (i) In 2020 “current legislation” baseline NOx emissions are expected to be 50 percent lower than in the year 2000. (ii) The chemical processes that cause
these non-linearities show less effect on the new long-term im-pact indicator (SOMO35) than for ozone peak concentrations; and (iii) such non-linearities diminish even further when popu-lation-weighted country-means of SOMO35 are considered. It was found that within the policy-relevant range of emissions (i.e. between the “CLE” (current legislation) and the “MTFR” (maximum technically feasible reduction) levels anticipated for 2020), changes in the SOMO35 indicator could be described sufficiently accurate by a linear formula.
The relationship between ozone formation and climate change has been the subject of several recent and ongoing studies. Meteorological changes as well as rising global emissions of NOx, methane (CH4) and carbon monoxide (CO) could cause in-creasing ozone concentrations throughout the Northern Hemi-sphere and higher peak concentrations at higher latitudes. Non-linear ozone effects of NOx reduction
11 Heyes, C., Schöpp, W., Amann, M. and Unger, S. (1996). A Reduced-Form Model to Predict Long-Term Ozone Concentrations in Europe. WP-96-12. International Institute for Applied Systems Analysis, Laxenburg, Austria.
III EFFECTS ON HUMAN HEALTH, NATURAL ECOSYSTEMS, MATERIALS AND CROPS
36. In most countries, concentrations of anthropogenic PM2.5 have considerable transboundary origin of about 60% on average. Natural sources such as Saharan sand storms also contribute to hemispheric PM concentrations. They are limited to specific meteorological episodes.
Materials damage
37. Declining concentrations of acidifying air pollutants resulted in decreased observed corrosion of materials at the ICP Materials sites - by about 50% on average in 1987-1997. The corrosion rate of carbon steel decreased further in 1997–2003, though the rates for zinc and limestone increased slightly. Nitric acid and particulate matter currently contribute to corrosion in addition to sulphur dioxide. Exceedances of tolerable levels of corrosion for cultural heritage materials were frequent. Particles contain also soil materials, and the tolerable PM10 level for soiling of three selected materials is 12–22 µg/m
3 based on rea-sonable cleaning intervals. For 1990, it was estimated that air pollution caused € 1.8 billion of materials damage. Emission reductions envisaged under the Gothenburg Protocol are expected to improve materi-als damage across Europe by more than € 1 billion.
IV
EMISSION CEILINGS OF THE PROTOCOL
Implementation
38. For the review of the Gothenburg Protocol, the EMEP Centre for Integrated Assessment Modelling (CIAM) updated emission inventories and projections of anthropogenic activities for all Parties of the Convention in the EMEP domain. Bilateral consultations were held with national experts from 30 coun-tries, including 25 EU councoun-tries, Norway, Switzerland, Russia, Ukraine and Belarus. As a consequence of the economic restructuring in Central and Eastern European countries, projections provided by national experts for 2020 imply substantially lower emission figures than the earlier 2010 estimates if stricter emission control legislation is assumed. However, for the non-EU countries in Central and Eastern Europe the projections provided by experts in the bilateral consultations, and in particular the assumption that stricter air pollution control legislation will be implemented, were not officially confirmed. A more con-servative emission projection was therefore used for this review.
39. Emission projections for sea regions for 2020 exceed the levels anticipated for 2010, essentially due to the increased volume of shipping.
40. Under the assumption that current legislation will be fully implemented, most Parties to the Gothen-burg Protocol will meet their ceilings (see Table 2). For NOx, 9 out of 21 European countries that ratified
• For the EMEP region as a whole, emission reductions between 1990 and 2010 are comparable with the emission reductions envisaged by the Protocol.
• No Party that ratifi ed seems to have serious problems in meeting the NH3 ceiling in 2010.
• For SO2 and VOC only a few Parties that ratifi ed need additional policies to meet the ceilings.
• For NOx half of the Parties that ratifi ed need additional policies. In six countries the NOx ceiling would be met a few years after 2010 without additional measures. Reasons for not meeting the ceilings are: revised base year emission inventories (e.g. emissions from the off-road sector have been added), higher real life emissions (e.g. from Euro-2 and -3 vehicles) or lacking implementation of measures. One party will not meet the NOx ceiling because this is based on the energy sold instead of the energy used.
• In a signifi cant number of countries, projected emissions for 2010-2020 will be more than 50% below the ceiling of the Protocol. These overachievements result inter alia from lower coal use compared to what was expected when the national emission ceilings were negotiated.
• No signifi cant difference can be detected in the efforts between countries that ratifi ed and the other Parties that only signed the Protocol, as most of them are EU Member States and subject to the National Emissions Ceiling (NEC) directive of the EU. Some Parties that signed but have not ratifi ed would have no problem with any of the emission ceilings.
• There are signifi cant differences, however, to the efforts of other Parties to the Convention. Emissions of countries that did not sign or ratify the Protocol are projected to increase in the future. Policy conclusions
IV EMISSION CEILINGS OF THE PROTOCOL
the Protocol are unlikely to meet the 2010 targets without additional efforts. Some Parties have already formulated plans for additional abatement measures or indicated that they expect to meet the targets just one or two years later than 2010. But at least for three parties that have ratified, it seems difficult Table 2: Implementation of the Gothenburg Protocol. Projected emission reductions, significant exceedances of emission ceilings (> 5% = red shading) and significant overachievements (> -50% = green shading)
Baseline based on national projections Implementation of the protocol reduction 2000-2020 exceedance ceiling 2010 exceedance ceiling 2020
SO2 NOX VOC NH3 SO2 NOX VOC NH3 SO2 NOX VOC NH3
Bulgaria 86% 33% 36% 2% -49% -41% -28% -38% -87% -59% -54% -37% Cyprus 84% 42% 61% 3% -54% -21% -57% -20% -80% -35% -62% 19% Czech Republic 29% 40% 37% 8% -17% 4% -12% -22% -37% -34% -33% -24% Denmark 25% 41% 49% 42% -65% 33% 9% -16% -62% -1% -16% -23% Finland 23% 39% 43% 14% -43% -1% -14% -1% -49% -24% -30% -3% France 25% 41% 52% 7% 24% 38% -14% -16% 23% 1% -22% -17% Germany 30% 47% 41% 26% -15% 12% 4% -14% -20% -14% -14% -19% Hungary 86% 43% 27% -16% -74% -30% -11% -9% -88% -46% -14% 0% Latvia -30% 8% 37% -14% -79% -50% -58% -67% -82% -63% -68% -67% Lithuania 19% 16% 38% -6% -73% -53% -42% -56% -73% -62% -54% -53% Luxembourg 58% 48% 44% 8% -58% 127% -13% -14% -57% 55% -21% -16% Netherlands 33% 44% 35% 7% 0% 8% -17% -4% -1% -14% -12% 8% Portugal 70% 44% 42% 8% -22% -19% -13% -34% -50% -39% -22% -35% Romania 82% 21% 28% -29% -64% -24% -20% -21% -85% -40% -43% -18% Slovakia 36% 28% 31% -5% -38% -27% -56% -20% -26% -40% -56% -18% Slovenia 77% 41% 44% -3% -1% 15% -13% 4% -16% -22% -25% 3% Spain 1) 69% 36% 25% 6% -35% 37% 22% 2% -42% 1% 25% 4% Sweden 10% 31% 49% 7% -35% 23% -35% -10% -38% 6% -49% -11% United Kingdom 76% 54% 39% 17% -27% 2% -23% -9% -56% -28% -30% -10% Norway 4% 19% 76% 14% 16% 30% -29% -9% 19% 17% -53% -10% Switzerland 10% 46% 45% 20% -29% -16% -28% -28% -30% -38% -39% -35% total ratifications 63% 42% 42% 10% -39% 7% -14%% -16%% -56%% -20% -24% -16% Austria 41% 36% 38% 1% -46% 61% -14% -13% -49% 21% -28 -10% Belgium 51% 43% 43% 8% -8% 43% -2% 8% -19% 11% -11% 4% Greece 80% 41% 52% 14% -68% -32% -34% -33% -82% -44% -47% -36% Ireland 72% 44% 40% 22% -17% 54% 4% -9% -13% 13% -6% -15% Italy 54% 43% 53% 9% -32% 7% -25% -6% -31% -23% -39% -8% Poland 43% 49% 45% 1% -17% -22% -50% -33% -39% -51% -60% -33% Croatia 42% 40% 59% -14% -4% -16% -18% 0% -11% -39% -53% 8% Rep. of Moldova 11% 3% -10% -23% -14% -28% -60% 8% -25% -30% -59% 8% total other signatories 51% 43% 49% 7% -29% -3% -32% -17% -43% -31% -44% -18% Estonia 47% 39% 45% -12% -24% -38% -43% -65% -52% -60% -56% -64% Malta 78% 24% 57% -58% 5% -3% -70% -15% -16% -19% -73% -10% Albania 3% -66% -29% -17% -46% -22% -7% -25% -43% 0% 4% -24% Belarus -14% -24% -7% -13% -64% -15% -21% -20% -62% -6% -18% -17% Bosnia-Herzegovina 9% -9% -29% -3% -1% -10% -7% -22% -8% -4% 6% -20% Russia 1) -30% -27% -18% 5% 21% 13% 19% -43% 33% 24% 21% -41% Serbia + Montenegro 58% -4% -11% -9% 3% 10% 8% -14% -38% 14% 11% -11% TFYR of Macedonia 20% -13% -44% 0% 1% 40% 63% -7% -11% 50% 91% -7% Turkey 45% 11% 39% -16% -33% -7% 1% 86% -47% -14% -28% 104% Ukraine -65% -56% -87% 13% -2% 1% 19% -59% 28% 12% 50% -57%
total other parties -6% -24% -17% -2% -7% 5% 13% -29% -2% 12% 15% -25% Grand total all
parties
35% 24% 26% 6% -23% 4% -8% -20% -30% -10% -15% -19%
to achieve the targets even before 2020. Among others, lower effectiveness of the Euro-standards for vehicles and higher increases in activity levels than earlier expected seem to be the most important rea-sons. With current projections of activity levels, two parties would not meet the targets for SO2 in 2020 without additional efforts, and two parties are expected to exceed the VOC ceilings. This analysis did not yet take into account the recent change in the ambitions of the EU-countries to reduce greenhouse gas emissions.
41. Emission projections that assume no further measures beyond what is already laid down in current legislation might be too pessimistic. Updates of projections received after 2006 have not been taken into account. This applies to Norway, but also to countries who have in the meantime developed more climate-compatible projections (UK, Germany, Poland, etc.). Information from the European Commission on the national plans submitted for the NEC Directive indicate that with envisaged additional measures all EU-27 countries are expected to meet their SO2 ceiling under the NEC Directive in 2010. This Directive contains more stringent ceilings for some countries than the Gothenburg Protocol. For NOx, six EU Mem-ber States indicated that they might not meet their ceiling. For three other MemMem-ber States the situation is unclear since no plans were submitted. Two Member States might have difficulties meeting their ceilings. For VOC, two Member States might not meet their ceilings in 2010. All EU Member States are expected to meet their NH3 ceilings, some of them with additional measures.
42. Also the projections for non-EU countries might be too pessimistic as, for instance, in the absence of confirmed legislation, no regulation for the emissions of new vehicles is assumed.
Costs
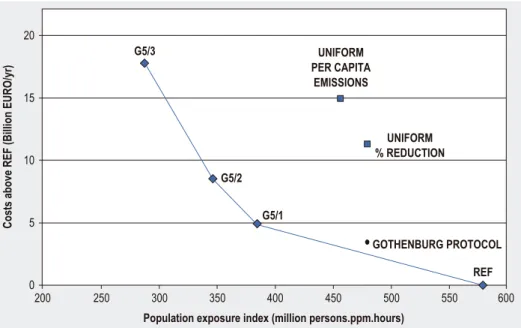
43. The implementation of the Gothenburg Protocol should lead to more cost-effective emission re-ductions than a flat-rate emission reduction agreement, an equal emission per head strategy or a ‘level playing field’ strategy aiming at equal emission limit values for industries across Europe. Nevertheless the Gothenburg Protocol could have been more cost-effective. There are two reasons. First, the Protocol is a little bit less cost-effective than the optimized scenario that was the starting point of the political negotiations, the so-called G5/2 scenario (see Figure 8). The negotiated ceilings of the Protocol deviate up to 10-20% from the results that have emerged from the cost-optimization analysis. Second: the cost-curves used in RAINS did not take into account the potential for structural changes in the energy sector, the traffic sector and in agriculture, as well as the potential for non-technical and local measures.
How did changes in the activity projections affect the imple-mentation of the Protocol? In general, increases in population, GDP and energy use developed in a very similar way as was assumed during the preparation of the Protocol. Current pro-jections are in line with the scenario used for the Gothenburg Protocol. There are, however, a number of exceptions: in numerous countries (Bulgaria, France, Finland, Latvia, Norway, Sweden and Switzerland), consumption of fossil fuels is lower by more than 25 percent compared to what was assumed in the late 1990s, and coal use in many of the new EU Member States has declined substantially more than foreseen at that time. Ireland, Spain and Luxembourg experienced higher energy growth than earlier expected, often due to higher population and economic growth rates. Also, shipping (and associated emissions) is now higher than expected.
Many countries have indicated in their recent national scenarios that they expect an increase in the share of coal in
power generation, as a consequence of the high oil and gas prices and the uncertainties in oil and gas imports. Also, many countries currently expect a further increase in the share of diesel oil in the transport sector, partly because of strong increases in freight transport that result from the enlargement of the EU. These assumptions would lead to higher emissions of SO2, NOx and PM.
At the time of writing this report, countries have not yet provid-ed scenarios that take into account the ambitions expressprovid-ed by the European Commission and the European Council to reduce, in 2020, greenhouse gas emissions by 20% and increase the share of renewables to 20%. Indicative calculations with the GAINS model show that implementation of these goals could result, as a side effect, in a reduction of NOx emissions by 10-15% compared with the national projections. SO2 emissions could even be 40-50% lower.
IV EMISSION CEILINGS OF THE PROTOCOL
44. For 2010, total costs of emission control measures have been estimated at € 70 billon including the estimated € 7 billion incremental costs of the additional requirements of the protocol. Benefits of the Protocol were estimated at € 120-130 billion (when health benefits were valued according to the valua-tion of life years lost)12. Analysis for the EU27 has shown that the costs of meeting the same environmen-tal improvements can be lower when additional abatement measures are taken for ships, and potential emission reductions in non-EU countries are taken into account, and when additional measures are taken to reduce greenhouse gas emissions.
Evaluation
45. Some Parties seem to face difficulties to meet the emission ceilings of the Protocol, while other Parties will substantially overachieve the ceilings with their current legislation. Especially for SO2, the emission ceilings for the majority of the Parties seem to be more than 30% higher than the projected emissions, essentially because coal use turned out to be lower than expected.
46. Especially for those countries that, in the 1990s, transformed from centrally planned to market economies, the economic projections that have been used as the basis for the cost-effectiveness analysis for the Protocol underestimated the far reaching structural changes that have emerged since then. As a consequence, most of the Parties have already lowered their emissions below the Gothenburg ceilings in the period 2000-2005. This trend was enhanced by the environmental legislation that had to be adopted in the course of the accession to the European Union.
12 Holland, M., D. Forster, K. King, Cost-Benefit Analysis for the Protocol to Abate Acidification, Eutrophication and Ground level Ozone in Europe, AEA technology, 1999, VROM-publicatiereeks lucht & energie nr 133
REF G5/3 G5/2 G5/1 UNIFORM PER CAPITA EMISSIONS UNIFORM % REDUCTION
Population exposure index (million persons.ppm.hours)
Costs above REF (Billion EURO/yr)
•
GOTHENBURG PROTOCOL 0 5 10 15 20 200 250 300 350 400 450 500 550 600Figure 8: The Gothenburg Protocol is not the most cost-effective solution, but considerably more cost effective than if the Protocol would have been based on uniform emission reductions or on equal per capita emissions (Source:IIASA)