L
ETTER REPORTMEASUREMENTS IN AND NEAR CONTAINERS DURING FUMIGATION
WITH METHYL BROMIDE
AND DE-GASSING
On behalf of Mr W. Veldman, VROM Inspectorate regio Zuid-West CC
Author(s) Ms T. Knol
Status of report Definitive
Date June 2007 (English publication)
Report number 609021048
RIVM number
This report comprises 13 pages (including this page )
This study was conducted in 2000 on behalf of the former Environmental Inspectorate (Inspectie
TABLE OF CONTENTS
1. INTRODUCTION ... 3
2. AIM ... 3
3. RESEARCH DESIGN... 3
4. EXPERIMENTAL SETUP AND MEASUREMENT POINTS... 3
5. FUMIGATION DATA... 5
6. IMPLEMENTATION ... 5
6.1AIR CHANGE RATE... 5
6.2DETERMINING THE METHYL BROMIDE CONCENTRATION IN THE CONTAINERS AT SIX POINTS IN TIME DURING THE FUMIGATION PERIOD... 5
6.3DETERMINING THE METHYL BROMIDE CONCENTRATION AT THREE MEASUREMENT POINTS OUTSIDE THE CONTAINERS, BUT WITHIN THE SAFETY ZONE OF 50 M SURROUNDING THE FUMIGATION OBJECTS... 6
6.4MONITORING THE METHYL BROMIDE CONCENTRATION USING A PHOTOVAC 10SPLUS PORTABLE GAS CHROMATOGRAPH... 6
7. RESULTS... 6
7.1AIR CHANGE RATE... 6
7.2METHYL BROMIDE CONCENTRATIONS IN THE CONTAINERS... 6
7.4MONITORING THE METHYL BROMIDE CONCENTRATION USING A PHOTOVAC 10SPLUS PORTABLE GAS CHROMATOGRAPH... 8
8. DISCUSSION ... 8
8.1AIR CHANGE RATE... 8
8.2METHYL BROMIDE CONCENTRATIONS IN THE CONTAINERS... 8
8.3METHYL BROMIDE CONCENTRATIONS INSIDE THE SAFETY ZONE... 9
8.4MONITORING THE METHYL BROMIDE CONCENTRATION USING A PHOTOVAC 10SPLUS PORTABLE GAS CHROMATOGRAPH... 9
9. CONCLUSIONS ... 9
1.
INTRODUCTION
On behalf of the Inspectie Milieuhygiëne (Environmental Inspectorate), the Kennis en
Adviescentrum Dierplagen Wateringen (KAD - Expertise and Advisory Centre for Pest Control) conducted research into leakage during the fumigation of containers with methyl bromide. To this end, a test fumigation was conducted with an experimental setup comprising two 40-foot containers inside a warehouse. During the test, it turned out that the measurement apparatus that was used could not measure within the desired concentration range. The Environmental Inspectorate then requested the RIVM, in consultation with the KAD, to conduct the necessary measurements during a new experimental fumigation using the same experimental setup.
2.
AIM
The research has the following aims:
1. To determine the amount of leakage from the containers by measuring the concentration of methyl bromide in the air inside the containers at various points in time during the 24-hour period during which the containers are being fumigated.
2. To determine the concentration of methyl bromide at various distances within a zone of 50 m surrounding the warehouse, both during fumigation and de-gassing.
3.
RESEARCH DESIGN
The first research question will be answered by:
− determining the leak tightness of de containers by measuring the air change rate using the Miran 1B2 infrared analyzer and sulphur hexafluoride (SF6) as a tracer gas;
− determining the methyl bromide concentration at two measurement points in the container during six points in time within the 24-hour fumigation period.
The second research question will be answered by:
− determining the methyl bromide concentration at three measurement points within a 50 m zone surrounding the fumigation object averaged over both the entire fumigation period and the first three hours of fumigation;
− monitoring the methyl bromide concentration at two of these three points using a Photovac 10SPlus portable gas chromatograph.
4.
EXPERIMENTAL SETUP AND MEASUREMENT POINTS
Figure 1 is a floor plan of the experimental setup showing the measurement points. Table 1 shows which measurements were conducted at the given measurement points.
Table 1: Measurement points and measurements
Measure-ment points Sampling times during fumigation Sampling times during de-gassing 1B 1h, 2h, 3h, 6h, 12h, 24h after start of fumigation - 1O 1h, 2h, 3h, 6h, 12h, 24h after start of fumigation - 2B 1h, 2h, 3h, 6h, 12h, 24h after start of fumigation - 2O 1h, 2h, 3h, 6h, 12h, 24h after start of fumigation -
L From start of fumigation to 24 h
after first 3 hours of de-gassing
10 From start of fumigation to 24 h
after first 3 hours of de-gassing
50 From start of fumigation to 24 h
after first 3 hours of de-gassing
Figure 1: Experimental fumigation setup with measurement points
1B = measurement point in Container 1 at 50 cm from container ceiling 1O = measurement point in Container 1 at 50 cm from container floor 2B = measurement point in Container 2 at 50 cm from container ceiling 2O = measurement point in Container 2 at 50 cm from container floor
L = measurement point between the containers, at about 30 cm from the warehouse floor 10 = measurement point at 10 m downwind from the containers
50 = measurement point at 50 m downwind from the containers
Warehouse
10 m downwind
50 m downwind
5.
FUMIGATION DATA
The fumigation began on 20 July 2000 at 09:55 hrs. In both containers, methyl bromide was injected to a 45 g/m3 concentration (3 kg methyl bromide in a 66m3 container). On 21 July 2000,
the de-gassing of both containers began at 10:00 hrs by opening the doors of the containers.
6.
IMPLEMENTATION
6.1 AIR CHANGE RATE
Preceding the experimental fumigations on 20 and 21 July 2000, the air change rates for the two containers used in the experiment were determined on 11 July 2000 (Container 1) and on 19 July 2000 (Container 2). To make these measurements, a Miran 1B2 infrared analyzer was placed in the container and was calibrated to measure SF6. A small quantity of SF6 was then
released from a lecture bottle inside the container. The air change rate was calculated from the decline of the SF6 concentration in the closed container; the concentration was monitored by
the Miran 1B2, and the data was stored by a data logger.
6.2 DETERMINING THE METHYL BROMIDE CONCENTRATION IN THE CONTAINERS AT SIX
POINTS IN TIME DURING THE FUMIGATION PERIOD
In both containers, two measurement points were installed, one at approximately 50 cm from the ceiling of the container (B) and one at approximately 50 cm from the wooden floor of the container (O). A Teflon tube was connected to each measurement point and led to the outside through the rubber seal of the container door.
Preceding the sampling, the dead air inside the tube was drawn out for three minutes using an air pump and was collected in a Tedlar bag. Then a set of SKC Petroleum Charcoal tubes (part A and part B) was connected to the tube and charged with air from inside the container (see Figure 2).
Depending on the expected concentration in the container, the tubes were charged for two or more minutes at the pre-selected times. After being charged, the active charcoal tubes were stored at a temperature of -10°C and were eluated within one week after sampling.
container measurement point
in container active charcoal tube, part A active charcoal tube part B Tedlar bag pump Figure 2: Set-up for sampling container air
6.3 DETERMINING THE METHYL BROMIDE CONCENTRATION AT THREE MEASUREMENT
POINTS OUTSIDE THE CONTAINERS, BUT WITHIN THE SAFETY ZONE OF 50 M SURROUNDING THE
FUMIGATION OBJECTS
At locations L, 10, and 50 (see Figure 1), downwind of the container, air samples were taken using active charcoal tubes (SKC Petroleum Charcoal tubes A&B) as follows:
- during the entire fumigation period (24 hrs), and - during the first three hours of the de-gassing period.
After being charged, the active charcoal tubes were stored at -10°C and were eluated within one week after sampling.
6.4 MONITORING THE METHYL BROMIDE CONCENTRATION USING A PHOTOVAC 10SPLUS
PORTABLE GAS CHROMATOGRAPH
A Photovac 10SPlus, calibrated for methyl bromide, was placed at locations 10 and 50 (see Figure 1). During the entire fumigation period, and also during the first three hours of the de-gassing, the methyl bromide concentration in the air was monitored at these two measuring points. The two gas chromatographs each took and analyzed an air sample every 10 minutes, and stored the analysis results. After the measurements were completed, the analysis results were processed by the RIVM.
7.
RESULTS
7.1 AIR CHANGE RATE
Table 2 lists the air change rates that were calculated for the two containers: Table 2: Air change rates
Container Air change rate (h-1)
1 0.389
2 0
7.2 METHYL BROMIDE CONCENTRATIONS IN THE CONTAINERS
Table 3a lists the concentration values for methyl bromide in Container 1. Table 3b lists the concentration values for methyl bromide in Container 2.
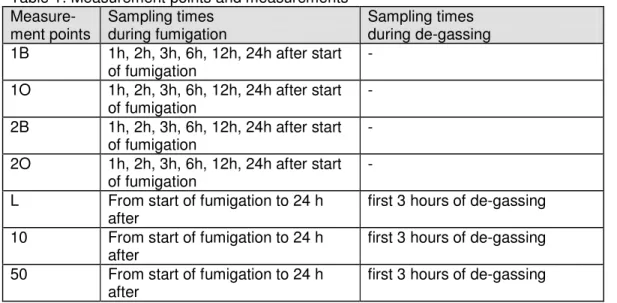
Figure 3 shows the measured methyl bromide concentrations from the two measurement points in the two containers, listed according to the time after the start of fumigation.
Table 3a: Methyl bromide concentrations in Container 1
Measure-ment point
Sampling time (hours after start of
fumigation) Sampling duration (minutes) Methyl bromide concentration (g/m3) 1B 1 2 12.0 1B 2 2 15.1 1B 3 2 17.4 1B 6 2 17.0 1B 12 5 7.6 1B 24 10 2.4 1O 1 2 62.9 1O 2 2 58.9 1O 3 2 48.2 1O 6 2 17.8 1O 12 5 7.0 1O 24 10 2.6
Table 3b: Methyl bromide concentrations in Container 2
Measure-ment point
Sampling time (hours after start of
fumigation) Sampling duration (minutes) Methyl bromide concentration (g/m3) 2B 1 2 4.2 2B 2 2 9.2 2B 3 2 12.4 2B 6 2 23.0 2B 12 2 47.6 2B 24 2 45.0 2O 1 2 74.9 2O 2 2 75.7 2O 3 2 71.2 2O 6 2 66.1 2O 12 2 46.6 2O 24 2 47.0
Figure 3: Progression of the methyl bromide concentrations near the floor and ceiling of containers C1 and C2 during the 24-hour fumigation period.
-10.00 20.00 30.00 40.00 50.00 60.00 70.00 80.00 1 2 3 6 12 24
time (hours) after start of fumigation
M et hy l b ro m id e co nc en tr at io n (g /m 3) C1 Upper C1 Lower C2 Upper C2 Lower
7.3 METHYL BROMIDE CONCENTRATIONS WITHIN THE SAFETY ZONE
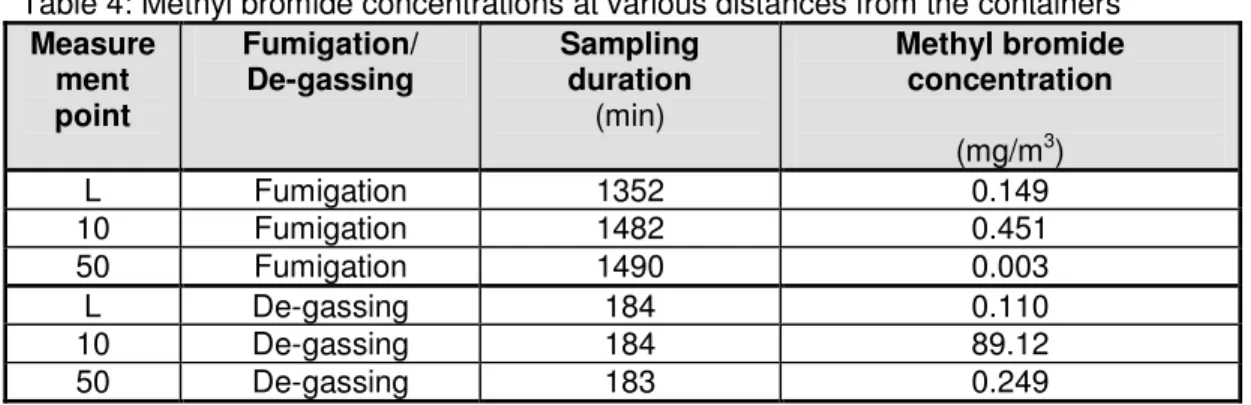
Table 4 shows the concentration values for methyl bromide outside the containers, but within the safety zone, at measurement points L (0.75 m distance), 10 (10 m distance) and 50 (50 m distance).
Table 4: Methyl bromide concentrations at various distances from the containers Measure
ment point
Fumigation/
De-gassing Sampling duration (min) Methyl bromide concentration (mg/m3) L Fumigation 1352 0.149 10 Fumigation 1482 0.451 50 Fumigation 1490 0.003 L De-gassing 184 0.110 10 De-gassing 184 89.12 50 De-gassing 183 0.249
7.4 MONITORING THE METHYL BROMIDE CONCENTRATION USING A PHOTOVAC 10SPLUS
PORTABLE GAS CHROMATOGRAPH
Appendix 1 contains the results of monitoring of the methyl bromide concentration at two distances from the fumigation objects using the Photovac 10SPlus.
In Figure 4, these methyl bromide concentrations (in mg/m3) measured at two distances are
plotted against time.
Figure 4 Methyl bromide concentrations at two distances during fumigation and de-gassing of containers
8.
DISCUSSION
8.1 AIR CHANGE RATE
The measurements of air change rates showed that the natural ventilation can vary greatly between containers. For Container 1, an air change rate of 0.4 per hour was ascertained; this means that in 1 hour, 0.4 (or 40%) of the air in the container is changed. In contrast, Container 2 had an air change rate that approached 0 (measured during 24 hrs); this means that in Container 2, there is virtually no air change.
If both containers are filled with methyl bromide gas, the methyl bromide concentration in Container 1 would decline due to natural ventilation, while the concentration in Container 2 would decrease only due to adsorption of the gas onto the contents of the container, or adsorption or permeation of the gas on or through the rubber seals.
8.2 METHYL BROMIDE CONCENTRATIONS IN THE CONTAINERS
During the first hours of fumigation, large differences in the methyl bromide concentrations were ascertained in the containers measured at 50 cm from the ceiling of the containers and 50 cm from the floor of the containers. In Container 1, after six hours of fumigation the methyl bromide concentrations at the two measurement points in the container were approximately equal. In Container 2, with a much lower air change rate, equal concentrations at the two measurement points were not attained until 12 hours after the start of fumigation.
In Container 1, after 24 hours of fumigation, the methyl bromide concentration at both the upper and lower measurement points in the container was measured at approximately 2.5 g/m3, which
is much lower than the prescribed fumigation concentration of 45 g/m3. In Container 2, a methyl
bromide concentration of approximately 46 g/m3 was ascertained continuously from the time at
which comparable concentration values were measured at the upper and lower measurement points until 24 hours after the start of fumigation.
8.3 METHYL BROMIDE CONCENTRATIONS INSIDE THE SAFETY ZONE
During the 24-hour fumigation period, average methyl bromide concentrations inside the safety zone – downwind of the fumigation objects – were measured which did not exceed the statutory limit value of 1 mg/m3. However, it is conceivable that transient peak concentrations occurred
that were higher than the statutory limit value, especially at the 10 m measurement point, where the average measured value was more than half of the limit value.
During de-gassing, a large exceedance of the statutory limit value of 1 mg/m3 was ascertained
at 10 m downwind from the fumigation objects (average concentration for the first three hours of de-gassing).
8.4 MONITORING THE METHYL BROMIDE CONCENTRATION USING A PHOTOVAC 10SPLUS
PORTABLE GAS CHROMATOGRAPH
The monitoring of the methyl bromide concentrations at 10 m and 50 m from the containers showed that a measurable methyl bromide concentration was occasionally found even at the 50 m distance. At the 10 m distance, the statutory limit value of 1 mg/m3 was regularly
exceeded throughout the fumigation period.
The start of fumigation and the start of de-gassing are clearly shown by the corresponding increased concentrations measured at both 10 m and 50 m.
After the start of fumigation, high concentrations of methyl bromide were measured for several hours at the 10 m distance. This was possibly caused by leakage of methyl bromide, which was injected into the containers with some overpressure, especially from Container 1 in which the methyl bromide concentration fell sharply during the fumigation period.
As measured by the Photovac 10SPlus, the decline of the methyl bromide concentration during de-gassing turned out to be much stronger than the decline during fumigation (see Figure 4). There are two possible causes for this difference:
1) the leakage of methyl bromide after the start of fumigation, described above;
2) without overpressure, the relatively heavy methyl bromide gas could not escape by itself from the container. In this study, the container doors were positioned on the downwind side of the container, and there was no airflow in the container that could disperse the gas.
The results of the Photovac monitoring cannot be compared directly with the concentration values ascertained by sampling on active charcoal. With active charcoal sampling, an average concentration during the entire sampling period was ascertained, while with the Photovac, an air sample was analyzed only every 10 minutes for a period of 10 seconds.
9.
CONCLUSIONS
The two containers used in this study, which were visually identical, displayed very different ventilation behaviours; this can have consequences for the following:
1. the degree of leakage of methyl bromide gas from this type of container (and consequently the effectiveness of the fumigation), and
2. the radius of the safety zone that must be maintained during the fumigation and de-gassing of a container.
The fumigation in Container 1 will be less effective than the fumigation in Container 2; after 24 hours of fumigation only 1/20 of the prescribed concentration of methyl bromide (45 g/m3) was
measured in Container 1, while 46 g/m3 of methyl bromide was still measured in Container 2 at
that time.
The following explanations for the loss of methyl bromide in Container 1 are conceivable: - the natural ventilation of the container (“leakage”)
- adsorption of methyl bromide onto the wooden floor of the container
- adsorption of methyl bromide onto the porous sealing material on the doors of the container.
Container 2 was a new container, with very low natural ventilation, a floor made of smooth plywood, and new sealing material on the doors.
Although no methyl bromide concentrations were measured during the fumigation period that exceeded the statutory limit value, measurable concentrations of methyl bromide were still found up to 50 m downwind from the container. However, within the safety zone, transient higher concentrations of methyl bromide were measured.
During fumigation, it is therefore advisable to maintain the current safety zone of 10 m, or even to expand this zone.
The mixing of methyl bromide gas with the air in the container turned out to take a significant amount of time; during this period, major differences in methyl bromide concentrations could occur between various measurement points inside a container, as was the case in this study between the lower and upper measurement points. If a fumigation period of 24 hours with a specific methyl bromide concentration is prescribed, the time required for gas/air mixing within the container should be added to this 24-hour period.
The mixing can also be negatively affected by the cargo inside the container. The shape, nature and dimensions of the cargo could create obstacles for a balanced distribution of the methyl bromide gas through the space inside the container.
The de-gassing period appears to entail the most risks for the surroundings: during the first three hours of de-gassing, very high average concentrations of methyl bromide were measured 10 m downwind from the fumigation objects. These values were much higher than the statutory limit value. Moreover, compared to the values measured during fumigation, during de-gassing a clear increase was measured at 50 m downwind. It is therefore advisable to expand the current safety zone of 10 m to 50m during de-gassing.
10. RECOMMENDATIONS
This study took place under beneficial weather conditions: approximately 20 ºC, no precipitation and a moderate wind. If there is a situation with wind-still, foggy weather and a fumigation object that is not especially airtight, (which cannot be determined by visual inspection), it is conceivable that within a radius of 10 m from this fumigation object, harmful concentrations of methyl bromide could occur. The current practice, which allows activities to be conducted several times per year at distances up to the 10 m safety zone, should therefore be brought up for discussion, for both fumigation and de-gassing.
In addition, it is advisable to conduct follow-up research on the following questions:
- Is a container actually gas-free after it is declared gas-free based on a PID measurement (standard practice at fumigation companies)?
- How long is methyl bromide retained in the cargo of a container after the container is declared gas-free?
APPENDIX 1A CONCENTRATIONS OF METHYL BROMIDE AT 10 M
Date/time MeBr (mg/m3) 20-7-00 9:50 0.004 20-7-00 10:00 208.56 20-7-00 10:10 32.67 20-7-00 10:20 18.67 20-7-00 10:30 79.56 20-7-00 10:40 42.64 20-7-00 10:50 66.56 20-7-00 11:00 7.70 20-7-00 11:10 2.89 20-7-00 11:20 65.24 20-7-00 11:30 13.64 20-7-00 11:40 61.76 20-7-00 11:50 27.54 20-7-00 12:00 82.28 20-7-00 12:10 74.44 20-7-00 12:20 95.72 20-7-00 12:30 39.27 20-7-00 12:40 3.71 20-7-00 12:50 23.96 20-7-00 13:00 10.44 20-7-00 13:10 84.40 20-7-00 13:20 26.55 20-7-00 13:30 40.36 20-7-00 13:40 50.72 20-7-00 13:50 28.20 20-7-00 14:00 28.62 20-7-00 14:10 58.48 20-7-00 14:20 47.64 20-7-00 14:30 80.04 20-7-00 14:40 52.60 20-7-00 14:50 24.32 20-7-00 15:00 28.48 20-7-00 15:10 24.38 20-7-00 15:20 19.35 20-7-00 15:30 42.56 20-7-00 15:40 22.24 20-7-00 15:50 26.76 20-7-00 16:00 6.92 20-7-00 16:10 22.22 20-7-00 19:30 14.40 20-7-00 19:40 8.72 20-7-00 19:50 16.60 Date/time MeBr (mg/m3) 20-7-00 20:00 6.73 20-7-00 20:10 7.81 20-7-00 20:20 13.73 20-7-00 20:30 2.70 20-7-00 20:40 11.18 20-7-00 20:50 8.88 20-7-00 21:00 9.86 20-7-00 21:10 2.63 21-7-00 0:50 0.39 21-7-00 1:00 0.24 21-7-00 1:50 1.24 21-7-00 2:00 0.83 21-7-00 2:20 1.52 21-7-00 2:30 0.44 21-7-00 2:40 0.34 21-7-00 2:50 0.52 21-7-00 3:00 0.72 21-7-00 3:10 2.03 21-7-00 3:20 0.66 21-7-00 3:30 1.70 21-7-00 3:40 0.26 21-7-00 3:50 1.98 21-7-00 4:00 3.50 21-7-00 4:10 1.60 21-7-00 4:20 0.61 21-7-00 4:30 1.39 21-7-00 4:40 0.27 21-7-00 4:50 1.16 21-7-00 5:00 0.91 21-7-00 5:10 2.06 21-7-00 5:20 1.81 21-7-00 5:30 0.30 21-7-00 5:40 0.10 21-7-00 5:50 0.70 21-7-00 6:00 0.43 21-7-00 6:10 0.62 21-7-00 6:20 0.23 21-7-00 6:30 0.16 21-7-00 6:40 0.54 21-7-00 6:50 0.09 21-7-00 7:00 0.65 21-7-00 7:10 1.72 Date/time MeBr (mg/m3) 21-7-00 7:20 0.43 21-7-00 7:30 0.61 21-7-00 7:40 1.63 21-7-00 7:50 0.74 21-7-00 8:00 0.52 21-7-00 8:10 4.04 21-7-00 8:20 0.95 21-7-00 8:30 2.65 21-7-00 8:40 0.40 21-7-00 8:50 1.48 21-7-00 9:00 1.42 21-7-00 9:10 1.68 21-7-00 9:20 0.64 21-7-00 9:30 1.14 21-7-00 9:40 1.10 21-7-00 9:50 2.61 21-7-00 10:00 1.45 21-7-00 10:10 454.00 21-7-00 10:20 85.72 21-7-00 10:30 22.76 21-7-00 10:40 15.78 21-7-00 10:50 5.89 21-7-00 11:00 19.44 21-7-00 11:10 2.42 21-7-00 11:20 1.43 21-7-00 11:30 0.62 21-7-00 11:40 0.98 21-7-00 11:50 0.32 21-7-00 12:00 0.43 21-7-00 12:10 0.52 21-7-00 12:20 0.26 21-7-00 12:30 0.22 21-7-00 12:40 0.43 21-7-00 12:50 0.43 21-7-00 13:00 0.16 21-7-00 13:10 0.30[MeBr]average, fum = 18 mg/m3
A
PPENDIX1B
C
ONCENTRATIONS OF METHYL BROMIDE AT50
M date/time MeBr (mg/m3) 20-7-00 9:55 0 20-7-00 10:05 0.65 20-7-00 10:15 0.66 20-7-00 10:25 0.68 20-7-00 10:35 1.03 20-7-00 10:45 0 20-7-00 10:55 0 20-7-00 11:05 0 20-7-00 11:15 0 20-7-00 11:25 0 20-7-00 11:35 0.52 20-7-00 11:45 0 20-7-00 11:55 0 20-7-00 12:05 0 20-7-00 12:15 0 20-7-00 12:25 0 20-7-00 12:35 0 20-7-00 12:45 0 20-7-00 12:55 0 20-7-00 13:05 0 20-7-00 13:15 0.53 20-7-00 13:25 0 20-7-00 13:35 0 20-7-00 13:45 0 20-7-00 13:55 0.48 20-7-00 14:05 0.45 20-7-00 14:15 0.46 20-7-00 14:25 0.40 20-7-00 14:35 0.46 20-7-00 14:45 0.41 20-7-00 14:55 0.42 20-7-00 15:05 0.42 20-7-00 15:15 0.42 20-7-00 15:25 0 20-7-00 15:35 0.47 20-7-00 15:45 0.43 20-7-00 15:55 0.47 20-7-00 16:05 0 20-7-00 16:15 0.50 20-7-00 16:25 0.47 20-7-00 16:35 0 20-7-00 16:45 0 20-7-00 16:55 0 20-7-00 17:05 0.50 20-7-00 17:15 0 20-7-00 17:25 0 20-7-00 17:35 0 20-7-00 17:45 0 20-7-00 17:55 0 date/time MeBr (mg/m3) 20-7-00 18:05 0 20-7-00 18:15 0 20-7-00 18:25 0 20-7-00 18:35 0 20-7-00 18:45 0 20-7-00 18:55 0 20-7-00 19:05 0 20-7-00 19:15 0 20-7-00 19:25 0 20-7-00 19:35 0 20-7-00 19:45 0 20-7-00 19:55 0 20-7-00 20:05 0 20-7-00 20:15 0 20-7-00 20:25 0 20-7-00 20:35 0 20-7-00 20:45 0 20-7-00 20:55 0 20-7-00 21:05 0 20-7-00 21:15 0 20-7-00 21:25 0 20-7-00 21:35 0 20-7-00 21:45 0 20-7-00 21:55 0 20-7-00 22:05 0 20-7-00 22:15 0 20-7-00 22:25 0 20-7-00 22:35 0 20-7-00 22:45 0 20-7-00 22:55 0 20-7-00 23:05 0 20-7-00 23:15 0 20-7-00 23:25 0 20-7-00 23:35 0 20-7-00 23:45 0 20-7-00 23:55 0 21-7-00 0:05 0 21-7-00 0:15 0 21-7-00 0:25 0 21-7-00 0:35 0 21-7-00 0:45 0 21-7-00 0:55 0 21-7-00 1:05 0 21-7-00 1:15 0 21-7-00 1:25 0 21-7-00 1:35 0 21-7-00 1:45 0 21-7-00 1:55 0 21-7-00 2:05 0 date/time MeBr (mg/m3) 21-7-00 2:15 0 21-7-00 2:25 0 21-7-00 2:35 0 21-7-00 2:45 0 21-7-00 2:55 0 21-7-00 3:05 0 21-7-00 3:15 0 21-7-00 3:25 0 21-7-00 3:35 0 21-7-00 3:45 0 21-7-00 3:55 0 21-7-00 4:05 0 21-7-00 4:15 0 21-7-00 4:25 0 21-7-00 4:35 0 21-7-00 4:45 0 21-7-00 4:55 0 21-7-00 5:05 0 21-7-00 5:15 0 21-7-00 5:25 0 21-7-00 5:35 0 21-7-00 5:45 0 21-7-00 5:55 0 21-7-00 6:05 0 21-7-00 6:15 0 21-7-00 6:25 0 21-7-00 6:35 0 21-7-00 6:45 0 21-7-00 6:55 0 21-7-00 7:05 0 21-7-00 7:15 0 21-7-00 7:25 0 21-7-00 7:35 0 21-7-00 7:45 0 21-7-00 7:55 0 21-7-00 8:05 0 21-7-00 8:15 0 21-7-00 8:25 0 21-7-00 8:35 0 21-7-00 8:45 0 21-7-00 8:55 0 21-7-00 9:05 0 21-7-00 9:15 0 21-7-00 9:25 0 21-7-00 9:35 0 21-7-00 9:45 0 21-7-00 9:55 0 21-7-00 10:05 0 21-7-00 10:15 1.09date/time MeBr (mg/m3) 21-7-00 10:25 0 21-7-00 10:35 0 21-7-00 10:45 0 21-7-00 10:55 0 21-7-00 11:05 0 21-7-00 11:15 0 21-7-00 11:25 0 date/time MeBr (mg/m3) 21-7-00 11:35 0 21-7-00 11:45 0 21-7-00 11:55 0 21-7-00 12:05 0 21-7-00 12:15 0 21-7-00 12:25 0 21-7-00 12:35 0 date/time MeBr (mg/m3) 21-7-00 12:45 0 21-7-00 12:55 0 21-7-00 13:05 0 21-7-00 13:15 0 21-7-00 13:25 0
[MeBr]average, fum =0.07 mg/m3