The Common Agricultural Policy:
Possible contribution towards achieving
biodiversity targets for Dutch agricultural areas
The Common Agricultural Policy: Possible contribution towards achieving biodiversity targets for Dutch agricultural areas
© Netherlands Environmental Assessment Agency (PBL) The Hague/Bilthoven, 2010
Corresponding author: henk.vanzeijts@pbl.nl
Parts of this publication may be reproduced, providing the source is stated, in the form: Neth-erlands Environmental Assessment Agency, the publication title.
The Netherlands Environmental Assessment Agency (PBL) is the national institute for strate-gic policy analysis in the field of environment, nature and spatial planning. We contribute to improving the quality of political and administrative decision-making by conducting outlook studies, analyses and evaluations in which an integrated approach is considered paramount. Policy relevance is the prime concern in all our studies. We conduct solicited and unsolicated research that is both independent and always scientifically sound.
Netherlands Environmental Assessment Agency
Office The Hague Office Bilthoven
PO Box 30314 PO Box 303
2500 GH The Hague 3720 AH Bilthoven
The Netherlands The Netherlands
Telephone: +31 (0)70 328 8700 Telephone: +31 (0)30 274 2745 Fax: +31 (0)70 328 8799 Fax: +31 (0)30 274 4479 E-mail: info@pbl.nl
Possible contribution towards achieving biodiversity targets for Dutch agricultural areas 3
1 Introduction
In discussions on reform of the Common Agricultural Policy (CAP) of the EU, currently, the general opinion is that payments (made to farmers) within the framework of the CAP should be better linked to the provision of public goods. These public goods include, for example, biodiversity, landscape, environment, and climate. The objective of establishing such an improved link could be implemented in the CAP in several ways: by applying the objective to the direct payments to farmers under the single-payment scheme (resembling the current cross-compliance scheme), by defining certain areas where farmers receive flat-rate payments including any additional requirements, or by awarding payments for additional agri-environmental measures.
However, in this paper, the focus is on approaching the challenges surrounding public goods from a slightly different angle. Instead of determining how CAP instruments could contribute to the supply of certain public goods, we have tried to identify the need for these goods. Subsequently, we assessed what would be required in terms of agricultural land, agricultural measures, and their associated costs. This information could contribute to current policy debates on reforming both the CAP and the EU budget.
This paper by the PBL Environmental Assessment Agency mainly provides an assessment of the area and budget requirements for achieving biodiversity objectives in agricultural areas in the Netherlands. This study is meant to contribute to the actual conceptualisation of future policies. The results have been placed within the context of current agricultural areas and spending within the framework of biodiversity-related measures within the CAP.
The paper focuses on biodiversity only. It is based on parts of the Dutch report Contribution of the CAP to achieving environmental, nature and landscape policy targets – Exploration of the possible use of the Common Agricultural Policy which was published in 2010 (see www.pbl.nl).
Biodiversity in agricultural areas has declined over the past decades (Figure 1). The root cause is that, for agriculture, production costs are generally lower in an efficiently organised landscape, while important natural values thrive more in old cultural landscapes. Species numbers have declined because of more intensive use of agricultural areas, and environmental conditions have been tailored to the demands of agriculture in such a way that production has increased. In the Netherlands, meadows and other marginal lands (less suitable for farming) hardly exist anymore. In addition, small landscape elements, such as wooded banks, small ditches, and hedgerows, which provide a habitat for species living in agricultural areas, mostly have disappeared. Finally, efficiency in agricultural production has led to less residual yield, which, left out on the field, is an important food source for many species. Because of these circumstances, less species survive. The decline in biodiversity in agricultural areas is also visible in other EU countries (EEA, 2007).
2 Methods
2.1 General methodology
In order to assess the need for biodiversity as a public good, we first made an inventory of the policy goals as set by the former Dutch Ministry of Agriculture, Nature and Food Quality (LNV), based on policy objectives at EU and national levels. We assumed these policy objectives to reflect a social demand for this public good.
In a second step, we assessed the land area and the (type and level of) management necessary to achieve these policy objectives. The considered land requirements were based on various sources. In some cases, current land requirements, as implemented in agri-environmental measures, were used as a starting point. In other cases, the current population distribution of species was leading, and estimates were made (in percentages) of the various habitat requirements, for example, regarding foraging and shelter.
In a third and final step, we analysed the financial consequences of the agri-environmental measures. These were mainly based on costs of current, similar agri-environmental measures. Where no current data was
The Common Agricultural Policy:
Possible contribution towards achieving
available we used newly calculated figures that indicate what the various measures would cost in foregone income. For most area parameters we identified both a low and a high estimate. The low estimate refers to core areas. These core areas contain a high density of a particular bird population and would be large enough to achieve the policy objectives, but only if measures were sufficiently effective and their implementation by farmers close to 100%. The high estimate refers to a countrywide approach, with more farmers participating, but with lower contributions per farmer. 2.2 Assumptions
The results section below presents our analysis of which circumstances biodiversity would require in agricultural areas. For correct interpretation of the results, the following assumptions must be considered:
The analysis has not taken any overlap between measures into account; not between the presented biodiversity measures, nor with other measures that could be taken to provide public goods such as climate and landscape. This is elaborated on in the discussion.
In our calculation of the area and budget requirements, a continuation of the current situation in agriculture and rural areas was assumed. However, the upcoming CAP reform and other economic and societal changes may cause significant changes in agricultural structures, such as smaller or larger farms, more or fewer farms, and other structural changes such as in farm incomes. The need for measures to meet biodiversity goals may change if future structures would be better or worse for biodiversity than they are currently. Moreover, payment levels may very well change, for example, because farm incomes per hectare are not stable over time due to varying agricultural prices, in turn causing the amount of foregone income to vary, as well.
Closely related to the above assumption is the fact that we have not included any overlap with other payment
schemes (e.g. single payment scheme, and financial aid to farmers in Less Favoured Areas (LFA)).
All calculations have been based on the ‘income foregone’ principle.
Cost estimates refer to payments only; they do not include transaction costs.
3 Results
Dutch nature policy, which also includes agricultural areas, has three main objectives:
To protect biodiversity in rural areas by conservation, recovery and development of nature and sustainable use of rural areas (LNV, 2000; LNV, 2006);
To halt biodiversity decline by 2010 (LNV, 2007);
To establish sustainable conditions by 2020, to ensure the survival or return of all species and populations that were present in the Netherlands in 1982 (LNV, 2000; LNV, 2006). Policymakers have translated these main objectives to more operational agri-environmental measures, in general, and for meadow birds in particular. In addition, a policy on agricultural biodiversity was implemented in 2004, with the main objective of making better agricultural use of organisms and biological processes. The second programme of the government multi-annual programme on Vital Rural Areas (Agenda Vitaal Platteland) also identifies policy targets for 2013, including measures for 15,000 kilometres of field margins. Finally, on pan-European level, the Netherlands committed to identifying and safeguarding High Nature Value farmlands. Identification of these areas is currently taking place.
The section below provides details on halting the decline (the second of the three main objectives) in meadow birds, bird communities on cropland or mixed farmland, and flora. This second main objective could be translated into measures, The average number of species of vascular plants, breeding birds and butterflies in natural areas and in agricultural areas between 1990 and 2005, compared to the 1975-1990 period (PBL, 2009). Figure 1 Vascular plants Breeding birds Butterflies -40 -20 0 20 40 %
Nature conservation areas larger than 100 hectares
Changes in target species numbers between 1975 - 1990 and 1990 - 2005
Vascular plants Breeding birds Butterflies -40 -20 0 20 40 %
Possible contribution towards achieving biodiversity targets for Dutch agricultural areas 5 to a certain extent, but for the other main objectives this
would be more complicated. However, progress in achieving the second main objective would also lead to progress in the other objectives. Meadow birds (Section 3.1), other farmland bird communities (Section 3.2) and flora (Section 3.3) are discussed in succession. Specific measures regarding butterflies have not been taken into consideration. However, butterflies may benefit from measures taken for birds and flora. Section 3.4 provides an assessment of the costs to achieve these policy objectives.
3.1 Meadow birds
Pasture is the main habitat for birds such as the Black-tailed Godwit (Limosa limosa) and the Common Redshank (Tringa totanus). The Netherlands accommodates a large part of the European population of these meadow birds because of its large pasture areas. However, meadow birds are in decline in rural areas.
The policy objective was to halt biodiversity decline by 2010, but this target will not be achieved. In this section, a set of on-farm measures is suggested to halt the decline in meadow birds by no later than 2020 (the end of the next CAP period). For meadow birds, the environmental requirements are foremost related to having enough land available for the juveniles to find food and shelter, next to nesting opportunities and food availability. The subsidy scheme for agricultural nature conservation includes ten measures for the benefit of meadow birds, such as postponement of the first mowing date, nest protection, restriction of manure application, and leaving certain areas unmowed to serve as places of refuge. Recently, a ‘pasture plan’ has been added to the scheme, which will enable farmers to attune their
management activities to those of neighbouring farmers (so-called mosaic management).
Current policies on meadow birds are mainly aimed at the Black-tailed Godwit. In this section, the same starting point is adopted, also because many studies on the environmental requirements of this species have been carried out. According to current insights, each pair of Black-tailed Godwits needs an average land area of about 1.4 hectares of sufficient quality to raise their offspring. In addition, in the areas where they breed and forage, these birds also require a certain groundwater table and soil type (Schotman et al., 2007). For a sustainable population of Black-tailed Godwits, an area management plan is necessary that holds 20% of the area under very firm management (no mowing until after 15 June), 20% under firm management (with a less rigid first mowing date), and 60% under minimal management (nest protection only). This last type of grassland management leads to the same yields as under current, average farming practice. These lands may serve as feeding habitat for juveniles and provide shelter, if accessible. The average annual costs of these management measures are estimated at 250 euros per hectare (Schotman and Melman, 2006).
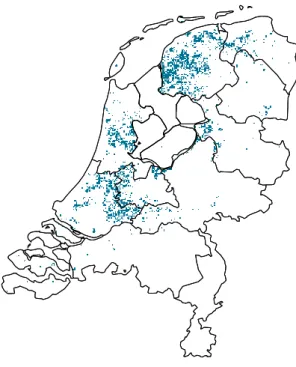
For meadow birds, specific policy targets have been set regarding the number of hectares. The objective of the Dutch meadow birds treaty (Weidevogelverbond, Laporte and De Graaff, 2006 ), which is to have 250,000 hectares available to the Black-tailed Godwit, could be considered as the upper boundary (Schotman et al., 2006). However, halting the decline in the Black-tailed Godwit population may also be achieved within a smaller area, by reducing the area that is currently managed in accordance with policy measures, to the
Source: MNP (2007)
Figure 2 Habitat areas of the Black-tailed Godwit
size of only the main habitat. Main habitats are the areas that hold high numbers of a particular bird species. By identifying such main habitats, the objective may be achieved at lower cost. Current agri-environmental schemes include 90,000 hectares of land under meadow bird management. However, this is not sufficient to halt the decline in meadow birds. In this study, therefore, we used a lower boundary of 120,000 hectares (MNP, 2007b). Within this 120,000 hectares, the decline could only be halted if delineation of the area would be sufficiently clear and (nearly) all farmers would implement the measures. The core area of the Black-tailed Godwit (120,000 ha) overlaps that of other meadow birds by less than 25%. For a larger habitat area of 250,000 hectares, this overlap would be greater.
With these measures, the objective of halting biodiversity decline could be achieved for meadow birds (particularly, Black-tailed Godwits). However, reaching this target is surrounded with many uncertainties. The measures that are currently in place have proven to be insufficient (Kleijn et al., 2001; Melman et al., 2008). Therefore, it is important to monitor implementation of measures and development of bird populations, in order to optimise future measures. 3.2 Bird communities on cropland or mixed farmland Until the mid-20th century, birds in open landscapes were found on both pastures and croplands. As a result of intensification of grassland use (increased fertiliser use, higher grass yields, higher mowing frequency), some bird species in open landscapes now mainly are found in cropland areas. Examples are the Corn Bunting (Miliaria calandra), Skylark (Alauda arvensis) and Yellow Wagtail (Motacilla flava). These species are currently in decline because of intensification of arable farming. This intensification includes: increased use of pesticides and fertilisers;
mono-cropped fields with a dense crop structure, which are less accessible to farmland birds for breading and foraging and contain less weeds and insects;
disappearance of hedgerows, wooded banks, ditches and other landscape elements;
replacement of summer wheat with winter wheat and green maize (fodder);
loss of mosaic landscapes, in space and over time, as a consequence of separation of croplands and pastures, increase of farm and field scale, and more uniform landscapes.
Having both a suitable breading habitat and a winter habitat is essential to these farmland birds. The causes of their decline depend on the species, since each species has its preferences for nesting and shelter and summer and winter diets (Dochy and Hens, 2005). For example, Linnets (Carduelis cannabina) and Turtle Doves (Streptopelia turtur) in England have problems finding enough food during the breeding season. The survival of the Partridge is mainly dependent on whether or not Partridge juveniles will be able to find enough insects in their first days. Buntings experience food shortages mainly in winter, because of lack of a seed-rich habitat. Skylarks have trouble finding suitable and safe nesting sites in summer, and finding enough food in winter.
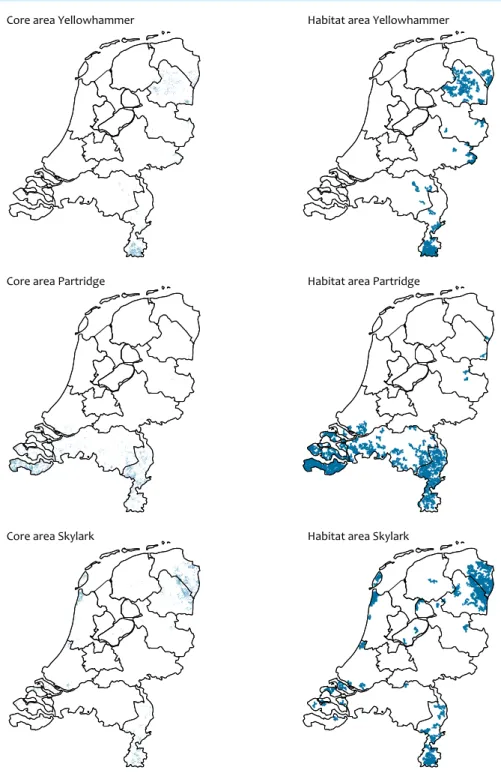
Commissioned bij the PBL, Bos et al. (2010) composed a package of measures that could halt the decline in these bird species. In a modelling exercise, that study determined
which of the factors that influence populations could be improved, including the number of nests per year, success rate and survival of juveniles and winter survival rates. This was determined for Partridges, Skylarks and Yellowhammers, which are good indicator species for these farmland birds. However, as was the case for meadow birds (with the Black-tailed Godwit), the main habitats of these indicator species do not overlap completely, and nor is that the case for other farmland birds.
The measures aimed at the indicator species are translated to a more generic set of measures according to three general requirements for other farmland birds: nesting opportunities and shelter, sufficient number of insects close to nesting sites, and sufficient amounts of seeds and grains to serve as winter diet. According to Bos et al. (2010), this results in four categories of measures:
no application of pesticides to field margins around cereal crops (here the crop type is maintained);
partial replacement of regionally dominating crops (fodder maize or winter wheat) with summer cereals (here crops are replaced with other crop types);
wide, botanical field margins set up with management tailored to birds, with alternating short and rough vegetation (here crops are removed);
growing winter feed crops (here, crop types are changed or supplemented).
Bos et al. (2010) have indicated the cost margins for these measures. The table shows two spatial variants: countrywide implementation of measures (i.e. everywhere where birds of a certain species are found) and implementation in core areas (areas with favourable living conditions for a certain bird species, see Figure 3). With a countrywide implementation, costs would be substantially higher than when only implemented in core areas, while the effect (i.e. halting the decline in national bird populations) would remain the same. The two implementation variants are considered to be the extremes.
Countrywide implementation would lead to large area demands (leaving up to 10% less land available for agricultural production) and, therefore, is considered unrealistic.
Implementation in core areas would demand a relatively large amount of bird protection measures in a small area. This is difficult to achieve, in actual practice, because of difficulties regarding delineation of the areas and implementation by local farmers. Thus, a larger area would be necessary to come to an effective package of measures. Table 1 presents (rounded) mean figures on these margins. The lower end of the margin represents implementation of measures in core areas, the upper end indicates countrywide implementation.
The measures could make an important contribution to the policy objective of halting biodiversity decline, specifically in farmland birds. If the policy were to succeed in implementing measures in the areas important to these farmland birds, and if this would involve enough farmers, the decline could be brought to a halt. Experience in the Netherlands has been limited, but positive. An example is the conservation
Possible contribution towards achieving biodiversity targets for Dutch agricultural areas 7 of Montagu’s Harriers (Circus pygargus) in the province of
Groningen (Dijksterhuis and Hut, 2009). 3.3 Flora in agricultural areas
Over the past decades, floral diversity in agricultural areas has declined. The average number of vascular plants per square kilometre is declining – in contrast to the situation in nature areas, where this number, on average, is increasing (Figure 1). The decline is caused by more efficient use of the land, which leaves less space available to plant species other than
the crops that are being cultivated. It is possible to improve the situation by making soils poorer and/or wetter, as is being done in botanic management of pastures. Another possibility is to use field margins more extensively, and/or to sow herbs. It is difficult to say which measures could halt the decline in (vascular) plants. Moreover, it is not clear if and to what extent biodiversity policy objectives apply to plants in rural areas, because these are mostly of common species. The survival of these species does not depend on their presence in
Habitat areas and core areas (smaller than overall habitats) of Partridges, Skylarks and Yellowhammers, based on modelled predictions of regional densities (Bos et al., 2010).
Figure 3 Bird communities on cropland or mixed farmland, 2000 – 2009
Core area Yellowhammer Habitat area Yellowhammer
Core area Partridge Habitat area Partridge
rural areas. Therefore, in this study we have adopted minimal measures for (vascular) plants:
Continuation of the areas currently under botanical management within the framework of the existing subsidy scheme for agricultural nature conservation (i.e. agri-environmental scheme). This land is mainly located in heterogeneous areas with varying environmental conditions. Under this botanical management, the focus is on preservation of the current biodiversity. In 2008, this measure comprised around 22,000 hectares, with 25 million euros in annual management costs (Dienst Regelingen, 2009).
The target for agricultural biodiversity is to establish 15,000 kilometres of field margins, as identified in the government programme on Vital Rural Areas (Agenda voor een Vitaal Platteland, LNV, 2006). For this target, the focus is on creating more diversity, especially in the homogeneous coastal areas with clay soils. Many plant species in these areas are in decline or have disappeared, due to more uniform management (eutrophic) including that of the field margins. With an assumed field margin of 4 to 10 metres, the costs would be about 5 to 10 million euros, annually.
Measures taken within the framework of the protection of meadow birds and (especially) other farmland birds also contribute to flora diversity.
A combination of these measures may be insufficient to halt the decline in plant species. Additional measures could be those of less intensive grazing in field margins, creating small ponds on grasslands, less or no fertiliser and pesticides applied on headland (where machines come more often and plant growth is restricted anyway), creation of small plots with wild plants on crop fields, and the planting of shrubbery along field edges or permanent fallow edges (Schrijver et al., in prep.).
3.4 Results in figures
Tables 1 and 2 show the proposed measures in detail. Measures aimed at meadow birds make up about 65 to 75% of the total area, with a 25 to 40% budget share (depending on the approach: countrywide or main habitat). Generally, these measures affect all of a farmer’s land, but only to a small extent. Therefore, per-hectare reimbursements for foregone income are low, compared to the payments that relate to arable land. A significant part of the payments that relate to arable land includes other (less profitable) cropping or even land devoted to other uses, such as field margins.
To achieve the biodiversity policy targets for the meadow birds in the Netherlands, between 15% (main habitat only) and 32% (countrywide) of national pastures are projected to be needed. For bird communities on cropland, this is between 1 and 9%, a considerable difference. However, this does not mean that in the latter case less farmers are involved. Farmers may implement measures aimed at meadow birds, and apply them to certain parts of their land, or even their complete farm. For cropland birds, the measures only apply to a small part of a farm, for example, the field margins.
The total annual budget to cover these measures is between 76 and 233 million euros. To put this figure in perspective, the
current budget for the Netherlands, in the 2007-2013 period, in axis 2 of pillar 2 (improving environment and countryside, i.e. the agri-environmental measures), is 41.2 million euros annually: half of which comes from the European Agricultural Fund for Rural Development (EAFRD), and the other half from co-financing. Direct payments to farmers in the Netherlands amount to around 800 million euros annually.
All these measures do influence agricultural production in the Netherlands. Postponing the first mowing date to 15 June or beyond, will reduce grass production by 31%1. Assuming
that less strict postponement applies to another 20% of the area, resulting in a loss of 16%, these measures reduce grass harvests by approximately 10%. Taking into account that 15 to 32% of this area is subject to meadow bird measures, this would reduce harvests by 1.5 and 3.2%. This harvest loss has to be compensated by production elsewhere (either in the form of hay or other feed, obtained from elsewhere, or through a complete shift in production). Such a situation may, thus, result in negative effects on biodiversity in other areas or countries. The same effects are caused by measures that affect cropland. Field margins (0.6-5.1% of the arable area), especially, have a large impact, since these areas are no longer used for production (these production losses could be slightly under 0.6 to 5.1%, since the margins are possibly less productive than other farmland). Other measures, such as replacement of crops by summer cereals or botanical grassland management,also have an effect on yields, but since these lands stay in production, the yield decrease per hectare is much lower.
4 Discussion
The proposed measures cover 15 to 32% of pastures in the Netherlands. This is quite a significant share. However, production on these lands is only slightly hampered and not totally lost. The main challenge is to create the willingness among farmers to adopt and implement these measures, so that the areas covered by measures do make a significant contribution to certain bird populations. This would require a large number of farms in core areas participating in the scheme, and preferably also farms adjacent to each other. Reasons for farmers to not adopt or implement
agri-environmental measures would be, for example, bureaucracy and too low payments. The latter could not easily be rectified, since payments cannot exceed the amount in foregone income, as the European Commission would consider this a form of unlawful state aid.
As already indicated in Section 2, for the presented calculation, any overlap or synergy between biodiversity measures has not been taken into account. Nor does the calculation include overlap between the presented biodiversity measures and other measures that may be taken in relation to the provision of public goods such as climate and landscape.
The measures related to meadow birds and other farmland birds do not overlap, since these measures apply to different land-use types. However, measures relating to flora may
Possible contribution towards achieving biodiversity targets for Dutch agricultural areas 9 actually contribute to the protection of birds (and vice versa).
For example, the management of 15,000 kilometres of field margins could incorporate field margins for farmland birds. This would reduce annual costs by between 5 and 10 million euros.
Overlap between biodiversity measures and other measures taken to provide public goods, such as landscape, nature areas and water, is also very well possible. The measures aimed at meadow birds may overlap with measures for lands-cape and Natura 2000, measures aimed at cropland birds may also be beneficial to water quality and landscape, and flora measures could overlap with those aimed at landscape, water quality and Natura 2000.
As mentioned earlier, this analysis was made under the assumption of unchanging circumstances. However, this is very unlikely, for several reasons. To begin with, the Common Agricultural Policy is subject to change, which includes changes to the direct payments made to farmers (subject to cross-compliance), and the additional payments
to those operating in the Less Favoured Areas (LFA). These possible changes may influence management and structures of farms influencing biodiversity as well as the basis on which payments are calculated. In the longer term, this may change estimations of the budget needed to pay farmers for taking biodiversity measures, considerably. However, as such changes generally occur at a rather slow pace, calculations may be considered valid for the near future.
Costs of farm measures for achieving biodiversity policy targets in agricultural areas
ha euros/(ha*yr) million euros/yr Biodiversity measures Core area countrywide Core areaHabitats countrywide Core areaHabitats countrywideHabitats
Meadow birds
Various measures of Black-tailed Godwit management (including postponed mowing date), farm measures geared to those taken on other farms (mosaic management)
120,000 250,000 250 250 30 63
Bird communities on cropland or mixed farmland
No application of pesticides along
field margins of cereal fields 2,550 17,700 1037 664 3 12 Replacement of regionally dominating crops (fodder
maize or winter wheat) with summer cereals. 2,150 16,200 750 994 2 16 Set up of wide botanical field margins 6,000 51,000 1,760 1,903 11 97
Growing winter feed crops 600 6,000 1,745 1,745 1 10
Flora
Continuation of botanical grassland management 22,000 22,000 1,136 1,136 25 25
Management of 15,000 km of field margins 6,000 15,000 833 667 5 10
total 159,300 377,900 476 616 76 233
Table 1
Land use associated with farm biodiversity measures (applied in core areas or countrywide)
% of area concerned % of agricultural area The Netherlands Biodiversity measures Core area countrywideHabitats Core area countrywideHabitats
Meadow birds % of grassland
Various measures of Black-tailed Godwit management (including postponed mowing), farm measures geared to those taken on other farms (mosaic management)
15% 32% 3.6% 7.4%
Bird communities on cropland or mixed farmland % of arable land
No application of pesticides along field margins of cereal fields 0.3% 1.8% 0.08% 0.5%
Replacement of regionally dominating crops (fodder
maize or winter wheat) with summer cereals 0.2% 1.6% 0.1% 0.5% Set up of wide botanical field margins 0.6% 5.1% 0.2% 1.5%
Growing winter feed crops 0.06% 0.6% 0.02% 0.2%
Flora % of agricultural land
Continuation of botanical grassland management 1.2% 1.2% 0.7% 0.7%
Management of 15,000 km of field margins 0.3% 0.8% 0.2% 0.4% % of agricultural land
total 8.8% 20.8% 4.7% 11.2%
References
Bos J.F.F.P., Sierdsema H., Schekkerman H., Van Scharenburg C.W.M. (2010) Een Veldleeuwerik zingt niet voor niets. Een schatting van kosten van maatregelen voor akkervogels in de context van een veranderend GLB, Wettelijke Onderzoekstaken Natuur & Milieu Plant Research International/SOVON Vogelonderzoek Nederland, Wageningen/Nijmegen. pp. 268.
Dienst Regelingen. (2009) Jaarrapportage 2008 Programma Beheer, Dienst Regelingen, Roermond.
Dijksterhuis K., Hut H. (2009) Akkervogels, Roodbont, Zutphen.
Dochy O., Hens M. (2005) Van de stakkers van de akkers naar de helden van de velden. Beschermingsmaatregelen voor akkervogels, Instituut voor Natuurbehoud, Brussel. EEA. (2007) Europe’s environment. The fourth assessment,
European Environment Agency, Copenhagen. Kleijn D., Berendse F., Smit R., Gilissen N. (2001)
Agri-environment schemes do not effectively protect biodiversity in Dutch agricultural landscapes. Nature 413:723-725.
Laporte G., De Graaff R.P.M. (2006 ) Een Rijk Weidevogellandschap: actieprogramma van het Weidevogelverbond, WING Process Consultancy, Wageningen.
LNV. (2000) Natuur voor mensen, mensen voor natuur. Nota natuur, bos en landschap in de 21e eeuw, Ministerie van Landbouw, Natuurbeheer en Visserij, Den Haag. LNV. (2006) Agenda voor een vitaal platteland.
Meerjarenprogramma vitaal platteland 2007-2013, Ministerie van Landbouw, Natuur en Voedselkwaliteit, Den Haag.
LNV. (2007) LNV-beleid in 2008. De plannen in kort bestek, Ministerie van Landbouw, Natuur en Voedselkwaliteit, Den Haag.
Melman T.C.P., Schotman A.G.M., Hunink S., de Snoo G.R. (2008) Evaluation of meadow bird management, especially black-tailed godwit (Limosa limosa L.), in the Netherlands. Journal for Nature Conservation 16:88-95.
MNP. (2007a) Opties voor Europese landbouwsubsidies, MNP, Bilthoven. pp. 59.
MNP. (2007b) Ecologische evaluatie regelingen voor natuurbeheer Programma Beheer en Staatsbosbeheer 2000-2006, Milieu- en Natuurplanbureau, Bilthoven. PBL. (2009) Natuurbalans 2009, Planbureau voor de
Leefomgeving, Den Haag/Bilthoven. pp. 212.
Schotman A.G.M., Melman T.C.P. (2006) Haalbaarheidsstudie nieuw weidevogelgebied, Alterra, Wageningen. pp. 48. Schotman A.G.M., Kiers M.A., Melman T.C.P. (2007)
Onderbouwing Grutto-geschiktheidkaart; Ten behoeve van Grutto-mozaïekmodel en voor identificatie van weidevogelgebieden in Nederland, Alterra, Wageningen. pp. 47.
Schotman A.G.M., Meeuwsen H.A.M., Hensen S.R., Roosenschoon O.R., Vanmeulenbroek B., Kiers M.A., Melman T.C.P. (2006) Grutto-mozaïekmodel als
hulpmiddel voor planning en evaluatie van beheer, Alterra, Wageningen. pp. 59.
Schrijver R., Corporaal A., Ozinga W., Rudrum D. (in preparation) Maatregelen voor de verhoging van de biodiversiteit in het landelijke gebied. Een methode voor het meten van de effecten uitgetest in twee gebieden in Twente en Zeeuws-Vlaanderen, Wettelijke Onderzoekstaken Natuur en Milieu, Wageningen.