rug
snijlijn
snijlijn
The Netherlands Environmental Assessment Agency analyses spatial and social developments in (inter) national context, which are important to the human, plant and animal environment. It conducts scientific assessments and policy evaluations, relevant to strategic government policy. These assessments and evaluations are produced both on request and at the agency’s own initiative.
Netherlands Environmental Assessment Agency, September 2009
Environmental Balance 2009
Summary
Environmental Balance 2009
Summary
In cooperation with: Statistics Netherlands (CBS) (Centraal Bureau voor de Statistiek)
Netherlands Bureau for Economic Policy Analysis (CPB) (Centraal Planbureau)
Netherlands Energy Research Foundation (ECN) (Energieonderzoek Centrum Nederland) Royal Dutch Meteorological Institute (KMNI) (Koninklijk Nederlands Meteorologisch Instituut) Agricultural Economics Research Institute (LEI) (Landbouw Economisch Instituut)
National Aviation and Space Exploration Laboratory (NLR) (Nationaal Lucht- en Ruimtevaartlaboratorium)
National Institute for Public Health and the Environment (RIVM) (Rijksinstituut voor Volksgezondheid en Milieu)
Rijkswaterstaat, Service Traffic and Shipping (RWS-DVS) (RWS Dienst Verkeer en Scheepvaart)
Rijkswaterstaat Water Service (RWS-WD) (RWS Waterdienst)
SenterNovem, a government agency for innovation, energy and climate, and environment & spatial planning
Social and Cultural Planning Office of the Netherlands (SCP) (Sociaal en Cultureel Planbureau)
Wageningen University and Research Centre (WUR) (Wageningen Universiteit & Researchcentrum)
Environmental Balance 2009 Summary
© Netherlands Environmental Assessment Agency (PBL), Bilthoven, september 2009 PBL publication number 500081016
Contact: N.J.P. Hoogervorst; nico.hoogervorst@pbl.nl
You can download the publication from the website www.pbl.nl/en. Be sure to include the PBL publication number.
Parts of this publication may be reproduced, on condition of acknowledgement: 'Netherlands Environmental Assessment Agency, Environmental Balance 2009 Summary, 2009'
The Environmental Balance is an annual report by the Netherlands Environmental Assessment Agency (PBL) on the current status and future trends in the environ-ment in the Netherlands in relation to governenviron-ment policies and societal trends. It also identifies the remaining problem areas and highlights policy dilemmas. The Environmental Balance is published in mid September, simultaneously with the Nature Balance 2009. The purpose of these two balances is to provide up-to-date information for use in the Dutch budget negotiations.
The newest emissions data, including provisional data for 2008 – provided by the Pollutant Release & Transfer Register (in Dutch: Emissieregistratie) –, and data on waste and environmental costs are given in the appendices. A detailed statistical summary of the emissions data and a large number of other environmental and nature indicators are available in the Environmental and Nature Compendium (in Dutch only) at www.milieuennatuurcompendium.nl, a joint publication of the Netherlands Environmental Assessment Agency (PBL), Statistics Netherlands (CBS) and the Wageningen University and Research Centre (WUR).
A large number of sister institutes and agencies have contributed their expertise and data to the Environmental Balance publication; they are acknowledged on the title page of the publication itself.
Professor M.A. Hajer
Director of the Netherlands Environmental Assessment Agency
Foreword
Environmental Balance 2009
Summary
The feasibility of meeting both the short- and long-term targets of environmental policy is heavily influenced by the consequences of the current recession. In the short term the environment will profit from the recession because the decline in economic activity will result in lower emissions, especially to the air. In the long term the recession will have unfavourable effects on the environment because it will slow down the development and introduction of environmentally-friendly technologies.
The degree to which the short-term and long-term environmental policy targets will be achieved is shown in Table 1, which gives a mixed picture for the period to 2015. For the period after 2020 almost all the targets will remain out of reach.
Until 2015 the targets for climate and air policy will probably be achieved (green in Table 1) or are within reach (yellow). This is also the case for the targets for soil remediation and waste management. In contrast, the targets for the environmental conditions within nature conservation areas in the rural areas will probably not be achieved by 2015, or even call for a fundamental revision of policy (orange or red). The same applies to the targets for noise, odours and external safety in the urban environment. Under currently adopted and proposed policies almost none of the targets for 2020 and beyond will
be achieved. This means that a much more stringent environmental policy will be needed to achieve the long-term targets (orange in Table 1). Policies for energy generation from wind, sun, biomass and other renewable energy sources and for energy saving and surface water quality will have to be fundamentally revised to bring policy instruments in line with the targets to be achieved (red). A topic that deserves extra attention from policymakers is how the global demand for meat, fish and
dairy products is being met. The expected increase in consumption of these foods is incompatible with global ambitions for the protection of biodiversity and limiting the (increased) greenhouse effect. The Dutch government wants to leave its citizens as free as possible to choose what they eat, but it will eventually have to find a balance between the social goals for food production and consumption, climate and biodiversity.
A second issue is the way Europe legislates for local air quality. There are increasing indications that concentrations of fine particulate matter (PM10) and nitrogen dioxide (NO2) are only rough indicators
of the relation between air quality and damage to human health. The concentration of fine particulate matter from combustion processes appears to be a much better indicator. The limit values for PM10
and NO2 are therefore less suitable measures for protecting human health. Research into possibilities
for targeting policy more specifically on reducing exposure to this type of fine particulate matter would be a useful step towards a more effective air quality policy.
Action needed to achieve environmental targets Environmental targets Current Policy 1) Pro-posed
Policy2) Explanatory remarks Refer-ence
Climate change Ch 2
Kyoto obligation 2008-2012 Including estimate of the effect of the recession on emissions during the Kyoto period p. 63
Greenhouse gas emissions, EU target for Dutch
non-ETS sectors 2020 p. 74
Greenhouse gas emissions: Clean and Efficient,
national target for 2020 Remaining policy challenge expected for both the ETS and non-ETS sectors p. 71
Renewable energy Clean and Efficient 2020 Including effect of reform of the subsidy for renewable electricity (SDE) p. 77
Renewable electricity 2010 p. 77
Biofuel blending 2010 p. 76
Rate of energy savings Clean and Efficient
2011-2020 p. 79
Air pollution Ch 3
SO2 emissions 2010 p. 88
NOx emissions 2010 p. 88
NH3 emissions 2010 Emissions possibly underestima-ted by 5 to 10 kilotonnes p. 90 andp. 127
MNVOC emissions 2010 p. 90
Local air quality PM10 2011 and
NO2 2015 and PM2.5 2015 p. 95
Urban background concentration of PM2.5 p. 100
Environmental quality in rural areas Ch 4
Soil quality: phosphate in agricultural soils Equilibrium fertilisation requires adjustment of the use standards for arable and horticultural crops p. 111
Nitrate in shallow groundwater Target for sandy soil regions as a whole beyond reach p. 117
Chemical quality of surface water 2015 Effects of policy measures still unclear p. 119
Ecological quality of surface water 2015 75% of water bodies will not have a good ecological quality in 2015 under ‘one out – all out’
principle of the WFD p. 121
Water table drawdown 2013 Lack of adequate system for monitoring progress with policy p. 123
Environmental burden of pesticides 2010 Increasing use no longer fully compen-sated by less polluting substances p. 125
Nitrogen deposition on ecosystems 2010 No further decline in nitrogen deposition after 2002 p. 131
1) Current or adopted policies are polices for which the instruments, funding and implementation powers are in place, and for which the necessary decision-making process was been completed by 1 January 2009 at the latest.
2) Proposed policy is policy currently being developed by the Government. Appendix 6 gives an overview of proposed policies and the policies included in this assessment.
Legend
Implementation of policy will probably lead to target achievement. Projected trend is close to the target.
Policy could be made more robust to offset setbacks. Projected trend will probably not lead to target achievement. The target can be achieved through more forceful application of policy. Projected trend will probably not lead to target achievement. Requires a fundamental revision of policy.
Indeterminate at the moment.
Environmental targets
Current Policy 1)
Pro-posed
Policy2) Explanatory remarks Refer-ence Environmental quality of the urban environment Ch 5
Traffic noise annoyance 2010 p. 141
Traffic noise problem areas 2023 Expansion of the noise remediation pro-gramme will reduce problem areas by 90%.
Effect on rail traffic noise uncertain p. 143
Noise nuisance Schiphol p. 145
Resolution of problems within the 10-6
contour for location-based risk p. 148
Schiphol: external safety p. 149
Soil remediation 2015 p. 151
Indoor environmental quality p. 153
Waste 2015 Provisional results indicate that target will be achieved; monitoring of progress required p. 156
Odours 2010 p. 158
Action needed to achieve environmental targets Table 1 continued
I
Introduction
The Environmental Balance is the annual report by the Netherlands Environmental Assessment Agency (PBL) on the current status and future trends in the environ-ment in relation to governenviron-ment policies and social trends. This Environenviron-mental
Balance pays specific attention to the consequences of the current economic reces-sion for environmental quality and for the progress being made with environmen-tal policies. It analyses the extent to which the recession gives reason to amend environmental policies.
Structure of the report
This summary of the Environmental Balance sets out the main conclusions in the report. The evidence base underpinning these conclusion can be found in the sub-stantive chapters.
Chapter 1 (on the recession and the environment) describes the influence of the economic recession on Dutch emissions and investments in environmentally-friendly technologies, as well as the expected impact on the environment of the measures contained in the supplementary policy agreement ‘Working on the Future’ (Aanvullend Beleidsakkoord). Chapter 2 (on climate change) deals with the Dutch strategy for meeting the country’s obligations under the Kyoto Protocol and the policy measures for meeting the climate targets for 2020 contained in the national ‘Clean and Efficient’ (Schoon en Zuinig) programme. Chapter 3 (on air pollution) examines the effects of policy on emissions and concentrations of air pol-lutants. The emissions are assessed against the national emissions ceilings and the concentrations against the limit values for fine particulate matter (PM10) and NO2,
which apply locally. Chapter 4 (on environmental quality in the rural areas) exam-ines the quality of surface waters, groundwater and soil, which are affected mainly by trends in agriculture. Chapter 5 (on the quality of the urban environment) looks at various forms of environmental pollution that are damaging to human health and residential amenity.
In addition to this standard evaluation of progress with environmental policy, this
Environmental Balance discusses two special topics that deserve further examina-tion by policymakers. Chapter 6 draws attenexamina-tion to the consequences of the global production and consumption of meat, fish and dairy products for biodiversity and the climate. This topic has been included in order to support the public debate on this important issue with the best possible available information. Chapter 7 draws attention to the efficiency of European legislation on minimising health risks from local air pollution by PM10 and NO2. Almost 2 billion euros has been reserved for
reducing this type of air pollution, but there are indications that the intended health benefits can be achieved more cheaply.
II
Trends to 2015
Recession and pressures on the environment over the short term
Due to the recession production levels in 2009 and 2010 will be lower than in previ-ous years, which in turn will lead to lower air emissions during these two years.
The recession is having almost no effect on emissions to water and the soil. The economic downturn is being felt most keenly by the construction industry, com-merce and the energy-intensive industries, such as the chemical and metal indus-tries, which make higher than average contributions to air emissions. Emissions from agriculture and households are hardly affected by the recession. The contrac-tion of the economy by a few per cent will therefore lead to a 5% to 10% reduccontrac-tion in air emissions (excluding ammonia) in 2010 compared with the situation without the recession. The remaining reduction in emissions between 2007 and 2010 can be attributed to the effects of policy. This calculation is based on the most recent projections of economic output by the Netherlands Bureau for Economic Policy Analysis (CPB).
The Government is trying to minimise the consequences of the recession for the Netherlands by rolling out the measures set out in its supplementary policy agree-ment ‘Working on the Future’ (Aanvullend Beleidsakkoord) and in the ‘Crisis and Recovery Act’ (Crisis en herstelwet). The policy agreement contains several meas-ures that should also benefit the environment. For example, the Government has reserved an annual budget of 160 million euros in 2009 and 2010 for energy saving in homes. If this money is available for just two years, though, companies will find it difficult to make use of the funds available. The effect on energy saving in homes will then be limited to 0 to 0.1 petajoules in 2010. From 2014 the Government will also invest 160 million euros each year in offshore wind energy. In time this will have a beneficial effect on the climate because it could increase offshore wind energy generation by 30% to 2,300 megawatts. The target is 6,000 megawatts in 2020. Climate policy to 2012
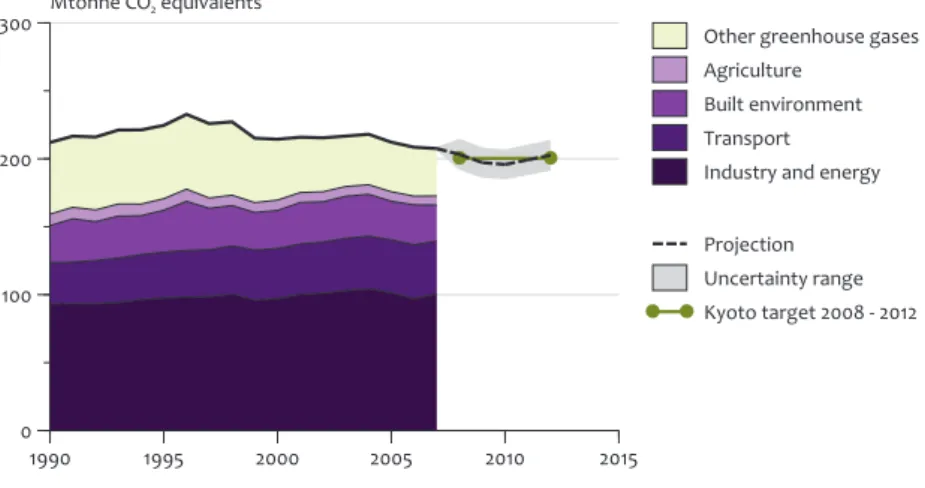
According to provisional figures, Dutch emissions of greenhouse gases in 2008 declined by 1.5 megatonnes to 206 megatonnes of CO2 equivalent. This decline can
be attributed mainly to the reduction in emissions of nitrous dioxide (N2O) due to
reduction measures at the nitric acid plants. The recession will probably cause emis-sions to fall further, to 186 to 206 megatonnes in 2010. Thereafter, if the economy picks up, emissions will rise again to 192 to 213 megatonnes in 2012 (Figure 1). Without the recession, emissions would rise to 203 to 224 megatonnes in 2012.
Kyoto Protocol climate targets will most probably be achieved
The recession makes it easier to achieve the Kyoto target. It would probably also be achieved without the recession, but both the public and private sectors would then have to buy more foreign emissions credits.
During the five years of the Kyoto period (2008-2012) average domestic emissions must not exceed 200 megatonnes of CO2 equivalent per year. This amounts to
Rough projections of emissions in 2010 compared with total emissions in 2007
Greenhouse gases (Mtonne CO2-eq)
SO2
(ktonne) (ktonne)NOx (ktonne)NH3 (ktonne)PM10 (ktonne)NMVOC
Total 2010 196 40 244 129 33 143
Total 2007 208 60 299 137 37 164
Reduction 5–10% 30–35% 15–20% 5–10% 10–15% 10–15%
1,000 megatonnes over the whole period. Of this, 437 megatonnes are reserved for emissions by Dutch companies participating in the EU Emissions Trading Scheme (ETS). If emissions exceed this ceiling, companies must compensate for their excess emissions by purchasing foreign emissions credits.
The remaining 536 megatonnes of CO2 equivalent are available for the sectors
that do not participate in the ETS (such as consumers, agriculture, transport and services). If domestic emissions exceed this amount, the government will have to compensate for the surplus by buying foreign emissions credits. Due to the reces-sion, domestic emissions by these companies will decline until 2010. It is not clear how fast the economy will pick up again after this date. If the economy grows by 2.7% per year in 2011 and 2012, the non-ETS sectors will emit 555 to 615 megatonnes of CO2 equivalent during the whole Kyoto period. The emission allocation of 563
megatonnes lies within this range, which means that the government will have to buy -10 to 50 megatonnes of foreign emissions credits to remain within its national allocation. Because the government expects that 50 to 60 megatonnes of foreign emissions credits will be available – via the Clean Development Mechanism (CDM) and Joint Implementation (JI) projects – the target will most probably be achieved. The government is expected to have a surplus of 30-40 megatonnes of emissions credits (range 10 to 60 megatonnes), which can be used in the next trade period. Air pollution in 2010
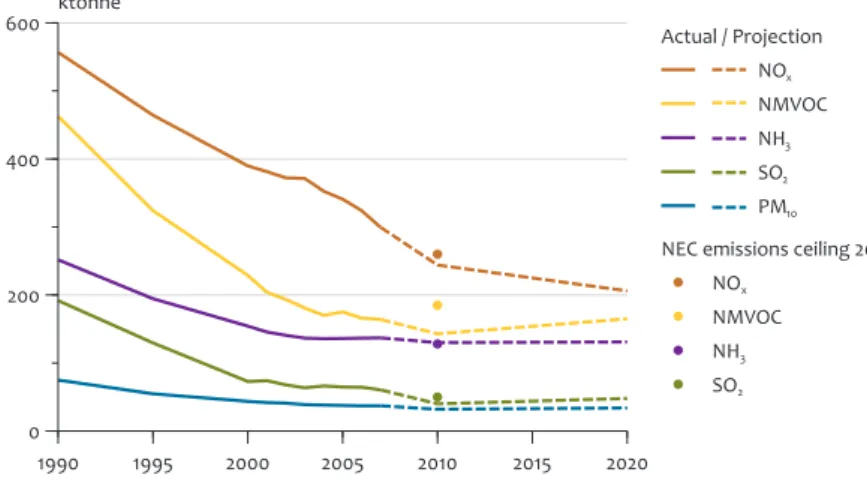
Dutch emissions of sulphur dioxide (SO2), nitrogen oxides (NOx) and non-methane
volatile organic compounds (NMVOC) will fall in the period to 2010 by about 35%, 20% and 10% compared with 2007, the most recent year for which definitive sion figures are available. This will bring all these emissions under the national emis-sion ceilings (NEC) set by the European Commisemis-sion, which apply from 2010 (Figure
The additional emission reductions caused by the recession make it highly likely that the Kyoto obligation for the period 2008-2012 will be achieved.
Figure 1 1990 1995 2000 2005 2010 2015 0 100 200
300 Mtonne CO2 equivalents Other greenhouse gases
Agriculture Built environment Transport Industry and energy
Greenhouse gas emissions by sector
Projection Uncertainty range Kyoto target 2008 - 2012
2). The chance that ammonia (NH3) emissions will remain below the ceiling is about
50%.
Policy for SO2 and NMVOC is effective, even without the recession
The SO2 and NMVOC emissions would also remain below the ceiling without the
recession. Emissions of SO2 will fall between 2007 and 2010, mainly because of
a shift from the use of oil to gas as a fuel in refineries. Until the end of 2010 the energy sector will probably burn less coal than was assumed in the Environmental
Balance 2008. If new coal-fired power stations are brought on stream after 2010, SO2 emissions will rise again. NMVOC emissions will fall substantially until the end of
2010 thanks to a broad package of measures, including the National NMVOC Reduc-tion Plan.
Recession brings NOx emissions below ceiling
Under adopted and proposed policies NOx emissions will decline sharply by 50
kilotonnes between 2007 and 2010, with EU emission standards for private cars and lorries making the biggest contribution to this reduction. Other things being equal, this would bring NOx emissions close to the NEC ceiling in 2010, but the decline in
industrial production and freight transport mean that estimated NOx emissions will
fall to almost 15 kilotonnes below the ceiling.
Recession keeps NH3 emissions higher
Without the recession NH3 emissions in 2010 would be 3 to 7 kilotonnes lower than
with the recession. The reason for this is that in the current economic climate farmers are postponing investments in low-emission livestock housing. As a result, emissions in 2010 will amount to 129 kilotonnes. This figure does not take account
Under adopted policies emissions of sulphur dioxide, nitrogen oxides and volatile organic compounds will probably fall below the national emission ceilings in 2010. The chance that ammonia emissions will be below the ceiling in 2010 is about 50%.
Figure 2
1990 1995 2000 2005 2010 2015 2020
0 200 400
600 ktonne Actual / Projection
NOx
NMVOC NH3
SO2
PM10
NEC emissions ceiling 2010 NOx
NMVOC NH3
SO2
of the indications that NH3 emissions are being underestimated by about 5 to 10
kilotonnes.
Local air quality in 2011 and 2015
With the adoption of the local air quality policy and the implementation of the proposed generic policy in the ‘National Cooperation Programme on Air Quality’ (Nationaal Samenwerkingsprogramma Luchtkwaliteit, NSL), the Government has greatly increased the likelihood that the concentrations of nitrogen dioxide (NO2)
and fine particulate matter (PM10) will remain below the limit values throughout the
country. The generic measures will bring the number of sites where the PM10
con-centration will be around or above the limit value in 2011 down to a total of about 20 kilometres of motorway and just over 60 kilometres of urban roads. Additional local measures in the NSL can bring the PM10 concentrations at the most severely
affected sites down to near the limit value. NO2 concentrations will also fall sharply
in the period to 2015. However, due to large uncertainties in the projections, the likelihood that the concentrations of PM10 and NO2 will fall below the limit values in
this period is about 50%.
Dealing with uncertainties
Despite the forceful policy measures being taken, the limits will still be exceeded in a some places. In severely affected locations the estimated concentrations are close to permitted levels, which means that even small deviations in the projections can result in exceedance of the limits. The uncertainties in the projections are due to unavoidable uncertainties in local emission levels, dispersion models and future weather conditions. In view of this, the Elverding Commission and the Verheijen Commission have recently made recommendations on how to deal with these uncertainties. Their main recommendations are:
Take more measures so that the chances of remaining within the limit values will be greater than 50% and health benefits will increase.
Draw up a package of reserve measures so that rapid action can be taken if the concentrations are still likely to exceed the limit.
Minimise the number of detailed model calculations used.
Is air quality policy directed at the right compounds?
The European standards for PM10 and NO2 are intended to reduce the damage to
human health from local air pollution. However, there are growing indications that this damage is more closely associated with exposure to fine particulate matter from combustion processes (combustion aerosols) than with exposure to PM10 or
NO2. Moreover, the observed health effects can be explained better by the
toxico-logical properties of the combustion aerosols. This does not mean that the current standards for PM10 and NO2 do not lead to benefits for human health, but it does
mean that reducing exposure to combustion aerosols will probably deliver greater health benefits at lower costs.
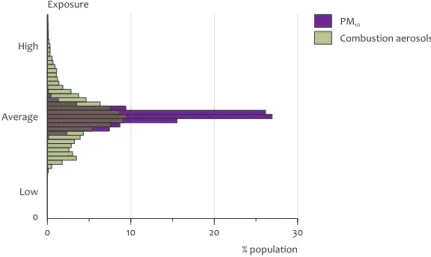
Reason for a rethink on particulates
These findings could have important consequences. The burden of illness from air pollution exposure may be less evenly distributed over the population than the dis-tribution of PM10 concentrations over the Netherlands suggests (Figure 3). If
roads face the greatest health risks. This may also have significant implications for the relative importance of policy measures. Installing particulate filters in new cars would deliver greater health benefits than the suggested by the effect of particulate filters on local PM10 concentrations. It would therefore be useful to study the value
of legislation geared to reducing exposure to combustion aerosols in addition to, or even instead of, regulations for reducing PM10 and NO2 concentrations. The
recom-mendations by the commissions mentioned above should be included in this analysis. Environmental conditions for nature
The environmental quality required to maintain the ecosystems and habitats in the Netherlands – the quality of surface waters, soil phosphate status, nitrate concen-trations in groundwater, the hydrological status in nature conservation areas and nitrogen deposition on wildlife habitats – is hardly being affected by the reces-sion. Current adopted policies will not be sufficient to meet the targets for these indicators. Introduction of the proposed policies will not change this, despite the considerable weight of measures in preparation.
Tackling water table drawdown requires decisive action by government
The 2007 administrative agreement between central and provincial government marks a new phase in the hydrological restoration of habitats affected by lowered water tables. This administrative agreement designates the areas to be restored and divides responsibilities between central government and the provincial councils. It sets a target of 70,000 hectares of affected habitat to be hydrologically restored by 2013. Sufficient money has been reserved to make this possible. In 2007 a start was made with the implementation of measures on 363 hectares. To achieve the goal of restoring 70,000 hectares decisive action by government is now
Exposure to fine particulate matter (PM10) in the Netherlands is more or less the same for everyone; exposure to combustion aerosols can vary considerably from person to person.
Figure 3 High Average Low 0 Exposure 0 10 20 30 % population PM10 Combustion aerosols
needed, particularly by the provincial councils. Assessing whether this goal will be met will require a standardised system for monitoring the effects of the measures taken. So far it has not proved possible to develop such a monitoring system, which makes it more difficult to conduct the planned interim evaluation in 2010.
Manure policy will become more complex
The Government has announced new measures to reduce the accumulation of phosphate in the soil and the leaching of nitrate. Although this is an improvement, these measures are still not enough to achieve the targets for phosphate and nitrogen. The interests of the environment (clean surface waters and groundwater) conflict with those of the livestock farming sector, which needs land to dispose of the manure it produces. From 2010 the use standards for phosphate, which already vary according to the crop, will also depend on the phosphate content of the soil. Moreover, the government is thinking of also relating these use standards to crop yields after 2014. While these would be technical improvements, they make the standards more complex, which in turn makes compliance and monitoring of the standards more difficult.
To alleviate the conflicts between the environment and livestock farming, the government has regularly put back the dates for meeting the policy targets. This has put the timely realisation of nature conservation objectives under increasing pressure. The first ‘National Environmental Policy Plan’ (Nationaal
Milieubeleidsp-lan, NMP), which was published in 1989, announced that in 2000 fertiliser inputs must be balanced by the removal of nutrients via the harvested crops. In 2005 the Government agreed with the European Commission that an equilibrium level of fertiliser application will be achieved in 2015, this time including a maximum level of unavoidable phosphate loss of 5 kilograms per hectare. However, the proposed new standards for the use of manure in arable farming and horticulture for the period to 2015 are still too generous and no longer include a final date for achieving equilibrium fertilisation. Moreover, the target of 50 milligrams nitrate per litre in groundwater has also been pushed back. According to the first NMP, fertilisation levels in 2000 should be compatible with this target. The ambition is now to achieve the target for nitrate concentration in groundwater as soon as possible.
Effect of policy on plant protection products stalling
The chemical and ecological quality of surface waters is affected not only by phos-phate and nitrate, but also the concentration of pesticides. Since 2003 the use of plant protection products has risen again. Despite this, the overall environmental load is falling because compounds that have a high impact on the environmental have been replaced by newer products that place less of a burden on the environ-ment. The calculated environmental load on surface waters in 2007 was no lower than in 2006 due to an increase in the use of insecticides. Since 1989 the pollution of surface waters fell by 85%, but the target of a 95% reduction by 2010 will probably not be met. No quantitative targets have been set for the pollution of soil, ground-water and terrestrial ecosystems by plant protection products.
Current measures cannot achieve WFD targets for 2015
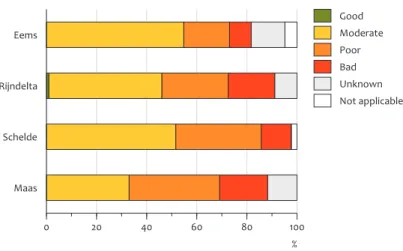
In 2007 60% to 90% of Dutch surface waters met the targets for chemical quality under the Water Framework Directive (WFD). In that year just 1% of the surface
water met the ecological targets, which have to be achieved by 2015 (Figure 4). The moderate and poor quality of surface waters is caused mainly by the artificial design of waterways and their high phosphorus and nitrogen concentrations. Implemen-tation of the measures proposed in the river basin management plans can bring about 25% of the surface water up to the WFD ecological standards by 2015. Water managers have stated that they will postpone the 2015 targets for 70% to 80% of the surface water bodies.
The WFD targets must be achieved by 2027 at the latest, but with the current management plans and under the ‘one out – all out’ principle, no more than 40% of the surface waters will then meet the standards. The current management plans therefore inadequate for meeting the targets, even if the date for achieving these targets is extended by the maximum period to 2027. A fundamental revision of the WFD policy is needed to make the instruments and assessment methods compat-ible with achieving the targets.
Environmental quality in the urban environment
Urban environmental quality improving, but some targets not yet achieved
In recent years government policies have achieved some important successes: the number of sites where traffic noise is a problem have been reduced, external safety in residential areas has been improved and odour nuisance has been reduced. In addition, more waste is being recovered and recycled and the number of locations with contaminated soil is declining. Nevertheless, the targets for external safety and noise pollution will probably not be achieved. Furthermore, about 30% of the Dutch population still suffer from noise annoyance and 10% from odour nuisance from various sources. Nonetheless, 80% of the Dutch population are satisfied or very satisfied with their residential environment.
Almost no surface waters had achieved the ‘good ecological status’ in 2007.
Figure 4 Eems Rijndelta Schelde Maas 0 20 40 60 80 100 % Good Moderate Poor Bad Unknown Not applicable
Cleaner air is raising life expectancy
Local air quality, which of all environmental factors has the greatest influence on public health, will improve substantially over the coming years following the introduction of proposed policy measures. In the short term the recession will lead to less construction activity and a decline in road traffic, which will have a tempo-rarily beneficial effect on urban air quality. According to rough model calculations, the number of years of life lost due to fine particulate matter has been cut by more than 20% since 2000, and will fall by a further 10% by 2020.
Signs of improving indoor environmental quality
The quality of the environment inside buildings (the indoor environment) also affects human health. Judging by the fall in the numbers of complaints about damp in homes and emergency treatments of carbon monoxide poisoning, the quality of the indoor environment appears to have improved in recent years. Current techniques for saving energy in new homes sometimes have a detrimental effect on indoor environmental quality.
Noise and odour nuisance reduce satisfaction with the residential environment
Satisfaction with the residential environment depends on a combination of many factors, such as income, age, composition of the neighbourhood population, satis-faction with the home and local environmental quality. If all these factors are taken into account, people experiencing higher levels of noise and odour nuisance seem to be less satisfied with their residential environment. Furthermore, satisfaction with the residential environment often increases when the environmental quality is better than required by the legal standards.
Noise annoyance levels remain high, but number of problem areas falling
The number of residents reporting noise disturbance has remained about the same over the last twenty years, but severe noise annoyance has increased by more than 10%. Traffic on municipal roads causes the greatest disturbance (Figure 5). Not only have traffic levels on these roads increased in recent years, but municipal councils also make maximum use of the powers at their disposal since 2007 to permit noise exposure in certain situations to be higher than prescribed in the legislation. Since 1990 noise annoyance from rail traffic has increased slightly due to the increase in rail transport.
Despite the increase in traffic levels, the use of very open-textured asphaltic con-crete (ZOAB) has led to a fall in the number of homes exposed to noise levels above the legal limit. The number of problem areas along railway lines has been almost halved due to the use of quieter tracks and the construction of noise barriers.
Decline in aircraft noise annoyance
Serious aircraft noise annoyance has declined steadily since 1995. However, since 2005 the noise burden on homes in the areas around the regional airport of Groningen*) has increased. In the area around Amsterdam Schiphol Airport serious noise annoy-ance and sleep disturbannoy-ance have fallen off in recent years, despite the fact that in *) Error corrected. In the printed version of Environmental Balance 2009 this text reads ' regional airport of Rotterdam and Groningen'.
2008 the noise standards in this region were exceeded at three of the 60 enforce-ment points where the maximum permitted noise levels apply. Unless the noise policy for Schiphol is fundamentally revised, such exceedances will continue to occur regularly.
Odour nuisance hardly decreasing
The proportion of the Dutch population affected by odours has remained more or less stable over the last ten years. From 5% to 13% of the adult population are affected by odour nuisance, depending on which types of source of odours are considered. Most environmental complaints received by the provincial councils are about odours. Traffic and industry are the most important sources of odours in the port areas, especially in the Botlek area and around Delfzijl. Livestock farming is the biggest source of nuisance in the eastern part of the province of Noord-Brabant and in the Gelderse Vallei region.
Municipal and provincial councils are permitted to draw up their own ‘odour policy’. This is leading to big differences in standards, measurement methods and terminol-ogy, and to unequal treatment of businesses. Sometimes, in order to permit inte-grated area development and industrial activities, odour contours are drawn more closely around sources of odours than is needed to prevent serious odour nuisance. Conclusions on environmental policy for the short term
Based on the findings presented above we may conclude that environmental policy has been effective in achieving the short-term goals for climate and air quality. With the exception of nitrogen oxide (NOx) emissions, most of the climate and air quality
targets for the period to 2015 would be achieved even without the current reces-sion. Because of the recession emissions to the air in 2010 (excluding ammonia) will
Road traffic is the main source of noise annoyance.
Figure 5 1990 1994 1998 2002 2006 2010 0 10 20 30 40
50 % population Road traffic
Air traffic Rail traffic
be 5% to 10% lower than would otherwise have been the case. This has a positive effect on environmental quality.
The policies on environmental conditions for nature and for noise and odour nuisance in the urban environment are insufficient to achieve the targets for 2010. Many targets relevant for nature conservation have already been put back. In addition, the implementation of many of the required policy measures for these issues has been delegated to the provincial and municipal councils, which inevitably have to make trade-offs between different regional interests. Nature conservation interests (which are adversely affected by eutrophication and water table draw-down) are often at odds with agricultural interests, the interests of clean air and minimising environmental noise are often hard to reconcile with those of motorised transport sector, and economic activities regularly take precedence over reducing serious odour nuisance. All these regional choices make it more difficult to achieve national targets. The Government is therefore looking for ways to strengthen decentralised environmental policies, both in terms of coordination and of the capacity, information and expertise available at the decentralised level. An appraisal must also be made of whether the outcomes of all these decentralised policy trade-offs are delivering a socially desirable result.
III Long-term trends
Consequences of the recession for environmental investments
It is still not clear how quickly the economy will start to grow again after 2010. Projections of emissions to the air after 2010 are therefore based for the time being on the updated Global Economy long-term scenario (GE scenario), which assumes an average growth of 2.7% per year. It is already clear that the recession will lead to lower environmental investments and that in all probability this will slow down progress with the introduction of clean technologies. The underlying reasons for are the credit supply, the price of CO2 emissions credits, the oil price and the
avail-able public funds.
Limited credit supply slowing down environmental investments
The recession has restricted the supply of credit for all investments, including envi-ronmental investments. Investments in entirely new envienvi-ronmental technologies, such as carbon storage, are generally more risky than other types of investments, such as investments in the expansion of production capacity for consumption goods. Risks are greater because the markets for new environmental technologies usually have to be developed and the process of creating new environmental tech-nologies often meets with unforeseen setbacks. Investments in new environmental technologies are therefore likely to be hit harder by the credit crisis.
Fewer emission-reduction measures due to collapse in price of CO2 emissions credits
The recession has led to a sharp fall in the price of CO2 emissions credits. This fall
in prices reflects the reduction in CO2 emissions and the associated changes in the
supply of and demand for emissions credits: because fewer companies are exceed-ing their emission quota, fewer credits are needed to compensate for excess emis-sions and more companies have unused emisemis-sions credits.
When the economy picks up again, the price of carbon is not expected to rise substantially. If no far-reaching climate package is agreed and the European Com-mission decides not to lower the eCom-mission allocation for the EU ECom-missions Trading Scheme, the price of CO2 will fluctuate around the 20 euro per tonne mark for some
time. This is considerably lower than the 35 euros which before the recession was expected to last until 2020. This lower price is due in part to the surplus CDM and JI emissions credits from the 2008-2012 Kyoto period because of the recession (see section 2.4.2). This surplus will lead to a greater supply of emissions credits in the 2013-2020 period, which will depress the price of CO2. This in turn will make
compa-nies more reluctant to invest in CO2 reducing measures because buying emissions
credits will often be cheaper than taking emission-reducing measures.
Low oil price delaying investments in oil-replacing technologies
The oil price plays an important role in decisions to invest in CO2-reducing and
energy-saving measures and in renewable energy sources such as wind, solar and geothermal energy. Partly as a result of the recession, the oil price fell from 140 to 40 dollars a barrel between July and December 2008. The price is now fluctuating between 60 and 70 dollars a barrel and it is unclear whether and when it will rise again. The current price level is in any case considerably lower than the 80 to 110 dollars per barrel on which the reference projections made before the recession were based. This means that over the next few years several investments in tech-nologies for replacing fossil fuels will be less profitable than was recently thought. The uncertainty over future fuel prices alone is slowing down investments in oil-replacing technologies.
Government has limited resources for stimulating environmental investments
If these three important market incentives to invest in environmental technologies fall away, the government could step in to compensate for the negative effects. However, to counter the recession national governments have run up large debts to rescue the banks from collapse. The incentive packages they provided are intended primarily to give the economy a short-term boost and maintain employ-ment levels, goals which are difficult to reconcile with encouraging environemploy-mental investments. When the economy eventually picks up and tax revenues rise again, the government will probably give priority to restoring sound public finances rather than providing financial incentives for environmental investments.
Extra incentives needed for environmental investments
The projections of long-term emissions assume that new environmentally-friendly technologies will be introduced on a large scale. The longer the prices of oil and CO2
emissions credits remain lower than assumed in the scenarios and the longer the credit supply remains relatively tight, the higher emissions will climb above those forecast in the updated Global Economy scenario once the economy picks up. That is a worrying prospect because current projections already indicate that most long-term environmental targets will not be met. It is therefore desirable, in addition to financial incentives, to look for other ways to encourage environmentally-friendly investments.
Climate policy after 2012
Additional measures needed to meet emission target for 2020
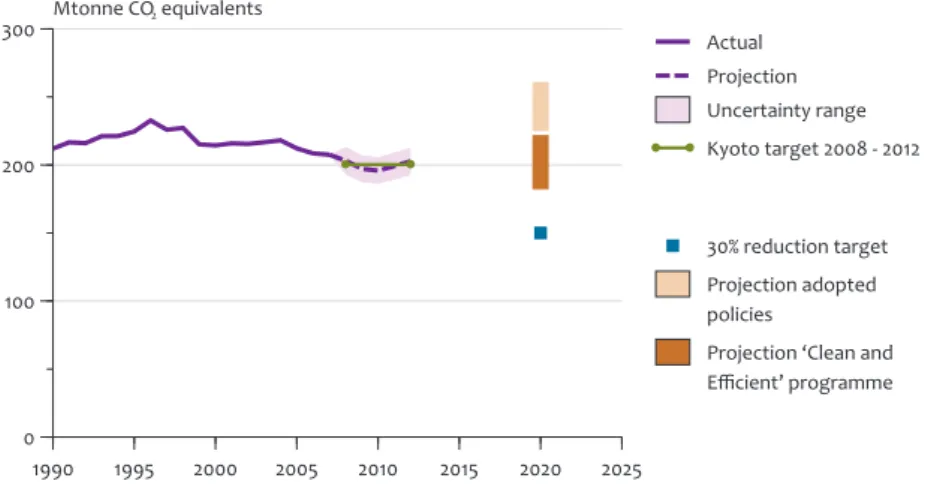
The Government aims for a 30% reduction in greenhouse gas emissions from 1990 levels by 2020, bringing emissions down to a maximum of 150 megatonnes of CO2
equivalent. The Dutch government is therefore pursuing a more ambitious goal than the European Commission, whose current target is a minimum reduction of 20%. Under its Clean and Efficient programme the Government is developing policy instruments not only to realise these emission reductions, but also to achieve the targets for energy saving and renewable energy. At the moment the work programme contains adopted policy instruments as well as policy proposals and options to be worked out in more detail. Under the adopted and proposed policies in the programme, emissions will fall to 182 to 222 megatonnes in 2020, depending on the rate of economic growth and decisions to introduce stricter measures under current and proposed policies. This means that additional measures will be needed to bring emissions down to the Government’s target of 150 megatonnes maximum. For the development of additional policy measures the government draws a distinc-tion between sectors that do or do not participate in the EU Emissions Trading System (ETS).
Policy gap for ETS sectors is 16 megatonnes in 2020
The 2020 emissions target for the ETS companies is a maximum of 59 megatonnes of CO2 equivalent, based on a 30% reduction from 1990 emissions. From 2010 the
Dutch will operate under a single European emissions ceiling in a single European market for emissions credits. Under these conditions it is odd to formulate a separate emissions target for Dutch ETS companies, especially because the Dutch government has no instruments to force compliance with such a target. Neverthe-less, the Government does want to achieve a national target for greenhouse gas
Current adopted policies and the additional policies in the Clean and Efficient programme are not enough to achieve the 2020 target.
Figure 6
1990 1995 2000 2005 2010 2015 2020 2025 0
100 200
300 Mtonne CO2 equivalents Actual
Projection Uncertainty range
30% reduction target
Greenhouse gas emissions
Kyoto target 2008 - 2012
Projection adopted policies
Projection ‘Clean and Efficient’ programme
emissions. To assess whether that target will be met, the Government assumes that the emissions reduction by the Dutch ETS companies will equal the reduction target for all European ETS companies. Under this assumption, in 2020 the Dutch ETS companies will emit 75 megatonnes of CO2 equivalent, or 16 megatonnes above the
target in the Clean and Efficient programme.
The Government hopes that negotiations on the post Kyoto climate accord will result in a European emissions reduction target of 30% between 1990 and 2020. In that case the Dutch ETS companies (like their European colleagues) will have to achieve a 30% reduction in emissions, in line with the Dutch target in the work pro-gramme. If the European Commission does not raise its reduction target to 30%, the Government will have to achieve additional emissions reductions outside the ETS companies in order to meet the national emissions target.
Policy gap for non-ETS sectors is -2 to 16 megatonnes in 2020
The 2020 emissions target for the non-ETS sectors is a maximum of 89 megatonnes of CO2 equivalent, again based on a 30% reduction from their 1990 emissions.
Imple-mentation of European climate policy and the adopted and proposed policies in the
Clean and Efficient programme will result in these sectors emitting 88 to 105 mega-tonnes of CO2 equivalent in 2020. In round figures, that is between 2 megatonnes
lower and 16 megatonnes higher than the national target. This range reflects the uncertainties in economic growth, the prices of energy and CO2, the capacity of
the production sectors and the rate at which policy instruments are deployed. The last uncertainty can be reduced through further elaboration and tightening of the measures set out in the Clean and Efficient programme. This work programme will be officially evaluated in spring 2010. The Government will then introduce additional policy measures if the results of this review indicate a need for them.
Renewable energy slow to take off
The Government wants 20% of the energy supply in 2020 to come from renewable sources. If the current budgets for the incentive schemes for ‘Sustainable Energy Production’ (Stimulering Duurzame Energieproductie, SDE) and ‘Environmental Quality of Electricity Production’ (Milieukwaliteit Elektriciteitsproductie, MPE) run until 2020, and if the capacity of offshore wind power generation is expanded in line with the ‘Working on the Future’ (Aanvullend Beleidsakkoord) supplementary policy agreement, renewable energy is expected to provide about 5% of the national energy supply in 2020.
In 2020 renewables can supply a maximum of 15% of all energy consumption if additional policy measures can bring the renewable electricity share of total electricity generation up to 35% (the technical maximum) and biofuels make up 20% of road transport fuel. To meet the 20% renewable energy target, additional policy measures are needed for green gas (biogas) and for supplying heat from renewable sources (such as geothermal energy). However, investing in renewable energy sources has become less attractive because of the recession. Not only has the oil price fallen, but the price of CO2 emissions credits will probably remain lower
for longer than was anticipated before the recession. Moreover, it is debatable whether sufficient quantities of biofuels can be produced from sustainable sources.
More energy saving, but tempo too low
For the period 2011-2020 the Government wants energy savings to increase by an average of 2% per year. Under adopted and proposed policies energy saving will rise from about 1% per year now to an average of 1.4% per year in the period 2011-2020. If the proposed policies measures are made more stringent, energy saving can rise to 1.8% per year. The Government currently relies on primarily voluntary instruments to encourage energy saving, such as voluntary agreements, or ‘covenants’, but addi-tional and possibly more binding policy measures will almost certainly be needed to achieve the target. The government is currently looking into the possibilities. The fall in the prices of oil and CO2 is also having an inhibiting effect on investments in
energy saving. Air pollution in 2020
Under current adopted policies, emissions of sulphur dioxide (SO2), ammonia (NH3),
volatile organic compounds (NMVOC) and fine particulate matter (PM10) will rise
again between 2010 and 2020. The European strategy of setting increasingly strin-gent standards for vehicle emissions will ensure continuing reductions in emissions of nitrogen oxides (NOx).
It is expected that SO2, NOx and NMVOC emissions in 2020 will still be below the
national emissions ceilings for 2010, but the European Commission is working to establish new, tighter ceilings for 2020. If these come into force, new environmen-tal policy measures will be needed to keep emissions below these ceilings. NH3 emissions in 2020 may be higher than the 2010 ceiling if the Dutch national
livestock herd expands, which is particularly likely if the dairy herd increases in size following the abolishment of the milk quota. NH3 emissions from dairy cows are
particularly high because cow sheds are more open to the outside air than pig and poultry housing.
Noise annoyance to 2023
Problem areas along motorways and railways to be tackled
The Government wants to resolve all motorway and railway noise problems before 2023. The current measures being taken on motorways (laying very open-textured asphaltic concrete (ZOAB) and constructing noise barriers) can compensate for the rise in noise levels from increasing traffic volumes. An innovative noise remediation programme has been drawn up to reduce the noise burden on homes along motor-ways, which will reduce the number of problem areas by about 90%. The introduc-tion of ‘noise producintroduc-tion ceilings’ gives the government a new tool to effectively cap the increase in road and rail traffic noise. However, the costs of complying with these ceilings may rise considerably if traffic volumes increase strongly. Noise annoyance caused by rail traffic has been considerably reduced in recent decades through the use of concrete sleepers and the introduction of quieter rolling stock. It is not clear whether this package of measures will be sufficient to achieve the 2023 target.
Allocation of noise nuisance around Schiphol raises dilemmas
The advice presented by the ‘Alders round table’ on the expansion of Amsterdam Schiphol Airport has led to the imposition of a limit of 510,000 flight movements a
year until 2020, with a maximum of 32,000 flight movements during the night and in the early morning. In addition, a further 70,000 flights will be transferred to other airports, such as Lelystad and Eindhoven. Agreements on the use of runways and flight corridors should minimise flights over residential areas. These recommenda-tions will result in a new standards and enforcement system for Schiphol Airport. Innovations in aviation and traffic control will open up new possibilities for reducing aircraft noise levels in residential areas around Schiphol. However, their introduc-tion will inevitably mean an increase in noise levels in a limited area near the airport, where noise levels are already high. This goes against the legal agreements. In effect, this means that protecting residents close to Schiphol stands in the way of improving the situation within the whole of the Randstad region. The allocation of noise levels between areas close to the airport and those further away is set to remain a political dilemma for some time to come.
Sustainability of meat, fish and dairy products
Conflicting demands within society
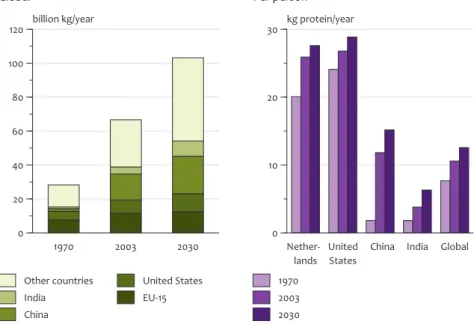
The global production of meat, fish and dairy products already places a huge burden on the environment. This production is currently responsible for 12% of global greenhouse gas emissions and about 30% of biodiversity loss. The latter is caused primarily by arable production for livestock feed, which displaces biodiver-sity mainly in the tropics. Between now and 2030 the global consumption of meat, fish and dairy products will rise by 50%, as will production and its associated pres-sures on the environment. At the same time, international agreements have been made to halt the loss of biodiversity and reduce greenhouse gas emissions. These two trends are incompatible.
Available information reviewed
Many different statistics are available on the seriousness of these problems. Chapter 6 contains an overview of the most reliable information on this issue. This shows that 80% of the world’s agricultural area is used for the production of meat and dairy products and that 80% of commercial fish stocks are already under threat. Replacing part of the meat consumption with poultry meat will benefit the climate and biodiversity. The production of cheese and meat substitutes based on dairy products is often just as environmentally damaging as the production of chicken. The production of Brazilian beef has six times more impact on the climate and takes up 60 times as much land as meat from Dutch dairy cows. Replacing imported soy with Dutch pulses delivers some national environmental gain, but leads indirectly to a significant expansion of land use and loss of biodiversity elsewhere in the world.
No simple technical fixes
There are many technical possibilities for reducing the environmental impacts of meat, fish and dairy products. Livestock farming can be made more efficient so that more meat can be produced per kilo of feed, but often at the cost of animal welfare. Crop production per hectare can be raised, but this requires the use of scarce energy, water and expertise, and also requires higher fertiliser inputs. Using less fertiliser is better for the climate, but has adverse effects on biodiversity because more land is needed to produce the same amount of meat. Farmed fish can replace caught (wild) fish, but the fish feed must be plant-based to minimise
disruption to marine ecosystems. However, plant-based fish feed must be grown on land, and this damages biodiversity. In short, there are many technical possibilities to increase global production of meat, fish and dairy products and make it more efficient, but these often have undesirable side-effects. Moreover, the expected technical improvements cannot fully compensate for the environmental conse-quences of increasing consumption levels.
Adapt consumption patterns?
All this raise the question of whether the continuing loss of biodiversity and impacts on climate are acceptable consequences of the desire by people around the world to adopt a Western diet with high levels of meat, fish and dairy prod-ucts, or whether it would be better to change our consumption patterns. In the Netherlands and other rich countries a diet with less protein is healthy and good for the environment. So far the Dutch government has made little attempt to influence people’s choice of food, limiting its activities efforts mainly to providing information.
Public debate desirable
The Netherlands Environmental Assessment Agency (PBL) advises the government to organise a wide-ranging public debate on this problem. This should help to make consumers more aware of the indirect and often hidden consequences of the
pro-Global consumption of animal protein will rise by 60% in the period 2003-2030. Consump-tion per head differs widely between countries. The Dutch and Americans consume more than twice as much animal protein per year as the global average.
Figure 7 1970 2003 2030 0 20 40 60 80 100 120 billion kg/year Other countries India China United States EU-15 Global
Consumption of animal protein
Nether-lands
United States
China India Global 0 10 20 30 kg protein/year 1970 2003 2030 Per person
duction and consumption of meat, fish and dairy products. In addition, ways should be found for national governments (working in international arenas) to influence developments in long and complex production chains that branch out across dif-ferent regions of the world. In the end, a balance will have to be found between the various social goals for food supply, climate, biodiversity and current Western consumption of meat, fish and dairy products.
Conclusions on environmental policy for the long term
From the findings described above we can conclude that environmental policy is still not effective enough to achieve all its long-term targets. Tightening up proposed policies on greenhouse gas emissions by road and rail traffic can bring the chosen targets within reach. For energy saving, renewable energy sources and the quality of surface waters, fundamental revisions of policy are needed to make policy instruments compatible with achieving the targets. This also applies at the global level to the environmental consequences of the production of meat, fish and dairy products. Solving these long-term problems demands both technological and governance changes.
So far 90% of all environmental improvements have been achieved through the introduction of cleaner production and transport technologies. This is unlikely to change in future. Many of the technologies needed to achieve the environmen-tal targets for 2002 are still too expensive. Some of the technologies needed to achieve the indicative climate targets for 2050 are even still in the experimental stage, such as carbon storage technologies and electric cars. In the current reces-sion many incentives for developing and introducing clean technologies have fallen by the wayside, and for the next few years national governments will have no funds available to compensate for this by providing additional subsidies. This means that new incentives will be needed for developing technologies that can provide suf-ficient protection for the environment.
Besides technical environmental innovations, new forms of governance are needed to tackle the long-term environmental problems, especially at the international level. New administrative arrangements are need to overcome the continual decline in biodiversity and impacts on the climate. The EU could play a more coordi-nating role in the development of low-emission energy supplies, which are needed to achieve the long-term climate targets. Improving the production chains of meat, fish and dairy products can provide an important boost to the conservation of biodi-versity, but because these production chains branch out around the globe, national governments can only make a limited impact on their environmental performance. The Dutch government, though, is in a position to make a greater than average contribution because the Dutch agricultural sector is a relatively powerful party in these global production and supply chains.
rug
snijlijn
snijlijn
The Netherlands Environmental Assessment Agency analyses spatial and social developments in (inter) national context, which are important to the human, plant and animal environment. It conducts scientific assessments and policy evaluations, relevant to strategic government policy. These assessments and evaluations are produced both on request and at the agency’s own initiative.
Netherlands Environmental Assessment Agency, September 2009