PBL Note
The potential contribution of
a nitrogen emission control
area to national targets under
a revised EU national
emission ceiling directive
Results for countries bordering the North Sea and Baltic See
Pieter Hammingh, Jukka-Pekka Jalkanen, Lasse Johansson, Jan de Ruiter
Corresponding author:
pieter.hammingh@pbl.nl
April 2015
The potential contribution of a nitrogen emission control area to national targets under a revised EU national emission ceiling directive
© PBL Netherlands Environmental Assessment Agency / FMI Finnish Meteorological Institute The Hague/Bilthoven, 2015
PBL publication number: 1699 Corresponding author pieter.hammingh@pbl.nl Authors
Pieter Hammingh1, Jukka-Pekka Jalkanen2, Lasse Johansson2, Jan de Ruiter1 1 PBL Netherlands Environmental Assessment Agency
2 FMI Finnish Meteorological Institute Acknowledgements
The authors would like to thank Jos Olivier (PBL) for his extensive review and data quality control, and Jens Borken-Kleefeld (IIASA), Rob Maas (RIVM), Christer Ågren (AIRCLIM), Roel Hoenders (EC) and Winand Smeets (PBL) for their review and constructive comments on earlier versions of this document. Last but not least, the authors would like to thank Gerben
Geilenkirchen (PBL) for estimating the impacts of a postponement of the implementation date of a nitrogen emission control area.
Graphics
PBL Beeldredactie
Production coordination and English-language editing PBL Publishers
This publication can be downloaded from: www.pbl.nl/en. Parts of this publication may be reproduced, providing the source is stated, in the form: Hammingh P et al. (2015), The
potential contribution of a nitrogen emission control area to national targets under a revised EU national emission ceiling directive. The Hague: PBL Netherlands Environmental Assessment Agency.
PBL Netherlands Environmental Assessment Agency is the national institute for strategic policy analyses in the fields of the environment, nature and spatial planning. We contribute to improving the quality of political and administrative decision-making, by conducting outlook studies, analyses and evaluations in which an integrated approach is considered paramount. Policy relevance is the prime concern in all our studies. We conduct solicited and unsolicited research that is both independent and always scientifically sound.
PBL Netherlands Environmental Assessment Agency 3
Summary
New sea shipping policies may contribute under the NECD proposal
In December 2013, for the review of the National Emission Ceilings Directive, the European Commission published a proposal (the NECD proposal) on the reduction in national air polluting emissions, containing national emission reduction targets for the period between 2005 and 2030. These national targets were recalculated in January 2015 to incorporate the latest insights by EU Member States. To comply with the proposed national targets, the NECD proposal offers the EU Member States the flexibility to replace (offset) part of the required reduction in national emissions from land sources by new reductions achieved in international shipping. A few conditions have been set under the offsetting mechanism. Countries can only use 20% of NOx, SO2 and PM2.5 emission reductions achieved due to new international shipping policies (i.e. in addition to current policies). Moreover, emission reductions at sea must take place within a country’s territorial waters, Exclusive Economic Zone (EEZ), or pollution control zone.
First estimates of new NOx shipping policy contributions under the NECD proposal Taking into account the NECD proposal and its terms, this report provides the first estimates of the contribution in 2030 of a Nitrogen Emission Control Area (NECA) in the North Sea and Baltic Sea to the national emission reduction targets for bordering countries. We assumed the NECAs being effective for new-build ships from 2016 onwards. In addition, we provide some insight into the effects of postponing the effective date to 2021. This report takes into account the estimated nitrogen oxides emission reductions due to a NECA by 2030, as given by different studies (VITO, 2013; Jonson, 2014; PBL, 2012). The VITO (2013) report was used in the analysis that supported the Commission’s proposal.
Although our report only examines the contribution of a NECA, also other new international shipping policies that go beyond current legislation and policies may be used under the offsetting mechanism. The NECA contribution was examined in two different comparisons to indicate the relevance of the offered flexibility (see below).
Comparison I: limited contributions found for Estonia, Denmark, Sweden and the Netherlands
The first comparison focused on the potential contribution of Nitrogen Emission Control Areas to the achievement of national nitrogen oxides emission reduction targets for the period between 2005 and 2030, as proposed by the Commission for EU Member States. Based on the VITO (2013) study, the largest contributions were found for Estonia, Denmark, Sweden and the Netherlands (4%–9%). Smaller contributions were calculated for Latvia, Finland and the United Kingdom (1% to nearly 4%). The smallest contributions were calculated for Belgium, Lithuania, Germany, France and Poland. If a country received a high ranking in this analysis, this can be explained by a relatively large reduction in nitrogen oxides by 2030 within its EEZ as a result of such a NECA and by a relatively small emission reduction target for land-based nitrogen oxide emissions between 2005 and 2030 under the NECD proposal. The above contributions were based on NECA impacts according to the VITO study and should be considered the maximum. The studies by PBL (2012) and Jonson (2014) result in contributions that are roughly 1 to 2 percentage points lower.
Comparison II: substantial contributions found for Denmark, the Netherlands and the United Kingdom
For analysis of the contribution of NECAs to the achievement of proposed national emission reduction targets for 2030, it should be noted that the overall reduction targets (or
commitments), were set by the Commission and, for most Member States, consist of two parts. The first and main part of the target concerns the emission reductions over the period between 2005 and 2030 that will result from all current climate, energy and air pollution legislation (so-called current legislation or CLE). The second and smaller part was added by the Commission to
reflect their additional ambition for further air pollution abatement, beyond the levels achieved through CLE. To achieve this 'additional' emission reduction target by 2030, additional measures have to be taken by the Member States.
These additional targets were used in a second comparison of potential NECA contributions. As these additional reductions are much smaller than the overall national reduction targets, the NECA contribution becomes much more substantial. An argument for this second comparison is given by the rationale that, in principle, the national nitrogen oxides reduction targets due to CLE already have been agreed on and the impacts of CLE, per Member State, are assumed not to be offset by reductions in sea shipping emissions.
The second comparison indicates that, with an NECA, Denmark can offset the additional part of its nitrogen oxides reduction targets for 2030. Denmark then would not need to take additional nitrogen oxides measures for its land-based emission sources up to 2030. Having a Nitrogen Emission Control Area would also deliver a substantial contribution for the Netherlands and the United Kingdom. Smaller contributions were found for France, Belgium, Germany, Poland and Latvia. If a country received a high ranking in this analysis, this can be explained by a relatively large reduction in nitrogen oxides by 2030 within its EEZ as a result of such a NECA, and by a relatively small additional reduction target for land-based nitrogen oxide emissions under the NECD proposal.
Postponing the implementation of a NECA will reduce its contribution to 2030 targets The estimates and conclusions in this report are based on the assumption that Nitrogen
Emission Control Areas in the North Sea and the Baltic Sea will come into effect for new-build ships in January 2016. However, this date is currently under discussion, and a postponement is more than likely. A recent PBL report (Smeets et al.,2014) indicates that postponing the implementation to 2021 would nearly halve the NECA contribution to the achievement of nitrogen oxide emission reduction targets of the Netherlands for 2030. This may also apply to other EU Member States bordering the North Sea and the Baltic Sea.
Using different emission inventories for sea shipping provides insight into uncertainty The estimations in this report are based on recent but different state-of-the-art emission
inventories and projections for sea shipping activities. The use of various inventories provides insight into the uncertainty about future contributions of Nitrogen Emission Control Areas under a new National Emission Ceilings Directive. The differences in estimates of future contributions were found to be relatively large. However, the detail and range in the results in this report is considered suitable for the purpose of informing policymakers about the expected order of magnitude of NECAs offsetting potential to contribute to national targets under the NECD proposal for the EU Member States that border the North Sea and the Baltic Sea.
Future studies
This study focuses on the potential reduction in nitrogen oxide emissions per Exclusive Economic Zone (EEZ) as a result of a NECA and the contribution under the NECD proposal. Future,
complementary studies may focus on the implications of the offsetting mechanism for air quality in the EU Member States that border the North Sea and the Baltic Sea and the economic
PBL Netherlands Environmental Assessment Agency 5
1 Introduction
European Commission launches proposal for a new National Emission Ceilings Directive
In December 2013, the European Commission published a proposal for new National Emission Ceiling Directive (NECD proposal). The proposal contains new national emission targets for all EU Member States for 2020 and 2030, compared to 2005 levels, for the air pollutants NOx, SO2, NH3, NMVOC, PM2,5 and CH4 (EC, 2013). The proposal also presents new intermediate national emission targets set for 2025. In January 2015, IIASA published recalculated national emission reduction targets based on new information on baseline developments that was provided by EU Member States between December 2013 and November 2014 within the framework of bilateral consultations (IIASA, 2015). In this report, both the absolute emission reduction targets as in the original commission proposal and the recalculated national targets are taken into account. New shipping policies may contribute under the proposal
To comply with the targets for 2025 and 2030, the NECD proposal offers a flexibility to offset NOx, SO2 and PM2.5 emission reductions achieved in international shipping against NOx, SO2 and PM2.5 emissions from domestic land-based sources in the same year. This may relieve the policy pressure on domestic sources. However, a number of conditions must be taken into account: only new shipping measures (i.e. that go beyond current policy) can be used in offsetting, reductions must take place in the Member state’s territorial waters or Exclusive Economic Zone (EEZ), effective monitoring and inspection measures should be implemented and, last but not least, only a maximum of 20% of new emission reductions at sea can be used in this offsetting.
New shipping policies for NOx under discussion
Currently, the countries bordering on the North Sea and the Baltic Sea are involved in a policy-making process concerning an application to the IMO have the North Sea (including the English Channel) and Baltic Sea designated as a Nitrogen Emission Control Area (NECA). Such maritime areas are intended to reduce nitrogen oxide emissions. This, in turn, will contribute to less air pollution, smaller health impacts and decreased ecosystem eutrophication (e.g. PBL, 2012). Currently, the discussions and negotiations on NECAs in the North Sea and Baltic Sea are ongoing. One of the elements under discussion is the implementation date of the Tier III requirements for newly built ships in those future NECAs. Although, in 2008, the IMO set 2016 as the year in which NECAs were to come into effect, amendments made in 2014 allow for a later year of implementation. The current status of this discussion indicates that such a delay is more than likely to be agreed on.
Although this report only examines NECA contributions under the NECD proposal, other new international shipping policies that would be more stringent than current policy could also be used in such an offsetting mechanism under a future NEC Directive.
Impacts of NOx policies on shipping emissions are known, but more details are needed Ongoing policy processes have initiated a number of research projects that examine the environmental and economic impacts of Nitrogen Emission Control Areas in the North Sea and the Baltic Sea (Jonson et al., 2015; Johansson et al., 2013; VITO, 2013; PBL, 2012; Danish EPA, 2012; HELCOM, 2012; Kalli et al., 2010). Included in most projects is the preparation, adjustment or update of shipping emission inventories, emission projections, and a scenario analysis of the impacts of a NECA on future shipping emissions. However, all of those research projects present their results in terms of total emissions from international shipping for a particular sea and total emission reductions as a result of a NECA being implemented for that sea. Unfortunately, these research projects do not distinguish between the reductions in territorial waters or Exclusive Economic Zone per Member State. Such a distinction is exactly
what the European Member States need in order for them to estimate the future contribution of a NECA to their national targets under the NECD proposal.
Estimating the impacts of a NECA per Exclusive Economic Zone
This paper presents estimates of nitrogen oxide emission reductions by 2030, due to the implementation of a NECA per Exclusive Economic Zone (EEZ), for the EU Member States bordering the North Sea and the Baltic Sea. As explained above, these estimates per EEZ can be used by EU Member States in the offsetting mechanism under the NECD proposal. These
estimates are based on three detailed spatial emission inventories that are described in Chapter 2.
In addition to these three spatial inventories, the estimates also take into account the marine emission inventory made by VITO (2013) under their preparatory work for the NECD proposal. Only regional emission totals and NECA impacts on these totals were reported by VITO.
Information from the three detailed spatial inventories was used to distribute the totals from the VITO report over the relevant EEZs.
PBL Netherlands Environmental Assessment Agency 7
2 Methods and data
2.1 General approach
This study’s general approach consists of five steps:
1. Spatially distributed (gridded) emission inventories were collected. One grid for the North Sea only for the year 2030, and two grids that both cover the North Sea and the Baltic Sea for the years 2009 and 2011;
2. These gridded emissions were processed using ARC Info GIS software. A layer was added that describes the boundaries of the EEZs per EU Member State. Using these boundaries, the gridded shipping emissions in the North Sea and the Baltic Sea could be attributed to the individual EEZs of the EU Member States and the non-EU countries of Norway and Russia; 3. These emissions per EEZ and the total emissions per sea area enabled us to derive the average
relative contribution per EEZ to the total emissions for the North Sea and the Baltic Sea; 4. This relative contribution per EEZ was subsequently used to distribute reported total nitrogen
oxide emission reductions per North Sea and Baltic Sea NECA over the relevant EEZs. This was done under the assumption that the spatial distribution of the nitrogen oxide reductions of 2030 would be the same as those in the current emission inventories. The analysis also assumes that the NECAs will be implemented in 2016. In addition, this report provides some insight into the effects of postponing this implementation to 2021. Following the NECD proposal, we assumed only 20% of the 2030 nitrogen oxide reductions due to a NECA could be used for offsetting;
5. To indicate the importance of the offsetting mechanism, we compared the nitrogen oxide emission reductions due to a NECA per EEZ against the national nitrogen oxide emission reduction targets set for 2030 under the NECD proposal. Two types of comparisons were made, which are explained below.
Two types of comparisons
The overall national emission reduction targets for 2030 (EC, 2013), compared to 2005 levels, for each Member State and for most pollutants are generally composed of two parts: 1) an estimate of the emission reductions by 2030, incorporating current climate, energy and air pollution legislation (so-called current legislation or CLE); and 2) an additional emission reduction ambition to be achieved by 2030. Examples of current legislation are the European emission standards for passenger cars and trucks, European and national legislation for industrial combustion
installations and fuel quality standards.
The additional part of the national reduction target reflects the EC’s additional ambition per EU Member State, as formulated in the ‘Thematic Strategy on Air Pollution (TSAP; EC, 2013)’. To achieve this additional emission reduction, new measures have to be implemented by the EU Member States. Both the CLE part and the additional part of the national reduction targets can easily be derived from the reports by IIASA that support the NECD proposal (IIASA, 2014). A more recent report presents recalculated targets (IIASA, 2015). We noticed that the NECD proposal and the recalculated nitrogen oxide targets do not include such an additional reduction part for each EU Member State. For these member states, the nitrogen oxide emission reduction targets are only based on the emission reductions under current legislation (CLE).
In a first analysis, we compared the potential contribution by an NECA (20%) per EEZ with the ‘overall’ national emission reduction targets for nitrogen oxide for the countries bordering the North Sea and the Baltic Sea. In a second analysis, we focused on the NECAs potential
contribution to only the additional nitrogen oxide emission reductions. As the additional part of the reduction targets is much smaller than the overall national emission reduction targets, the NECA contributions become much more substantial. An argument for the second comparison is given by the rationale that, in principle, the national nitrogen oxide reduction targets due to CLE already have been agreed on and the impacts of CLE, per Member State, are assumed not to be offset by reductions in sea shipping emissions.
We refer to the European Commission and IIASA for the methods and assumptions that were used for deriving the national nitrogen oxide emission reduction targets for the EU Member States (EC, 2013; IIASA, 2014; IIASA, 2015).
2.2 Emission inventories for sea shipping and nitrogen oxide reductions due to NECAs
Gridded NOx emission inventories for sea shipping
Three emission inventories were available that provide a detailed spatial distribution of NOx
emissions from shipping. The inventory for the North Sea only was based on an inventory for 2009 by MARIN (2011). This inventory covers the emissions from international shipping but also from certain activities that fall under the EU/IPCC category of domestic shipping (e.g. coastal shipping and fisheries). MARIN’s emission grid for the North Sea of 2009 has a resolution of 5 x 5 km2. This
grid was extrapolated to 2030 by PBL-Netherlands Environmental Assessment Agency, taking into account different growth assumptions for container ships and other ship types towards 2030 (PBL, 2012). Moreover, other relevant projection assumptions were accounted for, such as TIER II emission standard penetration, efficiency improvements and the use of liquid natural gas (LNG). This projection can be interpreted as a baseline projection for North Sea shipping emissions up to 2030. PBL (2012) projects that fuel use by and CO2 emissions from shipping on the North Sea may
increase by 22% between 2009 and 2030, while total NOx emissions may decrease by 6% (Table
2.1).
A second inventory provided by the Finnish Meteorological Institute (FMI, 2014) and published in Jonson et al., (2015) provides detailed spatial emission grids (about 3 x 3 km2) for both the North
Sea and the Baltic Sea, for the years 2009 (Figure 2.1) and 2011. These grids are prepared with FMI’s STEAM model by Jalkanen et al. (2009 and 2012) and Johansson et al. (2013).
It should be noted, that the FMI inventory covers emissions from all vessels equipped with an Automatic Identification System (AIS) transceiver, and models each vessel as a unique emission source. However, AIS is also installed voluntarily on smaller vessels, and some of the small-vessel activities and their emissions are also included in the FMI inventory. This implies that the
inventory covers both international shipping and activities that fall under the EU/IPCC category of domestic shipping.
Jonson et al., (2015) also presents emission projections up to 2030. His results show that NOx
emissions may decrease by about 3% in the North Sea and by 8% in the Baltic Sea, up to 2030, compared to 2009 levels (Table 2.1 and 2.2). Those projections are based on the work by Kalli et al. (2013). Kalli assumes annual growth rates of 1.5% for most ship types and 3.5% for container ships, and annual efficiency improvements that range between 1.27% and 2.25%, depending on ship type.
A comparison of total NOx emissions as reported by Jonson et al. (2015) and those by PBL (2012)
PBL Netherlands Environmental Assessment Agency 9
before in a comparison of base year emissions between an earlier version of an inventory by FMI’s STEAM model and PBL (2012). PBL (2012) examined the differences between both inventories and found that especially fuel use estimates for auxiliary engines were much larger in FMI’s estimates. In addition, both inventories use different model approaches and input data. Such substantial differences in maritime emission inventories for European waters were also found in a study by the European Environment Agency in 2013 (EEA, 2013). EEA explained that these differences are the result of applying different models and statistical data, as well as covering different
geographic domains.
Marine emission inventory by VITO supports the Commission’s NECD proposal
We also consider the marine emission inventory made by VITO (2013) under their preparatory work for the Commission’s NECD proposal of December 2013. However, VITO only reports on emission totals and projected impacts of the implementation of NECAs on such totals for the Baltic Sea and the North Sea (Tables 2.1 and 2.2). No gridded emissions were available. VITO describes their methodology as the Extremis/Eurostat/EMMOSS approach. They state that their inventory does not cover any of the ships that are merely passing through, i.e. those travelling the European waters but not entering EU ports. Moreover, the VITO methodology concentrates on international shipping and excludes domestic shipping. VITO provides shipping emissions for a number of air pollutants for 2005, 2020, 2030 and 2050. In addition, the report presents a number of scenarios that are used to examine the impacts of different measures on emissions, including the implementation of NECAs in the North Sea and the Baltic Sea.
Table 2.1 Nitrogen oxide emission projections and NECA impacts, for the North Sea, for 2030
Source NOx base year
emissions [kt] NOx emissions by 2030 under current legislation [kt] NOx emissions by 2030 under NECA implementation in 2016 [kt] NOx emission reductions by 2030 due to NECA implementation [kt] PBL, 2012 472 (2009) 448 319 1291 Jonson et al., 2015 662 (2009) 642 457 185 VITO, 20132 518 (2005) 503 269 234
1 the reduction of 129 kilotonnes by 2030 was estimated for a relatively older fleet, and a
reduction of 150 kilotonnes for a relatively younger fleet (PBL, 2012).
2 VITO (2013) states that emissions exclude those from domestic shipping and ships not entering
EU ports.
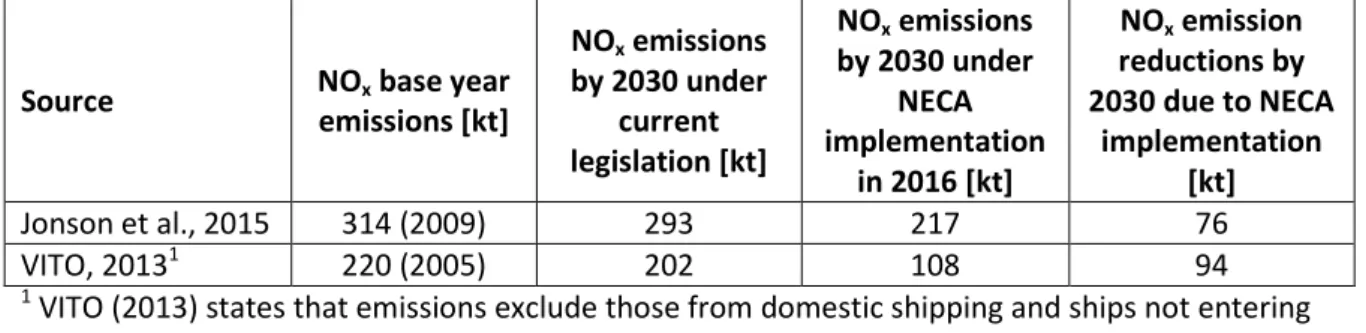
Table 2.2 Nitrogen oxide emission projections and NECA impacts, for the Baltic Sea, for 2030
Source NOx base year
emissions [kt] NOx emissions by 2030 under current legislation [kt] NOx emissions by 2030 under NECA implementation in 2016 [kt] NOx emission reductions by 2030 due to NECA implementation [kt] Jonson et al., 2015 314 (2009) 293 217 76 VITO, 20131 220 (2005) 202 108 94
1 VITO (2013) states that emissions exclude those from domestic shipping and ships not entering
2.3 Emissions in Exclusive Economic Zones estimated using GIS analysis
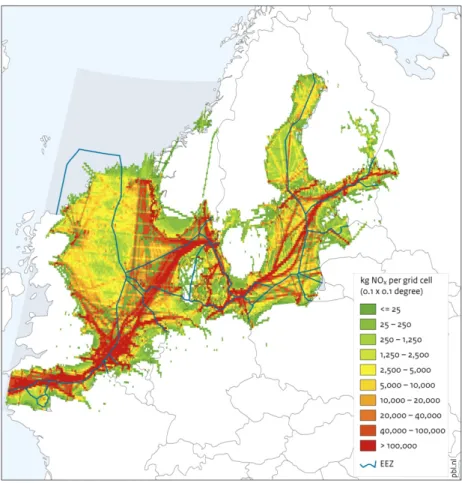
In order to estimate nitrogen oxide emissions per EEZ in the North Sea and the Baltic Sea, the EEZ boundaries at sea and on land had to be determined (Figure 2.1). The boundaries at sea were taken from www.marineregions.org. We had to determine the boundaries on land ourselves. Using the ARC info GIS analysis software enabled us to attribute the spatially distributed or gridded shipping emission inventories to the Exclusive Economic Zones of the countries that border on the North Sea and the Baltic Sea.
2.4 Legal aspects of accounting for IMO legislation under the NECD proposal
IMO standards apply to both international and domestic shipping, but these sectors are treated differently under the NECD proposal
Under the NECD proposal, only 20% of the emission reductions that result from new EU policies and legislation on international shipping may be used for offsetting emissions from land-based sources. Nitrogen Emission Control Areas (NECAs), however, not only apply to international shipping but also to domestic sea fishing and other domestic shipping activities at sea. The IMO rules on nitrogen oxide emissions under the IMO MARPOL Annex VI apply to all ships at sea that have an engine capacity installed of over 130 kW (IMO MARPOL Annex VI) and that have been built after the NECA implementation date. This implies that reductions due to a NECA in domestic sectors count for 100% for EU Member States under the current NEC Directive. A short review of the engines currently installed on Dutch fishing vessels indicates that most vessels have an engine power of over 130kW (LEI, 2014). This means that a large part of the Dutch fishing fleet would fall under the MARPOL Annex VI, NOx code. Hence, NECA-related reductions in nitrogen oxide
emissions from the fishing sector can be completely accounted for under the proposal for a new NEC directive. The same appears to hold for emission reductions in other domestic shipping sectors, such as coastal shipping. It seems desirable that the final NEC Directive clarifies this point.
PBL Netherlands Environmental Assessment Agency 11 Figure 2.1 Nitrogen oxide emissions at the North Sea and the Baltic Sea (sea boundaries of the Exclusive Economic Zones are shown).
3 Results
3.1 Nitrogen oxide reductions in Exclusive Economic Zones due to NECA implementation
Using the GIS analysis (Chapter 2) and the gridded emission inventories by PBL (2012) and FMI (2014), nitrogen oxide emissions per EEZ were calculated for the countries bordering the North Sea (Table 3.1) and those bordering the Baltic Sea (Table 3.2). A relatively large share of the overall North Sea nitrogen oxide emissions originate from the Exclusive Economic Zones (EEZs) of the United Kingdom and the Netherlands. In addition, also relatively large shares of the overall North Sea and Baltic Sea nitrogen oxide emissions were found in the EEZs of Denmark, Sweden and Germany. Those three countries have EEZs in both the Baltic Sea and the North Sea.
A comparison of the emissions inventories by FMI (2014) for 2009 and 2011 shows the inter-annual changes in shipping activities in the Baltic Sea and the North Sea, as well as the resulting shipping emissions (Tables 3.1 and 3.2, Figure 3.1). We noticed substantial inter-annual changes in NOx emissions in the North Sea’s EEZs of Denmark, Germany and Sweden. According to the FMI results, total NOx emissions in the North Sea did not change much between 2009 and 2011. This implies that shipping activities have increased in some parts of the North Sea and decreased in other parts. Other developments observed by FMI (2014) include a
substantial increase in small ship activities in the EEZs of the Netherlands and Germany in 2011, compared to 2009. This may be caused by an improvement in the quality and completeness of AIS data. The Baltic Sea inventories of shipping emissions show only slight inter-annual variations in the spatially distributed emissions.
According to the FMI results, total NOx emissions in the North Sea did not change much between 2009 and 2011. However, the annual reports by MARIN for the inventory years 2009 and 2011 indicate that NOx emissions in the North Sea increased by nearly 10% (MARIN, 2011; MARIN, 2013). MARIN attributes this growth partly to the recovery of the world economy, and partly to an improvement in the quality and completeness of AIS data (MARIN, 2013). The differences between the insights into emission trends found in the studies by FMI and MARIN are an indication of the level of uncertainty that is associated with marine emission inventories.
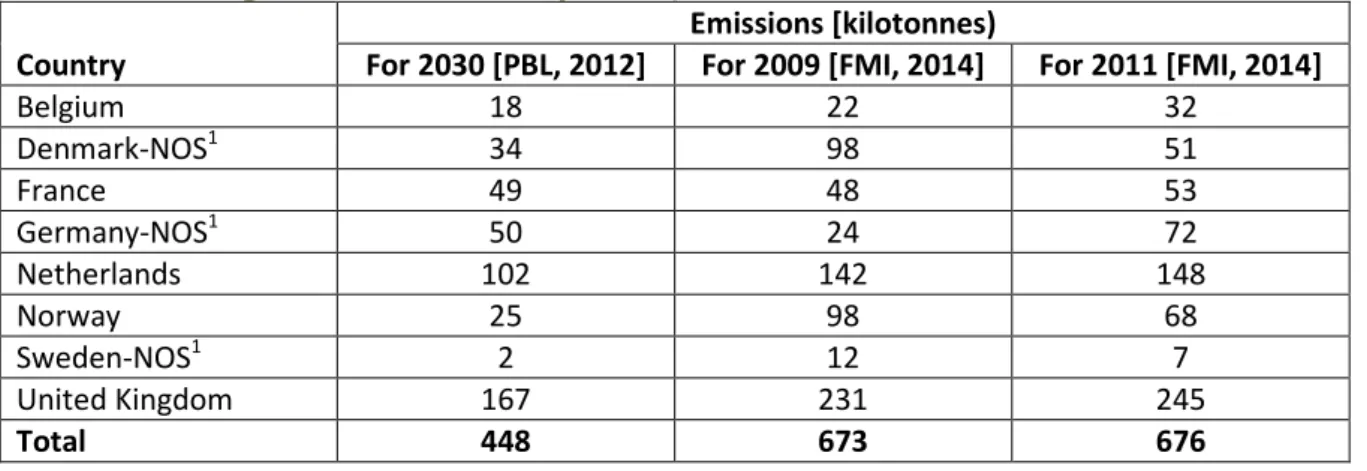
Table 3.1 Nitrogen oxide emissions per EEZ, for the North Sea countries
Country For 2030 [PBL, 2012] Emissions [kilotonnes) For 2009 [FMI, 2014] For 2011 [FMI, 2014]
Belgium 18 22 32 Denmark-NOS1 34 98 51 France 49 48 53 Germany-NOS1 50 24 72 Netherlands 102 142 148 Norway 25 98 68 Sweden-NOS1 2 12 7 United Kingdom 167 231 245 Total 448 673 676
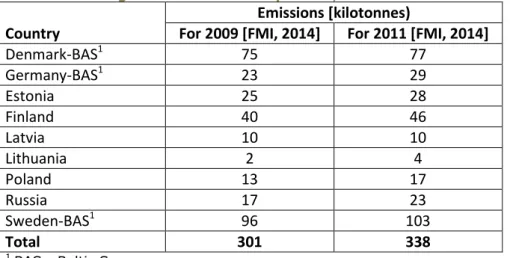
PBL Netherlands Environmental Assessment Agency 13 Table 3.2 Nitrogen oxide emissions per EEZ, for the Baltic Sea countries
Country For 2009 [FMI, 2014] Emissions [kilotonnes) For 2011 [FMI, 2014]
Denmark-BAS1 75 77 Germany-BAS1 23 29 Estonia 25 28 Finland 40 46 Latvia 10 10 Lithuania 2 4 Poland 13 17 Russia 17 23 Sweden-BAS1 96 103 Total 301 338
1 BAS= Baltic Sea
Figure 3.1 Absolute difference between 2011 and 2009 emissions at the North Sea and the Baltic Sea. Blue means lower shipping activity observed in 2011 than in 2009, red means an increase in the activity in 2011.
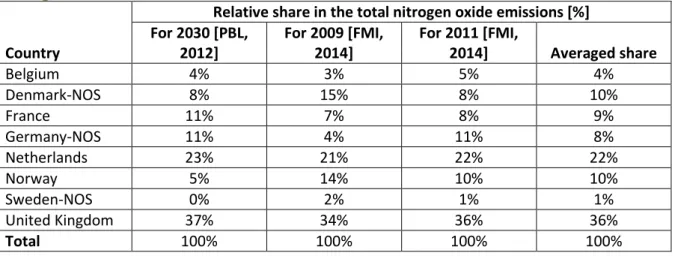
Based on Tables 3.1 and 3.2, we calculated the relative share of emissions per Exclusive
Economic Zone in the total nitrogen oxide emissions at the North Sea and the Baltic Sea (Tables 3.3 and 3.4). We averaged the relative shares based on the three grids for both the North Sea and the Baltic Sea, to end up with a more robust result. The average shares for the EEZs of the North Sea and the Baltic Sea were used to distribute the nitrogen oxide reductions over the relevant EEZs that would result from NECA implementation (see the next section).
Table 3.3 Relative share of emissions per Exclusive Economic Zone, in the total nitrogen oxide emissions at the North Sea
Country
Relative share in the total nitrogen oxide emissions [%] For 2030 [PBL,
2012] For 2009 [FMI, 2014] For 2011 [FMI, 2014] Averaged share
Belgium 4% 3% 5% 4% Denmark-NOS 8% 15% 8% 10% France 11% 7% 8% 9% Germany-NOS 11% 4% 11% 8% Netherlands 23% 21% 22% 22% Norway 5% 14% 10% 10% Sweden-NOS 0% 2% 1% 1% United Kingdom 37% 34% 36% 36% Total 100% 100% 100% 100%
NOS= North Sea
Table 3.4 Relative share of emissions per Exclusive Economic Zone, in the total nitrogen oxide emissions at the Baltic Sea
Country For 2009 [FMI, 2014] Relative share in the total nitrogen oxide emissions [%] For 2011 [FMI, 2014] Averaged share
Denmark-BAS 25% 23% 24% Germany-BAS 8% 9% 8% Estonia 8% 8% 8% Finland 13% 14% 13% Latvia 3% 3% 3% Lithuania 1% 1% 1% Poland 4% 5% 5% Russia 6% 7% 6% Sweden-BAS 32% 31% 31% Total 100% 100% 100%
BAS= Baltic Sea
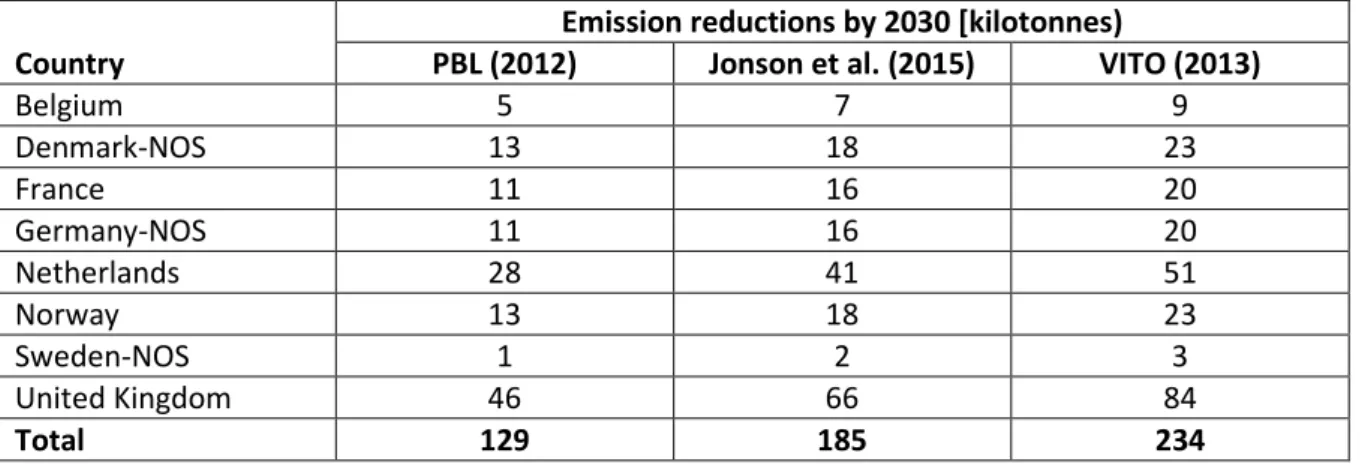
Nitrogen oxide emission reductions by 2030, per EEZ, due to NECA implementation The average shares for the North Sea and the Baltic Sea (Tables 3.3 and 3.4) were used to distribute the nitrogen oxide reductions by 2030 due to implementation of NECAs in the North Sea and the Baltic Sea (Tables 2.1 and 2.2.) over the relevant EEZs (Tables 3.5 and 3.6). These reductions per EEZ are used in the next section to calculate the contribution by NECAs per EU Member State under the NECD proposal. The analysis in this report assumes NECA
implementation in 2016.
For this report, we also examined the nitrogen oxide reductions by 2030, due to the implementation of NECAs, as calculated by VITO (2013). We distributed the total emission reductions estimated by VITO for the North Sea and Baltic Sea over the relevant EEZs, using the relative shares presented in Tables 3.3. and 3.4. The VITO results were used by IIASA to
analyse the cost-effectiveness of new nitrogen emission control areas and sulphur emission control areas, for the European Commission in 2013.
PBL Netherlands Environmental Assessment Agency 15 Table 3.5 Nitrogen oxide emission reductions by 2030, due to NECA implementation, per EEZ, for the North Sea countries
Country PBL (2012) Emission reductions by 2030 [kilotonnes) Jonson et al. (2015) VITO (2013)
Belgium 5 7 9 Denmark-NOS 13 18 23 France 11 16 20 Germany-NOS 11 16 20 Netherlands 28 41 51 Norway 13 18 23 Sweden-NOS 1 2 3 United Kingdom 46 66 84 Total 129 185 234
NOS= North Sea
Table 3.6 Nitrogen oxide emission reductions by 2030 due to NECA implementation, per EEZ for the Baltic Sea countries
Country Jonson et al. (2015) Emission reductions by 2030 [kilotonnes) VITO (2013)
Denmark-BAS 18 22 Germany-BAS 6 8 Estonia 6 8 Finland 10 13 Latvia 2 3 Lithuania 1 1 Poland 4 4 Russia 5 6 Sweden-BAS 24 29 Total 76 94
BAS= Baltic Sea
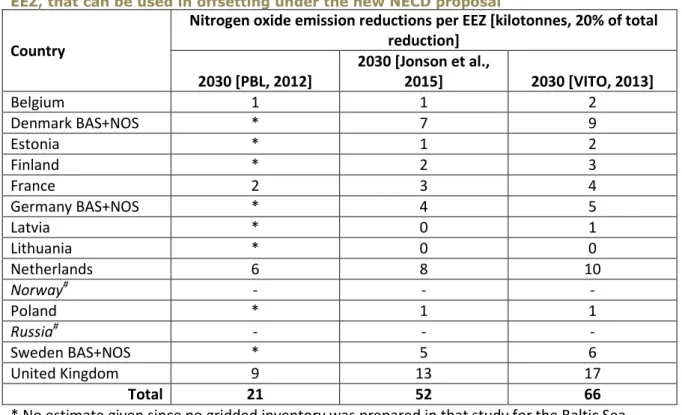
Reductions in nitrogen oxide emissions from sea shipping that can be used for offsetting, under the NECD proposal
Based on the nitrogen oxide emission reductions per EEZ (Tables 3.5 and 3.6), and accounting for the constraint that only 20% of the reductions that are due to new policy measures for sea shipping can be used under the NECD proposal, we calculated how much of the reduction can be used to achieve emission reduction targets under the NECD proposal (Table 3.7). Denmark, Germany and Sweden have EEZs in both the North Sea and the Baltic Sea. Expressed in absolute emission reductions, the United Kingdom, the Netherlands and Denmark can use the highest reduction levels for offsetting, under the NECD proposal.
Table 3.7 Nitrogen oxide emission reductions for international shipping by 2030, per EEZ, that can be used in offsetting under the new NECD proposal
Country
Nitrogen oxide emission reductions per EEZ [kilotonnes, 20% of total reduction]
2030 [PBL, 2012] 2030 [Jonson et al., 2015] 2030 [VITO, 2013]
Belgium 1 1 2 Denmark BAS+NOS * 7 9 Estonia * 1 2 Finland * 2 3 France 2 3 4 Germany BAS+NOS * 4 5 Latvia * 0 1 Lithuania * 0 0 Netherlands 6 8 10 Norway# - - - Poland * 1 1 Russia# - - - Sweden BAS+NOS * 5 6 United Kingdom 9 13 17 Total 21 52 66
* No estimate given since no gridded inventory was prepared in that study for the Baltic Sea # Not an EU Member State
NOS= North Sea, BAS= Baltic Sea
3.2 NECA contribution to national emission reduction targets under the NECD proposal
As explained in Section 2.1, we made two types of comparisons to indicate the importance of the contribution by NECAs to the national emission reduction targets for nitrogen oxide for the countries bordering the North Sea and the Baltic Sea. The first comparison involved the overall national emission reduction targets for nitrogen oxide (Section 3.2.1). The second comparison involved the additional national emission reduction targets for nitrogen oxide (Section 3.2.2). As explained in Section 2.1, the NECD proposal and the recalculated targets do not include such an additional target for every EU Member State.
3.2.1 NECA Contribution to overall national emission reduction targets Here, we compared the NECA contribution per EEZ (Table 3.7) with the overall national emission reduction targets for nitrogen oxide for 2030, compared to 2005 levels, for the EU Member States bordering on the North Sea and the Baltic See (Table 3.8 and 3.9). The NECD proposal (EC, 2013; IIASA, 2014) and the recalculated targets (IIASA, 2015) contain overall national nitrogen oxides reduction targets for all EU Member States that border on the North Sea and the Baltic Sea.
PBL Netherlands Environmental Assessment Agency 17
Most substantial contributions were found for Estonia, Denmark, Sweden and the Netherlands Our results show that, based on the NECA impacts according to VITO (2013, Table 2.1 and 2.2), the relative contribution due to NECA implementation to the overall national NOx reduction
targets for nitrogen oxide for EU Member States is most substantial for Estonia, Denmark, Sweden and the Netherlands (maximum between 4% and 9%). Smaller contributions were calculated for Latvia, Finland and the United Kingdom (maximum between 1% and 3.7%). The smallest
contributions were calculated for Belgium, Lithuania, Germany, France and Poland. If a country received a high ranking in this second analysis, this can be explained by a relatively large reduction of nitrogen oxides by 2030 within its EEZ as a result of NECA implementation, and by a relatively small nitrogen oxide emission reduction target for 2030, compared to 2005 levels, under the NECD proposal.
The relative contributions as given above should be considered a maximum and would be roughly 1 to 2 percentage points lower if the comparison were to be based on the NECA impacts
according to PBL (2012) or Jonson (2014), see Tables 3.8 and 3.9. We already saw that the estimated nitrogen oxide reductions by 2030 due to NECA implementation are relatively large according to VITO (2013), in comparison to those calculated by PBL (2012) and Jonson (2014), see Tables 2.1 and 2.2.
Table 3.8 NECA contributions to the overall NOx reduction targets for 2030 for
Member States, based on EC (2013) (for details see IIASA, 2014)
Country
Overall national NOx reduction targets for
2030 [Table 4.10 in IIASA,
2014] [kt]
Relative NECA contribution by 2030 to the overall national NOx reduction targets [%]
2030 [PBL, 2012] 2030 [Jonson, 2015] 2030 [VITO, 2014] Belgium 187 0.6% 0.8% 1.0% Denmark BAS+NOS 125 5.8% 7.3% Estonia 24 5.2% 6.5% Finland 102 2.0% 2.5% France 950 0.2% 0.3% 0.4% Germany BAS+NOS 958 0.5% 0.6% Latvia 16 3.0% 3.7% Lithuania 34 0.4% 0.5% Netherlands 258 2.2% 3.1% 4.0% Norway nd nd nd nd Poland 439 0.2% 0.2% Russia nd nd nd nd Sweden BAS+NOS 140 3.7% 4.5% United Kingdom 1083 0.9% 1.2% 1.6% Total 4316 0.5% 1.2% 1.5%
nd = no data as these countries are not EU Member States and EU targets do not apply
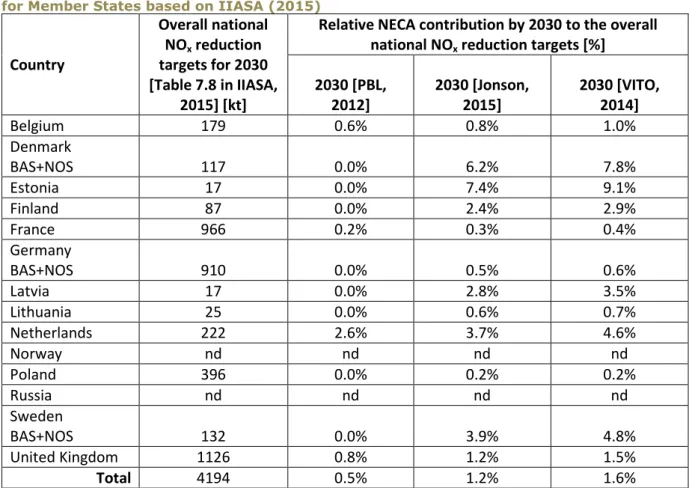
Table 3.9 NECA contribution to the recalculated overall NOx reduction targets by 2030
for Member States based on IIASA (2015)
Country Overall national NOx reduction targets for 2030 [Table 7.8 in IIASA, 2015] [kt]
Relative NECA contribution by 2030 to the overall national NOx reduction targets [%]
2030 [PBL, 2012] 2030 [Jonson, 2015] 2030 [VITO, 2014] Belgium 179 0.6% 0.8% 1.0% Denmark BAS+NOS 117 0.0% 6.2% 7.8% Estonia 17 0.0% 7.4% 9.1% Finland 87 0.0% 2.4% 2.9% France 966 0.2% 0.3% 0.4% Germany BAS+NOS 910 0.0% 0.5% 0.6% Latvia 17 0.0% 2.8% 3.5% Lithuania 25 0.0% 0.6% 0.7% Netherlands 222 2.6% 3.7% 4.6% Norway nd nd nd nd Poland 396 0.0% 0.2% 0.2% Russia nd nd nd nd Sweden BAS+NOS 132 0.0% 3.9% 4.8% United Kingdom 1126 0.8% 1.2% 1.5% Total 4194 0.5% 1.2% 1.6%
nd = no data as these countries are not EU Member States and EU targets do not apply
NOS= North Sea, BAS= Baltic Sea
3.2.2 NECA contribution to the additional national emission reduction targets
Here, we compared the NECA contribution per EEZ (Table 3.7) with the additional national emission reduction targets for nitrogen oxide for 2030, for the EU Member States bordering on the North Sea and the Baltic See (Tables 3.10 and 3.11). As stated in Section 2.1, the argument for this second comparison is given by the rationale that, in principle, the national nitrogen oxide reduction targets under CLE already have been agreed on, and the impacts of CLE, per Member State, are assumed not to be offset by reductions in sea shipping emissions.
The NECD proposal, together with the IIASA background report, contains additional national nitrogen oxides reduction targets for seven EU Member States bordering on the North Sea and the Baltic Sea (Table 4.10 of IIASA, 2014). The more recent, recalculated targets contain
additional national nitrogen oxide reduction targets for eight EU Member States bordering on the North Sea and the Baltic Sea (Table 7.8 of IIASA, 2015). IIASA (2015) found that new insights resulted in recalculated additional national nitrogen oxide reduction targets that were
substantially lower compared to the originally calculated additional targets (IIASA, 2014). In total, there are 12 EU Member States that border on the North Sea and the Baltic Sea and 2 non-EU countries (Norway and Russia).
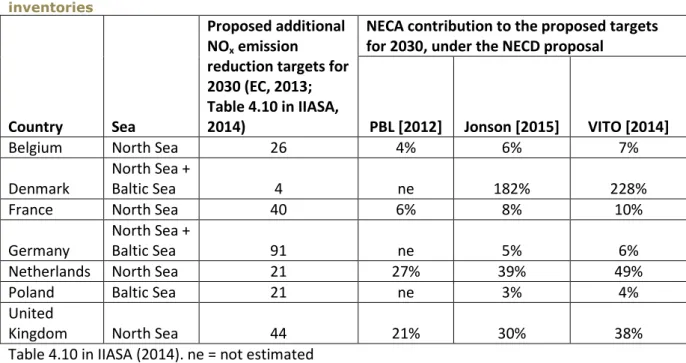
Largest contributions found for Denmark, the Netherlands and the United Kingdom The results (Table 3.10 and 3.11) show that, with NECA implementation, Denmark could already achieve their additional nitrogen oxide reduction target for 2030. Moreover, NECA
implementation would constitute a substantial contribution under the NECD proposal for the Netherlands and the United Kingdom. Smaller contributions were found for France, Belgium,
PBL Netherlands Environmental Assessment Agency 19 Germany, Poland and Latvia. The largest contributions were again calculated if based on the NECA impacts according to the VITO (2013) study. The studies by PBL (2012) and Jonson (2014) result in smaller contributions but do not change the ranking order. If a country received a high ranking, this can be explained by a relatively large reduction in nitrogen oxide emissions by 2030, within its EEZ, and by a relatively small additional reduction target for nitrogen oxide emissions from land-based sources, under the NECD proposal.
Table 3.10 relative NECA contribution to the proposed additional NOx emission
reduction targets per EU Member State by 2030, results based on three different inventories
Country Sea
Proposed additional NOx emission
reduction targets for 2030 (EC, 2013; Table 4.10 in IIASA, 2014)
NECA contribution to the proposed targets for 2030, under the NECD proposal
PBL [2012] Jonson [2015] VITO [2014]
Belgium North Sea 26 4% 6% 7%
Denmark North Sea + Baltic Sea 4 ne 182% 228%
France North Sea 40 6% 8% 10%
Germany North Sea + Baltic Sea 91 ne 5% 6%
Netherlands North Sea 21 27% 39% 49%
Poland Baltic Sea 21 ne 3% 4%
United
Kingdom North Sea 44 21% 30% 38%
Table 4.10 in IIASA (2014). ne = not estimated
Table 3.11 relative contribution of a NECA to the re-calculated ‘additional’ NOx
emission reduction targets per EU member state in 2030, results based on three different inventories Country Sea Recalculated additional NOx emission reduction targets for 2030 (Table 7.8 in IIASA, 2015)
NECA contribution to the recalculated targets for 2030, under the NECD proposal
PBL [2012] Jonson [2015] VITO [2014]
Belgium North Sea 9 11% 16% 21%
Denmark North Sea + Baltic Sea 3 ne 243% 304%
France North Sea 27 8% 12% 15%
Germany North Sea + Baltic Sea 48 ne 9% 11%
Latvia North Sea 1 ne 48% 59%
Netherlands Baltic Sea 9 63% 90% 114%
Poland North Sea 14 ne 5% 6%
United
Kingdom North Sea 37 25% 36% 45%
3.3. Impacts of postponing the NECA implementation
For the above estimates of potential NECA contributions and the conclusions, we assumed that Nitrogen Emission Control Areas in the North Sea and the Baltic Sea would be implemented by January 2016. However, this date is currently under discussion and is likely to be postponed. Although the impacts of such a postponement was not estimated for all North Sea and Baltic Sea countries, a recent PBL report estimates the effect for the Netherlands of postponing the NECA implementation in the North Sea to 2021 (PBL, 2014). The report indicates that, in such a case, the NECA contribution by 2030 as under the NECD proposal would be nearly half that of an
implementation in January 2016. The same effect may also apply to the other EU Member States that border on the North Sea and the Baltic Sea.
PBL Netherlands Environmental Assessment Agency 21
References
Campling P, Janssen L, Vanherle K, Cofala J, Heyes C and Sander R. (2013). Specific evaluation of emissions from shipping including assessment for the establishment of possible new emission control areas in European Seas. Final report March 2013. Vlaams Institute voor Technologisch Onderzoek-VITO, Mol, Belgium.
Danish EPA (2012). Economic impact assessment of a nitrogen emission control area at the North Sea, EPA, Copenhagen, Denmark.
EC (2013). Proposal for a Directive of the European Parliament and of the Council on the reduction of national emissions of certain atmospheric pollutants and amending Directive 2003/35/EC. COM(2013) 920 final, 2013/0443 (COD), European Commission, Brussels, Belgium.
EEA (2013). The impact of international shipping on European air quality and climate forcing. EEA Technical report No 4/2013. European Environment Agency, Copenhagen, Denmark.
FMI (2014). Personnel communication with Jukka-Pekka Jalkanen. Received gridded shipping emission inventories in NET-CDF format. Finnish Meteorological Institute, Helsinki, Finland. HELCOM (2012). Report of the NECA correspondence group on designation of the Baltic Sea as a
NOx emission control area. Including a proposal to designate the Baltic Sea as an emission
control area for nitrogen oxides. Including an overview of available technology to meet Tier III NOx emission standards with regard to the proposed Baltic Sea NOx emission control area.
33/2012. Baltic Marine Environment Protection Commission (HELCOM), Helsinki, Finland. IIASA (2014). The final policy scenarios of the EU clean air policy package. TSAP Report #11.
Version 1.1a. International Institute for Applied Systems Analysis (IIASA), Laxenburg, Austria. IIASA (2015). Adjusted historic emission data, projections, and optimized emission reduction
targets for 2030 – A comparison with COM data 2013. Part A: Results for EU-28. TSAP Report #16A Version 1.1. International Institute for Applied Systems Analysis (IIASA), Laxenburg, Austria.
Jalkanen J-P, Brink A, Kalli J, Pettersson H, Kukkonen J and Stipa T. (2009). A modelling system for the exhaust emissions of marine traffic and its application in the Baltic Sea area. Atmospheric chemistry and physics discussions, 9, 9209–9223.
Jalkanen J-P, Johansson L, Kukkonen J, Brink A, Kalli J and Stipa T. (2012). Extension of an assessment model of ship traffic exhaust emissions for particulate matter and carbon monoxide. Journal of Atmospheric chemistry and physics 12, 2641–2659.
Johansson L, Jalkanen J-P, Kalli J and Kukkonen J. (2013). The evolution of shipping emissions and the costs of regulation changes in the northern EU area, Atmos. Chem. Phys., 13, 11375– 11389, doi:10.5194/acp-13-11375-2013, 2013. 21950, 21958, 21959.
Jonson JE, Jalkanen J-P, Johansson L, Gauss M and Van der Gon HAC. (2014). Model calculations of the effects of present and future emissions of air pollutants from shipping in the Baltic Sea and the North Sea. Atmospheric Chemistry and Physics 14, 21943–21974.
Kalli J, Repka S and Karvonen T. (2010). Baltic NECA economic impacts, study report by the University of Turku, Centre for Maritime Studies, Finland.
Kalli J, Jalkanen J-P, Johansson L and Repka S. (2013). Atmospheric emissions of European SECA shipping: long-term projections. Journal of Maritime Affairs (2013) 12:129–145.
LEI (2014). Bedrijveninformatienet (Company information network (in Dutch)):
http://www.wageningenur.nl/nl/project/Visserij-in-cijfers.htm
PBL (2012). Assessment of the environmental impacts and health benefits of a nitrogen emission control area in the North Sea. Publication number 500249001. PBL Netherlands Environmental Assessment Agency, The Haque, the Netherlands.
PBL (2014). De kosten en baten van het Commissievoorstel ter vermindering van de nationale emissies van bepaalde luchtverontreinigende stoffen (The costs and benefits of the
(in Dutch)). Publication number 1465, ISBN: 978-94-91506-85-7. PBL Netherlands Environmental Assessment Agency, The Hague, the Netherlands.
MARIN (2011). Emissions 2009: Netherlands Continental Shelf, port areas and OSPAR II region. Report no. 24762-1-MSCN-rev.3. MARIN, Wageningen, the Netherlands.
MARIN (2013). Emissions 2011: Netherlands Continental Shelf, port areas and OSPAR II region. Report no. 26437-1-MSCN-rev.2. MARIN, Wageningen, the Netherlands.