ELECTRONIC PATIENT RECORDS ON
THE
BLOCKCHAIN:
A
VALUE
MANAGEMENT
PLATFORM
CASE-STUDY
Word count: 18.035Robin De Meyer
Student number : 01604208
Supervisor: Prof. Dr. Geert Poels
Master’s Dissertation submitted to obtain the degree of:
Master of Science in Business Economics: Corporate Finance
I
Permission
I declare that the content of this Master’s Dissertation may be consulted and/or reproduced, provided that the source is referenced.
II
Foreword
With this foreword I would like to acknowledge all those who assisted me throughout the entirety of this Master’s Dissertation.
First of all I would like to thank my supervisor Prof. dr. Geert Poels for inspiring my interest in this study, for his many tips and accessibility. Secondly, I would like to thank VDMbee for providing the opportunity to conduct this study and allowing me to use their tool. Special thanks go out to my contact at VDMbee, Henk de Man, for his guidance through each stage of the process, from the initial kick-off to the valuable feedback during the final stages. Next, I would also like to thank Shariq Ata for providing the case and giving extra insights about the concerned topics. Finally, I would also like to thank my friends and family for the moral support and additional tips.
III
Table of contents
Permission ... I Foreword ... II List of used abbreviations ... V List of figures ... VI 1 Introduction ... 1 2 Research methodology ... 6 2.1 Data collection ... 6 2.2 Modelling ... 7 3 Case ... 9 3.1 General ... 9 3.2 AS-IS scenario ... 13 3.2.1 Healthcare providers ... 13
3.2.2 Healthcare providers characteristics ... 14
3.2.3 CareQuality ... 14
3.2.4 EHR software providers ... 15
3.2.5 Interoperability ... 15
3.3 TO-BE scenario ... 17
3.3.1 The Consortium ... 17
3.3.2 “Meaningful use law” ... 18
3.3.3 Master Patient Index ... 18
3.3.4 Data sharing rights ... 18
3.3.5 Advantages of blockchain technology in the case study ... 19
3.4 After 3 years ... 20
4 VMP approach ... 22
4.1 Value Delivery Modelling Language ... 22
4.2 Value Management Platform ... 22
4.3 CBMP process ... 24
4.3.1 Discover stage ... 24
4.3.2 Prototype stage ... 31
4.3.3 Adopt stage. ... 35
5 EHR on blockchain in VMP ... 39
5.1 Building the VMP model ... 39
5.1.1 Access to data ... 39
IV
5.1.3 Main value indicators blockchain application ... 53
5.2 What-if scenarios... 55
5.2.1 Scenario 0: base scenario ... 56
5.2.2 Scenario 1: Patients don’t trust the initiative-minimum amount of patients needed ... 56
5.2.3 Scenario 2: Consortium break-even ... 57
5.2.4 Scenario 3: No interest from HC providers-minimum amount of providers needed ... 59
5.2.5 Scenario 4: Blockchain costs passed on to patients. ... 60
5.2.6 Conclusion scenarios ... 62
6 Improvement suggestions Value Management Platform ... 63
6.1 Textual user guides ... 63
6.2 Aggregation formulas ... 63 6.3 Dashboard ... 64 6.3.1 Presentations ... 64 6.3.2 What-if scenarios ... 64 7 Discussion ... 65 7.1 Results ... 65
7.1.1 First research objective: Develop a model to visualise the impact of a non-financial blockchain application in the healthcare setting. ... 65
7.1.2 Second research objective: Provide a high-technological case in the Value Management Platform to show its usability ... 66
7.1.3 Limitations ... 67
8 Conclusion ... 68 References ... VIII Appendix... A Appendix 1: Examples of report functionality ... A Appendix 2: Business Ecosystem maps ... D Appendix 3: Business Model Canvasses TO-BE phase... G Appendix 4: TO-BE Strategy Maps ... J Appendix 5: Polluted Aggregation View ... P Appendix 6: Value proposition form details ... Q Appendix 7: Cost per treatment distribution ... R Appendix 8: Main value indicators Dashboard presentation ...T
V
List of used abbreviations
EHR Electronic Health Records VMP Value Management Platform
FHIR Fast Healthcare Interoperability Resources HL7 Health Level Seven
HC Healthcare
CBMP Continuous Business Modelling Planning VDML Value Delivery Modelling Language MPI Master Patient Index
VI
List of figures
Figure 1: Organisation of Consortium ... 11
Figure 2: EHR on blockchain important terms ... 11
Figure 3: Legal relationships between healthcare providers ... 12
Figure 4: AS-IS Business Ecosystem Map ... 13
Figure 5: Assessment of EPIC services ... 16
Figure 6: TO-BE Business Ecosystem Map ... 17
Figure 7: After 3 years Business Ecosystem Map ... 20
Figure 8: CBMP process ... 23
Figure 9: Phases overview ... 23
Figure 10: Discover stage overview ... 24
Figure 11: Example of Business Ecosystem Map ... 26
Figure 12: Example of Business Model Canvas ... 27
Figure 13: Example of Value Stream Map ... 27
Figure 14: Example of Strategy Map ... 29
Figure 15: Prototype stage overview ... 31
Figure 16: Example of Business Model Cube ... 31
Figure 17: Overview of Business Model Cube sides ... 31
Figure 18: Example of Value Proposition details part 1 ... 32
Figure 19: Example of Value Proposition details part 2 ... 32
Figure 20: Example of Value Proposition details part 3 ... 33
Figure 21: Aggregation Example- Strategy Map ... 33
Figure 22: Example of Aggregation View ... 34
Figure 23: Example of value formula... 35
Figure 24: Example of dashboard presentation ... 36
Figure 25: Example of column presentation ... 36
Figure 26: Example of graph presentation ... 36
Figure 27: Example of What-If scenarios part 1 ... 37
Figure 28: Example of What-If scenarios part 2 ... 37
Figure 29: Example of comparison between base scenario and What-If scenario ... 38
Figure 30: Member care mediation Value Stream Map ... 40
Figure 31: Five features of EHR on blockchain ... 40
Figure 32:EHR characteristics ... 41
Figure 33: EHR availability Aggregation View... 42
Figure 34: EHR availability extended Aggregation View ... 42
Figure 35: Example of multiplier to contain effect... 43
Figure 36: Final values delivered to patient ... 44
Figure 38: Example of intermediate value form ... 45
Figure 37: Primary care quality Aggregation View ... 45
Figure 39: Agreement Coverage in Strategy Map ... 46
Figure 40: Record transaction intensity in Strategy Map ... 47
Figure 41: Record transaction intensity Aggregation View ... 47
Figure 42: Agreement permission Value Stream map ... 48
Figure 43: Transaction intensity presentation in Dashboard ... 49
Figure 44: Cost per treatment distinction Strategy Map ... 51
Figure 45: Cost per treatment Aggregation View ... 51
VII
Figure 47: Impact on treatment costs presentation ... 53
Figure 48: Access to data main value indicators ... 54
Figure 49: What-If scenarios part 1 ... 55
Figure 50: What-If scenarios part 2 ... 55
Figure 51: Ecosystem profit margins scenario 1 ... 56
Figure 52: Minimum amount of patients ... 57
Figure 53: Cost of blockchain service presentation ... 58
Figure 54: Ecosystem profit margins scenario 2 ... 58
Figure 56: Minimum amount of healthcare providers ... 59
Figure 55: Ecosystem profit margins scenario 3 ... 59
Figure 57: Ecosystem profit margins scenario 3 ... 60
Figure 58: Treatment price increase ... 60
Figure 59: Patient satisfaction Aggregation View ... 61
Figure 60: Patient satisfaction presenation ... 61 Figure 61: Problem definition... A Figure 62: Blockchain technology prices in report ... B Figure 63: blockchain technolgy terminologies in report ... C Figure 64: AS-IS Business Ecosystem Map big ... D Figure 65: TO-BE Business Ecosystem Map big ...E Figure 66: After 3 years Business Ecosystem Map big ... F Figure 67: Business Model Canvas Consortium ... G Figure 68: Business Model Canvas Affiliate hospitals ... H Figure 69: Business Model Canvas Third-party HC providers ... I Figure 70: Member hospitals Strategy Map big ... J Figure 71: Affiliate hospitals Strategy Map ... K Figure 72: Consortium Strategy Map ... L Figure 73: Third-party HC providers Strategy Map ... M Figure 74: Consortium Strategy Map values explanation ... N Figure 75: Healthcare Strategy Map value explanation ... O Figure 76: Polluted Aggregation View ... P Figure 77: Value form details Primary care quality ... Q Figure 78: Record transaction intensity detail form ... Q Figure 79: Cost per treatment distribution Affiliate hospitals ... R Figure 80: Cost per treatment distribution Third-party HC providers ... S Figure 81: Main care value indicators Affiliate hospitals ...T Figure 82: Main care value indicators Third-party HC providers ... U
1
1 Introduction
Over the course of time, many different technologies have been explored and developed. One such technology is blockchain. Blockchain is seen as a technology with an important, and potential disruptive, implication for companies and governments in different sectors in the time to come (Webb, 2015). Furthermore, blockchain is a type of distributed ledger, where blockchain consist of blocks of data, distributed ledger is a database spread across different nodes. In distributed ledger each participant can access this database, also called a shared ledger (Ølnes, Ubacht, & Janssen, 2017). Normally when initiating a transaction, a third party is needed to conclude the transaction between the principle parties. In most cases this will pass as a currency transaction, needing a bank, credit card provider or middleman to complete the transaction. This is exactly what the blockchain technology tries to eliminate, by creating a decentralized environment where no third party is needed to complete the transaction (Yli-Huumo, Ko, Choi, Park, & Smolander, 2016).
Over the lifespan of the blockchain technology, different versions have emerged. The very first example of such a blockchain technology is Bitcoin, a peer-to-peer version of electronic cash. Bitcoin is based on a whitepaper published by Satoshi Nakamoto on October 31, 2008. It allows for online payments to be made directly between different parties, without the need of a financial institution (Nakamoto, 2019). This application has amassed a lot of popularity over the past years, which led to many other
applications of blockchain technology. The first applications of blockchain after the Bitcoin example are categorized under Blockchain 1.0. After that, a newer generation of blockchain, named Blockchain 2.0, included smart properties and smart contracts (Swan, 2015). Smart properties elude to the digital properties or assets whose ownership can be controlled by the blockchain-application. Smart contracts, first introduced by Nick Szabo in 1994, are a new way of defining contracts between different parties. In its core, a smart contract is a computer code between the different parties that runs on the blockchain-application and contains a set of rules determined by the parties. If the predetermined rules are met, the smart contract will automatically execute itself. This makes digital relationships more functional than paper-based contracts (Szabo, 1997). After Blockchain 2.0, the current generation of blockchain emerged, Blockchain 3.0. This new generation is mainly focused on the non-financial applications of blockchain (Swan, 2015). It is this newer generation of blockchain technology that will be observed in this study. Not all the implications of blockchain are the same, however, there exist several different blockchain structures one can work with. The most important distinction one should make, is the difference between an open and a closed blockchain. In other words, is the ledger open to all or are only predefined members allowed to read the ledger. A further distinction can be made between a non-permission based blockchain and a non-permission based blockchain. To distinguish nodes who can have
2 more power and additional tasks (Mainelli & Smith, 2015). In this study a closed permission based blockchain application is observed.
Since the success of bitcoin, different sectors are looking for a way to harness the possibilities and advantages of blockchain technology. These sectors are trying to digitalize and enhance their businesses using the benefits of blockchain technology. One such benefit is the possibility to carry out transactions in a distributed setting without the need of a third-party. This transaction happens in a secure and trusted environment, caused by the inherent properties of blockchain. After all, information on a block is immutable and the blockchain is identical for each entity in the network. In order to update or change any information on the blockchain, a new block has to be created, leaving a trail of the changes made. Another direct benefit blockchain technology offers, is the improvement of transaction speed. Without the need of a third-party, transactions can flow directly from the involved entities, removing the delay of the intermediate party (Agbo, Mahmoud & Eklund, 2019).
Especially non-financial applications of blockchain have emerged in different sectors. Some examples include the energy sector using a blockchain-based solution to organize the sharing of energy produced by consumer solar panels (Plaza et al, 2018). Another example comes from the supply chain sector, developing an agri-food supply chain traceability system using blockchain technology (Tian, 2016). A final example exists in the healthcare sector. A potential application in this sector, is the development of a mobile application based on blockchain where patients own, control and can share their personal data (Yue et al 2016). Nevertheless, these are not the only application of blockchain technology in each of these sectors; energy sector (Burger, Kuhlmann, Richard, & Weinmann, 2016; Lavrijssen & Carrilo, 2017), supply chains & logistics (Iansiti &Lakhani, 2017; Tian, 2016) to ultimately the healthcare sector (Hoy, 2017; Agbo, C. C., Mahmoud, Q. H., & Eklund, J. M. ,2019), the possibilities seem endless. The development and implementation, however, of such a blockchain application is very difficult and costly (Catalini & Gans, 2016). Furthermore, the non-financial applications of blockchain technology is relatively new, making it hard to actually prove the added value it brings. There is a lack of real life business cases to actually measure all the benefits it supposedly brings (Agbo, Mahmoud & Eklund, 2019).
To determine if such a non-financial blockchain application really is worthwhile, this study will research one sector that would supposedly greatly benefit from such an application. This sector being the healthcare setting. In the medical sector, blockchain technology would mainly be used to securely share healthcare data. The sharing of this healthcare data would allow for, amongst others, a better user experience, quality of data and healthcare, reduce costs, better prescriptions of medication (Jothi & Husain, 2015). According to Hillestad et al. (2005), the implementation of such a framework could save
3 billions on a yearly basis. The impact of such a blockchain application, however, has not been proven on a real life business case and is solely an expectation based on theoretical expectations. Moreover, the impact of a certain blockchain framework in the healthcare sector is very difficult to measure. This is mainly due to the fact that such a blockchain application would not only impact one aspect of the business but could influence the entire healthcare ecosystem. Additionally, the improvement in quality, user experience and recommendations are difficult to express in monetary values. This makes this study on blockchain technology in the healthcare sector all the more interesting.
Even more, the healthcare sector is a sector that is fairly behind on digital trends and strongly regulated. Additionally, many healthcare providers use different information systems to manage their data flows. Which could, potentially, be solved by an implementation of blockchain technology. After all, blockchain technology would allow for a trusted environment for (patient) information to be shared between different health care providers. Mainly, because every healthcare provider then has the same
information available concerning a shared patient, without the power to alter any information unseen. Blockchain technology, also, allows for a framework where different entities have different rights, all thanks to the smart contracts. All this, helps protect the privacy of a patient. It also allows for a cheaper and faster way of sharing patient information. No longer does an healthcare provider have to call another provider to access certain medical information about a patient. This is now automatically regulated and fetched by the smart contracts. All these benefits help contribute to a more efficient digital healthcare system, that will help healthcare providers and other related parties to increase the accessibility to data in a secure manner.
This patient information is shared in the form of electronic health records (EHR). An electronic health record is the digital storage of medical data. Health information technology such as EHR’s are seen as critical in improving the health care industry. Most of its benefits are seen in the improvement of quality and efficiency in information management. However, the implementation of such a health information system is not without its difficulties (Chaudhry et al, 2006). The availability of digital medical information is susceptible for security breaches. Also, the sharing of such electronic health records leads to
interoperability challenges. Often the involved parties have different information systems that store these EHR’s (Verdonck & Poels, 2020). Hereby, blockchain technology would be a potential candidate to tackle these problems.
In order to assess such a non-financial blockchain business case in the healthcare sector, a use case will be modelled in the Value Management Platform (VMP). The VMP is developed by the Dutch company VDMbee and provides a visual representation tool for the Value Delivery Modelling Language (VDML). This language offers a standardized representation for developing conceptual models used for the
4 analysis and design of value creation and value capture in enterprise operations (Poels et al, 2018). This platform will allow this study to represent what values the different parties interchange with others in a blockchain use case. Furthermore, different monetary prices can be assigned to these values and be aggregated from each other. This would make it easier to visualize the benefits and the costs associated with the healthcare blockchain use case. Furthermore, VMP differentiates itself from other modelling tools with their comprehensive view. Where other modelling tools would only focus on one business unit in the case study (e.g. IT-Unit or care-unit), VMP allows for an entire coherent ecosystem to be modelled (de Man H., Co-founder VDMbee). Additionally, by investigating a use case this study can focus on the aspects important to this research. Hence, use cases reduce the complexity of certain scenarios by specifying what and under what conditions a scenario occurs (Bittner, 2002).
For the actual use case, multiple candidates are possible. In the academic literature, there exist several different studies that examine the use of blockchain in a healthcare setting. Some examples are Medrec developed by Azaria et al (2016), Guardtimes’ HSX initiative, the analysis of an EHR permission
management system by Verdonck and Poels (2020) and more. These examples, however, often limit themselves to pure theoretical studies, making it hard to implement them in VMP as many real-life values are missing. Moreover, the usage of a pure theoretical study would defeat the aim of this study as described hereafter. Only Guardtimes’ HSX initiative has a practical implementation. Unfortunately, no results of such cases were found publicly available. Instead a more suitable case was found through a connection of VDMbee, Shariq Ata, Director Enterprise Architecture at the University of Chicago
Medicine. Together with a major Midwest medical centre and Sirius Computer Solutions Inc., Shariq Ata conducted a proof of concept of a blockchain application in a patient consent management setting. The case adopted in this study is based upon this Healthcare interoperability whitepaper (Kannan & Holmes, 2019), supplemented with additional information and knowledge from Shariq Ata himself. Additional assumptions and limitations have been imposed on the use case, to achieve a scope that is feasible for the purpose of the master thesis project. It is tried nevertheless to do full justice to the use case. Considering this case study in the Value Management Platform, the purpose of this study is twofold. First of all, the main objective, add to existing literature on blockchain in healthcare setting by providing a VMP model of a blockchain proof of concept in the healthcare sector. By visualizing the impact of this technology in a practical business case, the model build in this study can serve as a start for stakeholders in a healthcare sector that can be personalized through VMP’s ease of use. Moreover, such a value delivery model built in VMP can help elevate the business case analysis, as analysts can anticipate to the effects of the blockchain technology on the business, visible in the model, and translate them to
integrated business values. Second purpose is to add a valuable case study in the Value Management Platform with the implementation of a high technologic innovation. Moreover, show the capabilities of
5 the platform due to the complexity of such a blockchain use case. Therefore this study does not only provide a structured value model, visualising the impact of a non-financial blockchain case, but also delivers a high-technological case study to show the potential of the Value Management Platform. Alongside the proof of usability for high-technological cases, this study hopes to offer some suggestions to improve VMP with the experience gathered while modelling the EHR on blockchain case.
6
2 Research methodology
In order to visualise the impact of a non-financial blockchain application, a qualitative research approach was handled. A qualitative research approach was chosen as the focus is on a single blockchain
application described in the chosen whitepaper, the backbone of this study. According to Recker (2013) such a qualitative approach is preferred when you want to study specific phenomena and for
explanatory research on less researched topics. The visualisation of this new phenomenon was then achieved through a VMP case study, as no blockchain use case has been modelled in the tool before. A case study has been chosen as research method for the insights they can offer compared to other approaches (Rowley, 2002). Yin (1994) p. 13 defines a case study as:
“A case study is an empirical inquiry that:
• Investigates a contemporary phenomena within its real life context, especially when • The boundaries between phenomenon and context are not clearly evident.”
The research method in this study meets this definition as a non-financial blockchain application in the healthcare sector has been researched, where the influence of the blockchain technology is not clearly defined, instead influences multiple business units and factors. Yin (1194) also depicts a case study as a useful research method when: “A how or why question is being asked about a contemporary set of events over which the investigator has little or no control.” (p.9) For this study, these two questions translate in:
• How will this patient management blockchain application be implemented in the healthcare ecosystem?
• Why is such a non-financial blockchain application interesting for the healthcare sector? What advantages does it bring?
2.1 Data collection
Data for the VMP model is based upon a blockchain use case. For this use case, a whitepaper describing the proof of concept of patient data management with blockchain in the healthcare sector was chosen. This specific use case in the healthcare sector was chosen, as there are not many other options of this calibre publicly available, as well as a direct contact associated with the whitepaper would prove to be very valuable. This whitepaper alone, however, lacked some critical information, to make a full integration in VMP possible.
Therefore, additional information in this study was drawn from four main sources: websites of included entities, input from Shariq Ata, input from Henk de Man and own assumptions. Here, the whitepaper
7 provided the general idea of the blockchain application and basis of the ecosystem. This basis is then supplemented with additional insights of Shariq Ata, as well as background information, missing in the whitepaper. Whereas online sources were primarily used to estimate missing values and parameters. Whenever any of the other data sources could not provide an answers, assumptions and estimation were made. Nonetheless, all the data taken into account had to make sense in the grand scheme of things before it was implemented in the tool. Moreover, in order to put these values into perspective, arithmetical data has been taken into account. Here the focus was primarily on values that have equal proportions, information that would throw the model out of balance has been left out.
Considering this is a case study based upon a use case, the model focuses only on the aspects relevant for the blockchain application rather than taking the whole healthcare operation into account.
According to Yin (2009), a case study is preferred when dealing with such new phenomena in a specific context.
2.2 Modelling
The design of this study consisted of four steps. (1) Before the case could be modelled in VMP, a basic knowledge of blockchain and VMP was required. Background information of blockchain was obtained through online sources and academic literature, as seen in the introduction. Whereas, the learning process of VMP was done via explanatory videos, provided by VDMbee itself. This allowed for a proper base to understand the case and imagine a potential implementation in VMP. (2) After this basic knowledge was acquired, the actual modelling in VMP could begin. For this modelling the Continuous Business Model Planning (CBMP) process was used. This process allows the users to build a fully comprehensive and interactive model in the VMP. In order to obtain such a comprehensive and interactive model three stages have to be completed (i.e. Discovery stage, Prototype stage and Adopt stage) each comprising of different steps. Not all these steps, however, have to completed, as well as the order is of less importance, more information on this process can be found in the ‘VMP approach’ section. (3) Off course, the implementation of such a complicated case is very challenging for a first time user. To facilitate this implementation, Henk de Man, a co-founder provided his expertise throughout the whole process. Roughly estimated, every other two weeks a meeting was planned to show the progress made. Here Henk de Man would give feedback and tips for the use of the program and his own vision regarding the representation of the blockchain case. Also, three different meetings with Shariq Ata were initiated to review the model thus far, give additional information and adjust where necessary. All interactions with the contacts were done via online meeting tools as it was difficult to meet
physically due to geographical limitations. Therefore the third step of this study comprised of the processing of feedback. (4) After completing the VMP model, the results could be reviewed via the dashboards. Interactive interfaces that allow the users to compile all the necessary information in one
8 place. Moreover, the assessment of the blockchain application could be strengthened with the
implementation of What-if scenarios. These What-if scenarios alter certain input values to evaluate the model in the event of specific situations.
As this is a single-case study, it is hard to generalize these findings to other non-financial blockchain applications. Nonetheless, this study retains a certain validity and reliability by giving the study’s interpretation of the case and explaining the thought process behind the essential parts of the model in detail. This study could thus be seen as a guideline for future similar studies on other cases.
9
3 Case
This section gives more background information of the story told in the whitepaper, supplemented with the own interpretation of this story to implement in the VMP. Moreover, the assumptions made, with regards to the ecosystems, are explained: in the current situation, the situation where the blockchain application is introduced and a follow-up situation three years after the initial introduction of the blockchain application.
3.1 General
The need for a healthcare interoperability system originally sprouted from a growing trend in the US, where bigger academic hospitals are acquiring community hospitals, small medical groups and solo practitioners in a geographic region. According to Shariq Ata, because of this trend, the need to share medical records in a secure setting has increased substantially. To this day, however, most healthcare providers operate independently, making access to medical records across providers rather restricted. There are several interoperability challenges related to the sharing of data between different
information systems storing digital medical records. Not all systems offer an option to share with other systems. The request to exchange these medical records is also very time consuming. Even more, existing initiatives require a new intermediate party and added formalities. Therefore, there is a need for a secure medical record sharing framework that consistently gives the appropriate access to the right participant. While the healthcare providers or participants may manage the patients records, the patients retain full control of their own data. Evidentially, such a secure framework has to be financially viable, especially compared to existing alternatives.
The retention of data primarily entails which providers can exchange the records, how much they can exchange and for how long they have the rights to exchange the medical records. Ideally, patients are able to control their medical records in a remote setting, like a mobile application for example. Such a framework can be realized with the inherent characteristics of blockchain technology and the properties of its smart contracts. It is, however, important to note that the use of blockchain technology in this interoperability challenge is only possible thanks to some laws, instituted by the US government, regarding digital medical records.
As a part of the Recovery Act in 2009, the United States Department of Health and Human Services launched the HITECH Act (Health Information Technology for Economic and Clinical Health Act). It was created to promote and create a nationwide network of EHRs (electronic health records). This means that every healthcare provider was persuaded to make use of certified EHR technology. (Anderson, 2010). Additionally, the Medicare and Medicaid promoting interoperability programs, formerly known as the “meaningful use law”, set a list of core requirements in order to have a certified EHR. For this use case, the requirement to freely share electronic records is extremely important. Without this
10 requirement, EHR software providers could limit the sharing of records with other EHR software
providers. ( U.S. Centres for Medicare & Medicaid Services, n.d.). Furthermore, there exists an international standard, named HL71 (Health Level Seven), that sets the standards of sharing clinical or administrative data, with FHIR (Fast Healthcare Interoperability Resources) as the latest adaptation. (HL7, n.d.). This means that most records will have the same structure, making it easier to share them across EHR software systems.
In order to fully assess the impact of blockchain technology in a healthcare setting, three phases where modelled in VMP:
1. The AS-IS scenario, which shows how EHRs currently are being shared.
2. The TO-BE scenario, which gives an introduction in the EHR on blockchain application. 3. The third phase takes a look at the situation three years after the implementation of the
blockchain technology. A more detailed description and usage of the phases functionality in VMP can be found in the section dedicated to VMP.
As said earlier, different healthcare providers or participants have their own rights for accessing and sharing a patient’s medical records. Thanks to the smart contracts, the appropriated rights will be executed in a consistent and automated manner. Based upon these rights, three groups of healthcare providers can be identified: Member hospitals, Affiliate (participating) hospitals and Third- party providers. Off course, it is assumed that the patient still owns its own record data and can influence these rights. Figure 1 and Figure 2 from the whitepaper give an initial explanation of each healthcare provider and their rights. Throughout this case explanation, all aspects of these figures will be handled in detail, linked to their implication for the VMP model.
11
Figure 1: Organisation of Consortium
Figure 2: EHR on blockchain important terms
It is important to note that the Academic hospital, involved in the writing of the white paper, belongs to the Member hospitals and the other types are based upon legal relationships with this Academic hospital. Essentially the data-sharing rights enforced by the smart contracts are based upon the legal
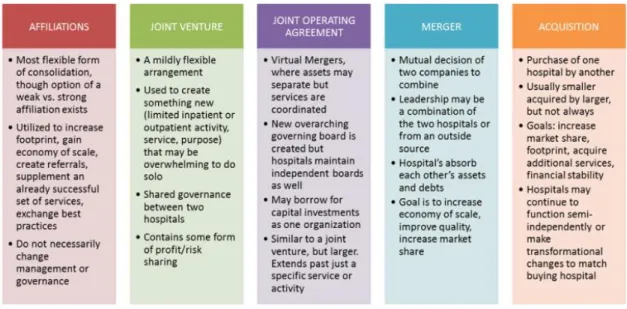
12 relationship between two healthcare providers. The following figure defines the possible relationships a healthcare provider can have with the Academic hospital.
Only the affiliations relationship will form a new type of healthcare provider. The other relationships will all be placed within the Member hospitals (i.e. Joint venture, Joint operating Agreement, Merger
(Community hospital) , Acquisition), together with the Academic hospital. The reasoning behind this divisions comes from the fact that the Academic hospital wants to fully share all the data across these other healthcare providers. Obviously the Third-party providers are missing from this figure of
relationships, as they have no legal relationship with the Academic hospital. Together with the Affiliate hospitals, the Member hospitals will form a consortium, an alliance to realize this blockchain
implication. This consortium is then responsible for everything regarding the blockchain technology. More information regarding these three types of healthcare providers and the Consortium will be given in the TO-BE scenario.
Defining these three types of healthcare providers is only relevant for the blockchain scenarios. Nonetheless, the same division will be made in the AS-IS scenario to facilitate a comparison with the other scenarios.
The three phases will be further explained in the following paragraphs. Each scenario will be supported by a figure of the Business Ecosystem Map from the app. Such a Business Ecosystem Map allows users to visualize and identify the business network with the participating actors, based upon Allee’s Value Network concept (Allee, 2008), who’s concept has been subsumed by the VDML standard and implemented by VMP. This will improve the readers ability to comprehend the different scenarios. A
13 bigger picture of these Business Ecosystem Maps can also be found in Appendix 3, this ensures better readability of the ecosystems.
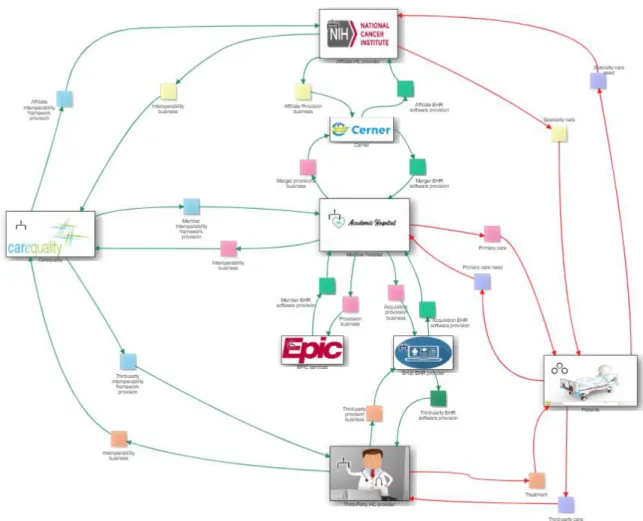
3.2 AS-IS scenario
Figure 4: AS-IS Business Ecosystem Map
As can be seen in Figure 4, there are four key-participants in the AS-IS scenario (i.e. Affiliate hospitals, Member hospitals, Third-party providers and CareQuality) complemented by the patients, customers of the healthcare providers.
3.2.1 Healthcare providers
The initial reasoning behind the healthcare provider classification (i.e. Affiliate hospitals, Member hospitals and Third-party providers) can be found in the introduction to the use case. A more detailed description will be given in the TO-BE scenario, since the classification is not relevant for the AS-IS scenario and is only present for comparison purposes between the scenarios. Nonetheless, it is possible
14 to sketch some assumed characteristics of these three healthcare providers to increase
comprehensibility of the providers across the scenarios.
3.2.2 Healthcare providers characteristics
For the first healthcare provider, the Affiliate hospitals, more specialised providers are assumed. They deliver speciality care to their patients, like cancer treatments for example. Therefore the logo of a national cancer institute is used to symbolize the Affiliate hospitals. The second type of healthcare providers is the Member hospitals, the only key-participant comprising of other kinds of healthcare providers, consisting of the Academic hospital, Joint ventures, Joint operating Agreements, Mergers and Acquisitions. Due to their close relationship with the Academic hospital and rights in the TO-BE scenario, all of them are bundled under the member hospital branch. For the sake of simplicity, these other providers are simply named after the legal relation they have with the beating heart of the Member hospitals, the Academic hospital. Therefore, the Academic hospital is the most important member of the Member hospitals, making it the logo of the Member hospitals. As a result of their importance, the Member hospitals are also assumed to account for the biggest costs and revenues compared to the other types of healthcare providers. The last type of healthcare provider, Third-party providers, is assumed to be a group of smaller healthcare practitioners (e.g. private clinics, smaller clinics,
physiotherapists, individual doctors). In practice this could as well be another larger, potential academic hospital, healthcare provider. For the case study five Affiliate hospitals, fourteen Member hospitals and twenty-five Third-party providers are assumed in the AS-IS and TO-BE scenario. This distribution was approved by Shariq Ata.
3.2.3 CareQuality
The fourth key-participant in the AS-IS scenario is CareQuality2. CareQuality launched an initiative that hopes to improve interoperability between systems in the US, by establishing a nation-wide framework that enables exchange of data between health data sharing networks. In order to accomplish this, CareQuality sets technical and policy agreements amongst the different networks through a consensus-based process with the help of representatives. The following analogy used by CareQuality helps to put this into perspective. “What if you had a cell phone plan that only allowed you to call other customers of your carrier”. This is the very problem healthcare providers face in the AS-IS scenario. Therefore,
CareQuality hopes to lift this limitation with their interoperability framework. Unfortunately, this
initiative requires the cooperation of every player in the EHR distribution, from the software provision to the usage by healthcare providers, while also needing additional regulations. As explained earlier, there are already a couple of standards and regulations providers that have to abide to. Additionally,
CareQuality is now an outside party involved in the exchange of medical records between healthcare
15 providers, potentially raising security questions. Patients would lose all their confidence in a healthcare provider when private medical data would be sold or leaked to any other party.
3.2.4 EHR software providers
Besides the four key-participants and the healthcare’s patients, the Business Ecosystem Map in Figure 4, comprises of three other entities. These are the EHR software providers: EPIC3, Cerner 4 and all other smaller companies that deliver EHR software. As stated by the HITECH Act the majority of healthcare providers, in the United States of America, is persuaded to make use of EHRs. In order to do so, the healthcare sector needs the appropriate software. Therefore, it is assumed that the healthcare providers in this case contract the biggest players in the EHR software scene, with EPIC controlling the majority of the market. Unfortunately, these services are far from cheap, leading to almost 25% of the total IT-costs (Ata, Director, enterprise architect UCM). Hereby smaller healthcare providers are not able to afford the services of these larger EHR software providers. Therefore, it is assumed that the group of Third-party providers will turn to lesser known EHR software providers, with potentially less
sophisticated services. Additionally, the small acquired clinics acquired by the Academic hospital will have ongoing contracts with different smaller EHR software providers. Whereas, the Academic hospital itself will use EPIC. In due time, the Academic hospital will convert them to EPIC, once the ongoing contracts are finished. As of now, however, this difference in EHR software provider can lead to certain interoperability challenges.
3.2.5 Interoperability
To further display the interoperability problem, it is assumed that the Affiliate hospitals and the community hospital of the Member hospitals use Cerner instead of EPIC. But in reality, this is not necessarily the case. The main reason for these assumptions, stems from the extra services EPIC offers its users to share EHRs between different healthcare providers, which solve part of the interoperability problem. Most notable are EpicCare Link and EpicCare Everywhere. EpicCare Link is a web-based
application that gives users secure access to select patient records in Epic via a weblink. Unfortunately it only allows the user to read the select information, not to copy or to store the data. Whereas EpicCare Everywhere is EPIC’s interoperability application, allowing for a full exchange of patient data with other healthcare providers. As EpicCare Everywhere supports CareQuality’s interoperability framework and follows the HL7 standards, EHRs can also be exchanged with other EHR software than EPIC itself. These services, however, are very time intensive as the EHRs have to be requested manually and are only
3https://www.epic.com/software#Clinicals 4https://www.cerner.com/
16 available for a limited time. The following figure, obtained by Shariq Ata evaluates the usage
recommendation of these EPIC services for the different types of healthcare providers.
Based upon Figure 5 it would thus be viable to use EpicCare Everywhere to exchange EHRs between healthcare providers. Nonetheless, as every currently available alternative, exchanging EHRs via an EPIC infrastructure is very expensive, time consuming, only for a limited time and requires an intermediate party to work at its full potential. In this study, CareQuality would then be the intermediate party.
17
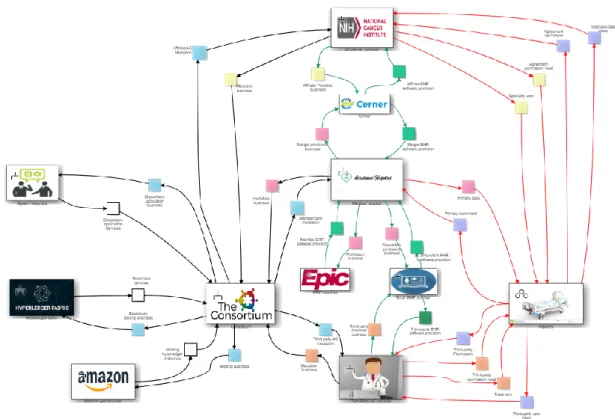
3.3 TO-BE scenario
3.3.1 The Consortium
The purpose of the TO-BE scenario is to visualise the use of blockchain technology to exchange EHRs between healthcare providers. The most notable difference between the As-IS (Figure 4) and TO-BE Business Ecosystem Map (Figure 6) is the disappearance of CareQuality and the appearance of the Consortium, which is linked to three other entities (i.e. System integrator, Hyperledger fabric and Amazon web services). For this study, the consortium is created by the Member and Affiliate hospitals, ideally on a city or state level. In reality this consortium is not a separate entity, however, for
clarification purposes it is visualized separately in the Business Ecosystem Map. Furthermore, it is assumed that this consortium entity will develop the EHR on blockchain application, with the help of the System integrator. The System integrator in this case study is also the co-author of the use case, Sirius. The composition of this consortium is specific for this study, other initiatives could use a governmental institution or private organisation that provides the non-financial blockchain application (like the
examples of Verdonck & Poels (2020) and Guardtimes’ HSX initiative). Besides the System integrator, the Consortium has two other suppliers. First of all, the Consortium partners with Hyperledger5.
5https://www.hyperledger.org/use/fabric
18 Hyperledger will supply the distributed ledger technology, known as Hyperledger Fabric. This allows the Consortium to build the blockchain application. The second partner is Amazon6. Through their web services the Consortium is able to build the application on a cloud solution rather than develop it on inhouse storage systems. With the help of this consortium, healthcare providers will then be able to exchange EHRs via the blockchain application, making CareQuality and EpicCare Everywhere
unnecessary. Therefore the role of the Consortium is to develop and maintain the EHR on blockchain application, providing it to the involved healthcare providers. This also includes offering training and customer support regarding the usability of the software.
3.3.2 “Meaningful use law”
Thanks to the meaningful use law it is possible to exchange patients’ records over such a blockchain application. As said earlier this law dictates that EHRs have to meet certain restrictions. Most
importantly, EHRs have to be freely exchangeable, meaning that EHR software companies cannot limit the EHRs to only work on their software. Furthermore, with the HL7 standard, most EHRs will have a standard format. This ensures that EHRs from different EHR software providers are interchangeable.
3.3.3 Master Patient Index
It is important to note that the healthcare providers keep their existing EHR software from the AS-IS scenario. The EHR on blockchain application will not replace their EPIC or Cerner software. In its essence, no patient data is stored on the blockchain. All the records remain in the inhouse storage systems. Instead a Master Patient Index is created for every patient, on the blockchain application, that links the correct record to the patient. This index contains the meta data and link to where the needed data are stored. Therefore, no EHRs are stored in blocks on the blockchain, only metadata. This also means that patient data are only stored once, reducing data redundancy. A visual representation of this Master Patient Index van be found in Figure 1.
3.3.4 Data sharing rights
Not all three healthcare providers (i.e. Affiliate hospitals, Member hospitals, Third-party providers) are allowed to exchange all data equally. Earlier it was already said that this classification is based upon the legal relationship with the Academic hospital. There is a second reason tied into this split of healthcare providers, regarding their rights for exchanging data. Namely, not every group is allowed to exchange all records equally. These rights are based upon the contract the healthcare provider will have with the Consortium. As so, all the entities in the Member hospitals have an exclusive contract to share all EHRs across healthcare providers. The Affiliate hospitals, on the other hand, have a certain agreement to only exchange a set of patient data (e.g. allergies, prescribed medicines, past treatments, etc). What the
19 content of this data will be, depends on the specific legal contract. Of course, in this case study it is impossible to work with types of data, instead percentages are used. As so it is assumed that the Affiliate hospitals in this study are able to exchange 60% of patient’s data with their contract, whereas Member hospitals can exchange 100%. Lastly, the Third-party providers, are not a part of the
Consortium and therefore have no specific contract. They will only be able to access the Master Patient Index on an on-demand basis. Patients will have to grant consent to these Third-party providers, preferably via a mobile application, as they are the owner of their own data. Through this mobile application, patients will be able to see who has accessed their records, what they have added or updated and who has requested access. In a similar fashion, Affiliate hospitals can request consent to exchange data not included in their contracts. This request to the patient can be found in the Business Ecosystem Maps ( Figure 6). It also important to note that the Member hospitals miss said ‘request’ relation with the patient, as they do not need it. As to be expected, these contracts have to be
respected in a secure and consistent manner. This is done via the smart contracts, an invaluable feature of blockchain technology. These smart contracts will automatically assign consent, if and only if the correct clauses are fulfilled. As no EHRs have to be asked manually anymore, waiting times are drastically reduced.
3.3.5 Advantages of blockchain technology in the case study
It is clear that the blockchain technology offers several advantages in the TO-BE scenario compared to the AS-IS scenario. Three main advantages can be identified; trust, contract governance and shared control.
Trust refers to the inherent characteristics of blockchain technology that allows a secure environment, together with providing the participants with up-to-date information. If healthcare providers have the most recent information available, the chance of errors due to incorrect or outdated information decreases. The second advantage, contract governance, refers to the consistency thanks to the smart contracts automatically applying the correct legal contracts. Lastly, with the help of blockchain technology, data can be safely shared with other parties by solving the shared control responsibility in terms of data the healthcare providers can access, can own and can share. Ultimately, it is assumed that these advantages translate in a higher access of data compared to the cost to achieve this increase, thus reducing costs in the long run and improving care services. Mainly due to immediate availability of records and a higher transparency towards the patients and other healthcare providers.
20
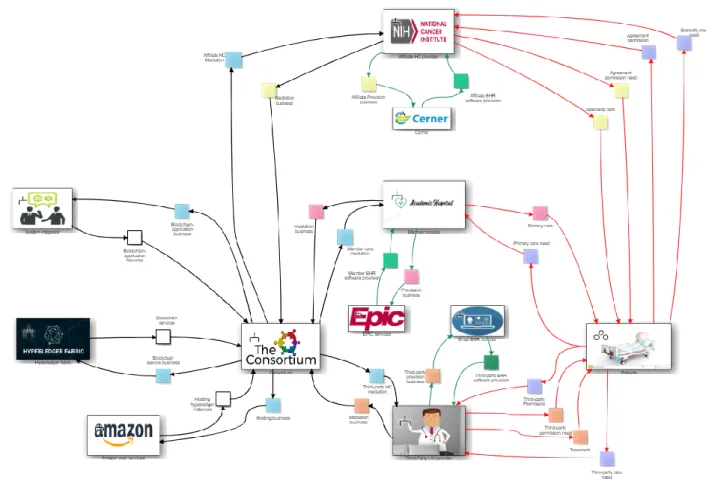
3.4 After 3 years
Figure 7: After 3 years Business Ecosystem Map
The purpose of this phase is to take a look at the EHR on blockchain application, three years after the introductory phase. Several assumptions are made with regards of the evolution of the application, as it is impossible to fully predict the future.
First of all, it is assumed that the effectiveness of the blockchain implementation improves over the years. Healthcare providers will rack up more experience over time by using the application. Furthermore, as a patient’s EHRs across healthcare providers are more freely and easier accessible, Master Patient Indices will be more complete and detailed. This can further reduce treatment errors due to outdated or missing patient information. The second assumptions concerns itself with the amount of healthcare providers willing to join the Consortium. Thanks to the added benefits of the blockchain technology, this method will start to gain popularity and more providers will want to join the initiative. This will increase the Consortium in member size, but also convince previous Third-party providers to join either the Member hospitals or the Affiliate hospitals. Therefore the member size of ten Affiliate hospitals, twenty-three Member hospitals and forty Third-party providers is assumed in this
21 scenario. And finally, once patients see the benefits of the implementation, more patients will allow the sharing of their EHRs through the blockchain application.
Another difference with the TO-BE scenario lies with the choice of EHR software provider, as can be seen in Figure 7. Once the previous contracts are terminated, the Academic hospital will transfer their merged and acquired companies to the same EHR software provider, being EPIC. By doing this, the case study assumes that the entire group will receive a group discount form EPIC, resulting in lower EHR software costs.
22
4 VMP approach
Here, more information of the tool itself will be given, complete with a detailed explanation of the Continuous Business Modelling Planning process. To further illustrate this process, all the used stages and steps will be backed with a figure of the model made in this study.
4.1 Value Delivery Modelling Language
The global market is characterized by an ever changing environment. New technologies, enhancements and ideas pop-up every day. This forces entrepreneurs to react to their changing market segment with innovative ideas, business changes and strategic ideas. This can be very challenging, however, and it increases the complexity of businesses. With the impact of these strategic decisions and the changes transcending the boundaries of one company, the complexity increases even more (Cummins, 2016). In order to help entrepreneurs face this complexity, the Object Management Group (OMG) adopted the Value Delivery Modelling Language (VDML) as a standard business modelling specification (OMG, 2015). VDML enables modelling of value creation and exchange on a strategic level (Metzger, Terzidis & Kraemer, 2015). Furthermore, VDML supports several existing value and business modelling approaches (e.g. Business Model Canvas (Osterwalder & Pigneur, 2010), Value Networks (Christensen &
Rosenbloom, 1995)). Hereby, VDML tries to fill the gap between strategy and business processes on an operational level (Metzger et al, 2015). Business and value modelling both serve a purpose to fill this gap and form a cohesive overview. Starting with value modelling, where the goal is to identify the
appropriate stakeholders in a network, by defining the creation and exchange of values in a given business network (Souza et al, 2018). It is important to note that VDML considers these exchanged values to be measurable (OMG, 2015). On the other hand, the business modelling approach is more used to describe the underlying logic of the separate entities for creating, delivering and capturing this value, in line with the Business Model Ontology (Osterwalder, Pigneur & Tucci, 2005).
4.2 Value Management Platform
With the Value Management Platform (VMP), the Dutch company VDMbee7 enables in practice
application of the VDML. By using VMP, business leaders have the possibility to evaluate future strategic decisions with the help of canvasses, maps and storytelling. Through the visual interfaces of the
software tool, users will create a VDML model without any need of the language ‘s specifications. This increases the ease of use and removes the need for a technology-oriented profile. (Poels et al, 2018). With the help of VMP, business leaders can then visualize a response to their everchanging market segments, potentially planning one step ahead.
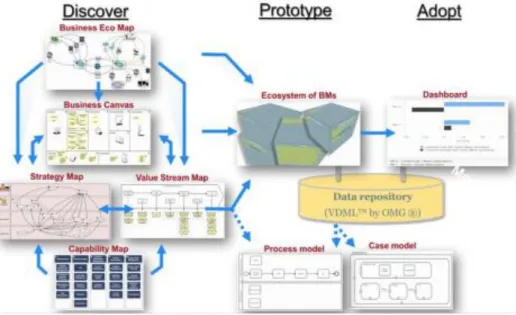
23 In order to evaluate a strategic implementation and assess the impact on future business structures and value objectives, VMP makes use of their CBMP approach. The CBMP process provides a high-level structured roadmap for cohesive business models, that can be compared and further developed on a strategic level. This modelling process is realised through three stages: Discover, Prototype and Adopt.
Figure 8 gives an overview of the three stages, combined with the appropriate techniques used in the platform. (Poels et al, 2019)
Additionally, users can spread the evolution of a strategic decision across different phases, allowing for a comparison between an As-Is phase and To-be phase, with a potential follow-up phase, as can be seen in Figure 9. Furthermore, a certain phase can be divided into different alternatives, to allow a
visualization of different strategies in a certain phase. In practice, only one phase will be built from scratch. Other phases or potential alternatives will be based upon a copy of the original phase, modified with the necessary changes. This allows for a linkage and an aggregation of values across the phases. This also helps the platform compare similar values in different phases.
Figure 9: Phases overview Figure 8: CBMP process
24
4.3 CBMP process
The different stages (i.e. Discover, Prototype and Adopt) and their different steps, visible in Figure 8, will be explained with the help of the EHR on blockchain case study. In the case of such a new technological implementation, VDMbee advises users to start from the To-Be phase. This is mainly because this scenario is the reason for modelling this case in VMP. Therefore, the starting point of this exposition is the situation where patients EHRs will be shared over a blockchain application (labelled as Introduction in Figure 9), rather than any of the other 2 phases. In this study no alternatives will be addressed as there were none modelled or necessary for any of the phases.
4.3.1 Discover stage
The discover stage visualizes the exploration and understanding of the As-Is and To-Be business models (Poels, Roelens, de Man & van Donge, 2018). According to Poels, Roelens, de Man & van Donge (2019) this stage can be divided in 5 steps: (a) context determination; (b) business ecosystem and business model description; (c) value stream mapping; (d) value creation design; and (e) call to action, with an overview in Figure 10. It is important to note that the steps are not mandatory or fixed in this specific order. This order, however, is to be recommended. VDMbee (de Man, 2017) also advises users to involve the appropriate stakeholders while visualizing the strategic initiative. Throughout this stage, VMP makes use of certain well known views (e.g. Business Ecosystem map, Business Model canvas, Value Stream Map and Strategy Map). These popular views can help new users to start with VDML, as they may already be familiar with these established concepts. It is also important to note that all these different views form one integrated VDML metamodel, as explained by Poels, Roelens, de Man & van Donge (2018).
Figure 10: Discover stage overview
a. Context
The first step, context determination, dictates the users to extensively describe the strategic initiative, including the problems, goals, opportunities, relevant parties, assumptions, constraints and other relevant details (Poels et al, 2019). Basically, the context determinations forms the very basis for the following steps and stages. In this case study the report was used, a Word-like functionality. This can be as detailed as the modeller wants. The more detailed this report, however, the smoother the next steps will be. In this study, the report is filled with information about the case’s ecosystem, reasons for the initiative, what is blockchain, monetary values, etc. Examples of this study’s report can be found in Appendix 1. Users can also use the SWOT analysis and Capability Map/ Library functionality during this
25 step, two additional techniques who can help describe the context of the strategic initiative. The SWOT analysis can be implemented via a SWOT Analysis Canvas, where the strengths (S), weaknesses (W), opportunities (O) and threats (T) can be described in a two-by-two matrix. In the Capability Map, on the other hand, a hierarchy of capabilities is visualised. These capabilities are defined in the Capability Libraries and are specific for the organization or a certain sector. (Poels et al, 2019). Both of these functionalities were not used in this study, as too much initial information had to be noted to
understand the case. The report functionality was therefore a better suited candidate. Moreover, often own designations were used, rather than based on industry-specific reference models, eliminating the advantage of a Capability library.
b. Ecosystem & Business Model i. Ecosystem
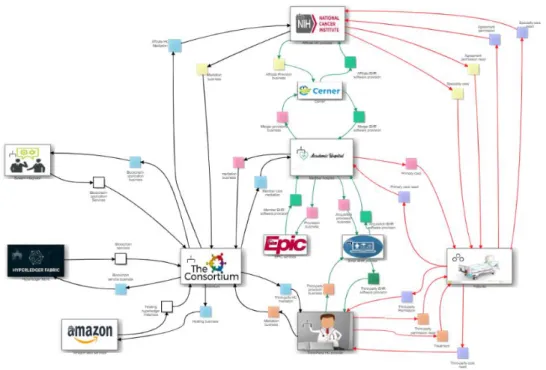
The second step, business ecosystem and business model description, allows users to visualize and identify the business network with the participating actors. VMP bases its Business Ecosystem Map on Allee’s Value Network concept (Allee, 2008). Where an external view of the important actors is made, together with all the corresponding values they exchange. Verna Allee's Value Network was subsumed by VDML, and became the basis of the Collaboration Diagram in VDML. This Diagram can be divided in two levels of abstraction, one level of exchanging business items, and another level of exchanging complete services/ packages, modelled as exchanges of value propositions (in VDML these are called "Value Proposition Exchange", typically conducted in Business Networks). VMP only implemented the level of exchanging complete services/ packages, as this is the level where most business model analyses/ planning concerns are located. (Henk de Man).
26
Figure 11: Example of Business Ecosystem Map
As explained before four key participants can be identified in this study: Affiliate hospitals, Academic hospitals, Third-party hospitals and the Consortium. The other actors represent essential suppliers (i.e. System integrator, Hyperledger fabric, Amazon, Cerner, EPIC and a small EHR provider) and the key participants’ sole customer, the patients. This all is visible in the Business Ecosystem Map (Figure 11). VMP also allows for the use of different colours in the Business Ecosystem Map, this helps distinguish value propositions ( the values exchanged between the actors). One can see in Figure 11 that the most important participants have their own colour for their respective value propositions (The Consortium has light blue value propositions, The Member hospitals’ value propositions are identified by their pink colour, and so on). Furthermore, users can give the connections between actors different colours. In this case study the colour code is used to visualize the different networks present: black for the blockchain network, green for the EHR network and red for the care network.
ii. Business Model
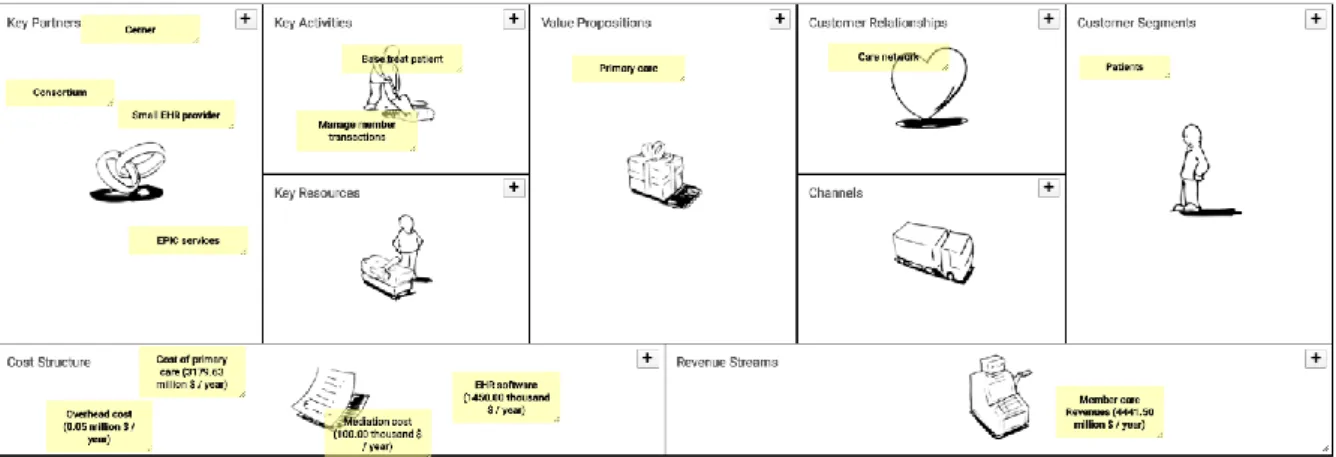
The description of the key participants’ business model can be achieved with the help of several business canvases. One such business canvas is the Business Model Canvas, based on Osterwalder’s Business Model Ontology (Osterwalder, 2004). This Business Model Canvas itself is not a normative model in VDML, but VDML does give an informative mapping from Business Model Canvas to VDML. It is this informative mapping that is implemented in VMP. VMP also supports other business canvases (e.g. Integrated reporting canvas, personal business model canvas, SWOT analysis canvas, etc.). In the EHR on
27 blockchain case, the Business Model canvas was used, as this is the most popular. The following figure shows such a Business Model Canvas for the Academic hospitals.
Figure 12: Example of Business Model Canvas
This business model canvas of the Academic hospitals (Figure 12) provides a perfect summary of how and what they need to do business. In total four Business Model Canvasses were made in the TO-BE phase for each key participant (i.e. Consortium, Affiliate hospitals, Academic hospitals, Third-party healthcare providers). These other Business Model Canvasses of the TO-BE phase can be found in Appendix 3.
c. Value stream
In the Business Ecosystem Map, several value propositions are defined between actors. Most of these propositions rely on activities. In addition, activities can also be supported by competences. This is visualized in the third step, Value stream mapping. (Poels et al, 2019). Originally, the Value Stream Map is not a normative notation in VDML, but due to its popularity among Business Architects, and its compatibility with VDML, it was decided to implement this view in VMP.
28 An example of a Value Stream Map (Figure 13) can be shown with a value proposition exchanged
between the Consortium and the Academic hospitals, Member care mediation, as seen in the Business Ecosystem Map (Figure 6). This value proposition is the embodiment of the provision of an EHR on blockchain application by the consortium to the Academic hospitals. Essentially giving the Academic hospitals the ability and rights to use the application developed by the consortium.
As shown in Figure 13, the Member care mediation value proposition consists of two activities, Mediate and Provide framework. Provide framework consists of the provision and rights to the EHR on
blockchain application, including all the additional advantages that come with this framework. Whereas, the Mediate activity is more concerned with the interactions between the Consortium and the Academic hospitals. Primarily regarding troubleshooting and training regarding the use of the application. As said earlier, activities can be supported by competencies, portrayed by the rectangle connected to the activities. These competencies allow the business to perform the associated activity. This specific value stream, has two competencies, one for each activity, which is also the reason for choosing this specific Value Stream Map. It is thanks to the customer service representative that the Consortium and
Academic hospitals are able to communicate. Also, the EHR on blockchain application is needed before it can be offered to the healthcare providers. Without these competencies the Consortium can’t deliver the respective activities. In the TO-BE phase, 18 different Value Stream Maps were modelled in total.
d. Value creation
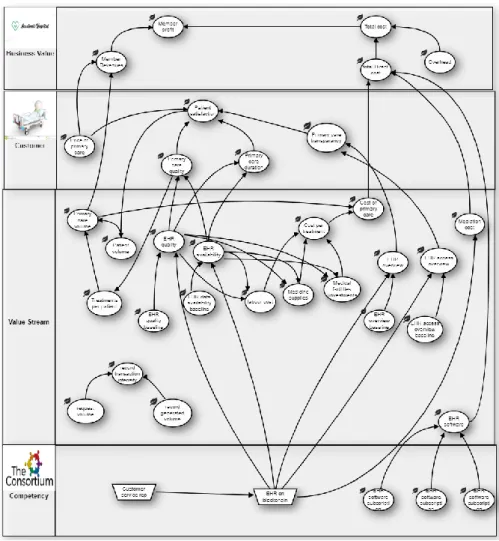
The fourth step, value creation design, visualizes the value objectives and the main cause-and-effect influences for these values related to the strategy (de Man, 2017). Here, VMP uses Strategy Maps, based on Kaplan and Norton’s Strategy Map concept (Kaplan & Norton, 2004). Again, Strategy Maps are not a normative view in VDML, but thanks to its popularity in business management and compatibility with VDML, it was decided to implement this view in VMP.
An example of the Academic hospitals’ Strategy Map can be found in Figure 14. A bigger figure, along with the Strategy Maps of the other key participants and written explanation of the values can be found in Appendix 4. Four different rows can be distinguished in such a Strategy Map (Figure 14): Business Value, Customer, Value Stream and Competency. These Strategy Maps allow users to develop a bottom-to-top view of the business. Starting with the Competency row, here the values or competencies necessary for the creation of the businesses values are shown. These are often provided by partners. Like in this case, the Academic hospitals need the EHR on blockchain application and EHR software before they can create their own values. The second row, Value Stream, tells something more about the internal processes with the respective values that are created and/or needed. For example, all the relevant values influencing the cost per treatment are visualised (i.e. labour cost, medicine supplies and medical facilities), which on its turn determines the cost of primary care. The next row, Customer, shows
29 all the values the business offers to its customers, in this case the patients. Here, all the values that influence the patient satisfaction can be seen, and how those values are influenced by other rows. At the top, on can see the Business Value. This is the end of our bottom-to-top visualisation and shows the values the business would like to capture as a consequence of the strategy. In this case study, the focus is mainly on the impact of costs and benefits due to the implementation of blockchain in EHR sharing, on the Business Value level.
30
e. Call to action
Call to action is the last step of the discover stage. In order to inform the appropriate stakeholders, users can make use of the Lean Change Canvas and a customizable dashboard. Both techniques can be used to summarize the results of the discover stage. Based upon these results, stakeholders can make an informed decision of the idea. (Poels et al, 2019). This step was not utilized in this blockchain case study, therefore no examples can be given.
31
4.3.2 Prototype stage
The overall goal of this stage is to transform the relevant information from the discover stage into a multi-perspective ecosystem of structured business models, as explained in Poels et al (2019). In the following figure an overview is given of the four business models present in the EHR on blockchain case.
These business models match the four key participants: Affiliate hospitals, Consortium, Academic hospitals and Third-party hospitals respectively, named after their primary value proposition.
VMP makes use of Lindgren’s Business Model Cube (Lindgren & Rasmussen, 2013). The Business Model Cube, consists of six faces (Figure 16): Value Propositions (including My Propositions), Customers, Partners, Activities, Competencies and Values. This allows for a representation of business models living in an ecosystem of interacting business models. Again, an example business model can be given of the Academic hospitals (Member care).Combined with a figure regarding the different sides, as not all sides of the cube can be shown due to space preservation.
Figure 17: Overview of Business Model Cube sides Figure 15: Prototype stage overview
32 With the help of a mapping wizard, users can fill in the Model Business cube with information from the Discover stage. While also linking it to the appropriate information in the visualization tools, creating a two-way traceability between the two stages. (Poels et al, 2018). Most of this information will already be available from the discover stage. Where the visualization tools in the discover tools are often just pictures, they become interactive tools after the prototype stage. As they become linked to the same values in different visualisation tools, allowing for the two-way traceability. Additionally, the cause-effect storytelling from the Strategy Maps helps with the designing of these relationships. The following example consists of the same value proposition Member care mediation as in the value stream example, to display the effect of mapping.
Figure 18: Example of Value Proposition details part 1
33 Here the information of the value proposition Member care mediation in the Business Ecosystem Map (Figure 6) is shown, Complete with its activities form the Value Stream Map (Figure 13). In Figure 19 and Figure 20, the same values can be found. Figure 20, however, comes from the Business Model Cube, whereas Figure 18 and 19 come directly out of the Business Ecosystem Map.
Figure 20: Example of Value Proposition details part 3
Both representations display the same information about the value proposition, confirming the two-way traceability.
The last step of the Prototype stage consists of entering value formulas and other measurements to complete the value aggregation structures. Again, the cause-effect storytelling from the Strategy Maps (Figure 14) can help determine the value formula aggregations. To further show the link between the value aggregation and the Strategy Map, an example will be given, using cost per treatment (also used in the Strategy Map description, Figure 14).