Greenhouse Gas Emissions in the Netherlands 1990-1999. National Inventory Report | RIVM
106
0
0
Hele tekst
(2) RIVM report 773201 005. page 2 of 106. Abstract This report documents the 2001 Netherlands’ annual submission of its greenhouse gas emission inventory in accordance with the United Nation’s Framework Convention on Climate Change (UNFCCC) and the European Union’s Greenhouse Gas Monitoring Mechanism. The report comprises explanations of observed trends in emissions; a description of a first assessment of key sources and their uncertainty; documentation of methods, data sources and emission factors applied; and a description of the quality assurance system and the verification activities performed on the data. Total CO2-equivalent emissions of the six greenhouse gases together increased in 1999 by about 6% relative to 1990 (1995 for fluorinated gases). This increase would be a half per cent less when comparing temperature-corrected emissions. The uncertainty in total annual CO2-equivalent emissions is estimated at 5%; the uncertainty in the 1990/95-1999 trend of total emissions is about ±3% points, based on the IPCC Tier 1 trend uncertainty assessment (95% confidence interval). Emissions of CO2 and N2O have increased from 1990 to 1999 by about 8% and 15%, respectively, while in the same period CH4 emissions have decreased by 20%, effectively to a level 0.5% point below N2O emissions. Of the fluorinated greenhouse gases, for which 1995 is the reference year, emissions of HFCs and PFCs increased by 20 and 40% in 1999, respectively, while SF6 emissions (completely recalculated) decreased by about 20%. Per individual gas, the IPCC Tier 1 trend uncertainty in total emissions of CO2, CH4, N2O and the total group of F-gases has been calculated at ±3%, ±7%, ±12% and ±20% points, respectively..
(3) RIVM report 773201 005. page 3 of 106. Contents ABSTRACT .............................................................................................................................................................2 SUMMARY .............................................................................................................................................................4 SAMENVATTING (DUTCH) ......................................................................................................................................5 CHEMICAL COMPOUNDS, UNITS, CONVERSION FACTORS FOR EMISSIONS ...............................................................6 1.. INTRODUCTION .......................................................................................................................................7. 2.. COUNTRY-SPECIFIC DEFINITIONS AND CIRCUMSTANCES ....................................................11. 2.1. 2.2.. 2.3. 3. 3.1. 3.2. 3.3.. TERRITORIAL ASPECTS; IMPORT/EXPORTS ...............................................................................................11 SOURCE ALLOCATIONS AND NATIONAL EMISSIONS...................................................................................11 2.2.1. Allocation of emissions in the transportation sector.....................................................................11 2.2.2. Allocation of emissions of cogeneration from autoproducers.......................................................12 2.2.3. Allocation of emissions from coke ovens and other energy transformation..................................13 2.2.4. Allocation of emissions from military activities ............................................................................13 COMPLETENESS .......................................................................................................................................13 CHANGES IN METHODOLOGY AND DEFINITIONS .....................................................................15 DIFFERENCES DUE TO CHANGES IN METHODOLOGY OR DATA ..................................................................15 DIFFERENCES DUE TO REVISED SOURCE ALLOCATION ..............................................................................17 CHANGES IN CRF FILES COMPARED TO PREVIOUS SUBMISSION................................................................17. 4.. METHODOLOGY AND DATA SOURCES...........................................................................................21. 5.. UNCERTAINTY AND ASSESSMENT OF KEY SOURCES ...............................................................27. 5.1. 5.2. 6. 6.1. 6.2. 6.3. 6.4. 7. 7.1.. 7.2.. 7.3. 7.4. 8.. UNCERTAINTY ASSESSMENT (IPCC TIER 1) ............................................................................................27 PRELIMINARY ASSESSMENT OF KEY SOURCE CATEGORIES .......................................................................31 QUALITY ASSURANCE/QUALITY CONTROL.................................................................................35 INTRODUCTION ........................................................................................................................................35 QUALITY ASSURANCE .............................................................................................................................35 QUALITY CONTROL .................................................................................................................................38 CO2 REFERENCE APPROACH ....................................................................................................................40 TRENDS IN GREENHOUSE GAS EMISSIONS ..................................................................................41 EMISSIONS AND SINKS OF CO2 .................................................................................................................41 7.1.1. Temperature correction for CO2 ...................................................................................................42 7.1.2. CO2 emissions from the energy sector...........................................................................................43 7.1.3. CO2 emissions from industry.........................................................................................................44 7.1.4. CO2 emissions from transport .......................................................................................................45 7.1.5. CO2 emissions from the other sectors ...........................................................................................46 7.1.6. CO2 emissions related to statistical differences ............................................................................48 7.1.7. CO2 emissions from international bunkers....................................................................................48 EMISSIONS OF CH4...................................................................................................................................50 7.2.1. Fugitive emissions of CH4 from oil and natural gas .....................................................................51 7.2.2. Emissions of CH4 due to enteric fermentation ..............................................................................52 7.2.3. Emissions of CH4 due to manure management .............................................................................53 7.2.4. Emissions of CH4 from solid waste disposal sites .........................................................................54 EMISSIONS OF N2O ..................................................................................................................................56 7.3.1. Emissions of N2O from road transport..........................................................................................57 7.3.2. Emissions of N2O from agricultural soils......................................................................................58 EMISSIONS OF FLUORINATED HALOCARBONS ...........................................................................................59 TRENDS IN EMISSIONS OF PRECURSOR GASES ..........................................................................61. 9. TRENDS IN TOTAL GREENHOUSE GAS EMISSIONS....................................................................65 REFERENCES........................................................................................................................................ 69 APPENDICES ......................................................................................................................................................71.
(4) page 4 of 106. RIVM report 773201 005. Summary This report documents the 2001 Netherlands’ annual submission of its greenhouse gas emission inventory in accordance with the United Nation’s Framework Convention on Climate Change (UNFCCC) and the European Union’s Greenhouse Gas Monitoring Mechanism. The report comprises explanations of the trends in greenhouse gas emissions for the period 1990-1999, a first assessment of so-called 'key sources' and their uncertainty following the Tier 1 and Tier 2 approach of the IPCC Good Practice Guidance, documentation of methods, data sources and emission factors applied, and of Quality Assurance and Quality Control activities. Electronic data on emissions, activity data and implied emission factors in the so-called Common Reporting Format (CRF) spreadsheet files as requested by the UNFCCC secretariat are a separate annex to this report. In the appendices to this report a copy is included of the CRF Trend Tables 10 and the IPCC Summary Tables 7A for the period 1990-1999 (all 1999 data are preliminary), Recalculation and Explanations Tables 8 and Completeness Tables from the CRF files. The emissions data reported in these tables differ slightly from the data reported in the previous report, mainly due to revisions in energy consumption data of chemical waste gas used for cogeneration by autoproducers and in energy consumption by off-road vehicles and for inland shipping; in CH4 emissions from oil and gas production; in CH4 and N2O emissions from road transport; and in F-gas emissions, in particular for PFCs and SF6, but also for HFC-23. In total, emissions of CO2 and N2O in 1990 have decreased by 0.2 and 0.6 Mton CO2-eq., respectively, and PFCs and SF6 in 1995 by 0.2 and 1.2 Mton CO2-eq., respectively. In Table 9.1 trends in national total (net) emissions are summarised for 1990-1999 (uncorrected for temperature). Total CO2 equivalent emissions of the six greenhouse gases together increased in 1999 by about 6% relative to 1990 (1995 for fluorinated gases). This increase would be a half per cent less when comparing temperature-corrected emissions. Emissions of CO2 and N2O have increased from 1990 to 1999 by about 8% and 15%, respectively, while in the same period CH4 emissions have decreased by 20%, effectively to a level 0.5% point below N2O emissions. This makes N2O emissions the second largest greenhouse gas in the Netherlands in 1999 (when refraining from the uncertainties in the annual emission estimates). Of the fluorinated greenhouse gases, for which 1995 is the reference year, emissions of HFCs and PFCs increased by 20 and 40% in 1999, respectively, while SF6 emissions (completely recalculated) decreased by about 20%. In the period 1990-1999 the largest sectoral growth of CO2 emissions occurred in the transport sector (19% or 5.7 Mton). In 1999, total CO2 emissions decreased by 7 Mton compared to 1998. This was mainly caused by: (a) an inconsistency in the time series for CO2 due to elimination of the statistical differences in 1999 (2-4 Mton); (b) a net increase in imported electricity of 55%, accounting for 17% of gross domestic electricity consumption (2-3 Mton); (c) a shift in the fuel mix for electricity generation (1 Mton). In addition, the relative warm winter of 1999 caused uncorrected CO2 emissions to decrease another 1.5 Mton compared to 1998. In 1999, temperature-corrected CO2 emissions were 5.2 Mton or 3% higher than total national uncorrected CO2 emissions. The results of a provisional CO2 Reference Approach calculation showed that on average the sum of annual sectoral emissions differs 1.0% from the reference calculation. In 1999, total CH4 emissions have decreased by 20% compared to the 1990 level. Sectors that contributed most to the decrease were the waste sector (-24%) and the agricultural sector (-16%) with 2.9 and 1.7 Mton CO2eq., respectively. In 1999, total N2O emissions increased by about 15% compared to 1990, mainly due to the increase of the emission from industrial processes (15%) and from agriculture (16%) with 1.4 and 1.1 Mton CO2eq., respectively. As said above, in 1999, the N2O emissions have become the second important greenhouse gas in the Netherlands, above CH4. In 1999, total emissions of all F-gases increased by about 30% compared to the 1995 level (50% compared to 1990), which is equivalent to 2.8 Mton CO2-eq. The uncertainty in total annual CO2 equivalent emissions is estimated at 5%; the uncertainty in the 1990/951999 trend of total emissions is about ±3% points, based on the IPCC Tier 1 trend uncertainty assessment (95% confidence interval). For individual compounds our current overall uncertainty estimate in annual emissions is ±3% for CO2, ±25% for CH4, ±50% for N2O; ±50% for HFCs and PFCs and -10% to +100% for SF6 (the latter because of missing sources). Per individual gas, the Tier 1 trend uncertainty in total emissions of CO2, CH4, N2O and the total group of F-gases has been calculated at ±3%, ±7%, ±12% and ±20% points, respectively..
(5) RIVM report 773201 005. page 5 of 106. Samenvatting (Dutch) Dit rapport over de Nederlandse inventarisatie van broeikasgasemissies is geschreven om te voldoen aan de nationale rapportageverplichtingen in 2001 van het Klimaatverdrag van de Verenigde Naties (UN-FCCC) en van het Bewakingsmechanisme Broeikasgassen van de Europese Unie. Dit rapport bevat trendanalyses voor de emissies van broeikasgassen in de periode 1990-1999; een eerste analyse van zgn. sleutelbronnen en de onzekerheid in hun emissies volgens de 'Tier 1'-methodiek van het IPCC-rapport over Good Practice Guidance; documentatie van gebruikte berekeningsmethoden, databronnen en toegepaste emissiefactoren; en een overzicht van het kwaliteitssysteem en de verificatie van de emissiecijfers voor de Nederlandse Emissie-Registratie. Electronische data op file over emissies, activiteitendata en afgeleide emissiefactoren in het zgn. Common Reporting Format (CRF), waar door het VN-Klimaat-secretariaat om wordt verzocht, vormen een aparte annex bij dit rapport. In de appendices bij dit rapport zijn de CRF trend-tabellen en de IPCC tabellen '7A' opgenomen voor 1990-1999 (alle cijfers voor 1999 zijn voorlopig), alsmede tabellen over herberekeningen en compleetheid van emissiebronnen. De emissiecijfers zoals hier gerapporteerd verschillen enigszins van de vorige rapportage, met name als het gevolg van wijzigingen in het energiegebruik van chemisch restgas voor decentrale warmte-kracht-koppeling, van overige mobiele werktuigen en van binnenlandse scheepvaart; in de CH4-emissies van olie- en gasproduktie; in CH4 en N2O van wegtransport; en in de emissies van F-gassen, met name van PFK's en SF6, maar ook van HFK-23. In totaal zijn de emissies van CO2 en N2O resp. 0,2 en 0,6 Mton CO2-equivalent lager geworden; voor PFK's en SF6 in 1995 is dat resp. 0,2 en 1,2 Mton CO2-eq. In Tabel 9.1 zijn de totale emissietrends 1990-1999 samengevat (zonder temperatuurcorrectie). De totale netto CO2-eq.-emissies waren in 1999 6% hoger dan in 1990 (1995 voor de F-gassen). Dit wordt een half procent minder na temperatuurcorrectie. In die periode zijn de emissies van CO2 en N2O met resp. 8% en 15% gestegen, terwijl de CH4-emissies met 20% daalden tot een niveau dat 0.5% onder dat van de N2O-emissies in 1999 ligt. Dit maakt N2O in 1999 tot het tweede broeikasgas van Nederland (afgezien van de onzekerheden). Van de zgn. F-gassen, waarvoor 1995 het referentiejaar is, stegen de HFK- en PFK-emissies met resp. 20% and 40% in 1999 ten opzichte van 1995, terwijl de emissies van SF6 (geheel herberekend) met 20% daalden. In de periode 1990-1999 vond de grootste sectorale groei in de CO2-emissies plaats in de transportsector (19% of 5.7 Mton). In 1999 zijn de totale CO2-emissies met 7 Mton gedaald ten opzicht van 1998. Dit werd met name veroorzaakt door: (a) een inconsistentie in de tijdreeks voor CO2 als gevolg van de eliminatie van het statistisch verschil in 1999 (2-4 Mton); (b) een toename van 55% in de netto import van elektriciteit, die 17% van het bruto binnenlandse stroomgebruik dekt (2-3 Mton); (c) een verschuiving in de brandstofmix van centrales (1 Mton). Daarnaast zorgde de relatief warme winter van 1999 t.o.v. 1998 voor een afname van ca. 1,5 Mton in de ongecorrigeerde emissies. De resultaten van een voorlopige zgn. IPCC Referentieberekening voor CO2 lieten een verschil zien van gemiddeld 1.0% met de som van de jaarlijkse sectorale emissies. In 1999 waren de methaanemissies 20% lager dan in 1990. De afvalsector (-24%) en de landbouwsector (-16%) droegen hieraan het meest bij (resp. 2,9 en 1,7 Mton CO2-eq.). De N2O-emissies zijn in 1999 ca. 15% gestegen ten opzichte van 1990, vooral als gevolg van een stijging van emissies door industriële processen (15%) en uit de landbouw (16%) (resp. 1,4 en 1,1 Mton CO2-eq.) Zoals hierboven opgemerkt werd N2O in 1999 het tweede broeikasgas van Nederland. De actuele emissies van F-gassen zijn in de periode 1995-1999 met 30% gestegen (50% t.o.v. 1990), hetgeen overeenkomt met 2,8 Mton CO2-eq. De onzekerheid in de totale jaarlijkse emissies wordt geschat op 5%; de onzekerheid in de trend over de periode 1990/95-1999 wordt op ±3%-punten geschat, gebaseerd op de zgn. 'Tier 1' methodiek van de IPCC voor trendonzekerheden (met 95% betrouwbaarheidsinterval).Voor de afzonderlijke stoffen wordt thans de onzekerheid in de jaarlijkse emissies als volgt geschat: voor CO2 ±3%, CH4 ±25%, N2O ±50%; HFK’s en PFK's: ±50%; en voor SF6: -10% tot +100% (in verband met ontbrekende bronnen). De trendonzekerheid wordt voor CO2, CH4, N2O en voor alle F-gassen als groep geschat op resp. ±3%, ±7%, ±12% and ±20%-punten..
(6) page 6 of 106. RIVM report 773201 005. Chemical compounds CFCs CF4 C2F6 CH4 CO CO2 CTC FICs HCFCs HFCs HNO3 MCF NOx N2O NMVOC PFCs SO2 SF6 VOC. Chlorofluorocarbons Perfluoromethane (tetrafluoromethane) Perfluoroethane (hexafluoroethane) Methane Carbon monoxide Carbon dioxide Carbon tetrachloride (tetrachloromethane) Fluoroiodocarbons Hydrochlorofluorocarbons Hydrofluorocarbons Nitric Acid Methyl Chloroform (1,1,1-Trichloroethane) Nitrogen oxide (NO and NO2), expressed as NO2 Nitrous oxide Non-Methane Volatile Organic Compounds Perfluorocarbons Sulphur dioxide Sulphur hexafluoride Volatile Organic Compounds (may include or exclude methane). Units MJ GJ TJ PJ. Mega Joule (106 Joule) Giga Joule (109 Joule) Tera Joule (1012 Joule) Peta Joule (1015 Joule). Mg Gg Tg Pg. Mega gramme (106 gramme) Giga gramme (109 gramme) Tera gramme (1012 gramme) Peta gramme (1015 gramme). ton kton Mton. metric ton (= 1 000 kilogramme = 1 Mg) kiloton (= 1 000 metric ton = 1 Gg) Megaton (= 1 000 000 metric ton = 1 Tg). mln mld. million (= 106) milliard (= 109). Conversion factors for emissions From element basis to full molecular mass: C → CO2 : x 44/12 = 3.67 C → CH4 : x 16/12 = 1.33 C → CO : x 28/12 = 2.33 N → N2O : x 44/28 = 1.57 N → NO : x 30/14 = 2.14 N → NO2 : x 46/14 = 3.29 N → NH3 : x 17/14 = 1.21 N → HNO3 : x 63/14 = 4.50 S → SO2 : x 64/32 = 2.00. From full molecular mass to element basis: CO2 →C : x 12/44 = 0.27 CH4 →C : x 12/16 = 0.75 CO → C : x 12/28 = 0.43 N2O →N : x 28/44 = 0.64 NO →N : x 14/30 = 0.47 NO2 →N : x 14/46 = 0.30 NH3 →N : x 14/17 = 0.82 HNO3 →N : x 14/63 = 0.22 SO2 → S : x 32/64 = 0.50.
(7) RIVM report 773201 005. 1.. page 7 of 106. Introduction. This report documents the 2001 Netherlands’ annual submission of its greenhouse gas emission inventory in accordance with the guidelines provided by the United Nation’s Framework Convention on Climate Change (UNFCCC) and the European Union’s Greenhouse Gas Monitoring Mechanism. The report comprises explanations of the trends in greenhouse gas emissions for the period 19901999 and descriptions of methods and data sources; of Tier 1 assessments of the uncertainty in annual emissions and in emission trends; of a preliminary assessment of key sources following the Tier 1 and Tier 2 approach of the IPCC Good Practice Guidance (IPCC, 2000); and of Quality Assurance and Quality Control activities. Electronic data on emissions, activity data and implied emission factors in the so-called Common Reporting Format (CRF) spreadsheet files as requested by the UNFCCC secretariat are a separate annex to this report. In the Appendices to this report a copy is included of the Trend Tables 10 and the IPCC Summary Tables 7A for the period 1990-1999 (1999 data are preliminary), Recalculation and Explanation Tables 8 and Completeness Tables from the CRF files.. Country-specific definitions and changes Country-specific definitions of source categories are provided in Chapter 2. This includes a summary of identified missing sources. The emission data for 1990 and 1997-1998 as reported in the CRF tables differ slightly from the data reported in the previous report (Olivier et al., 2000) mainly due to: • revisions in energy consumption data of chemical waste gas used for cogeneration by autoproducers; • revised estimates for energy consumption by off-road vehicles and for inland shipping; • revisions of CH4 emissions from oil and gas production and from CH4 and N2O from road transport; • correction for 1997 and 1998 of the division of CO2 from waste incineration into fossil-originated and biogenic-originated carbon; • revisions of the F-gas emissions, in particular for PFCs and SF6, but also for HFC-23. In total, emissions of CO2 and N2O in 1990 have decreased by 0.2 and 0.6 Tg CO2-eq., respectively, and HFCs and SF6 in 1995 by 0.2 and 1.2 Tg CO2-eq., respectively. In addition, to improve the consistency of times series, changes have been made in the source allocation for the period 19911997. These changes are discussed briefly in Chapter 3. This also includes a summary of the degree of completeness of the CRF data files: •. data for 1990, 1998 and 1999 are now almost complete, due to an effort to include the emissions by fuel type for all fuel combustion sectors, also for the hundreds of individually reported sources;. •. data for F-gases are complete for the whole time series 1990-1999, however, excluding the distribution of HFCs over various consumption categories.. Next, in Chapter 4 the emission calculation methods and data sources are briefly described and documented.. Key source and uncertainty assessments The uncertainty in the emission estimates per gas is now based on an IPCC Tier 1 uncertainty assessment of the uncertainty in the underlying emission factors and activity data for the list of possible key sources. All uncertainty figures in this report should be interpreted as 95% confidence ranges, in conformity with the IPCC report on Good Practice Guidance and Uncertainty Management (IPCC, 2000). These uncertainties are based on the results of a national workshop on data quality held in 1999 (Van Amstel et al., 2001a), RIVM factsheets on emission data quality, default values.
(8) page 8 of 106. RIVM report 773201 005. provided in the IPCC Good Practice Guidance and expert judgement by RIVM experts. In the Chapter 5 the uncertainty estimates for both annual uncertainty and the trend uncertainty are calculated using simple, standard error propagation of the overall uncertainty per greenhouse gas as defined in the IPCC Tier 1 approach and assuming no correlation between sources and normal distribution of the uncertainties. Our actual overall estimate of total annual uncertainty per greenhouse gas, which is based on the IPCC Tier 1 uncertainty assessment (95% confidence interval), is currently estimated by RIVM as: CO2 CH4 N 2O. ±3% ±25% ±50%. HFCs PFCs SF6. ±50% ±50% -10%; +100%. The resulting uncertainty in national total annual CO2-eq. emissions is about 5%. The uncertainty in the trend of total emissions is about ±3% points, based on the IPCC Tier 1 trend uncertainty assessment. Per individual gas, the Tier 1 trend uncertainty in total emissions of CO2, CH4, N2O and the total group of F-gases has been calculated at ±3%, ±7%, ±12% and ±20% points, respectively. For precursor gases the uncertainty in national annual total emissions are estimated at (RIVM, 1999): CO NOx NMVOC SO2. ±25% ±25% ±50% ±25% (possibly ±10%). In the remainder of Chapter 5 a preliminary assessment of key sources has been made using the Tier 1 and Tier 2 approach of the IPCC Good Practice Guidance report. Chapters 6 describes the Quality Assurance/Quality Control activities performed, including the results of comparison with a provisional CO2 Reference Approach calculation for the 1990-1999 period. On average the sum of annual sectoral CO2 emissions differ by 1.0% from the reference calculation (range of -0.4% to +2.5%).. Trend assessments Next, in Chapters 7 and 8 the trends in emissions of greenhouse gas and of precursor gases are described and explained. The report concludes in Chapter 9 with a description of the trends and the contribution of emissions per greenhouse gas to annual CO2-eq. emissions. In the appendices to this report a copy is included of the trend tables 10 and the IPCC summary tables 7A for the period 19901999 (1999 data are preliminary), recalculation and explanations tables 8 and completeness tables from the CRF files. The analysis of trends and uncertainty estimates in emissions of the various sources has been made in cooperation with the following RIVM experts: Mr. Dick Beker (waste handling); Mr. Robert M.M. van den Brink (transport); Mr. Klaas W. van der Hoek (agriculture), Mrs. Johanna A. Montfoort (fugitive emissions of CH4); Mr. Kees J. Peek (industry); and Mr. Durk S. Nijdam (small combustion). In addition, Mr. Ed A. Zonneveld of CBS provided pivotal information on CO2 related to energy use. The group also provided activity data for the CRF files, in cases where these were not included in the data sheets submitted by the ER Task Groups.. Print out of CRF summary tables Finally, in the appendices a description of the temperature correction method and a printed summary version of the CRF files is provided: • •. IPCC Summary Tables 7A for 1990-1999 (CRF Summaries 1); Trend Tables 10 for each gas individually and for all gases and source in CO2-eq.;.
(9) RIVM report 773201 005. • • •. page 9 of 106. Trend Tables 10 for precursor gases; Recalculation Tables and Explanation Table 8.a and 8.b for 1990 and 1997; Completeness Table 9 for 1990.. Presentation of figures; rounding and summation Please note that in all tables the same number of decimal digits is used within a table (or per compound column). Therefore, the number of (decimal) digits shown does not correspond with the number significant digits of the figures presented. Please note too that in the tables the figures may not exactly add up to the (sub)totals because of independent rounding. We refer to Chapter 5 for information about the uncertainty in sectoral and national total emissions..
(10) page 10 of 106. RIVM report 773201 005.
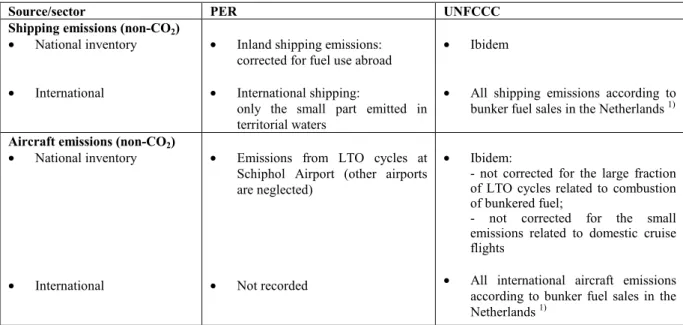
(11) RIVM report 773201 005. 2.. page 11 of 106. Country-specific definitions and circumstances. 2.1. Territorial aspects; import/exports The territory of the Netherlands from which emissions are reported is the legal territory, including a twelve miles zone from the coastline and inland water bodies. This excludes Aruba and the Netherlands Antilles, which are self-governing dependencies of the Royal Kingdom of the Netherlands. Emissions from offshore oil and gas production at the Netherlands' part of the continental shelf are included. Emissions from all electricity generation in the Netherlands are accounted for, including the fraction of the produced electricity that is exported. Until 1999, the Netherlands imported about 10% of its electricity; in 1999, however, the net import increased by 55% due to the liberalisation of the European electricity markets.. 2.2. Source allocations and national emissions We recall that due to data processing limitations some sub-categories have been defined somewhat differently than the source category definition in the Revised IPCC Guidelines (IPCC, 1997).. 2.2.1. Allocation of emissions in the transportation sector The transport sector comprises road traffic; mobile off-road equipment such as tractors, and road and building construction equipment; rail transport; ships; and aircraft. The latter two can be separated into domestic (inland) transport and international transport (bunkers). In addition, pipeline transport (excluding natural gas) is also included in this sector. Road transport For national policy purposes, air pollution from road transport is in general calculated from statistics on vehicle-km. However, fuel consumption that is based on vehicle-km is smaller than the fuel consumption as included in the energy sales statistics of the Netherlands. The Revised IPCC Guidelines ask countries to report greenhouse gas emissions from combustion on the basis of fuel consumption within the national territory. Thus, road traffic emissions of the direct greenhouse gases CO2, CH4 and N2O are calculated and reported according to these Guidelines (i.e. a correction is made to convert emissions related to vehicle-km to emissions related to energy sales statistics). Emissions of all other compounds, including ozone precursors and SO2, which are more directly involved in air quality, are therefore calculated using traffic activity data (i.e. with fuel consumption figures that are somewhat different from energy supply statistics; see Section 7.1.4 for more details). Shipping In the Netherlands, the national Emission Registration (ER) distinguishes between inland shipping and international shipping, the former based on fuel sold within the Netherlands and the latter based on fuel sold from so-called bunkers. However, a small part of inland ships also consume 'Dutch' fuel in other countries, e.g. when moving along international waterways, of which the emissions are excluded in the ER reports. It was chosen to copy this minor correction for reports in the IPCC format (although the Guidelines want all emissions from Dutch fuel to be allocated to the Netherlands). Conversely, international ships consume a small part of their bunkered fuel in the Netherlands' territorial waters. The corresponding non-CO2 emissions are include in the official Netherlands' national inventory with emissions for all compounds, called the national Pollutant Emission Register (PER) (see Table 2.1). These (bunker) emissions are however excluded from National totals when reporting in the IPCC format. Therefore the emissions for NOx, and SO2 of the target group transport.
(12) page 12 of 106. RIVM report 773201 005. as reported in official Netherlands' inventories, are higher than the emissions from the IPCC 1A3 'Transport' category. For other compounds however, this difference is rather small. Table 2.1 Allocation of non-CO2 emissions from shipping and aircraft in domestic national inventories and inventories submitted to the UNFCCC.. 1). Source/sector Shipping emissions (non-CO2) • National inventory. PER. UNFCCC. •. Inland shipping emissions: corrected for fuel use abroad. •. Ibidem. •. •. International shipping: only the small part emitted in territorial waters. •. All shipping emissions according to bunker fuel sales in the Netherlands 1). Aircraft emissions (non-CO2) • National inventory. •. Emissions from LTO cycles at Schiphol Airport (other airports are neglected). •. Ibidem: - not corrected for the large fraction of LTO cycles related to combustion of bunkered fuel; - not corrected for the small emissions related to domestic cruise flights. •. •. Not recorded. •. All international aircraft emissions according to bunker fuel sales in the Netherlands 1). International. International. Presently not reported (except for CO2).. Air traffic For calculating CO2 emissions from domestic air transport domestic fuel sales figures for aircraft from the Netherlands' Energy Statistics were used. This is different from the emissions recorded in the national Emissions Registration, which accounts only for aircraft emissions associated with the LTO cycles of Schiphol Airport (other airports are neglected). Indeed, in the Netherlands by far the most aircraft activities (>90%) are related to Schiphol Airport. For the emissions of non-CO2 greenhouse gases, the inventory of the national Pollutant Emission Register (PER) is used. In the PER system, however, the emphasis is much more on air quality and therefore on local emissions. A good estimate of relevant emissions is the LTO emissions at Schiphol Airport (Amsterdam), i.e. LTO cycles at other airports are neglected. On the other hand, the main part of these LTO cycles concern the combustion of bunkered fuel, which should be reported - according to the Guidelines - as international emissions. In this report, no attempt was made to estimate specific emissions related to all domestic flights (including cruise emissions of these flights), since these emissions are almost negligible anyway. Off-road mobile sources This category comprises agricultural machinery such as tractors, road and building construction machinery. Emissions of these sources are reported under 1A3: 'Transport'.. 2.2.2. Allocation of emissions of cogeneration from autoproducers These emissions are allocated to the various Target Groups that own the cogeneration (Combined Heat and Power, CHP) facilities. These are notably the Energy Sector (public electricity generation), Industry, Agriculture, Retail/Services/Government, and the Residential Sector. Thus, the combustion emissions due to cogeneration are reported under the IPCC Sectors that correspond to these Target Groups. Often new CHP installations are operated as a joint venture with the energy sector, in which all heat is delivered to the industrial plant and all electricity is sold to the energy sector. In this case.
(13) RIVM report 773201 005. page 13 of 106. the CHP installation is regarded as a venture with main activity to produce heat and electricity, and it is therefore allocated within the energy sector. So the stabilisation of industrial CO2 emissions is partly caused by the allocation of emissions towards the energy sector. In total, electricity production by CHP comprises almost 1/3 of all domestic electricity production (see Table 7.4).. 2.2.3. Allocation of emissions from coke ovens and other energy transformation Emissions from coke ovens are included under 1A2: Industry'. Under 1A1c: 'Other Energy transformation' we include not only the emissions from refineries, but also from lubricants and waxes manufacturing and combustion emissions from the oil and gas production and distribution industry.. 2.2.4. Allocation of emissions from military activities Military emission sources can be distinguished into mobile and stationary sources: • Emissions of mobile military sources are included in the Target Group 'Traffic and Transport'. These are reported under IPCC-category A3: 'Transport'; • Emissions of stationary military sources (e.g. space heating of buildings) are included in the Target Group Retail/Services/Government. The combustion emissions of this category are reported under 1A4a: 'Commercial/Institutional', whereas the process emissions are reported under 3: 'Solvents and other product use'. For these activities no separate emission estimates are available.. 2.3. Completeness The Netherlands greenhouse gas emission inventory includes all sources identified by the Revised IPCC Guidelines except for the following: •. CO2 emissions from agricultural soils (category 4D) are not estimated/reported;. •. CH4 emissions from soils deceased in last 40 years due to drainage and lowering of water tables; these emissions have been included in the natural total; thus no net (positive) anthropogenic emissions;. •. CH4, N2O and other non-CO2 emissions from international bunkers are not yet estimated/reported.. Furthermore, within the Land Use Change and Forestry (LUCF) Sector, IPCC source category 5, only CO2 emissions (in this case: sinks) from category 5A: 'Changes in forest and other woody biomass stocks' have been calculated for a number of years up to 1994 and kept constant thereafter. Awaiting further decisions and recommendations from the Conference of Parties on this subject, no attempt was made to estimate emissions or sinks in the other LUCF categories 5B, 5C and 5D in conformity with the IPCC Guidelines. This subject, however, has been discussed at length at a national workshop held in 1999 (Van Amstel, 2000b). In addition, when verifying the trend data in the CRF files, it was found that no correction - i.e. no supplementary emission estimate - has been made for the following sources: •. CO2 from cement clinker production is missing for 1990-1992; this accounts for about 0.3 Tg CO2;. •. CO2 from flaring/venting from oil and gas production for 1998-1999; this accounts for a small amount;. •. In addition, it has been observed that CH4 from horses 1998-1999 is missing (about 4 Gg CH4)..
(14) page 14 of 106. RIVM report 773201 005. These accidentally errors will be improved in the next update of the inventory. In addition, for the next update of the national energy balance a revision is planned of the statistical differences in the energy statistics for the years 1990 and 1995-1998. This will then also allow a recalculation of the CO2 related to statistical differences in the greenhouse gas emission inventory. Recently a survey made to check for possibly unidentified sources of non-CO2 emissions in the Netherlands did reveal that some minor sources are not included in the present greenhouse gas inventory (DHV, 2000): •. CH4: notably large-scale compost production from organic waste and waste-water treatment; to be included when monitored regularly and when not already included in the present emission inventory.. •. N2O: notably large-scale compost production from organic waste and waste-water treatment; to be included when monitored regularly and when not already included in the present emission inventory.. •. PFCs: some minor sources; to be included when monitored regularly and when not already included in the present emission inventory.. •. SF6: notably production of sound-insulating windows; to be included when monitored regularly and when not already included in the present emission inventory.. These sources may be included in a later stage, when checked that they are not already included in the present emission inventory and when it has been decided to monitor them regularly..
(15) RIVM report 773201 005. 3.. page 15 of 106. Changes in methodology and definitions. In this chapter we outline the key differences compared with the previous submission reported by Olivier et al. (2000). Because most changes are only of a minor nature and since recalculations have not been performed for all years prior to 1997, but mostly only to 1990 and 1995 (see Chapter 5), emission figures of all gases have been kept unchanged for the years 1991-1996 compared to the previous submission. For these years, however, a number of source allocation improvements have been made. An exception is the emissions of HFCs, PFCs and SF6, which have been revised for the whole time period 1990-1999. In addition, for 1990 emissions have been updated, including the changes already announced in the two previous reports (Olivier et al., 1999, 2000), but not yet implemented in the 1990 inventory for reasons of time series consistency.. 3.1. Differences due to changes in methodology or data Changes in activity data since the previous submission: •. Starting for 1999, the statistical difference in the annual energy statistics, which is by definition the difference between the apparent national energy consumption (indigenous production + import - export - bunkers ± stock change) and the bottom-up sum of all sectoral energy use, has been redefined and effectively eliminated (see Chapter 4);. •. Starting in 1999, the definition of non-energy use of coal/lignite and coke in the iron and steel industry has changed considerably (about 10 times as high). Therefore, it was decided in calculation of carbon storage of coal/lignite and coke feedstocks in the CO2 Reference Approach of 1999 not to include these new feedstock figures.. •. The consumption of gasoline and diesel fuel in road transport has been revised for 1995 onwards. For 1997 this revision corresponds with a decrease of 5.6 PJ for gasoline and 10.5 PJ for diesel.. •. The use of chemical waste gas in 1998 and 1999 by privately owned cogeneration facilities has been corrected.. In addition, for 1990 changes announced in the previous report have now been implemented for 1990: •. Due to revised estimates for energy consumption by off-road vehicles, energy consumption allocated to the transport sector increased by about 7.9 PJ in 1990; this change corresponds to about 0.5 Tg CO2.. •. Energy consumption for inland shipping is now based on information on shipping routes and velocities per type of ship; this resulted in a higher fuel consumption, in particular for freight transport; for 1990 the change amounts to less than 0.1 Tg CO2.. •. Recently a census was made of the number of open fireplaces and wood stoves and their use (fuelwood and charcoal consumption is not part of the official energy balances of the Netherlands). This has lead to the revision of the degree of penetration and a decrease in the assumed use. As a result the biofuel consumption data have decreased about 40% for all years.. Changes in greenhouse gas emissions since the previous submission: • CO2 emissions from fuel use in 1990 and 1998 due to the changes in energy consumption data mentioned above; • CO2 emissions from waste incineration in 1997 and 1998 due to a correction of the division of CO2 into fossil-originated and biogenic-originated carbon;.
(16) page 16 of 106. RIVM report 773201 005. • CH4 emissions from oil and gas production have been recalculated for 1995-1998 based on information from the gas producing companies. • CH4 and N2O emission factors for road transport are now based on the results of a semi-continuous monitoring programme by TNO, in which emission factors are measured for samples of cars. • Actual emissions of HFC-134a have been updated for 1996 onwards based on new information about the shares of various application types for HFC-134a. Total change in HFC emissions in 1995 is negligible. • The preliminary figure for HFC-23 emissions in 1998 from the previous submission has been revised substantially, as the newly installed abatement technology appeared not as effective as expected, resulting in an increase of about 2.0 Tg CO2-eq. of HFC-23 emissions in 1998. • PFC emissions from aluminium production have been recalculated using plant-specific production data and measured emission factors based on recent measurement studies at the two producing companies. The new measured emission factors have been applied for all years (assuming no technological change). For one plant we used a (measured) emission factor for C2F6 ≠ 1/10 CF4, which is the default ratio recommended by IPCC. For the other plant new emission factors - based on the ratio of 1/10 for C2F6 to CF4 - were used, based on a reported emission factor for 'total PFCs'. The total change for 1995 is a decrease from 2.09 to 1.86 Tg CO2-eq. (including emissions from PFC usage, mentioned below). • For PFC and SF6 emissions from the use of PFCs and SF6 in semiconductor manufacture, now plant-specific (confidential) emissions data have been used, which were calculated in conformity with the IPCC Good Practice Guidance, instead of using the annual KPMG reporting of total consumption of fluorinated compounds. • For SF6 now actual emissions have been calculated for the whole period 1990-1999 in conformity with the IPCC Good Practice Guidance. In the previous submission it was assumed that (raw estimates of) SF6 consumption are equal to actual emissions. As of this year this estimate has been replaced by more detailed estimate of only most important sources. Consumption figures are now based on data from the industry sector (partly Confidential Business Information) and estimates for the existing stock of Gas Insulated Switchgear (GIS) equipment, addition of new GIS equipment and manufacturing of GIS equipment, and for semiconductor manufacture (see above). For 1995 the actual emissions of SF6 are now 0.17 Tg CO2-eq., replacing the old value of 1.46 Tg CO2-eq. In total, emissions of CO2 and N2O in 1990 have decreased by 0.2 and 0.6 Mton CO2-eq., respectively, and PFCs and SF6 in 1995 by 0.2 and 1.2 Mton CO2-eq., respectively. Changes in ozone precursors and SO2 since the previous submission: • Emissions from fossil fuel use in 1990 and 1998 due to the changes in energy consumption data mentioned above; • Emissions from changes in amounts of biofuel use mentioned above; • Emissions from road transport based on a new measurement programme of emission factors from passenger cars. The figures reported here comply with the Environmental Balance 2000 (RIVM, 2000a,b) and with the Annual emissions and waste report 2000 describing emissions and waste in 1997, 1998 and 1999 (Van Harmelen et al., 2000), except some minor differences, mainly source allocations, due to different production dates. We recall that all data in this report presented for 1999 are preliminary..
(17) RIVM report 773201 005. page 17 of 106. 3.2. Differences due to revised source allocation Emissions in the Netherlands are grouped by so-called Target Groups, on which environmental policy is focused. The definition of these groups is provided in Olivier et al. (1999) along with an updated correspondence table for emissions from Target Groups and IPCC source categories. As a next step towards reporting at the more detailed source category level of the Common Reporting Format as requested by the Parties, all subcategories at the lowest aggregation level currently used for reporting for domestic purposes (so-called 'rapcodes') have received an additional attribute 'IPCC subsector'. In the course of this definition process, a few improvements of the current rapcode to 'IPCC sector' correspondence table have been made. This was done to achieve the best possible compliance with source category definitions in the Revised 1996 IPCC Guidelines within the constraints of lowest sub-source categories presently identified (rapcodes) in the Netherlands' Emission Registration system. Furthermore, due to different inventory datasets used for reporting data for the 1991-1996 period as opposed to the years 1990, 1997-1999, some changes in source allocations were made harmonise the reporting to the same IPCC subcategories for all years, thereby increasing the consistency of time series at those levels. In addition, for 1990 the source allocation was also updated according to the latest correspondence table, including the changes mentioned in the two previous reports but not yet implemented at that time: •. CO2: reallocation between categories 1A1-1A4 in 1990 and 1996-1998, mainly due to revision of energy consumption for off-road transport (7.9 PJ or 0.5 Tg CO2 in 1990; about 4 PJ in recent years);. •. CO2: reallocation within category 2 for 1990 and 1996-1998, to achieve a better match with the corresponding IPCC industry categories;. •. CO2: reallocation between categories 6D and 1A1 for 1995-1998, mainly due to correction of misallocation of emissions from waste incineration (with energy production) in 6D to 1A1;. •. CH4: reallocation within categories 4A and 4B for 1990 and 1996-1998 to achieve a better split into the animal subcategories;. •. N2O: reallocation within category 2 for 1990-1995, mainly to allocate all N2O in this sector to the nitric acid production although a small amount is emitted from other process sources;. Finally, we recall that due to data processing limitations for a few sub-categories we used a somewhat different definition than described in the Revised IPCC Guidelines (see Section 2.2).. 3.3. Changes in CRF files compared to previous submission Accompanying this report are 10 Common Reporting Format (CRF) data files, named "crf-nld-2001NN.xls" with NN = 90 .. 99, compressed into three files: crf-nld-90-93.zip; crf-nld-94-97.zip; crfnld-98-99.zip. The tables included in the Appendices represent the printed summary version of the 2001 Netherlands’ annual submission of the CRF files of its greenhouse gas emission inventory in accordance with the UNFCCC and the European Union’s Greenhouse Gas Monitoring Mechanism and include: • IPCC Summary Tables 7A for 1990-1999 (CRF Summaries 1); • Trend Tables 10 for each gas individually and for all gases and source in CO2-eq.; • Trend Tables 10 for precursor gases; • Recalculation Tables and Explanation Table 8.a and 8.b for 1990 and 1997; • Completeness Table 9 for 1990. The largest changes are (see copy of recalculation checklist below):.
(18) page 18 of 106. RIVM report 773201 005. • • •. Data for 1997 and 1998 were updated (1998 data were preliminary in the previous submission) Data for 1999 has been added (all figures for 1999 are preliminary data) Data for 1990 were updated (according to the last data and methodology including changes announced in the previous two inventory reports); • Also for these years more detailed data have been added to the set of CRF files that accompany this report. In particular for fuel combustion by the Energy Sector and Manufacturing Industries (IPCC categories 1A1 and 1A2) an attempt was made for 1990, 1998 and 1999 to split the emissions data per sector by fuel type. This could be only done for approximately 80% of the CO2 emissions due to limited detail in the reports of the individual companies that make up the largest part of these source categories; • For HFCs, PFCs and SF6 the complete time series 1990-1999 has been revised. For HFCs for 1995 onwards only; PFC emissions are now partly based on measurement in one aluminium production plant; SF6 emissions are now actual emissions estimates instead of only potential emissions acting as such, changing the emissions substantially. The other data for 1991-1996 had been prepared last year and remained essentially unchanged compared to the previous submission, except for some error corrections and reallocations to improve the time series consistency. This refers mainly to precursors in 1991, N2O from chemical industrial processes in 1990-1995, a movement of CO2 emissions from waste incineration with energy production from category 6 to category 1A1 for 1995-1998, and to a split of CH4 from agriculture into enteric fermentation and manure management.. Status reports on recalculations For information we summarise the CRF status reports on recalculations below. •. Recalculations for 1990: Energy. Ind.Processes. Solvent Use. LUCF. Agriculture. Waste. TRUE. TRUE. FALSE. FALSE. FALSE. TRUE. CH4. TRUE. FALSE. FALSE. FALSE. TRUE. FALSE. N2O. TRUE. TRUE. FALSE. FALSE. TRUE. FALSE. FALSE. FALSE. TRUE. TRUE. Recalculation:. CO2. HFCs, PFCs, SF6 Explanations:. TRUE FALSE. TRUE. Recalculation tables for all recalculated years:. TRUE. Full CRF for the recalculated base year:. TRUE. Recalculations for 1991-1996: only for F-gases (for other compounds only source allocation improvements).. •. Recalculations for 1997:. Recalculation:. •. Energy. Ind.Processes. CO2. TRUE. TRUE. CH4. TRUE. TRUE. N 2O. TRUE. FALSE. HFCs, PFCs, SF6 Explanations: Recalculation tables for all recalculated years: Full CRF for the recalculated base year:. Solvent Use. LUCF. Agriculture. Waste. TRUE. FALSE. FALSE. FALSE. FALSE. FALSE. TRUE. TRUE. TRUE. FALSE. TRUE. TRUE. TRUE. FALSE. TRUE. TRUE. TRUE TRUE. TRUE. TRUE TRUE.
(19) RIVM report 773201 005. •. page 19 of 106. Recalculation:. Recalculations for 1998: full recalculation, since previous data had status 'preliminary' status, which is now 'final'. Energy. Ind.Processes. CO2. TRUE. TRUE. CH4. TRUE. TRUE. N 2O. TRUE. TRUE. HFCs, PFCs, SF6 Explanations: Recalculation tables for all recalculated years: Full CRF for the recalculated base year:. Solvent Use. LUCF. Agriculture. Waste. TRUE. FALSE. FALSE. TRUE. FALSE. FALSE. TRUE. TRUE. TRUE. FALSE. TRUE. TRUE. TRUE. FALSE. TRUE. TRUE. TRUE TRUE. TRUE. TRUE TRUE. Completeness of the CRF files As mentioned above, the CRF files for 1990, 1998 and 1999 now also include sectoral background data for 1A1 Fuel combustion, including 1A1: Energy Industries and 1A2: Manufacturing Industries. That is to say, to the extent that in the various industry sectors emissions were reported in the national Emission Registration system per fuel type (solid, liquid, gaseous). Derived gases (coke oven gas, blast furnace gas etc.) were included under "Solid fuels". The emissions not reported by fuel type are summed and reported under "Other fuels", as is total fuel consumption associated with these unspecified emissions. This fraction accounts for about 20% of fossil-fuel related emissions, i.e. 20% could not be allocated to a specific fuel type. In general, completeness of the CRF tables is limited by present level of detail of ER-I data storage, in particular for IPCC categories 1A1, 1A2 and 2 (see Table 3.1). These are the sectors that are for a very large part reported by individual firms of which the level of detail, completeness and quality varies considerably (see Section 6.2). For example, in cases where point sources reported different, thus inconsistent, fuel consumption figures associated with emissions of CO2, CH4 and N2O, respectively, it was decided to use the fuel data for CO2 in the CRF tables, since CO2 is be far the most important gas of the three. As a consequence, however, in these cases the implied emission factors for CH4 and N2O will show another value than could be calculated from the original reported activity data. For PFCs and SF6 presently no potential emissions (= total consumption data) are reported. This is due to the limited number of companies for which currently individual consumption figures are available and which are now used for estimating actual emissions (so-called Confidential Business Information). This replaces the use of aggregated figures from the annual KPMG report on consumption of CFCs, halons, HCFCs, HFCs, PFCs and SF6. Some of these entries are therefore labelled 'C', but please note that as a result of the CRF structure, most of the summed figures for potential emissions of PFCs and SF6 show "0.0". Table 3.1 provides a summary of the completeness of the CRF files per IPCC source category. Where 'IEF' is included, both emissions and activity data were provided in the sectoral background tables. In some cases confidentiality ('C') prohibited this. The limited completeness for the years 1991-1995/1997 is mainly due to fact the importing data into the CRF is very time consuming because great accuracy is required and it is done for the first time. It can be expected that next year again a more complete data will be provided..
(20) page 20 of 106. RIVM report 773201 005. Table 3.1. Summary of completeness of Common Reporting Format files 1990-1999.. 1) Due to limited data quality and completeness of point source data, about 20% of fossil fuel consumption is not reported as gas, oil or coal but included under 'other fuels'. 2) EM (when activity data are confidential, as in the case of PFC and SF6 use); AD (when not confidential). 3) Only for CO2 (CH4 and N2O not estimated). Abbreviations: IEF = Implied Emission Factor; EM = Emissions (no IEF); NO = Not Occurring; NE = Not Estimated; IE = Included Elsewhere; C = Confidential Business Information (only emissions)..
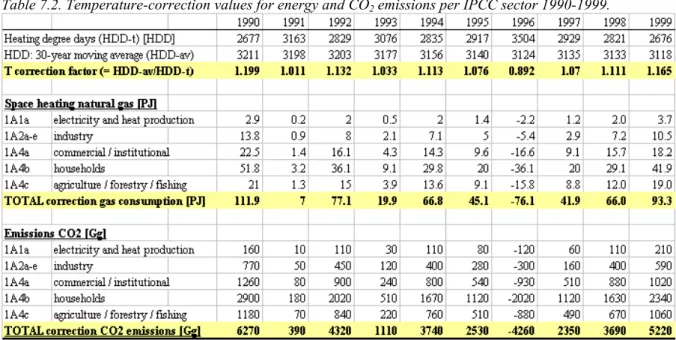
(21) RIVM report 773201 005. 4.. page 21 of 106. Methodology and data sources. The general methodology for calculating emissions to air and water in the Netherlands' Emission Registration is described in Van der Most et al. (1998) [in Dutch]. The methodology for calculating emissions of greenhouse gases is described in more detail in Spakman et al. (1997) [in Dutch]. For methane and nitrous oxide these methods have been based on background documents [in English] prepared by Van Amstel et al. (1993) and Kroeze (1994). Other documents in English providing descriptions of emission calculation methodology are the proceedings of workshops on greenhouse gas emissions and sinks in the Netherlands held in 1999 (Van Amstel et al., 2000a,b). Below we will summarise some specific features of the Netherlands country-specific methodology, whereas Table 4.2 shows the CRF summary 3 table for the methods and emission factors used. Carbon dioxide Carbon dioxide emissions are mainly caused by the combustion of fuel and are calculated on the basis of detailed energy statistics and carbon content of the energy carriers. However, emissions from public electricity production, refineries, large industries and waste incineration are for about 75% directly reported by the individual companies (see Figure 4.1). This part of the PER is called 'ER-I'. For these sectors, the remainder of the emissions is calculated on the basis of calculated remaining fuel consumption (difference of national energy statistics for the sector and energy consumption reported by these large companies) and standard emission factors. CO2 EMISSIONS IN THE NETHERLANDS BY SOURCE AND FUEL 90-95 IPCC Sector 1A5 Statistical diff. 1. RESIDENTIAL. 1A4 Small combustion. 19. COMM.. (gas). 9. AGRICULT. 7. (6 gas). 35. (gas). (3 oil). 1A3 Transport. TRANSPORT. 30. Road 25. (oil). 30 INDUSTRY 1A2 Industry. ERI Fuel. 43. 43. 17. (8 coal, 9 oil). 1A1a Electr. prod.. Non-road 5. ERI Feedstock 10. non-ERI 16. (7 oil, 3 gas). (gas). POWER GENERATION 41. 41. ERI. 1A1c Refineries. non-ERI 8. (26 coal). REFINERIES 10 (all ERI). (7 gas). (gas). (7 oil, 3 gas). 10 = gas = oil = coal = ER-I (individually reporting firms). (compiled by RIVM/Olivier). Figure 4.1. Schematic overview of CO2 emissions from fuel combustion (Tg) (IPCC category 1A), showing the relative shares of sub-sectors as well as main fuel types and the total contribution of individually reporting firms (ER-I). Data are representative for the period 1990 to 1995 (source: Van Amstel et al., 2000a).. In addition, per economic sub-sector the total CO2 emissions reported by these individual companies are compared with the amount calculated with the standard Netherlands’ emission factors.
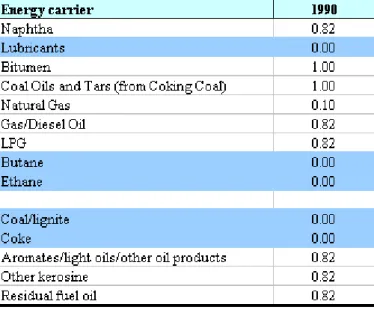
(22) page 22 of 106. RIVM report 773201 005. for CO2. If the difference is more than 5%, then these large deviations are corrected to a maximum deviation of 5% via modification of the remaining energy consumption used for additional estimate of CO2 emissions for non-ER-I-reporting firms within the Target Group. This procedure is followed because in those cases it is implicitly assumed that the submitted fuel consumption data are incorrect and because the PER is not allowed to revise individually reported emissions figures. This ensures that total CO2 emissions per industrial sub-sector cannot be off from the reference calculation by more than 5% (in practice, the group total may show much less deviation). For national policy purposes, emissions from road transport are in general calculated from transport statistics on vehicle-km. The means that for road transport CO2 emissions are first calculated in the national approach from energy consumption derived from transport statistics in terms of vehicle-km and assumptions for fuel efficiency per vehicle-km travelled. However, the Revised IPCC Guidelines ask countries to report greenhouse gas emissions from combustion on the basis of fuel consumption within the national territory. Therefore, a correction is made to convert emissions related to vehicle-km to emissions related to statistics for fuel sales. Thus, next, to meet the IPCC definition for emissions from this source category, the amounts of fuel consumption in the national approach are scaled, per fuel type, to match the statistics for fuel supply to fuelling stations included in the national energy balance. For more details on the actual differences between these two approaches see Section 7.1.4. (Emissions of all other compounds, including ozone precursors and SO2, which are more directly involved in air quality, are therefore calculated using traffic activity data.). Carbon storage in products like plastics and bitumen is estimated from an analysis of petrochemical products, half products and feedstock use (energy carriers) by Gielen (1996). The CO2 emissions reported under combustion by the manufacturing industries include a substantial amount of CO2 associated with non-stored carbon in non-energy applications of gas, oil products and cokes (of the order of 10 Mton of a total of around 43 Mton). Some 18 Mton is calculated as stored (i.e. not emitted) carbon, with a fixed storage fraction per energy carrier used for non-energy purposes (Table 4.1). In addition, carbon dioxide emissions are calculated for fossil-fuel related carbon (e.g. plastics) in incinerated waste. The accounts for about 1 Mton of CO2, annually. Table 4.1. Carbon storage fractions for energy carriers used as chemical feedstock (constant for all years).. Source: Gielen (1996). Note: The fraction used for all oil products is the weighted average of fractions determined for individual oil products (Spakman et al., 1997).. Fossil-based CO2 emissions from waste incineration is calculated from the total amount of waste that is incinerated, split into 8 waste types, each with a specific carbon content and fraction of fossil.
(23) RIVM report 773201 005. page 23 of 106. C in total C, based on an analysis of (Jager and Blok, 1993). In recent years this amounted about 2 Mton). The energy statistics show a small, but growing, difference between the apparent national energy consumption (indigenous production + import - export - bunkers ± stock change) and the bottom-up sum of all sectoral energy use. The fuel use related to statistical differences (in the Netherlands typically less than 1%, except for recent years) is included as a source of CO2, since it is assumed that the associated fuel use is real and not accounted for in individual enduse sectors. The statistical difference between supply and demand is usually smaller than 2%. Per energy carrier, however, the difference may vary both in sign and size, as is shown in Table 7.9. This approach had to be abandoned in 1999, since it was decided by the Central Bureau of Statistics to revise for the 1999 national energy balance the method for establishing the statistical difference. The statistics difference was eliminated through incorporation of (formerly remaining) differences into other parts of the energy balance: for coal by adjustment of exports; for gas by adjusting distribution losses; and for oil products by adjustments of industrial energy use (partly domestic; mainly for non-energetic purposes). Since the energy balances for previous years have not been revised, it is currently not possible to provide a consistent time series for this 'category' for the whole period 1990-1999. For the next update of the national energy balance a revision is planned of the statistical differences in the energy statistics for the years 1990 and 1995-1998. This will then also allow a recalculation of the CO2 related to statistical differences in the greenhouse gas emission inventory. Finally, for domestic environmental policy purposes a temperature correction of fuel use for space heating is applied, but only to CO2 emissions from natural gas consumption. The restriction to natural gas is because this is by far the dominant fuel type for space heating (see Figure 4.1). A description of this method is given in Appendix A. Methane Methane from combustion is estimated using the energy statistics and emission factors from the Annual Emissions and Waste Report, with figures provided by the Emission Registration system. Methane emissions from oil and gas are estimated for onshore and offshore sites separately. Methane from agriculture is estimated on the basis of emission factors developed in the methane background document by Van Amstel et al. (1993), and agricultural statistics for animal numbers and manure production from the Netherlands' Central Bureau for Statistics (CBS). For dairy and non-dairy cattle the emission factors for enteric fermentation are based on an IPCC Tier 2 analysis made for the Netherlands cattle in 1990. For subsequent years, these emission factors are used, however, specific factors are applied to 4 and 3 sub-categories within dairy and non-dairy cattle, respectively. Methane emissions from landfills are estimated with a database on landfills maintained at RIVM and a time dependent first order decay function. Methane emissions from agricultural soils are regarded as 'natural' (non-anthropogenic) and are estimated on the basis of the methane background document. They are reported as anthropogenic emissions under IPCC category 7. Road traffic emissions of CH4 are calculated and reported according to the Revised IPCC Guidelines (i.e. initially based on vehiclekm, then calibrated to fuel supply statistics); for more details we refer to the description provided for CO2. Furthermore, 'natural emissions' are methane emissions from wetlands and water. Nitrous oxide The nitrous oxide emissions estimate is based on the methods described in the nitrous oxide background document by Kroeze (1994). The calculation of animal manure production and waste management systems is described in Van der Hoek et al. (1997). Emissions from the production of chemicals include N2O from nitric acid, acrylonitril and caprolactam production as included in the Netherlands' Emission Registration system (Spakman et al., 1997). Road traffic emissions of N2O are calculated and reported according to the Revised IPCC Guidelines (i.e. initially based on vehicle-km, then calibrated to fuel supply statistics); for more details we refer to the description provided for CO2. For more details on the emission factors we refer to Section 7.3.1..
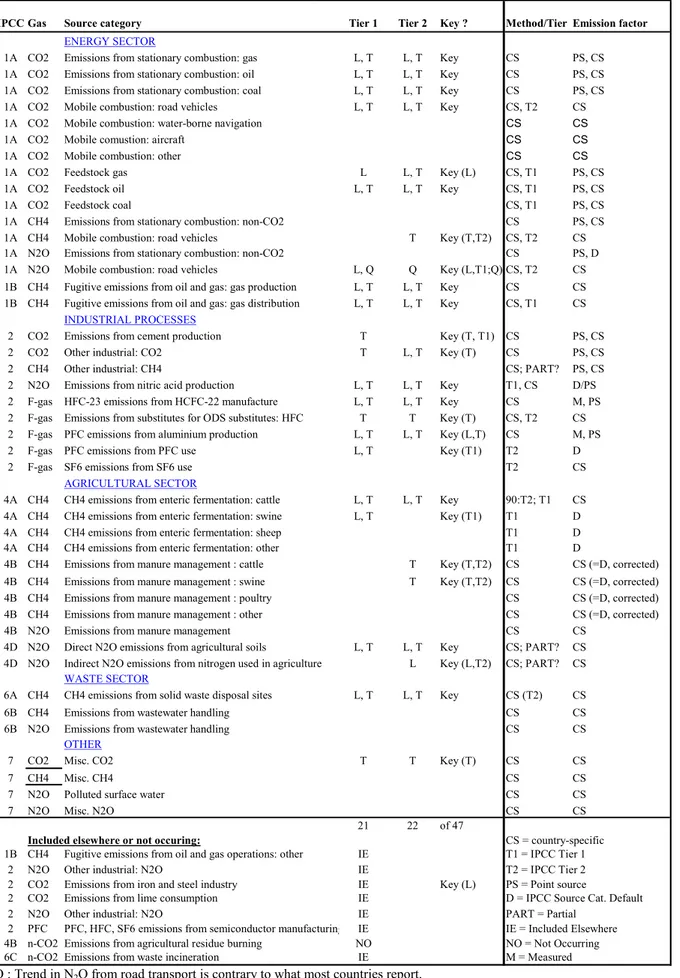
(24) page 24 of 106. RIVM report 773201 005. HFCs, PFCs and SF6 Emissions from HFC consumption are calculated using Tier 2 methodologies described by Matthijsen and Kroeze (1996). HFC and PFC emissions from HCFC-22 production and primary aluminium production, respectively, are based on measured data reported by producing companies. As of this year, emissions of SF6 are now based on estimates of SF6 consumption for the existing stock of Gas Insulated Switchgear (GIS) equipment, addition of new GIS equipment and manufacturing of GIS equipment (instead of an extrapolation of a very old estimate of national total SF6 consumption), and for semiconductor manufacture. Data sources The following primary data sources are used for the activity data used in the emission calculations: • energy data: (a) annual inventory reports by individual firms; (b) national energy statistics from CBS (National Energy Statistics; Energy Monitor); (c) biofuel consumption data from consumers based on annual survey of fuel use in residential fireplaces by the Stove and Stack Association (in Dutch: Vereniging van Haard en Rookkanaal) • transport statistics: monthly statistics for traffic and transportation from CBS • industrial production statistics: (a) annual inventory reports by individual firms; (b) national statistics from CBS • consumption of HFCs, PFCs and SF6: annual reports by accountant firm KPMG (only HFC data are used due to inconsistency for PFCs and SF6 with emissions reported otherwise (e.g. by individual firms) • animal numbers: agricultural database from CBS/LEI-DLO with data from the agricultural annual census • manure production and handling: national statistics from CBS/LEI-DLO • fertiliser statistics: agricultural statistics from LEI-DLO • forest and wood statistics: Foundation for Forests and Wood • waste production and handling: Working Group on Waste Registration (WAR).. Table 4.2. Summary table with methods and emission factors applied. GREENHOUSE GAS SOURCE AND SINK CATEGORIES 1. Energy A. Fuel Combustion 1. Energy Industries 2. Manufacturing Industries and Construction 3. Transport 4. Other Sectors 5. Other B. Fugitive Emissions from Fuels 1. Solid Fuels 2. Oil and Natural Gas 2. Industrial Processes A. Mineral Products B. Chemical Industry C. Metal Production D. Other Production E. Production of Halocarbons and SF6 F. Consumption of Halocarbons and SF6 G. Other. N2O. CH4. CO2 Method (1) applied. Emission (2) factor. Method (1) applied. Emission (2) factor. Method (1) applied. Emission (2) factor. CS CS CS CS CS. PS, CS PS, CS CS CS CS. CS CS CS CS CS. PS, CS PS, CS CS CS CS. CS CS CS CS NE. PS, D PS, D CS D. IE CS. CS. IE CS. CS. IE CS. CS CS CS NO. PS, CS PS, CS PS, CS. CS CS NE. PS, CS PS, CS. NO T1/CS NO. CS. PS, CS. CS. PS, CS. NO. CS. D/PS.
(25) RIVM report 773201 005. page 25 of 106. Table 4.2 Summary table on methods and emission factors applied (continued). GREENHOUSE GAS SOURCE AND SINK CATEGORIES 3. Solvent and Other Product Use 4. Agriculture A. Enteric Fermentation B. Manure Management C. Rice Cultivation D. Agricultural Soils E. Prescribed Burning of Savannas F. Field Burning of Agricultural Residues G. Other 5. Land-Use Change and Forestry A. Changes in Forest and Other Woody Biomass Stocks B. Forest and Grassland Conversion C. Abandonment of Managed Lands D. CO2 Emissions and Removals from Soil E. Other 6. Waste A. Solid Waste Disposal on Land B. Wastewater Handling C. Waste Incineration D. Other 7. Other (please specify) Solvents/polluted surface water. GREENHOUSE GAS SOURCE AND SINK CATEGORIES 2. Industrial Processes A. Mineral Products B. Chemical Industry C. Metal Production D. Other Production E. Production of Halocarbons and SF6 F. Consumption of Halocarbons and SF6 G. Other. CO2 Emission factor (2). CS. CS. Method applied (1). NO. to specify the emission factor used: D (IPCC default) C (CORINAIR) CS (Country Specific) PS (Plant Specific) M (Model).. CS. Emission factor (2). CS. CS. CS. CS. CS NO NO NO. CS. CS. NE. NE. NO. NO. M, CS CS NO (IE) CS CS. NA. CS CS. HFCs. CS. CS NO (IE) CS. CS. CS. CS. CS. PFCs Emission (2) factor. Method (1) applied. Emission (2) factor. Method (1) applied. CS. PS. NO CS. PS. NO NO. CS CS/T2 NO. PS CS. NO T2 NO. CS. SF6. Method (1) applied. Explanation of notation keys used: • to specify the method applied: D (IPCC default) RA (Reference Approach) T1 (IPCC Tier 1) T1a, T1b, T1c (IPCC Tier 1a, Tier 1b and Tier 1c, respectively) T2 (IPCC Tier 2) T3 (IPCC Tier 3) C (CORINAIR) CS (Country Specific) M (Model) •. cattle: CS; rest: D CS (=D,corrected). Method applied (1). CS. NE NO (IE) CS. Emission factor (2). cattle 90: T2; rest: T1 CS NO IE NO NO NO. NE. T1 NE NE NE NO. N2O. CH4. Method applied (1). D. NO T2 NO. Emission factor (2). CS.
(26) page 26 of 106. RIVM report 773201 005.
(27) RIVM report 773201 005. 5.. page 27 of 106. Uncertainty and Assessment of Key Sources. The newly developed IPCC Tier 1 methodology for estimating uncertainty in annual emissions and in trends has recently been applied to the more detailed IPCC list of possible key sources (IPCC, 2000). This was done to get a more detailed first order estimate of the uncertainty in the annual emissions as well as in the trend. Secondly, these uncertainties could be used for a first Tier 2 analysis to identify 'key sources' as defined in the IPCC Good Practice Guidance report (IPCC, 2000). However, since key source identification can be done using many more criteria, and will be important for meeting the National System requirements, the information presented in this Chapter should be only be considered as a first step in this process.. 5.1. Uncertainty assessment (IPCC Tier 1) For estimating the uncertainty in activity data and emission factors, the following information sources were used: • At a national workshop in 1999 estimates used for reporting uncertainty in greenhouse gases emissions in the Netherlands were discussed (Van Amstel et al., 2000a); • Default uncertainty estimates provided in the IPCC Good Practice Guidance report (IPCC, 2000); • RIVM factsheets on calculation methodology and data uncertainty; • Any other recent information on the data quality. These were supplemented with expert judgement of RIVM emission experts. Next, emissions in 1990 and 1999 were split according to the IPCC Tier 1 methodology for estimating uncertainty in both annual emissions as well as in the emission trend was applied to the emissions for the Netherlands.. Data used For estimating total uncertainty in both annual emissions and in emission trends we applied the IPCC Tier 1 uncertainty approach at the level of the IPCC list of possible key sources. The emissions data for 1990 and 1999 were taken from the preliminary submission to the EU and allocated to the IPCC source category list, i.e. when these emissions could be separated for these source categories. However, the IPCC list was slightly adjusted. In view of the importance for the Netherlands of CO2 from feedstocks and the relatively high uncertainty in these emissions, we separated CO2 from nonenergy use from CO2 from fuel combustion. All uncertainty figures are to be interpreted as corresponding with an confidence interval of 2 standard deviations (2σ) or 95%. In cases where asymmetric uncertainty ranges were assumed, the largest percentage was used in the calculation. Results The results of the uncertainty calculation according to the IPCC Tier 1 uncertainty approach is summarised in Table 5.1. The Tier 1 calculation of annual uncertainty in CO2-eq. emissions results in 2%, 15%, 35% and 22% for CO2, CH4, N2O and F-gases, respectively, and in overall uncertainty of 4%. However, these figures do not include the correlation that exists between source categories (e.g. energy amounts for feedstocks and for fuel combustion, cattle numbers for enteric fermentation and for animal manure production) nor include correction of not-reported sources (notably for SF6). Therefore, the actual uncertainty of total annual emissions per compound and of the total will be somewhat higher, and is currently estimated by RIVM at: CO2 CH4 N 2O. ±3% ±25% ±50%. HFCs PFCs SF6. ±50% ±50% -10; +100%.
Afbeelding


+7
GERELATEERDE DOCUMENTEN
Vanwege de verschillende bijdragen van consumptiecategorieën aan de voetafdruk zal een halvering van de effecten op de voetafdrukken en biodiversiteit dan ook via verschillende
Om binnen zijn structurele en strategische taken een zinvolle bijdrage te kunnen leveren voor een evaluatie van ecologische, economische, ruimtelijke en sociale aspecten in de
Het Leerorkest is er voor de muziek, en de muziekvooruitgang wordt niet beoordeeld en doorgegeven wanneer kinderen naar andere klassen gaan?. Met andere woorden: aandacht voor
Als artsen en patiënten in de toekomst meer taken delegeren aan expertsystemen, en er meer ‘automatisch’ op vertrouwen, moeten de ontwikkelaars van expertsystemen dan niet ten
[r]
Het leven in de Caymantrog zou een link moeten vormen tussen het diepzeeleven van de Atlantische en de Grote Oceaan, maar misschien treffen de onderzoekers wel iets heel nieuws
Je kunt een beschrijving geven van de verschillende landschapszones (tropische, subtropische, gematigde, boreale, polaire en aride zone), waarbij je ingaat op het aanwezige
Omdat er geen nieuwe reductiemaatregelen bekend zijn, zijn bij zowel de productie van Caprolactam als van Acrylonitril de emissies voor de toekomstige jaren tot en met 2030
