DECARBONISATION OPTIONS
FOR THE DUTCH
POLYCARBONATE INDUSTRY
D. Mooij, M.A. Muller
15 March 2021
Decarbonisation options for the Dutch polycarbonate industry © PBL Netherlands Environmental Assessment Agency; © TNO The Hague, 2021
PBL publication number: 4580
TNO project no. 060.47868 / TNO 2021 P10228
Authors
D. Mooij and M.A. Muller
Acknowledgements
The authors are grateful to Isja Dominicus (SABIC Innovative Plastics Bergen op Zoom), Hans Eerens (PBL) and Hans Meerman (RUG/TNO) for valuable information and feedback.
MIDDEN project coordination and responsibility
The MIDDEN project (Manufacturing Industry Decarbonisation Data Exchange Network) was initiated and is also coordinated and funded by PBL and TNO Energy Transition Studies. The project aims to support industry, policymakers, analysts, and the energy sector in their common efforts to achieve deep decarbonisation. Correspondence regarding the project may be addressed to: D. van Dam (PBL), Dick.vanDam@pbl.nl or S. Gamboa Palacios (TNO), silvana.gamboapalacios@tno.nl.
This publication is a joint publication by PBL and TNO EnergieTransitie and can be
downloaded from: www.pbl.nl/en. Parts of this publication may be reproduced, providing the source is stated, in the form: Mooij, D. and Muller, M. (2021), Decarbonisation options for the Dutch polycarbonate industry. PBL Netherlands Environmental Assessment Agency and TNO EnergieTransitie, The Hague.
PBL Netherlands Environmental Assessment Agency is the national institute for strategic policy analysis in the fields of the environment, nature and spatial planning. PBL contributes to improving the quality of political and administrative decision-making by conducting outlook studies, analyses and evaluations in which an integrated approach is considered paramount. Policy relevance is the prime concern in all of PBL’s studies. PBL conducts solicited and unsolicited research that is both independent and scientifically sound.
TNO EnergieTransitie has a twofold mission: to accelerate the energy transition and to strengthen the competitive position of the Netherlands. TNO conducts independent and internationally leading research and we stand for an agenda-setting, initiating and supporting role for government, industry and NGOs.
This report was reviewed by SABIC Innovative Plastics Bergen op Zoom. PBL and TNO remain responsible for the content. The decarbonisation options and parameters are explicitly not verified by the companies.
Contents
Summary 4
INTRODUCTION
5
1
POLYCARBONATE MANUFACTURING IN THE NETHERLANDS
6
1.1 Saudi Basic Industries Corporation 6
1.2 SABIC Innovative Plastics Bergen op Zoom 7
2
PRODUCTION PROCESSES
12
2.1 Overview 12
2.2 Polycarbonate production 12
2.3 Compounding/extrusion plants 22
2.4 Material and Energy Flow Analysis 24
3
PRODUCTS AND APPLICATION
26
3.1 Lexan polycarbonate 26
3.2 Other engineering thermoplastics 28
4
OPTIONS FOR DECARBONISATION
29
4.1 Fuel substitution 29
4.2 Feedstock substitution 36
4.3 Process design 38
4.4 Recycling 39
4.5 Product design 40
4.6 Use of residual energy 41
4.7 CO2 capture and storage or re-use 41
5
DISCUSSION
43
6
REFERENCES
45
FINDINGS
Summary
In the Netherlands polycarbonate is produced by SABIC Innovative Plastics Bergen op Zoom (SABIC IP BoZ). SABIC IP BoZ sells polycarbonate in a pure powder form (PC Resin) and in compounded form under the name Lexan. Polymer blends, containing polycarbonate but also other polymers, are also produced at the site and are used for a wide variety of applications and end-products. The Netherlands produces about 20% of the total European polycarbonate production, generating about 490 million euro of value added yearly. The polycarbonate consumption is dominated by four main sectors: Building and Construction, Electrical & Electronics industries, Optical Media and Automotive.
Polycarbonate production starts with the synthesis of the building blocks that make up the polymer structure: phosgene and bisphenol A (BPA). Chlorine, required for phosgene production is also produced on-site by electrolysis of sodium chloride. Electrolysis is an energy-intensive process. In the production of bisphenol A and polycarbonate powder a number of steam intensive separation and purification steps are required to make sure the produced polycarbonate powder is of high purity. Part of the polycarbonate powder is sold as PC Resin and another part is processed further in the compounding plants to Lexan or polycarbonate containing polymer blends. In the compounding plants, the polymer powders are mixed with other polymers, additives and pigments to tune the final properties and moulded to their final form. The compounding plants mainly use electricity. To produce one tonne of compounded polycarbonate about 18 GJ of energy is required, resulting in 1.1 tonne of CO2 emissions. For the total production of 239 thousand tonnes (kt) polycarbonate
powder, the energy requirements add up to 3.7 PJ. Additionally, 0.5 PJ of energy is needed for compounding.
According to the Dutch Emission Authority, a total of 195,074 tonnes of CO2 (direct emissions) was emitted at the site in 2019. The indirect emissions (related to imported electricity) were estimated to be 66,650 tonnes of CO2 in 2018. The greenhouse gas emissions of SABIC Innovative Plastics result from the burning of natural gas in a combined heat and power plant (CHP) for steam and electricity generation. Hence, many of the decarbonisation options identified in this work aim to decarbonise the energy supply. Fuel substitution technologies enabling the decarbonisation of SABIC’s steam supply include the use of an electrode boiler, the combustion of biomass, hydrogen combustion and geothermal energy. Prerequisites for these decarbonisation technologies include the availability of renewable electricity and sustainably sourced biomass. Technologies such as mechanical vapour recompression and zero-gap electrolysers could be employed to increase the energy efficiency of current processes and lower the total energy demand. Alternatively or in addition, the current fossil feedstocks could be replaced by bio-based feedstocks enabling emission reductions along the polycarbonate value chain. Further emission reduction can be achieved through recycling of polycarbonate products.
FULL RESULTS
Introduction
This report describes the current situation for polycarbonate production in the Netherlands and the options and preconditions for its decarbonisation. The study is part of the MIDDEN project (Manufacturing Industry Decarbonisation Data Exchange Network). The MIDDEN project aims to support industry, policymakers, analysts, and the energy sector in their common efforts to achieve deep decarbonisation. The MIDDEN project will update and elaborate further on options in the future, in close connection with the industry. The emissions addressed in the study are those falling under scope 1 (direct emissions on-site) and scope 2 (related to imported electricity).
Scope
In the Netherlands, SABIC Innovative Plastics Bergen op Zoom is the only large-scale polycarbonate producer.
Production processes include chlorine production by electrolysis, phosgene production from chlorine and carbon monoxide, bisphenol A production from acetone and phenol,
polycarbonate resin production by the interfacial polycondensation of bisphenol A and phosgene and compounding and extrusion processes; products include: polycarbonate resin, Lexan polycarbonate and polycarbonate blends Cycoloy, Xenoy and Valox.
The main options for decarbonisation aim at substituting the steam supply and include the use of biomass as fuel, electrification, hydrogen combustion and ultra-deep geothermal energy. Energy efficiency improvements are to be gained from the use of zero-gap
membrane electrolysers and mechanical vapour recompression. The use of biomass or CO2 as feedstock and recycling could also decarbonise polycarbonate production.
Reading guide
Section 1 introduces the Dutch polycarbonate industry. Section 2 describes the current situation for polycarbonate production processes in the Netherlands, and Section 3 describes the relevant products of these processes, while options for decarbonisation are
systematically quantified and evaluated in Section 4. The feasibility of and requirements for those decarbonisation options are discussed in Section 5.
1 Polycarbonate
manufacturing in the
Netherlands
The Dutch polycarbonate manufacturing industry is centered around SABIC Innovative Plastics located in Bergen op Zoom. In this chapter, a description is given of the company and its processes as well as the current and historical CO2 emissions At the production site of SABIC Bergen op Zoom, polycarbonate powders and resins are produced that can be used for a wide variety of applications and products. An overview of the products and end-users is given in chapter 3.
1.1 Saudi Basic Industries Corporation
The Saudi Basic Industries Corporation (SABIC) was founded in Saudi Arabia in 1976 by Royal decree for the production of chemicals from oil by-products. With an annual sales revenue of 33 billion euros, the company is one of the largest chemical companies in the world, employing more than 33,000 people in 50 countries. The state-owned oil concern Saudi Aramco is SABIC’s majority shareholder owning 70% of the shares. The remaining shares are controlled by institutions and private investors. SABIC’s headquarters are located in Riyadh, Saudi Arabia (SABIC, 2019a).
SABIC is active in four main business areas; petrochemicals, specialties, agri-nutrients and metals. Petrochemicals is the largest business unit, products include basic chemicals such as methanol and olefins used in various industries. The specialties unit focusses on the
development of high-performance materials designed for specific applications. Agri-nutrients produces a range of nitrogen-based fertilisers. The metal unit is controlled by Hadeed, SABIC’s iron and steel company, and is the leading steel producer in the Arabian Gulf region (SABIC, 2019a).
Manufacturing sites, sales offices and research and innovation facilities are situated all over the world and managed from regional offices in the Middle East and Africa, Asia, the
Americas and Europe. SABIC’s European headquarters are located in Sittard, the Netherlands (SABIC, 2019a). Two of SABIC’s European largest production sites are also situated in the Netherlands, in Geleen (Chemelot) and Bergen op Zoom. In Geleen (poly)olefins are produced from naphtha (SABIC Limburg, n.d.). The production of large volume organic chemicals and polyolefins in Geleen is described in detail in two MIDDEN reports: Oliveira and Van Dril (2021) and Negri and Ligthart (2021). The Bergen op Zoom site is part of the business unit Innovative Plastics that develops and produces engineering thermoplastics amongst which polycarbonate (SABIC Bergen op Zoom, n.d. (a)).
1.2 SABIC Innovative Plastics Bergen op Zoom
1.2.1 History
In 1969, GE Plastics opened a manufacturing site for the production of engineering plastics at the industrial area Theodorushaven in Bergen op Zoom. Two of GE Plastics main products are produced at the site, polycarbonate traded under the name Lexan and Noryl, a
polyphenylene-oxide/polystyrene blend (Schrama, 1998). Other resins produced at the site include Cycoloy, a polycarbonate and acrylonitrile-butadiene-styrene blend; Xenoy,
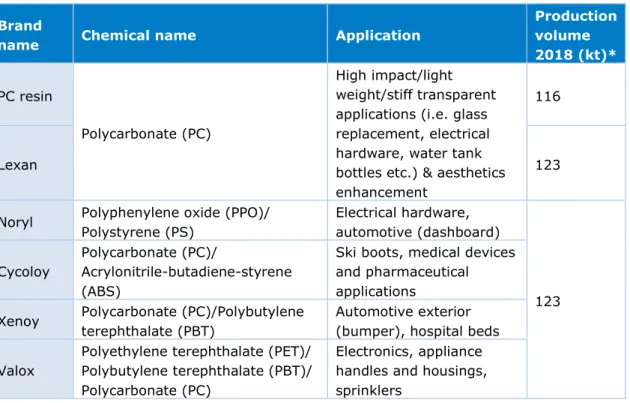
composed of polycarbonate and polybutylene terephthalate and Valox, a polyester blend (SABIC Bergen op Zoom, n.d. (b); Coe, 2000) (Table 1). In 2007, SABIC acquired the site from GE Plastics and expanded the production of the thermoplastic resins (Dijkgraaf, 2007). Currently, SABIC Innovative Plastics Bergen op Zoom (SABIC IP BoZ) employs around 1325 employees, of which 75% work in production. Besides being an important manufacturing site, the site also houses a technology research & development department, a customer services department and offices (SABIC Bergen op Zoom, n.d. (c)). Since 2012, the SABIC Bergen op Zoom site is also home to the Green Chemistry Campus, a business accelerator for scaling up bio-circular innovations (Green Chemistry Campus, n.d.)
Table 1: SABIC IP BoZ main products brand name, chemical name and applications. Brand
name Chemical name Application
Production volume 2018 (kt)* PC resin Polycarbonate (PC) High impact/light weight/stiff transparent applications (i.e. glass replacement, electrical hardware, water tank bottles etc.) & aesthetics enhancement
116
Lexan 123
Noryl Polyphenylene oxide (PPO)/ Polystyrene (PS) Electrical hardware, automotive (dashboard) 123 Cycoloy Polycarbonate (PC)/ Acrylonitrile-butadiene-styrene (ABS)
Ski boots, medical devices and pharmaceutical applications
Xenoy Polycarbonate (PC)/Polybutylene terephthalate (PBT)
Automotive exterior (bumper), hospital beds
Valox
Polyethylene terephthalate (PET)/ Polybutylene terephthalate (PBT)/ Polycarbonate (PC)
Electronics, appliance handles and housings, sprinklers
* As calculated based on the energy and material flow analysis
1.2.2 Site overview
At the SABIC IP BoZ site there are nine manufacturing plants for the production of the plastic products. Three plants are involved in the production of the raw materials for polycarbonate; the chlorine plant, the phosgene plant and the bisphenol A (BPA) plant. In the resin plant, polycarbonate powder is synthesised from the raw materials (SABIC Innovative Plastics, 2011; Van Luijk, 2003). The polyphenylene oxide (PPO) plant is part of the Noryl production line and produces polyphenylene-ether (marketed by SABIC as polyphenylene oxide) powder, the main building block for Noryl. Due to falling demand and rising raw material
prices, SABIC closed the PPO plant in 2014. As demands have increased, the plant is currently being rebuild and set to open in 2021 (Verbraeken, 2018; SABIC IP BoZ, Online Communication, 2020a). As the PPO plant is currently not operating and it is not involved in polycarbonate production, the Noryl line is excluded from this work. There are 4
compounding or extrusion plants that shape the plastic powders to their final form. Lexan finishing (LXF) and specialty film and sheet (SF&S) are involved in the Lexan/polycarbonate production line and produce resins and films and sheets. The Noryl plant blends the
polyphenylene oxide and polystyrene to make the Noryl resins. The flexible compounding plant (FCP) is involved in the production of the blended materials such as Xenoy, Cycoloy and Valox (SABIC Innovative Plastics, 2011).
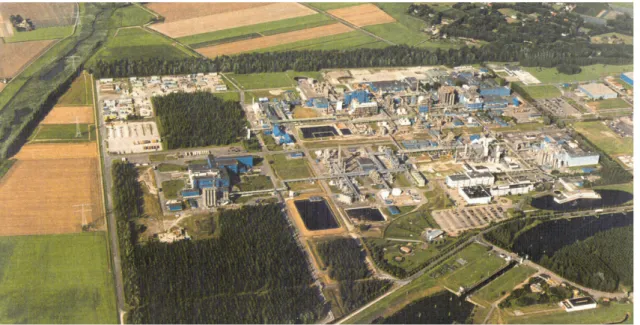
Figure 1: SABIC Innovative Plastics Bergen op Zoom production site (BlueTerra, n.d.).
SABIC IP BoZ has two cogenerators (Combined Heat and Power plant, CHP or cogen) for the combined generation of steam and electricity from natural gas (Schrama, 1998). Currently, only one of the cogenerators is in use with the other serving as back up (SABIC IP BoZ, Online communication, 2020b). The cogenerator in use has a capacity of 132 MW (European Environment Agency, 2020). It produces 80 tonnes of steam per hour on average and operates the year round (8760 h/yr) (SABIC IP BoZ, Online communication, 2020b). Additional steam is generated by burning hydrogen in a boiler (7 tonne steam/hour) and furthermore tar is incinerated in a tar boiler/incinerator producing 10 tonne steam/hour. The site also has a biological wastewater treatment plant to clean process water and a port for the import of raw materials and export of products (SABIC Bergen op Zoom, n.d. (a); Omgevingsdienst Brabant Noord, 2016). Air Liquide provides SABIC IP BoZ with carbon monoxide and steam (25 tonne/hour) produced at its Bergen op Zoom site (DWA, 2008). The industrial production site of Air Liquide is fully integrated at the SABIC IP BoZ site. Air Liquide is connected to the international pipeline between Rotterdam and Antwerp for the distribution of nitrogen, oxygen, hydrogen and carbon monoxide (Air Liquide, n.d.). SABIC IP BoZ also has a steam and electricity connection to Cargill, a starch and sweetener producing company located in the Theodorushaven. SABIC IP BoZ exports steam (10 tonne/hour) and 3 MW of electricity to Cargill (DWA, 2008). Natural gas is supplied to the site via the Zebra network. The Theodorushaven is connected to the high voltage grid (150 kV) operated by TenneT (BlueTerra, 2019).
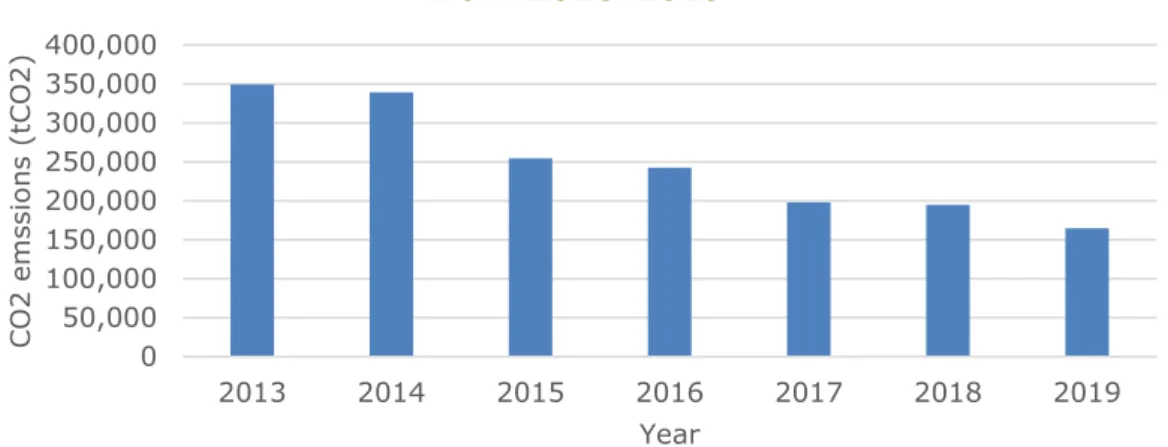
Being a large production site and part of the European Union Emission Trading Scheme (EU ETS) system, SABIC IP BoZ emits substantial amounts of carbon dioxide. Figure 2 shows the development of SABIC IP BoZ on-site CO2 emissions over the time span 2013-2019. From the figure it becomes apparent that SABIC IP BoZ has already significantly cut its scope 1 (direct) emissions, reducing its 2013 emissions by more than half in 2019 (0.35 million tonnes (Mt) CO2 in 2013 compared to 0.16 Mt CO2 in 2019). The scope 1 emission reductions are likely to have resulted from the closing of plants and a cogenerator. SABIC IP BoZ used to have two BPA plants, but shut one down due to its low efficiency. As the BPA plants are energy intensive, this had a reducing effect on SABIC IP BoZ’s energy use and hence CO2 emissions. Further emission reductions have been achieved by the shutdown of the PPO plant in 2014, with the plant restarting in 2021 the effects of this temporary closure might become apparent. Additionally, SABIC IP BoZ stopped using one of the cogeneratorsand started importing electricity, this likely had a significant reducing effect on the scope 1 emissions of SABIC IP BoZ (SABIC IP BoZ, Online communication, 2020b). As the closure of a cogenerator made it necessary to import electricity, SABIC IP BoZ’s scope 2 (indirect) emissions have increased since. According to SABIC IP BoZ, reuse of waste heat and heat generated in the incinerators has also contributed to scope 1 emission reductions (SABIC Bergen op Zoom, n.d. (d)). The lowering of emissions in 2019 as compared to 2018 results from a lower production capacity in 2019 due to a maintenance turnaround that stopped production for 2 months (SABIC IP BoZ, 2020c).
Figure 2: Direct CO2 emissions from SABIC Innovative Plastics Bergen op Zoom between 2013-2019 (NEa, 2020).
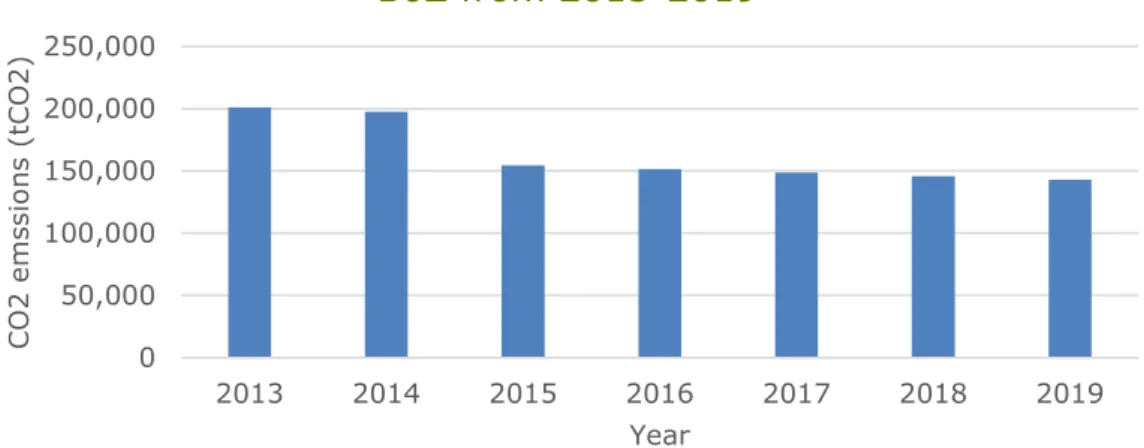
Free emissions rights (European Emission Allowances [EUA’s]) are allocated to Dutch companies that are part of the EU ETS by the Dutch Emissions Authority (Nederlandse Emissie Authoriteit [NEa]). Figure 3 shows the free emission rights allocated to SABIC IP BoZ in the time period 2013-2019. Mostly, the amount of free emission rights an EU ETS
company gets allocated is determined by product benchmarks. However, for polycarbonate such a product benchmark is lacking. Instead benchmarks for heat use are used. As shown in Table 2 SABIC IP BoZ emits more CO2 than they get allocated freely. This means SABIC IP BoZ is less efficient than the benchmark and thus has to pay for the additional emission rights they need to cover the total amount of CO2 they emit. Therefore, to cut expenses, SABIC IP BoZ has an incentive to decarbonise.
0 50,000 100,000 150,000 200,000 250,000 300,000 350,000 400,000 2013 2014 2015 2016 2017 2018 2019 C O 2 e m ssi on s (t C O 2) Year
Direct CO
2emissions of SABIC IP BoZ
from 2013-2019
Figure 3: Free allocation of emission rights to SABIC IP BoZ between 2013-2019
(NEa, 2020).
Table 2: SABIC IP BoZ registered emissions versus freely allocated emission rights.
2013 2014 2015 2016 2017 2018 2019 NEa Registered CO2
emissions (tCO2) 349,502 339,053 254,469 242,452 198,050 195,074 164,878 NEa Free allocation
of emissions rights
(tCO2) 200,952 197,462 154,482 151,639 148,766 145,865 142,928 Difference (tCO2) 148,550 141,591 99,987 90,813 49,284 49,209 21,950
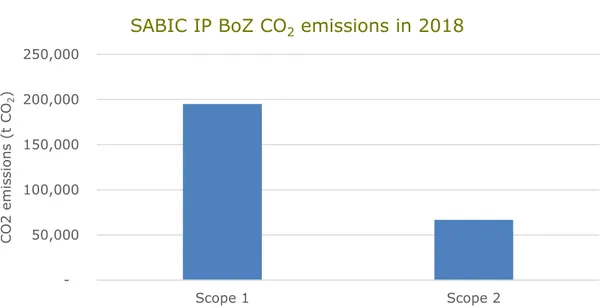
The NEa only registers on-site emissions, so is limited to the scope 1 emissions. As SABIC IP BoZ also needs to import electricity to sustain their production levels, scope 2 emissions from the use of this electricity must also be considered in this report. To estimate the scope 2 emissions, the total amount of imported electricity (0.56 PJ in 2018) is multiplied by the Dutch national electricity grid emission factor which is 0.43 kgCO2/kWh (CBS, 2020). Additionally, SABIC IP BoZ purchases steam from Air Liquide. The steam provided by Air Liquide is a waste product of the process in which CO is produced for SABIC IP BoZ. The excess heat generated in this process cannot be used by Air Liquide and is sold to SABIC IP BoZ. The heat is considered as waste heat and the CO2 emissions are allocated to products of Air Liquide and therefore not included in SABIC’s scope 2 emissions. Figure 4 shows the scope 1 and 2 emissions resulting from SABIC IP BoZ’s production processes. As the data of imported steam and electricity was only available for the year 2018, this work takes 2018 as the year of analysis.
0 50,000 100,000 150,000 200,000 250,000 2013 2014 2015 2016 2017 2018 2019 C O 2 e m ssi on s (t C O 2) Year
NEA free allocation of emission rights to SABIC IP
BoZ from 2013-2019
Figure 4: Scope 1 and 2 CO2 emissions from SABIC IP BoZ in 2018 (SABIC IP BoZ, 2020d; NEa, 2020). 50,000 100,000 150,000 200,000 250,000 Scope 1 Scope 2 C O 2 e m issi on s (t C O2 )
2 Production processes
2.1 Overview
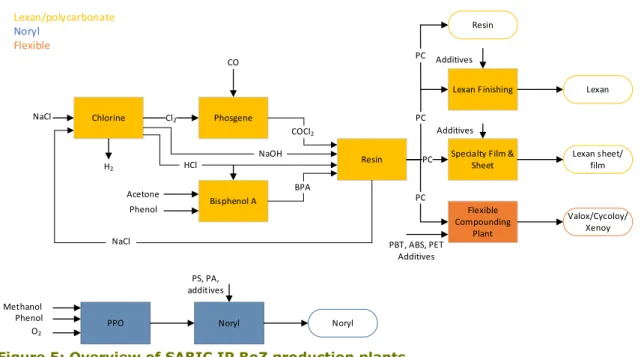
There are three main production lines of engineering plastics at SABIC IP BoZ; Lexan, Noryl and the flexible production line. Figure 5 shows an overview of the production plants. The Chlorine, Phosgene, Bisphenol A, Resin, Lexan Finishing and Specialty Film & Sheet plant are part of the Polycarbonate/Lexan production line. The Polyphenylene oxide (PPO) and Noryl plant make up the Noryl line. As this report details polycarbonate manufacturing, the Noryl line is not considered in this work. The Flexible Compounding Plant (FCP) produces various end products such as the polycarbonate blends Valox, Cycoloy and Xenoy. The production processes that occur in the plants will be elaborated on in the following.
Figure 5: Overview of SABIC IP BoZ production plants.
2.2 Polycarbonate production
2.2.1 Chlorine plant
The chlorine plant at SABIC IP BoZ has previously been included in the MIDDEN report about the Dutch chlor-alkali industry and produces about 10% of the total Dutch chlorine
production (Scherpbier & Eerens, 2021). As the plant’s energy consumption and
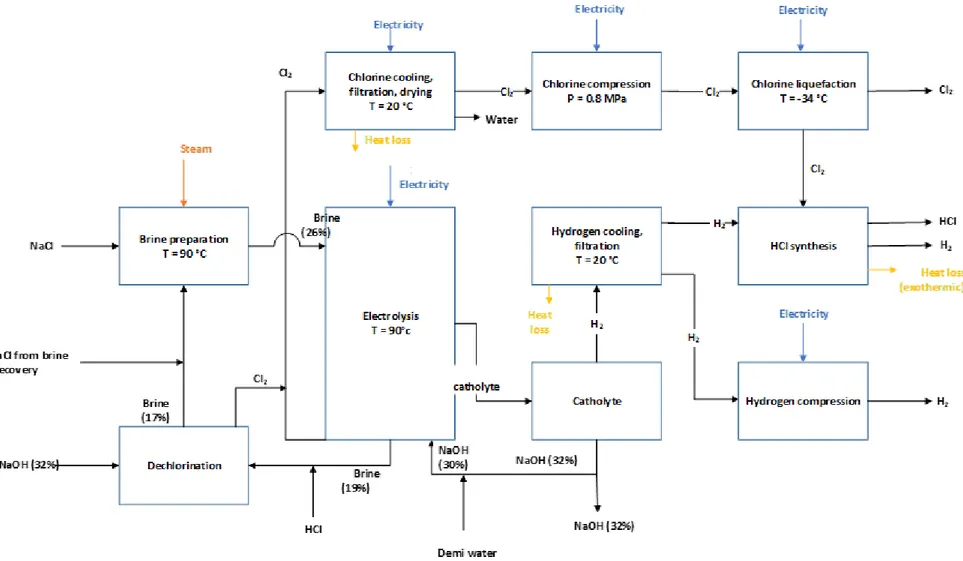
decarbonisation options have already been studied intensively in the chlor-alkali MIDDEN report, it will be reviewed only briefly here. Important adaptations by SABIC IP BoZ to the chlor-alkali process as described in the MIDDEN report about this sector include HCl synthesis and the use of recovered brine from the resin plant. The recovery of brine from another production plant reduces SABIC IP BoZ fresh salt consumption by around 40% (SABIC IP BoZ, Online Communication, 2020a). Figure 6 shows the production processes in the chlorine plant for the production of chlorine.
Chlorine
NaCl Phosgene
Bisphenol A
Resin
Lexan Finishing
Specialty Film & Sheet Additives Lexan Lexan sheet/ film Additives Flexible Compounding Plant Valox/Cycoloy/ Xenoy PBT, ABS, PET Additives PPO Noryl PS, PA, additives Noryl Lexan/polycarbonate Noryl Flexible Cl2 H2 CO COCl2 BPA NaOH Acetone Phenol PC PC PC NaCl Methanol Phenol O2 HCl Resin PC
Figure 6: Mass and energy flow chart for the production of chlorine – adapted from the MIDDEN chlor-alkali report (Scherpbier & Eerens,
Like all other Dutch chlorine manufacturing plants, the chlorine plant at Bergen op Zoom is a membrane electrolysis plant that produces chlorine (Cl2), caustic soda (NaOH), hydrogen chloride (HCl) and hydrogen (H2) from brine (NaCl in water).
The process of membrane electrolysis involves an electrolytic redox cell with a positive anode and a negative cathode separated by a membrane. At the anode, the Cl- ions from brine are oxidised to Cl2 gas. At the cathode, a solution of caustic soda in water is required to reduce the H+ ions to form H2 gas. The membrane is permeable for positive ions, resulting in the movement of the Na+ ions from the anode to the cathode side, where extra caustic soda is formed. To keep the reaction balanced, the anode side depleted brine and concentrated caustic soda are drained and replaced with new brine and caustic soda. This recovery of the dechlorinated brine requires a substantial amount of heat (Scherpbier & Eerens, 2021). This heat is provided by the waste heat from the electrolysers. Waste heat from the electrolysers is also used to heat the caustic soda. Equation 1 shows the overall process reaction equation.
2 NaCl + 2 H2O → 2 NaOH (aq) + H2 (g) + Cl2 (g) (1)
The total energy requirements for the production of 1 tonne of chlorine (l) by electrolysis are listed in Table 3. Heat loss occurs as a result of chlorine and hydrogen cooling and due to the exothermic HCl synthesis reaction.
Table 3: Energy requirements for the production of 1 tonne of chlorine.
Energy carrier Input (GJ/tonne) Source
Steam 0.90 – 1.10 (SABIC IP BoZ, 2020a)
Electricity 9.5 – 11.5 (SABIC IP BoZ, 2020a)
Heat loss 0.95 – 1.15 Calculated
2.2.2 Phosgene plant
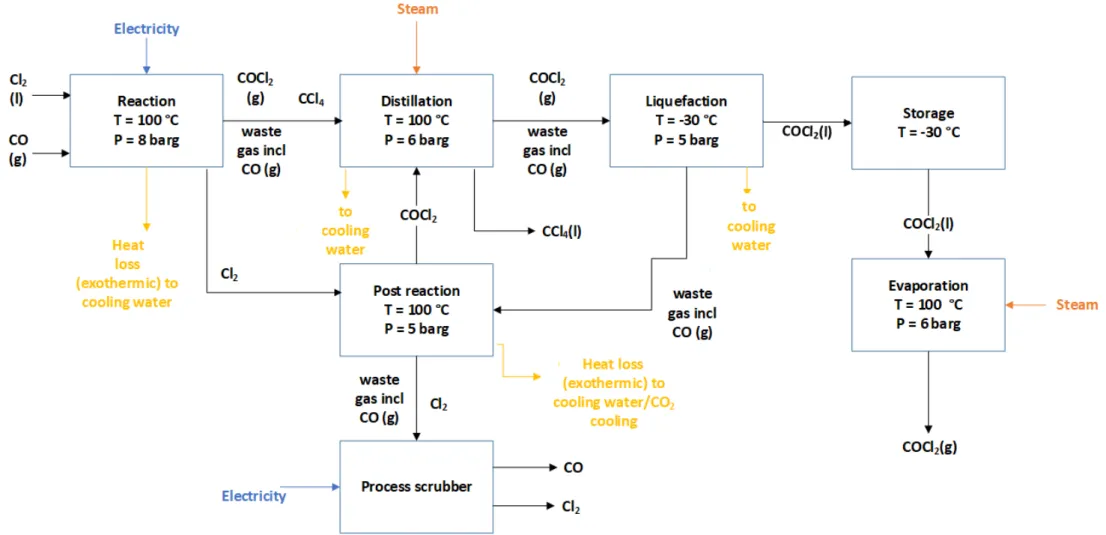
In the phosgene plant, phosgene is synthesised from chlorine and carbon monoxide (CO). The chlorine produced in the chlorine plant is introduced into the phosgene plant where it is combined with carbon monoxide to yield phosgene. The carbon monoxide required for the reaction is produced by Air Liquide. As phosgene gas is highly toxic and storage risky, all phosgene produced is used to synthesise polycarbonate (Mehta, 2020). Figure 7 shows a flowchart of processes occurring in the phosgene plant. Table 4 lists the energy requirements as calculated.
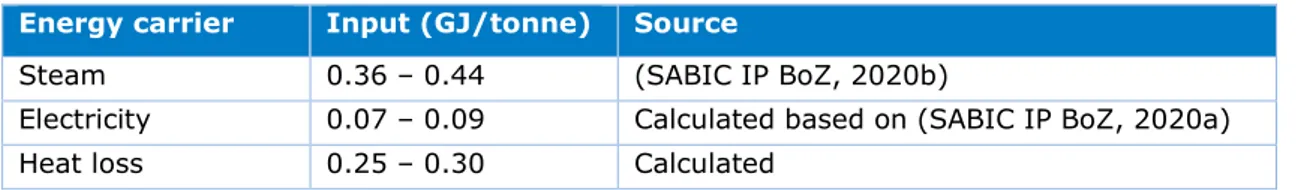
Table 4: Energy requirements for the production of 1 tonne of phosgene.
Energy carrier Input (GJ/tonne) Source
Steam 0.36 – 0.44 (SABIC IP BoZ, 2020b)
Electricity 0.07 – 0.09 Calculated based on (SABIC IP BoZ, 2020a)
Figure 7: Mass and energy flow chart for the production of phosgene. For confidential reasons, the mass and energy numbers are not presented in this flow chart.
Reaction
Chlorine is reacted with gaseous carbon monoxide over an activated carbon catalyst to form phosgene (equation 2) (Ryan, Ryan, Seddon, & Seddon, 1996). To ensure that all the chlorine reacts, a slight excess of carbon monoxide is used. To avoid the decomposition of phosgene in water and impurities, the chlorine and carbon monoxide must be of the highest purity possible (Mark, 2004). The reaction is performed in a multitubular reactor of which the tubes are filled with the activated carbon catalyst. With a reaction enthalpy of -108 kJ/mol, the reaction is exothermic (heat is generated in the process). Consequently, the reactor needs to be cooled using a cooling system. The temperature of the reactor needs to be controlled accurately as at temperatures above 250 °C phosgene decomposes into the reactants, carbon dioxide and tetrachloromethane (CCl4). Depending on the purity of the raw materials, by-products including HCl, CCl4 and H2O might be formed (American Chemistry Council, 2018). The heat generated during the reaction is also used to evaporate chlorine from the liquid to the gas phase.
Cl2 (g) + CO (g) → COCl2 (g); ΔHr = -108 kJ/mol (2)
Distillation
After the phosgene has been formed in the reactor, the next step is distillation to remove the by-product tetrachloromethane. The formation and removal of tetrachloromethane needs to be monitored carefully as tetrachloromethane influences the polycarbonate colour. High concentrations of tetrachloromethane can cause the material to turn yellowish, limiting its application for optical purposes. Additionally, tetrachloromethane has significant ozone depletion and global warming potential (Cotarca & Eckert, 2003).
Liquefaction
After distillation, the phosgene is compressed and condensed with an ammonia cooling system and cooling water for storage. Waste gas containing the by-product carbon monoxide is led into the post reactor.
Post reaction
In the post reaction step, unreacted chlorine from the reaction step and waste gas containing carbon monoxide from the liquefaction step are reacted to form additional phosgene that is led to the distillation step. The post reactor is cooled using a CO2 cooling system as well as cooling water. Waste gas and unreacted carbon monoxide from the post reactor are scrubbed using a caustic scrubber and released to the atmosphere.
Evaporation
As the phosgene needs to be in the gas phase in order to react with BPA to form
polycarbonate, the liquid phosgene from the storage tanks is evaporated to its gaseous form.
2.2.3 Bisphenol A plant
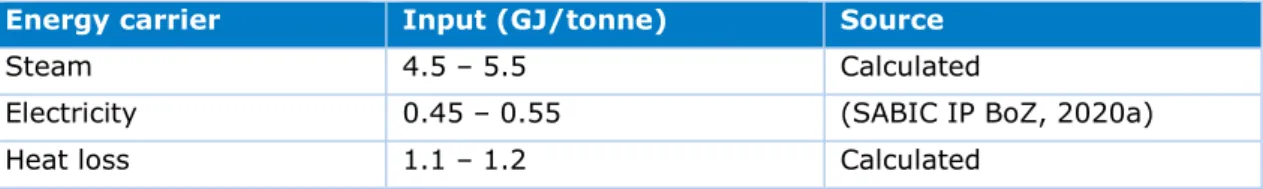
Another raw material required for the synthesis of polycarbonate is bisphenol A (BPA), produced in the BPA plant. Figure 8 shows the flowchart of BPA production and Table 5 lists the total energy requirements per carrier.
Table 5: Energy requirements for the production of 1 tonne of BPA.
Energy carrier Input (GJ/tonne) Source
Steam 4.5 – 5.5 Calculated
Electricity 0.45 – 0.55 (SABIC IP BoZ, 2020a)
Figure 8: Mass and energy flow chart for the production of BPA. For confidential reasons, the mass and energy numbers are not presented in this flow chart.
Formulation
In the formulation step acetone and fresh as well as recycled phenol are mixed in the required proportions to facilitate the BPA forming reaction. SABIC IP BoZ imports the raw materials acetone and phenol.
Reaction
BPA is produced by a condensation reaction of acetone with phenol. The reaction is catalysed by a strong acid such as hydrogen chloride (HCl), sulfuric acid (H2SO4) or sulfonated
polystyrene resin (PlasticsEurope, 2019a). Figure 9 shows the reaction equation. The
reaction is slightly exothermic. Though the reaction only requires 2 moles of phenol for every mole of acetone, a large excess of phenol (6:1 to 15:1) is used in industry to achieve full condensation (PlasticsEurope, 2019a). In the material and energy flow analysis an excess phenol to acetone of 10:1 is assumed. The reaction is performed in a fixed bed reactor over which the reaction mixture is passed (Ullman, 2007).
Figure 9: BPA synthesis from acetone and phenol (Vautherin & Lopes Cardoso, 2019).
Crystallisation
The product of the reaction is a phenol solution of BPA, by-products such as BPA isomers, the water formed by the reaction and unreacted acetone. As the purity of the BPA influences the colour of the polycarbonate, it is important that the BPA is of high purity. Hence, the following steps are aimed to isolate and purify the BPA. The reaction mixture is cooled to 40 °C by the addition of 2-20 wt% water (11 wt% assumed in calculations), leading to the crystallization of the 1:1 BPA-phenol adduct (Neagu, 1998; Brunelle & Korn, 2005).
Filtration
The solid BPA-adduct is isolated by filtration. The solid cake is washed with fresh and recycled phenol (Czub, n.d.). The filtrate is treated to remove by-products and recover phenol.
Dehydration
The filtrate continues to the dehydration step. Water is removed and part of the dewatered mother liquor containing phenol and some by-products (isomers) is recycled back into the formulation step to be reused in the reactor where the isomers revert to the desired BPA. The removed water with some dissolved phenol passes to the phenol water separation step in which further phenol is recovered by distillation under low pressure. The water is further treated in the biological wastewater treatment plant. The remaining part of the dewatered phenol solution that contains the isomers of BPA continues to phenol recovery.
Phenol recovery
In the phenol recovery step, phenol is recovered by cracking of the solution of phenol and BPA by-products obtained in the dehydration step. The by-products are incinerated in the TAR boiler to generate steam.
Melting
The cake that remains after the filtration step contains the BPA-phenol adduct. To break the adduct, heat is applied in the melting step. Melting proceeds at temperatures of 130 °C and pressures between 0.01 and 0.1 bar (Brunelle & Korn, 2005; Neagu, 1998).
Phenol desorption
The BPA is steam stripped from phenol in a desorption column at 200 °C at near vacuum (0.001 bar) (Neagu, 1998). The desorbed phenol is recycled to the filtration step.
Flaking
Lastly, the BPA is cooled and mechanically flaked.
2.2.4 Resin plant
In the resin plant the previously produced phosgene and BPA are reacted to form polycarbonate. The synthesis of polycarbonate at SABIC IP BoZ is a continuous process (Mehta, 2020). Figure 11 shows a flow chart for the production of polycarbonate powder, Table 6 lists the energy requirements per carrier.
Table 6: Energy requirements for the production of 1 tonne of polycarbonate powder.
Energy carrier Input (GJ/tonne) Source
Steam 5.45 – 6.65 (SABIC IP BoZ, 2020a)
Electricity 0.33 – 0.40 Calculated based on (SABIC IP BoZ, 2020a)
Heat loss 1.25 – 1.40 Calculated
At SABIC IP BoZ the interfacial polycondensation process is used. In this process BPA and phosgene are reacted at 20–40 °C in a two-phase system consisting of an aqueous, alkaline phase and an immiscible organic phase (PlasticsEurope, 2019b). As suggested by the name, the reaction occurs at the interface between the two phases (Ullman, 2016). Essentially, the reaction is a step-growth polymerization in which chlorine ions are eliminated. Figure 10 shows the reaction equation.
Figure 11: Mass and energy flow chart for the production of polycarbonate powder. For confidential reasons, the mass and energy numbers are not presented in this flow chart.
Formulation
In the first step, the required amounts of BPA, dichloromethane and water are mixed. Dichloromethane and water are mixed in a ratio of 5:1 (SABIC IP BoZ, 2020a). The catalyst, often a tertiary aliphatic amine, is added in a small amount (0.1-3 wt%) (Mark, 2004).
Reaction
In the reaction step, the BPA and NaOH form the BPA sodium salt (equation 3). NaOH also serves to maintain the reaction pH of 10-12. The BPA sodium salt is reacted with the
phosgene at the interface of the two phases to produce polycarbonate and NaCl (equation 4). To complete the reaction 15 mol% excess phosgene is used. Unused phosgene hydrolyses to form sodium carbonate (Mark, 2004).
BPA + 2 NaOH → BPA sodium salt + 2 H2O (3) BPA sodium salt + COCl2 → Polycarbonate + 2 NaCl (4)
The polycarbonate dissolves into the organic phase (dichloromethane), the NaCl is
concentrated in the aqueous phase. With 4 different phases present in the reactor; solid BPA, gaseous phosgene; the organic dichloromethane phase and the aqueous phase, efficient mixing is important to ensure contact between all phases for the reaction to occur (Mark, 2004). To control the length of the polymer chain, monofunctional phenol chain stoppers are added to form the terminal groups of the polycarbonate (Ullman, 2016). After the
polycondensation has been terminated by the addition of the chain stoppers, the formed polycarbonate is extracted (Van Luijk, 2003).
Extraction
By step-wise centrifugation the aqueous phase containing NaCl is separated from the organic phase. The NaCl solution (brine) is recovered for reuse in the chlorine plant. During brine recovery the brine is steam-stripped of dichloromethane after which solid particles and impurities are removed using filtration and activated carbon.The concentration of the brine is increased from 22-23 wt% to a final concentration of 26 wt% by adding fresh NaCl to the brine (Eijsbouts, 2008; SABIC IP BoZ, Online Communication, 2020a). The organic
dichloromethane phase is washed with dilute hydrochloric acid to neutralise the solution and electrolytes are removed by washing with demineralised water (Ullman, 2016).
Concentration
The polymer containing solution is then concentrated by heating in heat exchangers.
Dichloromethane evaporating from the thickening polymer solution is recovered for reuse. A cyclone is used to separate the solvent vapours from the polymer solution (Van Luijk, 2003).
Precipitation/stripping
Following concentration, the polymer is precipitated from the dichloromethane in two precipitation steps. First, the solution is passed through a heat exchanger. Second, remaining solvent is removed using steam precipitation jets (Van Luijk, 2003). The polycarbonate solution is atomised and sprayed into a steam atmosphere of sufficient
pressure (7-15 bar) and temperature (150 – 260 °C) to evaporate dichloromethane from the droplets. For the mass and energy flow analysis steam of 240 °C and 18 barg was assumed. The steam partially condenses on the polycarbonate resulting in a wet powder (25-60 wt%) (United States Patent No. US 6362304, 2002). Steam precipitation is a highly energy intensive process that requires large amounts of steam (Mehta, 2020).
Drying
The water is removed from the polycarbonate drying using multiple drying steps including column drying, spiral drying and separation in a cyclone (Van Luijk, 2003). Finally, a dry
polycarbonate powder (water content <1 wt%) is obtained. Part of this polycarbonate powder is sold directly under the name PC Resin and another part is processed further to Lexan in the compounding/extrusion plants.
2.3 Compounding/extrusion plants
The polymer powders are shaped into their final form in the compounding and extrusion plants. At these plants the powders are melted and mixed with other polymers to create the polymer blends and additives and pigments are added to tune the final properties. Next, the polymer mixture is moulded to its final form. The Lexan Finishing, Noryl and Flexible
Compounding plant produce plastic pellets, whereas the Specialty Film & Sheet plant produces thin sheets and films. Chemical reactions do not occur in the
compounding/extrusion plants.
The production of the various resins (Lexan in LXF plant, Noryl in Noryl plant and Cycoloy, Xenoy and Valox in FCP plant) essentially follows the same process. Losses occurring during the extrusion process are assumed to be negligible so 1 tonne of polymer powder is extruded to 1 tonne of resin. The electricity requirements depend on the type of polymer to be
extruded.
The process occurring in the compounding plants exists of two main steps; mixing and extrusion.
Mixing
The polymer powder produced in the manufacturing plants is transported to the
corresponding compounding/extrusion plant. Additives such as heat or UV stabilisers, colour pigments, flame retardants, fillers, lubricants and reinforcements are not produced in Bergen op Zoom and thus imported to the site. First, the polymer powders are blended with
additives to produce the desired grade of material. Next, the material is dried to prevent polymer degradation. For both polycarbonate and Noryl moisture leads to lower molecular weight polymers leading to poorer performance (Wagner Jr., Mount III, & Giles Jr., 2014). After drying, the polymer material is fed to the extruder.
Extrusion
In the extruder, the material is melted by dissipation in the extruder screws to a liquid substance. SABIC IP BoZ uses double screw extruders to convey, heat, melt and mix the plastics. Melting of the polymer powders is achieved by the mechanical energy of the rotating screws. Additionally, hot plates are used to further increase the temperature. Extruders mostly require electricity for their operation. The liquid is pushed through a mould, the die, resulting in long plastic strands (Figure 12). The strands are cooled in water to solidify. In the pelletiser, the strands are chopped into pellets by a rotating blade (Ullman, 2016). Optionally the pellets are further treated with secondary operations to enhance certain properties (Wagner Jr., Mount III, & Giles Jr., 2014). Lastly, the pellets are inspected and stored.
Figure 12: Extrusion principle (Biron, 2013).
According to SABIC IP BoZ the electricity requirements to heat and provide pressure to extrude 1 tonne of resin for various polymers is between 1.0 and 3.0 GJ/tonne (SABIC IP BoZ, Online Communication, 2020a). Besides for heat and pressure, electricity is also required to drive the motor system and for cooling. Both the motor drive and cooling require around 0.25 kWh of electricity per kg of polymer, or 0.9 GJ/tonne (euRECIPE, 2006). For our calculations, we assumed the energy use for extrusion to be 2.0 GJ/tonne. The European benchmarking survey estimates the electricity use of extrusion around 0.63 kWh/kg or 2.27 GJ/tonne (euRECIPE, 2006).
2.3.1 Lexan Finishing plant
In the Lexan Finishing plant, the polycarbonate powder is shaped to the final product, Lexan resin. The production of Lexan resin is a batch process (Mehta, 2020). As Lexan is often used for optical applications, drying is an important step to achieve highly transparent resins. For optical applications, the moisture content must be less than 0.1 wt% (0.2 wt% for other applications). Depending on the grade of Lexan resin to be produced, optimum melt temperatures in the extruder vary from 280-320 °C (Ullman, 2016).
2.3.2 Specialty Film & Sheet plant
In the specialty film and sheet plant (SF&S), Lexan sheets and films are produced. The SF&S plant has six production lines; line 1 and 2 produce solid sheets, line 3 produces solid sheets and films, line 4 produces solid sheets with optical quality and line 5 and 6 produce films (Mota, 2018). Dry polycarbonate powder enters the plant, where it is first mixed with
additives such as plasticisers and heat stabilisers. The polycarbonate mixture is then dried to prevent polymer degradation. The dry mixture is fed to an extruder where it is melted. The optimum temperature at the die for polycarbonate sheets or films is between 249-266 °C (Mota, 2018). The output of the extruder is a sheet that is pulled away from the extruder at constant velocity. The sheet is rolled to the desired thickness by calendering. In the
calendering process, the sheet is pressed between internally heated counter rotating rolls (Mota, 2018). Calender machines can contain up to seven rolls (Ullman, 2016). When the final thickness has been achieved, the sheet is cooled to solidify. Optionally, secondary operations such as masking, flame treatment and cutting are performed. Lastly, the product is inspected and stored.
Figure 13: Calendering line; a) Cutter; b) Cooling rolls; c) Four-roll calender; d) Extruder; e) Mixing roll mill (Ullman, 2016).
2.3.3 Flexible Compounding plant
In the flexible compounding plant various polymer blends are produced such as Valox, Xenoy and Cycoloy. The FCP plant makes hundreds of different products, both make-to-order and make-to-stock. Production is divided into 10 production groups and 8 production lines, each dedicated to a number of product groups (Klompenhouwer, Lukszo, & Janssen, 2007).
2.4 Material and Energy Flow Analysis
The CHP at SABIC IP BoZ produces around 80 tonnes of steam per hour on average. Since the steam is generated on average at 240 °C and 18 barg, the steam has an energy-content of 2732kJ/kg. Thus, the CHP generates 1.91 PJ of steam per year. Adding the steam generation in the hydrogen boiler, TAR boiler and the steam purchased from Air Liquide, the total steam use at the site is around 2.87 PJ/yr. The CHP also produces 0.96 PJ electricity per year and 0.56 PJ of electricity is imported annually (SABIC IP BoZ, 2020e). The total energy supply (heat + electricity) at the site adds up to 4.4 PJ/yr.
The mass and energy balances per production plant have been normalised to the production of 1 tonne of end-product for every plant. SABIC IP BoZ has an average yearly production of 239 kilotonnes (kt) of polycarbonate powder of which about 123 kt is further processed to Lexan. Table 8 lists the energy requirements for every plant involved in the polycarbonate production process to produce 1 tonne of Lexan.
Table 7: Energy requirements for the production of 1 tonne of Lexan.
Process Energy carrier Energy input
(GJ/tonne)
Resin plant - 1 t PC powder Steam 6.00
Electricity 0.37
Heat loss 1.38
BPA plant - 0.9 t BPA Steam 4.49
Electricity 0.45
Heat loss 1.02
Phosgene plant - 0.45 t phosgene Steam 0.18
Electricity 0.03 Heat loss 0.13 Chlorine - 0.33 t Cl2 Steam 0.33 Electricity 3.45 Heat loss 0.35 Compounding - 1 t PC Electricity 2.00 TOTAL Steam 11.00 Electricity 6.30 Heat loss 2.87
The total energy requirements for the production of 1 tonne of polycarbonate powder adds up to 15.3 GJ (total steam usage of 11.0 GJ plus the total electricity use for 1 tonne PC powder of 4.3 GJ and excluding extrusion) and the total energy needed to produce 1 tonne of Lexan adds up to around 17.3 GJ/tonne (thus, including extrusion). For the production of 239 kt of polycarbonate powder, the energy requirements would add up to 3.7 PJ. Assuming
123 kt of the polycarbonate powder is compounded to Lexan, this would require a total of 0.25 PJ of electricity. To produce 123 kt Noryl and FCP product, 0.28 PJ of electricity is required. Since the total energy supply (heat + electricity) at the site adds up to 4.4 PJ/yr, this leaves approximetaly 0.21 PJ of steam. To explain the difference it is likely that the steam use of production processes has been underestimated. Additionally, a small amount of steam that could not be quantified is also used in the compounding plants and steam is used to heat the on-site buildings.
Using the NEa (2020) data and assuming a CHP electrical efficiency of 28% and thermal efficiency of 55% (total CHP efficiency of 83%), the emission factors for heat and electricity generation by the cogenerator were determined at 48.41 kgCO2/GJ for heat and 0.38 kgCO2/kWh for electricity. The steam imported from Air Liquide is regarded as a waste product of which the emissions are allocated to Air Liquide. For the hydrogen combustion boiler zero emissions were assumed. The emission factor of the TAR boiler was also assumed to be zero, as the burning of tar does not qualify as a CO2 emitting installation under the NEa criteria. Based on the fractions of on-site produced steam and electricity and imported steam and electricity, the total scope 1 and 2 emissions for the production of 116 kt of PC powder, 123 kt of Lexan and 123 kt of compounding product were determined at 264 kt CO2 in 2018.
3 Products and
application
Table 9 lists the main products produced at SABIC IP BoZ and their applications. The polycarbonate powder production was estimated to be 239 kt in 2018. For the blended polymer products produced in the FCP and Noryl plant only the total production number could be calculated.
Table 8: SABIC IP BoZ main products and applications. Brand
name Chemical name Application
Production volume 2018 (kt) PC resin Polycarbonate (PC) High impact/light weight/stiff transparent applications (i.e. glass replacement, electrical hardware, water tank bottles etc.) & aesthetics enhancement
116
Lexan 123
Noryl Polyphenylene oxide (PPO)/ Polystyrene (PS) Electrical hardware, automotive (dashboard) 123 Cycoloy Polycarbonate (PC)/ Acrylonitrile-butadiene-styrene (ABS)
Ski boots, medical devices and pharmaceutical applications
Xenoy Polycarbonate (PC)/Polybutylene terephthalate (PBT)
Automotive exterior (bumper), hospital beds
Valox
Polyethylene terephthalate (PET)/ Polybutylene terephthalate (PBT)/ Polycarbonate (PC)
Electronics, appliance handles and housings, sprinklers
3.1 Lexan polycarbonate
SABIC is one of the world leading producers of polycarbonate, which it sells in a pure powder form (PC Resin) and in compounded form under the name Lexan (IHS Markit, 2018). The polymer was independently created by both Bayer and GE Plastics in their attempts to make a polymer superior to polyethylene terephthalate (PET). Lexan polycarbonate was first introduced to the US market in 1960 by General Electric (Ullman, 2016). Lexan has unique properties including extreme rigidity, transparency and heat resistance. Furthermore, it can be blended with other polymers to synthesise a variety of materials with different properties and can be recycled (Coe, 2000). Lexan is often used as a replacement of glass, for instance in greenhouses, in the automotive industry for headlight covers and in building and
construction for window panes and roofing (SABIC Innovative Plastics, 2011; Ullman, Ullmann's Polymers and Plastics: Products and Processes, 2016). SABIC IP BoZ produces Lexan resins, sheets and films in different grades suitable for different applications.
3.1.1 Applications
The polycarbonate consumption is dominated by four main sectors; Building and Construction, Electrical & Electronics industries, Optical Media and Automotive. In these sectors polycarbonate is used in unique applications meaning that it cannot be replaced by another material if the same material performance is desired. Polycarbonate is an enabling technology for innovation due to its many unique properties (PlasticsEurope, n.d.).
Figure 14: Dutch polycarbonate consumption by sector (PlasticsEurope, n.d.).
3.1.2 Value added & market price
The Netherlands produces about 20% of the total European polycarbonate production, generating about 490 million euro of value added. Most of the polycarbonate is produced for export and is supplied to consumers all over the world. Over 21,000 jobs in the Netherlands are related to the production and consumption of polycarbonate (PlasticsEurope, n.d.). The largest companies in the polycarbonate market are Bayer and SABIC, that each hold 27% of the world market (Mota, 2018). The price of polycarbonate is greatly determined by the oil price and the demand for polycarbonate products. Due to the COVID-19 crisis, both oil prices and the demand for plastics fell in 2020 as many final product processing plants were closed (i.e. car manufacturing facilities), resulting in a drop in the market price of plastics (Van Lockhuyzen, 2020). However, the COVID-19 crises also lead to an increased demand for polycarbonate sheets used for protection. In reaction to the crisis, SABIC IP BoZ has increased the production of Lexan sheets (Peeters, 2020). Figure 15 shows the development of the average price of clear polycarbonate of the last two years in euros per tonne.
Figure 15: Price development of clear polycarbonate in 2019 and 2020 (€/tonne)
(Kunststof & Rubber, 2021).
3.2 Other engineering thermoplastics
The thermoplastics produced in the Flexible Compounding Plant are made to the order of customers. The amount of additives and polymer in a blend are weighted by hand and can therefore be flexibly adapted to a customer’s specific needs (SABIC IP BoZ, Personal
communication, 2020e). Blends produced at SABIC IP BoZ include Cycoloy, Xenoy and Valox. The polymer blends are available in a number of different grades for specific purposes. Cycoloy is widely used in ski boots as the addition of ABS to PC improves the rigidity and low temperature toughness of the material (Ullman, Ullmann's Polymers and Plastics: Products and Processes, 2016). Xenoy and Valox resins can be made from post-consumer recycled PBT waste, lowering the energy use and environmental impact of the production process (SABIC Innovative Plastics, 2008).
4 Options for
decarbonisation
In this chapter decarbonisation options for SABIC IP BoZ will be discussed. The decarbonisation options are categorised in 7 categories as shown below in Figure 16.
Figure 16: CO2 reduction categories.
4.1 Fuel substitution
The decarbonisation options discussed in this section aim to decarbonise SABIC IP BoZ’s 132 MWth gas turbine combined heat and power plant for the cogeneration of steam and
electricity (European Environment Agency, 2019).
4.1.1 Electrification
An important industrial transition path is the so-called power-to-heat transition or
electrification. In this pathway, renewable electricity is used to generate the steam that is required for industrial processes. In the chemical industry, two fully developed, commercially available power-to-heat technologies are used; the resistance element boiler and the
electrode boiler (Marsidi, 2019a). Both make use of the conductive and resistive properties of water to carry electric current, have high efficiencies, can be operated flexibly to make use of low electricity prices and can be applied in CHP-hybrid concepts as boiler alternatives (Berenschot, Energy Matters, CE Delft, & Industrial Energy Experts, 2017).
In resistance element boilers, heat is generated with electricity that runs through a
resistance element. Water runs over this heating element causing it to heat up to its boiling point and become steam. Resistance element boilers are also capable of heating air and
other gasses to about 600 °C, however the capacity is quite low (max 5 MWe) (Marsidi, 2019a). In electrode boilers, water flows between electrodes that are connected to a medium voltage. The electricity that is flowing through the electrodes generates an electric field that causes the water molecules to move at high speed. In this way the water heats up and vaporises into steam. Electrode boilers can produce steam up to 350 °C at 70 bar. The capacity of an electrode boiler is between 3 and 70 MWe (Marsidi, 2019a). As estimations are that SABIC would require a capacity around 70 MWe, electrode boilers are more suitable for steam production at SABIC IP BoZ. The characteristics of an electrode boiler are listed in Table 10.
Switching from natural gas to electricity only will significantly increase SABIC IP BoZ’s electricity consumption. Electrification can only be regarded as a decarbonisation option if the electricity used is generated from renewable resources such as wind and solar power. Hence, one of the key priorities in the Delta region1 is facilitating direct access to hundreds of megawatts of wind energy for industry (CE Delft, 2018). When there is a direct connection with SABIC IP BoZ, a challenge regarding the use of renewable electricity is the intermittency of the supply as both wind and solar energy are non-continuous sources.
The price of electricity is highly uncertain and dependent on fuel and carbon dioxide prices. In the Netherlands, coal fired power plants are being closed and the share of renewable electricity is increasing. It is expected that by 2030, 75% of the total electricity generated will be from renewable resources such as solar and wind (PBL, 2020). The price of green electricity is projected to be 57 €/MWh in 2030 (PBL, 2019).
Table 9: Characteristics of electrode boilers.
Characteristics Value Reference
Fuel input Electricity Energy output Steam
(up to 350 °C and 70 bar)
(Berenschot, Energy Matters, CE Delft, & Industrial Energy Experts, 2017)
Emissions 0
Input capacity 20 MWe (Marsidi & Lensink, 2020) Output capacity 19.8 MWth (Marsidi & Lensink, 2020)
Efficiency 99% (Marsidi & Lensink, 2020)
Full load hours 2000 h/yr* (Marsidi & Lensink, 2020)
TRL 9 (Berenschot, Energy
Matters, CE Delft, & Industrial Energy Experts, 2017)
Lifetime 15 yr (Marsidi & Lensink, 2020)
Investment cost 115 €/kWth (Marsidi & Lensink, 2020) Operational cost 49 €/kWth/yr Fixed operational costs
0.037 €/kWhth Variable operational costs
(Marsidi & Lensink, 2020)
* In theory full load hours could be higher. In 2030 a fully renewable electricity supply can be guaranteed for 8000 hr/y.
4.1.2 Biomass
An alternative carbon-neutral fuel that could be used to achieve decarbonisation of industry is sustainably produced biomass. Different forms of biomass can be used to generate both heat and electricity. Solid biomass such as organic waste or wood could be burned directly in biomass boilers or converted by microorganisms to biogas. The most commonly used source of biomass in the Dutch industry is wood in the form of chips or pellets. The biomass is often imported from countries like the United States, the Baltic Region, Russia, Germany and Norway (Flach & Phillips, 2019).
Three main processes exist for the conversion of biomass to fuel; direct-firing, gasification and anaerobic digestion. In a direct-fired plant biomass is burned in a stoker or fluidised bed boiler to produce high pressure steam. Direct-fired systems accept a wide range of biomass feedstock types; however, wood pellets and chips are most commonly used. As SABIC IP BoZ does not produce a solid biomass waste stream, it would have to import biomass to the site. Since 2013 Eneco operates a direct-fired biomass plant for the generation of heat and electricity in Farmsum. The plant has a similar capacity as the CHP at SABIC IP BoZ (Eneco 135 MWth, SABIC IP BoZ 132 MWth) and consumes 300,000 million tonnes of waste wood and chips per year (Flach & Phillips, 2019). Table 11 lists the characteristics of a direct-fired biomass boiler.
Table 10: Characteristics of direct-fired biomass boilers (Cremers, Strengers,
Beurskens, & Lensink, 2020).
Characteristics Value
Fuel input Wood pellets
Energy content of fuel 17 GJ/tonne
Fuel price 180 €/tonne
Energy output Steam
Emissions 0*
Capacity 20 MWth
Full load hours 8500 h/yr
Efficiency 90%
Lifetime 12 years
TRL 9
Investment cost 605 €/kWth
Operational cost 46 €/kWth/yr Fixed operational costs 0.004 €/kWh Variable operational costs *Emissions from the burning of biomass are allocated to the point where the biomass is produced and harvested. Hence,
the emissions from the use of biomass by SABIC IP BoZ are zero.
In a gasification system, solid biomass (wood chips/pellets) is heated in an oxygen-deprived environment to produce syngas (CO and H2). The syngas is then cleaned and burned in gas turbines to produce heat and electricity. In CHP concepts, gasification systems can reach higher efficiencies than direct-fired installations as the syngas is more efficiently converted to electricity (BlueTerra, 2018). For a gas turbine CHP to run on syngas instead of natural gas, minor adaptations to the burner system need to be made. Due to a lacking infrastructure syngas cannot be purchased and has to be produced on-site (Wolbers, 2020). Table 12lists the characteristics of a biomass gasification installation.
Table 11: Characteristics of a biomass gasification installation (Cremers, Strengers,
Beurskens, & Lensink, 2020).
Characteristics Value
Fuel input Wood pellets
Energy content of fuel 17 GJ/tonne
Fuel price 180 €/tonne
Energy output Syngas
Emissions 0*
Capacity 32 MW input
Full load hours 7500 h/yr
Efficiency 65%
Lifetime 12 years
TRL 9
Investment cost 2250 €/kW output
Operational cost 135 €/kW output
* Emissions from the burning of biomass are allocated to the point where the biomass is produced and harvested. Hence, the emissions from the use of biomass by SABIC IP BoZ are zero.
In anaerobic digestion wet biomass is converted to biogas by microorganisms. The biogas (CH4 + CO2) can then be burned to generate steam and electricity. Anaerobic digestion requires the presence of a wet biomass source. SABIC IP BoZ has a biological wastewater treatment plant of which the sludge could provide a source of wet biomass to be used for energy generation. However, the supply of sludge is insufficient to meet the site’s energy requirements, so additional biomass will have to be imported, potentially from neighbour Cargill. The limited availability of biogas and a lacking infrastructure make it necessary to produce the biogas on-site (Wolbers, 2020). Table 13 lists the cost of an anaerobic digestion installation and a digester with a new CHP.
Table 12: Characteristics of biomass digestion (Boots, Wolbers, & Lensink, 2020).
Characteristics Digester Digester + CHP
Fuel input Wet biomass Wet biomass
Fuel price (dec-19) 27.8 €/tonne 27.8 €/tonne Energy content 3.4 GJ biogas/tonne 3.4 GJ biogas/tonne
Energy output Biogas Heat and electricity
Emissions 0* 0*
Input Capacity 5.5 MWth 5.5 MWth
Electric capacity 2.3 MWe
Thermal output capacity 2.6 MWth
Full load hours electricity 8000 h/yr 8000 h/yr
Full load hours heat 7300 h/yr
Efficiency 62% 41%
Lifetime 12 years 12 years
TRL 9 9
Investment cost 808 €/kW input (digester) 404 €/kW output (gas cleaning)
898 €/kWth input
Operational cost 111 €/kW input (digester) Fixed operational costs
81 €/kWth input Fixed operational costs
*Emissions from the burning of biomass are allocated to the point where the biomass is produced and harvested. Hence, the emissions from the use of biomass by SABIC IP BoZ are zero.
4.1.3 Hydrogen
Another promising energy carrier that could substitute natural gas, is hydrogen. For
hydrogen to be regarded a decarbonisation alternative however, it should be produced from renewable resources. Hydrogen is categorised to three categories based on its production route; grey, blue and green hydrogen. Grey hydrogen involves the production of hydrogen from fossil-fuels with CO2 emissions resulting from the production process. Most of the hydrogen currently on the market is grey hydrogen produced by steam methane reforming (SMR). Blue hydrogen is also produced from fossil fuels, however the CO2 emissions during production are captured using carbon capture and storage technology (see 4.7 for more detail). Lastly, green hydrogen is produced using renewable resources. Currently, the most employed technology for the production of green hydrogen is electrolysis of water using green electricity. The economic feasibility of using hydrogen depends largely on its
production route, the available infrastructure for hydrogen and the price of hydrogen which currently is higher than the price of natural gas (de Bruyn, Jongsma, Kampman, Gorlach, & Thie, 2020).
Hydrogen combustion
Hydrogen can be implemented with minimal modifications to the existing processes. Table 14 shows the costs for installing a new hydrogen boiler. Hydrogen boilers are a commercially available technology (Technological Readiness Level [TRL] 9) (Element Energy, Advisian, & Cardiff University, 2019).
Table 13: Characteristics of a hydrogen boiler (E4tech, UCL Energy Institute, & Kiwa,
2015).
Characteristics Value
Fuel input Hydrogen
Energy output Steam
Emissions Water vapour, NOx
Capacity 5 – 200 MW
Efficiency 90%
Lifetime 25 years
TRL 9
Investment cost 98.3 GBP/kW (121.11 €/kW)*
Operational cost 3.2 GBP/kWh/yr (3.94 €/kWh/yr) Fixed operational costs*
⃰ Conversion from GBP2015 to EUR2020. GBP2015 to GBP2020 11.59% inflation2. 1 GBP2020 = 1.104 EUR20203. Hydrogen can also be used as a fuel in a conventional gas-turbine CHP installations to generate steam and electricity. Though the technology has an estimated TRL of 7-9 its application to large scale industry is limited (SBC Energy Institute, 2014). The 16 MW Fusina plant in Italy is the first industrial-scale application featuring a hydrogen fuelled gas turbine and heat recovery steam generator (Power Engineering International, 2010). Table 15 shows the costs of installing a new hydrogen-fuelled CHP plant. To save money and maximise the lifespan of existing installations, research into retrofitting natural gas CHPs to hydrogen or flexibly fuelled CHPs is ongoing. In Hamburg a natural gas CHP is being converted to
hydrogen and the Dutch Topsector Energie is also involved in a project regarding retrofitting CHPs to hydrogen (Ali, 2019; Topsector Energie, n.d.).
Table 14: Characteristics of a hydrogen CHP.
Characteristics Value Reference
Fuel input Hydrogen
Energy output Steam, electricity Emissions Water vapour, NOx
Capacity 1 – 300 MWe (SBC Energy Institute,
2014) Electrical efficiency (HHV) < 45% open cycle < 60% combined cycle (SBC Energy Institute, 2014)
Lifetime 20 years (E4tech, UCL Energy
Institute, & Kiwa, 2015); (SBC Energy Institute, 2014) TRL 7-9 (SBC Energy Institute, 2014) Investment cost 389 - 555 GBP/kW (480 – 685 €/kW)*
(E4tech, UCL Energy Institute, & Kiwa, 2015); Operational cost 0.003 - 0.0043 GBP/kW/yr
(0.004 – 0.005 €/kW/yr)*
(E4tech, UCL Energy Institute, & Kiwa, 2015); ⃰ Conversion from GBP2015 to EUR2020. GBP2015 to GBP2020 11.59% inflation2. 1 GBP2020 = 1.104 EUR20203. The best technology for hydrogen combustion for SABIC IP BoZ is probably the installation of new hydrogen boilers. The costs for building a new hydrogen CHP are considerable, and retrofitting existing CHPs to hydrogen is currently still under development. However, having a separate hydrogen CHP system would enable the old natural gas-fired system to be used as back-up and enable a gradual transition from natural gas to hydrogen.
Hydrogen production
Switching from natural gas to hydrogen requires a stable supply of carbon-free hydrogen. Hence, a key priority of the Delta region is to develop a local, open infrastructure for carbon-free hydrogen connecting regional producers and users. Besides facilitating an infrastructure, the region also aims at enabling conditions for the realization of electrolysis units for the production of green hydrogen and oxygen (CE Delft, 2018). Through Air Liquide, SABIC IP BoZ is connected to the hydrogen pipeline between Pernis and Antwerp enabling a stable supply stream of hydrogen to the site.
The price of grey hydrogen is currently around 1.50 €/kg and largely determined by the price of natural gas (van Hulst, 2019). Future blue hydrogen will be priced higher than grey hydrogen, with its price being driven by the price of natural gas as well as the cost of carbon capture and storage or reuse. The price of blue hydrogen is expected to quickly come down after the deployment phase, when CCS/U is scaled up and standardised. The price of green hydrogen is currently between 3.50 – 5.00 €/kg as a result of the limited capacity for electrolysis and costs of green electricity (van Hulst, 2019). At current prices using green hydrogen is economically not viable. However, if current CO2 pricing trajectories continue, the price of hydrogen derived from natural gas will increase (van Hulst, 2019). At a CO2 price of 30 €/tonne blue hydrogen becomes cheaper than grey, and at a price of 60 €/tonne CO2 green hydrogen becomes competitive (GasTerra, 2019). Add to this the technical
developments leading to a decreasing price of electrolysers and of renewable electricity and green hydrogen becomes a viable, sustainable alternative (van Hulst, 2019).
Alternatively, green hydrogen could be produced on-site using electrolysis (provided that the electricity used comes from a renewable source). Some hydrogen is already produced on-site as a by-product of chlorine electrolysis, however to fully power the site using hydrogen a