Exploring comparable
post-2012 reduction
efforts for
Annex I countries
For all Annex I countries, reductions are necessary to meet climate goalsEU Heads of State and Government agreed in March 2007 that the EU will reduce its greenhouse gas emissions to 30% below 1990 levels by 2020 within a global and comprehensive post-2012 climate agreement. This commitment is provided that other developed countries commit to comparable reductions.
Within this context, this report first explores the pros and cons of possible conceptual approaches to assess the comparability of the greenhouse gas mitigation efforts by Annex I countries. Six approaches were selected for quantification based on the criteria of representation of efforts and technical feasibility, such as equal costs in terms of percentage of gross domestic product and equal marginal abatement costs. The implications of each of these six approaches were analysed in terms of the future reductions and abatement costs that must be made by different Annex I countries to meet the aggregate Annex I reduction targets of 20%, 30% and 40%, respectively, below 1990 levels.
The results of the analyses indicate that − under all approaches − significant reductions are necessary for all Annex I countries to meet their reduction targets. The highest reductions, calculated for 2020 and compared to the 1990 emission levels, will be achieved in the Russian Federation and Ukraine, because their emissions have declined since 1990. The next highest reductions will be achieved in the EU, followed by Canada. Behind Canada, to a lesser extent, are Japan and the USA, for the latter of which emissions have significantly increased since 1990. This study shows that reductions by the EU of at least 30%, combined with comparable reduction efforts by other Annex I countries and concrete support of developed countries for developing countries to keep their emissions substantially (about 15–30%) below baseline, are sufficient to secure the climate goal, that
is, limiting the global temperature increase to 2°C above pre-industrial levels.
Background Studies
Exploring comparable post-2012 reduction
efforts for Annex I countries
PBL Report 500102019/2008
Exploring comparable post-2012 reduction
efforts for Annex I countries
© Netherlands Environmental Assessment Agency (PBL), The Netherlands, December 2008 PBL Report 500102019/2008 M.G.J. den Elzen* N. Höhne** J. van Vliet* C. Ellermann**
* Netherlands Environmental Assessment Agency (PBL), The Netherlands ** Ecofys, Germany
Corresponding author:
Michel den Elzen, Netherlands Environmental Assessment Agency (PBL), michel.denelzen@pbl.nl
This research was performed with the support of the Dutch Ministry of Housing, Spatial
Planning and the Environment as part of the framework of the Netherlands Research Programme on Scientific Assessment and Policy Analysis for Climate Change (WAB).
This publication can be downloaded from the website www.pbl.nl/en.
A hard copy may be ordered from: reports@pbl.nl, citing the PB publication number. Parts of this publication may be used for other publication purposes, providing the source is stated, in the form: Netherlands Environmental Assessment Agency: Exploring comparable post-2012 reduction efforts for Annex I countries, 2008.
Netherlands Environmental Assessment Agency PO Box 303 3720 AH Bilthoven T: +31 30 274 2745 F: +31 30 274 4479 E: info@pbl.nl www.pbl.nl
Acknowledgements
Acknowledgements
This report is part of a research project entitled ‘Exploring comparable post-2012 efforts for Annex I countries and Advanced Developing Countries’. The project was conducted by the Netherlands Environmental Assessment Agency (PBL) and Ecofys–Germany.
The project has been financed by the Dutch Ministry of Housing, Spatial Planning and the Environment (VROM), as part of its National Research Programme on Climate Change (NRP–CC), particularly its sub-programme dealing with ‘Scientific assessments and policy analyses’.
The results from an earlier version of this report were first presented and discussed during tele-conference calls with members of a CCAP (Center for Clean Air Policy) working group on Annex I targets. Preliminary results were presented and discussed by Jack Schmidt (representing CCAP) at the Future Actions Dialogue workshop in Tokyo, Japan, held in February 2008, and by Chris Ellerman (representing Ecofys) at the subsequent Future Actions Dialogue workshop, held in July 2008 in San Francisco, USA, which was attended by senior climate negotiators from more than 30 countries. The results were also discussed at the International Workshop on Sectoral Emission Reduction Potential in Paris, France (presented by Michel den Elzen) in June 2008, which was attended by senior climate negotiators and policy advisors from about 20 countries. Our special thanks are given to Jack Schmidt and Ned Helme (CCAP) for organising the telep-hone conferences, invitations for the CCAP meeting and comments on earlier drafts. The authors also gratefully acknowledge the comments and input from the participants of the telephone conference calls and the CCAP meeting in Tokyo.
This report has benefited from the comments of a Steering Committee consisting of Marcel Berk (Ministry of VROM), Tom van Ierland and Martin Weiss (European Commission DG Environment), Guido Knoche (UBA, Germany) and Stephen Cornelius (DEFRA, United Kingdom).
Special thanks are also due to Patrick Criqui (CNRS-Université de Grenoble, France) and Alban Kitous (Enerdata, France) for providing the marginal abatement costs and baseline emissions of the POLES energy system model. The authors are also grateful to Alice Barrs, Alon Carmel and Federico Gallo of the UK Office of Climate change (OCC) for their assistance with the POLES data.
Finally, the authors would like to thank Leo Meyer, Paul Lucas and Detlef van Vuuren (PBL) for their comments on and contributions to this report. Filip de Blois and Kees Klein Goldewijk (PBL) are thanked for their support in graphics design and production. Finally, we thank
Rapport in het kort
Rapport in het kort
Verkennen van vergelijkbaarheid van post-2012 reductie-inspanningen voor Annex I en rijkere ontwikkelingslanden
In 2007 kwamen de EU landen overeen dat de broeikasgasemissies in 2020 met 30% moeten zijn teruggedrongen als bijdrage aan een algemene en alomvattende klimaatovereenkomst voor de periode na 2012. Voorwaarde is dat andere geïndustrialiseerde (Annex I) landen zich verplichten tot “vergelijkbare” reductie-inspanningen. Dit rapport beschrijft verschillende conceptuele benaderingen van “vergelijkbare inspanningen”, en analyseert hun voor- en nadelen. Het rapport analyseert vervolgens de gevolgen van zes geselecteerde benaderingen van “vergelijkbare inspanningen”, bijvoorbeeld gelijke kosten in procenten van het BBP of gelijke marginale reductiekosten, voor de reductiedoelstellingen en reductiekosten voor de verschillende Annex I landen. Dit is gedaan voor drie scenario’s voor de totale Annex I reductiedoelstelling, namelijk een vermindering van 20%, 30% en 40% van de broeikasgasemissies van alle Annex-I landen onder het niveau van 1990 in 2020. Uit de analyse blijkt dat er voor alle Annex I landen aanzienlijke reducties noodzakelijk zijn. De grootste reducties ten opzichte van de 1990 emissieniveaus behalen Rusland en Oekraïne; hun uitstoot daalde tussen 1990 en vandaag. Daarna volgt de EU. De EU wordt gevolgd door Canada en in mindere mate Japan en de Verenigde Staten. In dit laatste land is de uitstoot sterk is toegenomen sinds 1990 en wordt een sterkere groei van de emissies in het basisscenario voorzien. Ten slotte blijkt het alleen mogelijk om de 2 graden doelstelling te halen als de EU een reductie van tenminste 30% realiseert, de andere Annex I landen een vergelijkbare inspanning plegen, en voldoende steun aan de ontwikkelingslanden wordt verleend om hun emissies met 15-30 % ten opzichte van hun emissies in het basisscenario te verlagen.
Trefwoorden: Post-2012 regimes, sectorale doelstellingen, UNFCCC, toekomstige verplichtingen, technologie, emissies, klimaatveranderingen, broeikasgassen
Contents
Contents
Samenvatting 11 Summary 15 1 Introduction 19
2 Defining “comparable efforts” 23 2.1 Equal future burden 24
2.1.1 Equal percentage reduction of emissions below base year 25 2.1.2 Equal percentage reduction below a reference scenario 28 2.1.3 Proportional to simple criteria for differentiating reductions 29 2.1.4 Equal marginal abatement costs 30
2.1.5 Equal total abatement costs per unit of GHG reduced 34 2.1.6 Equal total abatement costs per GDP 34
2.1.7 Equal total abatement costs per capita 36 2.1.8 Equal macroeconomic burden 36
2.2 Equal endpoint 36
2.2.1 Equal per capita emissions at a future endpoint 37 2.2.2 Achieving equal efficiency levels per sector 37 2.2.3 Triptych approach 39
3 Methodology 41
3.1 The FAIR model 41 3.1.1 Abatement costs 41
3.1.2 Baseline emissions and MAC curves 42 3.1.3 Updates of our calculations 42
3.2 Baseline 45 4 Model analysis 47
4.1 Introduction 47
4.1.1 Three “comparable effort” scenarios for the Annex I countries 47 4.1.2 Assumed reduction targets for the non-Annex I countries 48 4.1.3 Parameter settings of the cases 50
4.1.4 Global emissions trading market and CDM 50 4.2 “20% Annex I comparable” scenario 55
4.2.1 Annex I countries’ reduction targets 55 4.2.2 Abatement costs 57
4.2.3 Other indicators 60
4.3 “30% Annex I comparable” scenario 60
4.3.1 Reduction targets of Annex I countries 60 4.3.2 Abatement costs 64
4.3.3 Other indicators 64
4.4 ‘40% Annex I comparable’ scenario 64 4.4.1 Annex I countries’ reduction targets 64 4.4.2 Abatement costs 67
5 Robustness of results 75
5.1 The impact of the baseline 75
5.2 The impact of the MAC curves: POLES 75 5.3 The impact of the initial (2010) emissions 80 5.4 The impact of the choice of the approaches 80
5.5 The impact of the parameterizations of the approaches 81 6 Discussion 83
7 Conclusions 85 References 91
Samenvatting
Samenvatting
Naarmate de internationale onderhandelingen over een nieuwe klimaatovereenkomst vorderen wordt het onderwerp ‘vergelijkbare reductie-inspanningen’ tussen de landen steeds belangrijker. In maart 2007 hebben de EU landen besloten tot een eenzijdige of unilaterale reductiedoelstel-ling van de broeikasgasemissies met 20% in 2020 ten opzichte van de niveaus van 1990. Voorts kwamen de EU landen overeen dat de broeikasgasemissies in 2020 met 30% moeten zijn terug-gedrongen als bijdrage aan een algemene en alomvattende klimaatovereenkomst voor de periode na 2012. Twee voorwaarden worden aan dit besluit verbonden: ten eerste dat andere geïndustria-liseerde landen (de landen in Annex I in Kyoto Protocol) zich verplichten tot vergelijkbare emis-siereducties, en ten tweede dat economisch meer ontwikkelde ontwikkelingslanden ook aanzien-lijk bijdragen in overeenstemming met hun verantwoordeaanzien-lijkheden en mogeaanzien-lijkheden. Het doel van dit rapport is inzicht te verschaffen in de verschillende manieren waarop het concept ‘verge-lijkbare emissiereducties’ kan worden uitgewerkt voor ontwikkelde landen in een raamwerk voor een internationale klimaatovereenkomst na 2012. De Conferentie van de Partijen bij het Raamverdrag van de Verenigde Naties betreffende klimaatverandering heeft in Bali in december 2007 (COP13) in het Bali Actie Plan alle ontwikkelde landen opgeroepen reductieverplichtingen op zich te nemen, zodanig dat de onderlinge vergelijkbaarheid van de inspanningen verzekerd is. Dit rapport beschrijft verschillende conceptuele benaderingen van “vergelijkbare inspannin-gen” van Annex-I landen en analyseert hun voor- en nadelen. De benaderingen kunnen worden gebruikt voor de beoordeling van reductie-inspanningen van alle Annex I landen. Op basis van de criteria van de weergave van deze inspanningen en technische haalbaarheid zijn zes benade-ringen geselecteerd:
Gelijke reductie van het basis- of referentiescenario 1.
Gelijk marginale reductiekosten 2.
Gelijke reductiekosten als percentage van het
3. BBP (exclusief benutting van internationale
emissiehandel en CDM)
Gelijke reductiekosten als percentage van het
4. BBP (met benutting van internationale
emissie-handel en CDM)
Convergentie in de emissie-uitstoot per hoofd van de bevolking (dat wil zeggen gelijke emis-5.
sies per hoofd van de bevolking in een eindpunt, hier in het jaar 2050)
Triptiek aanpak (d.w.z. de toewijzing van de toekomstige emissiereducties tussen de landen 6.
gebaseerd op convergerende technologische normen of doelstellingen op sectorniveau, maar rekening houdend met structurele verschillen tussen landen.)
De eerste vier benaderingen zijn gericht op gelijke toekomstige lasten, zoals gelijke kosten, en zijn afhankelijk van het toekomstige referentiescenario en (voor de kostenbenaderingen) ook afhankelijk van de reductiekosten veronderstellingen. Deze benaderingen houden geen rekening met reductie-inspanningen die in het verleden zijn gedaan. De laatste twee benaderingen richten zich op een gelijk eindpunt, zoals de convergentie van de uitstoot per hoofd van de bevolking of de energie-efficiëntie, en zijn dus minder afhankelijk van een referentiescenario. Deze benade-ringen houden wel rekening met reductie inspanningen die in het verleden zijn gedaan.
Dit rapport analyseert vervolgens de gevolgen van ieder van de zes benaderingen voor de emis-siereducties en de bijbehorende reductiekosten die door de verschillende Annex I landen in 2020 moeten worden gemaakt om de complete Annex-I doelstellingen te halen. Dit is uitgewerkt voor drie ‘Annex I vergelijkbare’ scenario’s, die gericht zijn op vermindering van broeikasgassen (de zes Kyoto Protocol broeikasgassen) door Annex I van respectievelijk -20%, -30% en -40%
onder het niveau van 1990 in 2020. Daarbij wordt aangenomen dat ook de niet-Annex I landen (ontwikkelingslanden) als groep hun emissiegroei moeten beperken: hun emissies moeten worden gereduceerd onder het referentiescenario met respectievelijk 10 %, 16% en 22% in 2020 om te komen tot lange termijn stabilisatie van de broeikasgasconcentraties op het niveau van 550, 450 en 400 ppm CO2-eq. Tot slot bevat het rapport een analyse van de robuustheid van de resultaten op basis van alternatieve marginale emissie reductiekosten. De belangrijkste bevindin-gen van deze studie zijn (andere belangrijke uitkomsten zijn te vinden in hoofdstuk 7):
• De keuze van de complete reductiedoelstelling van Annex I is voor de meeste landen van
groot belang, aangezien de reductieverschillen in reducties tussen de 20%, 30% en 40% van
Annex I reductie scenario meestal groter zijn dan de reductieverschillen tussen de verschil-lende benaderingen die gericht zijn op dezelfde Annex I reductiedoelstelling.
Significante reducties voor alle landen onder alle zes benaderingen zijn noodzakelijk voor •
het bereiken van de Annex I reductie doelstelling.
• Reductie ten opzichte van 1990 emissieniveau is geen goede maat voor vergelijkbare
inspanning. Voor de gekozen benaderingen zijn doorgaans in 2020 de grootste reducties
ten opzichte van 1990 emissieniveaus voor de Oekraïne en Rusland, aangezien hun emis-sies zijn afgenomen sinds 1990, en omdat we voor de berekeningen veronderstellen dat hun initiële (2010) emissies begint bij hun referentie emissies, die ver onder hun Kyoto doelstel-lingen liggen. De eerstvolgende grootste reducties worden gevonden door de EU, waarvan de emissies sinds 1990 zijn afgevlakt en in het referentiescenario weinig groeien . De EU wordt gevolgd door Canada en in mindere mate Japan en de Verenigde Staten, waarvan de emissies al aanzienlijk zijn gestegen sinds 1990 en een sterkere groei van de emissies in het referentiescenario wordt voorzien. In het 20%, en zelfs in het 30% Annex I reductiescenario, is voor Australië en Nieuw-Zeeland in veel benaderingen nog altijd ruimte voor een verho-ging de emissies ten opzichte van het niveau van 1990. Dit zou anders kunnen liggen indien emissies uit landgebruik volledig in de analyse zouden worden meegenomen. De Triptiek en de Convergentie in de emissie-uitstoot per hoofd- benadering geven relatief strenge reduc-ties voor de Verenigde Staten, Canada en Australië en Nieuw-Zeeland (alleen voor conver-gentie) en relatief minder strenge reducties voor de EU en Japan (alleen Triptiek), omdat deze benaderingen rekening houden met reducties in hert verleden. De uitkomsten voor de
Convergentie in de emissie-uitstoot per hoofd- bendering hangen sterk afhankelijk van het
veronderstelde convergentiejaar (hier 2050). Een vroeger convergentiejaar zou zelfs leiden tot meer reducties voor de VS en minder voor de EU. Benaderingen op basis gelijke marginale reductiekosten wijzen sterke emissiereducties toe aan emissie-intensieve (maar minder rijke regio’s) als de Oekraïne en Rusland, en minder strenge reducties aan Japan en de EU. • De reductiekosten (als percentage van het BBP) geven een brede spreiding uit uitkomsten
voor alle Annex I landen. De reductiekosten (als percentage van het BBP) voor de Annex
I landen liggen tussen 0,1% en 0,3% van het BBP voor het 20% Annex I reductiescenario, 0,3% en 0,6% van het BBP voor de 30% scenario en 0,5% en 1,5% van het BBP voor het 40% scenario. De totale reductiekosten per BBP zijn vrij hoog voor alle benaderingen voor Canada, de VS, Australië en Nieuw Zeeland (regio’s met de hoogste uitstoot per hoofd), en iets lager voor de EU en Japan (regio’s met een gemiddelde uitstoot per hoofd). De kosten vertonen een grote verscheidenheid tussen de benaderingen, vooral voor de gelijke marginale kosten en Triptiek methode. Vooral de kosten (en reductiedoelstellingen) voor de Russische Fede-ratie en de Oekraïne zijn gevoelig voor de gekozen aanpak. Hierbij moet worden opgemerkt dat deze reductiekosten alleen de directe kosten van de desbetreffende reductieactie en geen rekening houden met de macro-economische effecten (als gevolg van de sectorale verande-ringen en (brandstof)handelimpacts).
Samenvatting
• De VS heeft relatief lage reductiedoelstellingen ten opzichte van 1990. De reductie-inspannin-gen voor de VS zijn voor de verschillende benaderinreductie-inspannin-gen gelijk aan 0%, 10-15% en 25-30% ten opzichte van de 1990 niveaus voor het 20%, 30% en 40% Annex I reductie scenario. De gematigde reductiedoelstellingen van de Verenigde Staten ten opzichte van die van de andere Annex I landen zijn een direct gevolg van de veronderstelling dat de Verenigde Staten begint in 2010 vanuit hun nationale emissieintensiteit doelstelling. Deze doelstelling leidt tot hogere baseline emissies dan de historische emissie trend (2001-2006), echter de hier genoemde conclusie dat de Verenigde Staten een relatief lagere doelstelling heeft dan andere landen is robuust. Zowel de nationale doelstelling als de historische emissies liggen ruim boven de voorgestelde Kyoto-doelstelling.
• Een reductie van de EU van minstens 30% gecombineerd met vergelijkbare inspanningen van
andere Annex I landen en voldoende emissiereducties in de ontwikkelingslanden (15-30%) ten opzichte van het referentiescenario is nodig voor het halen van de klimaatdoelstelling
van 2°C. De emissiereductiedoelstellingen voor de EU voor de onderzochte benaderingen
variëren van ongeveer 20-30%, 30-40% en 40-50% reductie ten opzichte van 1990 niveaus voor respectievelijk de 20%, 30% en 40% Annex I reductiescenario’s. Voor sommige van de benaderingen is de emissiereductie voor de EU meer dan de Annex I reductie. Een reductie van de EU van minstens 30% onder het 1990-niveau in 2020, gecombineerd met verge-lijkbare inspanningen voor de andere Annex I landen met emissiereducties zoals berekend volgens deze studie, zou de uiteindelijke Annex I emissies verminderen met tussen de 20 en 30% onder het 1990-niveau in 2020 . Dit is aan de ondergrens van de 25%-40% reductie voor de Annex I die in overweging is bij de Ad-hoc Werkgroep betreffende verdere verplich-tingen voor de Annex I landen onder het Kyoto Protocol (AWG-KP), maar kan nog steeds in overeenstemming zijn met de lange termijn klimaatdoelstelling van de EU om de mondiale temperatuurstijging te beperken tot 2°C boven het pre-industriële niveau. Dit alles onder de voorwaarde dat ook de emissies in de ontwikkelingslanden met voldoende (15-30%) worden gereduceerd ten opzichte van hun emissies in het referentiescenario. De reductiemarges hier gepresenteerd zijn afhankelijk van de gekozen benaderingen, het model en de veronderstel-lingen ten aanzien van de reductiekosten.
• De reducties en kosten van de verschillende benaderingen zijn afhankelijk van een aantal
veronderstellingen over parameterinstellingen, het referentiescenario en de
emissiereductie-kostencurves. De benadering van gelijke reductie ten opzichte van het referentiescenario en
gelijke reductiekosten zijn afhankelijk van het veronderstelde referentiescenario en de
margi-nale reductiekosten. De benadering convergentie in de emissie-uitstoot per hoofd van de
bevolking is sterk afhankelijk van het veronderstelde convergentiejaar en de Triptiekmethode
hangt af van de veronderstelde parameterinstellingen en de toekomstige activiteitenniveaus in de industrie- en elektriciteitssector in het referentiescenario. De gevoeligheidsanalyse van de kostenallocatie benaderingen onder alternatieve marginale emissiereductiekostencurven (en referentiescenario’s) van het POLES model geeft aan dat berekende regionale reducties redelijk robuust zijn, maar verschillende aannames over de emissiereductiekostencurves kunnen een aanzienlijke invloed hebben op de regionale doelstellingen, en vergen daarom nader onderzoek. De POLES model kostenveronderstellingen leiden tot hogere reductiedoel-stellingen voor Australië en Nieuw-Zeeland en de Verenigde Staten, aangezien POLES lagere reductiekosten heeft voor deze regio’s ten opzichte van onze standaard (IMAGE / TIMER MAC) kosten. POLES geeft ook lagere reducties voor de EU en Japan. Bijvoorbeeld, in het kader van het 30% Annex I reductie wordt de EU reductie 25-38% ten opzichte van 1990 niveaus in plaats van 30-40% voor onze standaard (IMAGE / TIMER MAC) berekeningen. Voor de VS geldt onder dezelfde 30 % Annex I reductie een reductie van 15-20 % ten opzichte van 1990 in plaats van 10-15 %. De resultaten tonen een grote onzekerheid op de totale kosten voor de
Annex I onder het 20% en een 30% Annex I reductiescenario in 2020, en nog meer op het niveau van landen, zoals voor Canada. Deze onzekerheden hangen ook af van verschillen in de referentiescenario’s.
• De resultaten hangen ook af van de gekozen aanpak en andere factoren, zoals
landgebruiks-verandering gerelateerde emissies. Afgezien van de onzekerheden met betrekking tot het
referentiescenario en de marginale reductiekostencurves, zijn de berekende reducties ook gerelateerd aan de keuze die we gemaakt hebben ten aanzien van de benaderingen, en de gemaakte veronderstellingen hiervoor. Bovendien houden we onvoldoende rekening met een (gedetailleerde) uitwerking van de landgebruikverandering gerelateerde emissies. Verschil-lende regels voor het wel meenemen hiervan kan van invloed zijn op de resultaten, vooral voor de Annex I landen met een aanzienlijk aandeel van deze “emissies”, zoals Australië, Canada en Rusland.
Dit onderzoek is een eerste poging om vergelijkbare inspanningen voor Annex I landen te defi-niëren en analyseren. Verdere analyses met meerdere en verschillende modellen, met inbegrip van macro-economische modellen, zijn wenselijk om te komen tot meer robuuste resultaten en gedeelde inzichten.
Tot slot blijkt uit deze analyse dat alleen een compromisvoorstel aantrekkelijk kan zijn voor alle landen. Deze studie onderzocht verschillende benaderingen, variërend van zeer eenvoudig (gelijke procentuele vermindering) tot zeer complex (gelijke kosten benadering). Elke bena-dering is voor landen respectievelijk meer of minder aantrekkelijk. Een eenvoudige benade-ring kan alleen maar dienen als een algemene oplossingsrichting. Een uiteindelijk akkoord over een internationaal klimaatregime, en ook de benadering van de lastenverdeling binnen Annex-I landen, zal waarschijnlijk gebaseerd worden op een samengestelde formule die reke-ning houdt met de verschillende nationale bezwaren, en zal uiteindelijk moeten leiden tot een onderhandelingscompromis.
Summary
Summary
As the international negotiations on a new climate agreement advance, the issue of compara-ble efforts between countries becomes increasingly important. In March 2007, the EU decided to adopt the unilateral target of reducing its greenhouse gas (GHG) emissions by 20% in 2020, compared to 1990 levels. It also declared a willingness to reduce its emissions by 30% as a contribution to a global and comprehensive agreement for the period beyond 2012 – with two provisos. Firstly, other developed countries must commit themselves to comparable emission
reductions. Secondly, economically more advanced developing countries must also contribute
proportionally in accordance to their responsibilities and respective capabilities. The aim of this report is to provide insights in options for elaborating the concept of comparable emission
reductions for developed countries within the framework of a future international climate
agree-ment, beyond 2012. The thirteenth Conference of the Parties (COP 13) to the United Nations Framework Convention on Climate Change (UNFCCC), in Bali in December 2007, called for mitigation commitments or actions by all developed countries, while ensuring the comparability
of efforts among them.
This report first describes possible conceptual approaches to assess the comparability of Annex I countries 1) GHG mitigation efforts, assessing both the pros and cons of each approach. Six approaches were selected for quantification based on the criteria of representation of efforts and technical feasibility. The selected approaches are:
equal percentage reduction below a baseline scenario 1.
equal marginal abatement costs (
2. MAC)
equal abatement costs as a percentage of the gross national product [
3. GDP; excluding
interna-tional emissions trading and clean development mechanism (CDM)] equal abatement costs as a percentage of the
4. GDP (including international emissions trading
and CDM)
converging per capita emissions (i.e. equal per capita emissions by a certain year; here taken 5.
to be the year 2050)
Triptych approach (i.e. allocating future reductions among countries based on converging 6.
technological standards or targets at the sectoral level, accounting for structural differences.) The first four approaches focus on an ‘equal future burden’, such as equal costs, and depend on the future reference scenario and (for the costs approaches) on assumptions on abatement costs; they do not take past efforts into consideration. The last two approaches focus on ‘an equal endpoint’, such as converging per capita emissions or energy efficiencies and are, therefore, less dependent on a reference scenario. These approaches do acknowledge past abatement actions. The report analyses the implications of each of these six approaches in terms of the future reductions and abatement costs that must be made by different Annex I countries in order to meet the overall Annex I reduction targets. This analysis has been elaborated for three ‘Annex
I comparable’ scenarios that have a reduction target for 2020 of an aggregate GHG emission
reduction by Annex I countries of –20%, –30% and –40%, respectively, below their 1990 levels (Kyoto basket of six GHGs). We assumed that the emissions of non-Annex I countries as a
1 Annex I Parties include the industrialized or developed countries that were members of the OECD (Organisation for Economic Co-operation and Development) in 1992, plus countries with economies in transition, including the Russian Federation, the Baltic States, and several Central and Eastern European States.
group would have to be below the baseline by 10%, 16% and 22%, by 2020, to achieve atmosp-heric concentration stabilisation at 550, 450 and 400 parts per million carbon dioxide equivalent (ppm CO2eq), respectively. In a final analysis, we assessed the robustness of the results for alter-native marginal abatement costs (MACs). The most important findings of this study are:
• The choice of the aggregate Annex I reduction level is of major importance. The choice of the overall Annex I reduction target is, for most countries, of major importance, as the difference in reduction between the 20%, 30% and 40% Annex I reduction scenarios, usually, is larger than the difference between the various approaches aiming for the same Annex I reduction target.
For all Annex I countries under all six approaches, significant reductions from baseline levels •
are necessary for meeting the aggregate Annex I reduction targets.
• Looking at reductions below 1990 levels only, is not a method for measuring comparable
effort. The Ukraine and the Russian Federation will achieve the largest reduction, compared
to 1990 levels, as their emissions have declined rather than increased, since 1990. In our calculations, their emission levels by the year 2010 have been taken as the reference or base-line emission levels, which are well below their Kyoto target. The next highest reductions are found for the EU, for which emissions have levelled off, since 1990, and are not expected to grow much in the baseline scenario. The EU is followed by Canada and, to a lesser extent, by Japan and the USA, the latter of which has had a significant increase in emissions, since 1990, which are expected to continue to grow. In the ‘20%’ and even the ‘30% Annex I compara-ble’ scenarios, Australia and New Zealand are, in most cases, still allowed an increase from 1990 levels, but this could be different if land-use emissions were to be fully included in the analysis. The Triptych and converging per capita emissions approaches show relatively strin-gent reductions for the USA, Canada and Oceania (i.e. Australia and New Zealand) (only in the convergence approach) and relatively less stringent reductions for the EU and Japan (only in the Triptych approach), as these approaches both acknowledge past actions. The outco-mes for the converging per capita emissions approach are highly dependent on the assumed convergence year (here 2050). An earlier convergence year would assign even more stringent reductions to the USA and less stringent ones to the EU. Approaches based on mitigation potentials (equal marginal costs) assign stringent reductions to the emission-intensive (but less rich) regions, such as the Ukraine and Russian Federation, while assigning less stringent reductions to Japan and the EU.
• The abatement costs (as a percentage of GDP) also show a wide range for all Annex I
coun-tries. The abatement costs (as a percentage of GDP) for the Annex I countries generally range
between 0.1% and 0.3% of GDP in the ‘20% Annex I comparable’ scenario, between 0.3% and 0.6% of GDP in the ‘30% Annex I comparable’ scenario and between 0.5% and 1.5% of GDP in the ‘40% Annex I comparable’ scenario. Total abatement costs per GDP mostly tend to be relatively high in all the approaches for Canada, USA and Oceania (regions with the highest per capita emissions) and somewhat lower for the EU and Japan (regions with medium per capita emissions). There is a wide range of costs between the approaches explo-red, particularly for the equal marginal costs and Triptych cases. The abatement costs (and reduction targets) for the Russian Federation and the Ukraine are particularly sensitive to the allocation approach chosen. It should be noted that these costs only capture the direct costs of the abatement action and do not take into account macroeconomic impacts [due to sectoral changes and (fuel) trade impacts].
The
• USA has relatively low reduction targets for 2020, compared to 1990 levels, when star-ting from their national target, in 2010, and not from their Kyoto target. Emission reduction efforts by the USA would consist of a range of reduction targets of near 0%, 10 to 15% and 25 to 30% below 1990 levels, in the ‘20%’, ‘30%’ and ‘40% Annex I comparable’ scenarios,
Summary
respectively. The relatively modest USA reduction targets – in comparison to those for other developed countries – are a direct result of the assumption that, in 2010, the USA will start from their national target. The national target leads to higher baseline emissions compared to the historical emission trend (2001-2006). However, the conclusion above that the USA has relatively low target compared to other countries is robust. Both the national target and historical emissions are well above their proposed Kyoto-targets.
Reductions by the
• EU of at least 30%, combined with comparable efforts by other Annex I
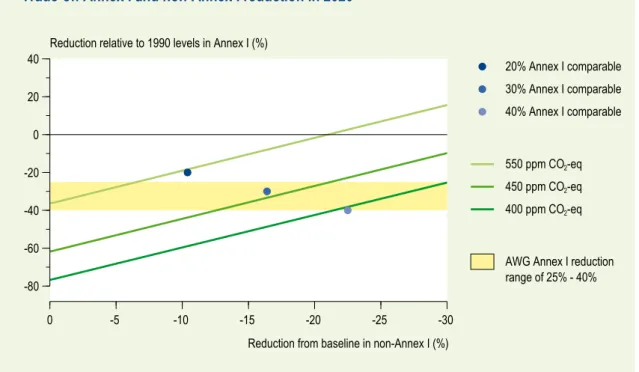
countries and with support for developing countries to keep emissions substantially below baseline (about 15 to 30%) would be sufficient to secure the climate goal of 2°C. The emis-sion reduction targets for the EU, for the cases explored, range from about 20 to 30% to 30 to 40% and 40 to 50% below 1990 levels, in the ‘20%’, ‘30%’ and ‘40% Annex I compa-rable’ scenarios, respectively. For some of the approaches, the EU would have to reduce its emissions more than to the average Annex I level. This implies that if the EU were to reduce its emissions by 30% below the 1990 level, by 2020, and if other Annex I countries would undertake a ‘comparable effort’ according to the approaches analysed here, the overall reduction for Annex I countries would be between 20% and 30% below the 1990 level. This target would be at the lower end of the 25% to 40% reduction range considered by the Ad Hoc Working Group on Further Commitments for Annex I Parties under the Kyoto Protocol (AWG-KP). However, it would still be consistent with the EU long-term climate goal of limi-ting the global temperature increase to 2°C above pre-industrial levels, as this range corres-ponds with the stabilisation of GHG concentrations at 450 ppm CO2eq, provided that emis-sions in developing countries also deviate substantially from the baseline scenario (about 15 to 30%). The ranges found are also dependent on the cases explored and the model and cost assumptions made.
The reductions in and costs of the various approaches as presented above are dependent on •
many assumptions on the parameter settings, the baseline and on the MAC curves used. As such, the approaches equal percentage reduction from a baseline and equal abatement costs depend on the assumed baseline and marginal abatement costs. The converging per capita emissions approach depends on the assumed convergence year and the Triptych approach depends on the assumed parameter settings and baseline activity levels. When using one set of alternative MAC curves (and baselines projections) from the energy system model POLES, our assessment has shown that − while the pattern of reductions found seems to be rather robust − different assumptions on MAC can have a considerable influence on regional targets and, therefore, require further study. The assumptions in the POLES model result in a higher reduction range for Oceania and the USA, and in a lower range for the EU and Japan. For example, for the 30% Annex I reduction scenario, the EU reduction range becomes 25 to 38% below 1990 levels, instead of the 30 to 40% determined by using our default (IMAGE/TIMER MAC) calculations. For the USA, under the same 30% Annex I reduction scenario, the range becomes 15 to 20% below 1990 levels, instead of 10 to 15%. The results show a considerable uncertainty in the overall costs for Annex I countries, in terms of achieving an overall reduc-tion of 20% and 30%, by 2020, and at country level (e.g. for Canada) these uncertainties are even greater; the uncertainties are also related to differences in baseline projections.
• The outcomes also depend on the selected approaches and other factors, such as land-use
emissions. Apart from uncertainties related to the baseline assumptions and the MAC curves
used, the ranges need to be used cautiously, as they are contingent on the approaches inclu-ded in the analyses and the modelling assumptions. Moreover, (detailed) inclusion of emis-sions from land use and land-use changes and forestry (LULUCF) – possibly according to different rules – could affect the outcomes, particularly for Annex I countries with a signifi-cant share in these emissions, such as Australia, Canada and the Russian Federation.
Other main findings can be found in Chapter 7.
This study was a first attempt at exploring how comparable efforts could be defined. Further analyses involving more and different models, including macroeconomic models, would be needed for obtaining more robust results and common insights.
Based on the results of our analysis, we conclude that a compromise is probably the most attrac-tive approach, for all countries. This study has tested several approaches, varying from the very simple (equal percentage reduction) to the very complex (equal costs approach). Each approach has different characteristics that make it more – or less – attractive to any one (or more) of the Annex I countries. It would appear that any simple approach can, therefore, only serve as a general indicator of direction. The final agreement on an international climate change regime and also on the concept of burden-sharing within the Annex I countries, is likely to be based on an approach with a complex formula that accounts for various national concerns and, ultimately, will be a negotiated compromise.
Introduction 1
1 Introduction
The objective of this report is to provide insights into the various options/approaches that can be used to characterise the concept of comparable efforts for developed countries in a future international climate agreement, to be in place by 2012. Negotiations on this topic have already been initiated, with the aim of being finalised by the end of 2009. This report provides Parties (countries) with accurate information on the implications of the approaches that could be used for comparing mitigation efforts between developed countries.
Two processes, both under the auspices of the United Nations Framework Convention on Climate Change (UNFCCC), have been initiated with the objective of negotiating a future inter-national climate agreement, post-2012. Working within the framework of the Kyoto Protocol, the Ad Hoc Working Group on Further Commitments for Annex I Parties under the Kyoto Protocol (AWG-KP) has started to explore possible new commitments for developed countries, to take on, beyond 2012. This forum excludes the USA, which is not a party to the Kyoto Protocol. Within the framework of the UNFCCC, the Parties, together with the USA 1), reached an agreement on the Bali Action Plan in Bali (2007), to start negotiations on five building blocks – shared vision, mitigation, adaptation, technology and financing – within the Ad Hoc Working Group on long-term cooperative action (AWG-LCA). Both working groups intend to finalise their work by the end of 2009. The subjects under discussion relate to emission reduction efforts required from developed countries and a proportional distribution of reduction commitments between the various Parties. The Bali Action Plan aims for ‘comparable efforts’ by all developed countries. In March 2007, the European Union (EU) decided to adopt a unilateral target of reducing its greenhouse gas (GHG) emissions by 20%, by 2020, compared to 1990 levels, and declared its willingness to reduce emissions by 30%, as the EU’s contribution to a global and comprehen-sive agreement for the period beyond 2012, provided that other developed countries commit themselves to comparable emission reductions and that economically more advanced develop-ing countries also contribute, proportionally, accorddevelop-ing to their responsibilities and respective capabilities. By adopting a 20% unilateral target and proposing a 30% target as part of a broader post-2012 agreement, thus indicating the level of commitments they are willing to adopt, the EU has moved ahead of the AWG-KP process and put pressure on other developed countries to follow suite. However, the EU has also agreed to allow its Member States to deviate from the adopted 30% reduction target. Consequently, although in principle the EU also demands a 30% reduction from other Annex I Parties, it will also have to consider both the concept of differen-tiation of reduction efforts amongst other Annex I countries, as well as level of deviation it finds acceptable.
In August 2007, the Parties to the AWG-KP agreed that a reduction in GHG emissions by Annex I countries in a range of 25 to 40% below 1990 levels, by 2020, would provide a practical basis for further consideration. The reduction range of –25% to –40% refers to Box 13.7 in the Working Group III report of the Fourth Assessment report of the Intergovernmental Panel on Climate Change (IPCC AR4; Gupta et al., 2007). This range is understood to be the overall group reduction, as reductions by individual countries have not yet been specified. In line with
its working programme, the AWG-KP is discussing the means for reaching emissions reduction targets, before turning to the topic of the differentiation between reduction target levels, in 2009. At the thirteenth Conference of the Parties (COP 13) in Bali, in December 2007, the issue of the reduction range for Annex I countries was discussed again, this time with all countries, includ-ing the USA. Initial drafts by the EU called for the same wordinclud-ing as already agreed on under the Kyoto Protocol. However, ultimately, there was a lack of consensus on the reduction percentages in the negotiations under the Convention and, instead, the Bali Action Plan recognised that ‘deep cuts’ in GHG emission levels would be needed and a reference to the IPCC AR4 was included in a footnote. The action plan also called for enhanced action on the mitigation of climate change, by both developed and developing countries, and for ‘Measurable, reportable and verifiable
nation-ally appropriate mitigation commitments or actions’, including quantified emission limitation
and reduction targets, by all developed country Parties. Meanwhile ensuring that ‘efforts would
be comparable, for developed and developing countries, taking into account the differences in
their national circumstances’.
Thus, the issue of comparability of effort is an important component of EU policy and in UNFCCC discussions. It, therefore, has been the focus of substantial attention.
The issue of comparable emission reduction efforts is particularly relevant among the Annex I countries, as these have reached a relatively comparable level of development (even though a large difference in development between a few Annex I Parties still remains). Defining compa-rable efforts for countries at very different levels of development is much more difficult and, in fact, would relate to equitable levels of commitment that also account for differences in respon-sibility and development needs. Some Annex I Parties may also want to extend the concept of comparability to developing countries, as these Parties view some degree of effort by develop-ing countries as a (pre-)condition for their own participation and commitment. A number of the more advanced developing countries (e.g. South Korea and Mexico) have, in fact, reached levels of economic development, comparable to some of the poorer Annex I countries. However, including developing countries in this discussion on emissions reduction efforts, is beyond the scope of this report. Instead, we have made simple assumptions, where necessary, on mitigation actions by developing countries, in accordance with common but varying responsibilities and respective capabilities for the few cases where this would have an impact on efforts by devel-oped countries, due to international trading of emission allowances.
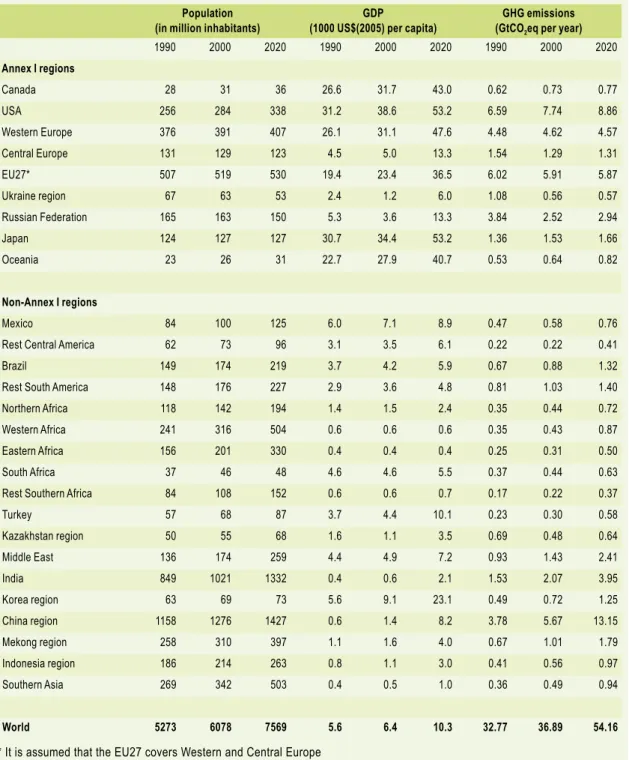
Table 1.1 provides an overview of some basic indicators for Annex I countries. It shows the diversity in countries, in terms of trend since 1990, emissions per gross domestic product (GDP) and per capita.
In the discussion on future differentiation between Annex I countries, the USA plays a particu-larly important role. It abandoned its 7% reduction target for the first commitment period of the Kyoto Protocol and has had a major increase in its GHG emissions since 1990 (+16% in 2006). The US Senate has proposed a number of measures pertaining to countrywide emission reduc-tion targets for GHG, but none of these are as ambitious as the EU targets. At most, the proposed US measures are aimed at a return to 1990 emission levels, by 2020 (for an overview of those proposals and its implications, see Paltsev et al., 2007). In informal policy discussions, some Parties have indicated that the USA should not be rewarded for refusing to take on a target for the first commitment period of the Kyoto Protocol, while others have pointed at the differences in baseline developments (e.g. population growth) between the EU and the USA, which make it
Introduction 1
inconceivable for the USA to make up for not meeting its 7% reduction target under the Kyoto Protocol.
In the USA, the discussion around climate change policy is very much domestically oriented, focusing on what the USA can do at home and generally irrespective of international agreements. Moreover, the process of having an international climate change agreement ratified in the USA is very difficult, and it may well be impossible for the USA to become a Party to any new inter-national regime, within a short time frame. It is, therefore, quite conceivable that the EU will be confronted with a situation in which the USA is willing and able to act at home, but not interna-tionally. Such a scenario may not necessarily hamper a new international agreement, provided that the domestic effort of the USA is considered to be significant and comparable to the efforts of other Parties under the post-2012 agreement. The conditions pertaining to such a significant and comparable effort by the USA, are as yet unclear.
Given this background, this report provides the following:
Indicators for comparing commitments among Annex I Parties (Chapter 2). It lists the a.
various indicators that could be used to define the comparable GHG mitigation efforts by Annex I countries. We have assessed whether these indicators adequately reflect comparable efforts and whether their implementation is technically feasible. Based on this evaluation, we have selected a number of indicators for further consideration in the following chapters. Comparable absolute emission reduction targets, based on the indicators selected (Chapter b.
4). We have provided three Annex I reduction scenarios of varying overall stringency, for the aggregate reduction of 20%, 30% and 40%, respectively, below the 1990 level, by 2020.
Table 1.1 Basic indicators for Annex I countries
Party GHG emissions
in 2006 (MtCO2eq)a
Change in GHG emissions from base
year to 2006 (%)b
GHG emissions/ GDP PPP in 2006
(tCO2eq/USD 1,000)
GHG emissions/
capita in 2006(tCO2eq)
Australia 536 29% 0.75 25.9 Belarus 81 -36.4% 0.88 8.3 Canada 721 22% 0.62 22.1 Croatia 31 -5.2% 0.50 6.9 Iceland 4 24% 0.39 14.0 Japan 1,340 5% 0.34 10.5 New Zealand 78 26% 0.75 18.6 Norway 54 8% 0.24 11.5 Russia 2,120 -36.0% 1.62 14.7 Switzerland 53 0.8% 0.20 7.1 Turkey 332 95% 0.56 4.5 Ukraine 443 -51.9% 1.57 9.5 USA 7,017 14% 0.55 23.4 EU 27 5,139 -16.2% 0.38 10.5 Annex I 17,483 –5.5 0.50 14.1
a Excludes land use and land-use change and forestry (LULUCF) CO
2 emissions and excludes international transport.
b Base year is 1990, except for Bulgaria (1988), Hungary (average of the years 1985–1987), Poland (1988), Romania (1989) and
Slovenia (1986). Some countries chose 1995 as the base year for fluorinated gases. Sources: Inventory submissions to the UNFCCC, World Bank Development Indicators
Defining ‘comparable efforts’ 2
2 Defining ‘comparable efforts’
Two issues need further exploration in defining comparable efforts: (a) comparability of differ-ent types of commitmdiffer-ents and (b) differdiffer-entiation between efforts by countries with differdiffer-ent national circumstances. These are discussed below.
Different types of commitment may complicate a comparison of Parties’ efforts, because
some Parties may prefer to make commitments that are not directly related to absolute emission reduction targets. After all, the Bali Action Plan speaks of ‘mitigation commitments or actions’ that may include other types of commitment.
In the past, the US administration has shown a preference for relative and non-binding emis-sion targets and for technology-oriented agreements, although the current position of the USA is unclear. The types of commitment to adopt after Kyoto is also the subject of much debate in Japan (IGES, 2005; Sawa and Fukushima, 2007). Japan currently supports the Asian Pacific Part-nership initiative, which is based on technology cooperation, and for some time has appeared to be expressing doubt on the appropriateness of absolute binding emission targets. For example, at the UNFCCC meeting in Bangkok, in April 2008, Japan proposed using the sectoral analysis of efficiencies as the basis for future commitments, although it did not specify whether the commitment would be targeted at reaching a certain level of efficiency or at the resulting emis-sion reductions. The EU, New Zealand, China and Canada all stressed that sectoral approaches should support, not replace, national targets. Many observers interpreted Japan’s reaction at the Bangkok meeting as another indication of acceptance of absolute binding emission targets. In some proposals for post-2012 regimes, Annex I countries are offered the choice of different commitment types (Kameyama, 2004). In the Sao Paulo proposal (see http://www.basic-project. net/), Annex I countries would even be able to choose for a combination of absolute and/or rela-tive emission targets and a financial payment into international technology and adaptation funds. This proposal provides a methodology for determining the level of financing that can compen-sate for a less ambitious emission reduction target. Other proposals have stated that commit-ments can be binding or non-binding. Such proposals raise the question of how these diverse
commitments could be compared, in terms of the different levels of effort they would represent.
It is possible to make these different commitments comparable by applying, for example, a common metric, as most of them can be transformed into absolute emissions. However, this still leaves the question of when reductions would occur: for emission targets, this is well defined; for technology research and development (R&D), however, it would be at some time into the future. The non-binding or binding character of a commitment would also have to be translated into the likelihood of achieving emission reductions, which could be accomplished by attaching a greater uncertainty to the likelihood of emission reductions in non-binding commitments. In this report, we have made no further attempt to compare the level of effort required for the different commitments, since apart from by the EU there are no other commitments on the table, at the present time. Rather, we have adopted a top-down approach, looking at indicators that describe comparable efforts and calculating emission targets according to these indicators, using the FAIR model (Den Elzen and Lucas, 2005) (Chapter 3). These emission levels could then be compared to countries’ (future) commitments.
Differentiating between efforts by countries in different national circumstances is another
issue. ‘Comparable’ does not necessarily mean ‘equal’. The concept of comparability of efforts can incorporate the notion of equal treatment of Parties in similar circumstances. Countries at a similar level of socio-economic development should make similar contributions to climate change mitigation. However, there are significant differences between the national circum-stances in developed countries, which need to be taken into account, including whether a country has made any efforts in the past. The concept of comparing efforts between developed countries, thus, implies efforts in equal proportion rather than equal in size. Comparability should give countries a feeling of fairness that would provide a background for solidarity and political consensus on the actions to be taken by them. This feeling of fairness would also provide politicians with a basis for convincing their constituents of the success of the negotia-tions. However, in practice, the outcome will also be determined by Parties’ relative willingness to act. This differentiation between efforts is the focus of this report.
For the purpose of this report we have distinguished between two conceptual approaches for assessing comparable efforts: equal burden and equal endpoint:
Equal future burden:
• The first and more common approach is to define the problem as a
burden that needs to be shared fairly by all countries. The efforts to be compared relate to the needed change in the current state or the change in a likely reference development. This perspective focuses on future efforts and, usually, neglects differences in starting points due to (in)actions that have taken place in the past.
• Equal endpoint: The second approach is to assess the efforts needed for reaching the same
state in the future, such as those defined in terms of efficiencies. This perspective accounts
for differences in starting points. Countries that already have undertaken efforts in the past are, usually, closer to the endpoint and will not have to undertake as much effort in the future.
These two concepts are described in more detail in the following sections.
2.1
Equal future burden
The first approach defines the problem as being a future burden that needs to be distributed fairly between countries. When this approach would be adopted, the first step would be to define the burden, such as in terms of emissions avoided or additional costs. In any metric, the burden always consists of the difference between a reference case and a desired development. The second step is to distribute this burden fairly between countries, taking into account the different national circumstances.
The major advantage of this approach is that its aim is to quantify each country’s effort. Each country carries the same burden. This concept can be considered to be fair, as each country is making a contribution to solving the common problem.
The major disadvantages of this approach include:
The development in the reference case is always hypothetical. It is intended not to take place, •
so the accuracy of the scenario cannot be proven, ex post.
The reference case is based on assumptions on production patterns and lifestyles. These may •
converge, but some differences will remain between the reference scenarios for the differ-ent countries. For example, a country in which people drive larger cars will have a reference
Defining ‘comparable efforts’ 2
scenario that also reflects this, and, therefore, it would have to make a greater effort to reduce the emissions from these cars.
Efforts of the past are not acknowledged. This means that a country which has already •
reduced its emissions, still will have to make a future ‘effort’ that is comparable to that made by a country that has reduced no emissions in the past.
There are a number of possible options for determining the ‘comparable efforts’ associated with the concept of equal future burden:
equal percentage reduction in emissions, below base year −
proportional, according to simple criteria for differentiating between reductions −
equal percentage reduction in emissions, below a reference or baseline scenario −
equal marginal abatement costs −
equal total abatement costs per
− GHG reduced (€/tCO2eq)
equal total abatement costs per (current)
− GDP
equal total abatement costs per capita −
equal macroeconomic burden −
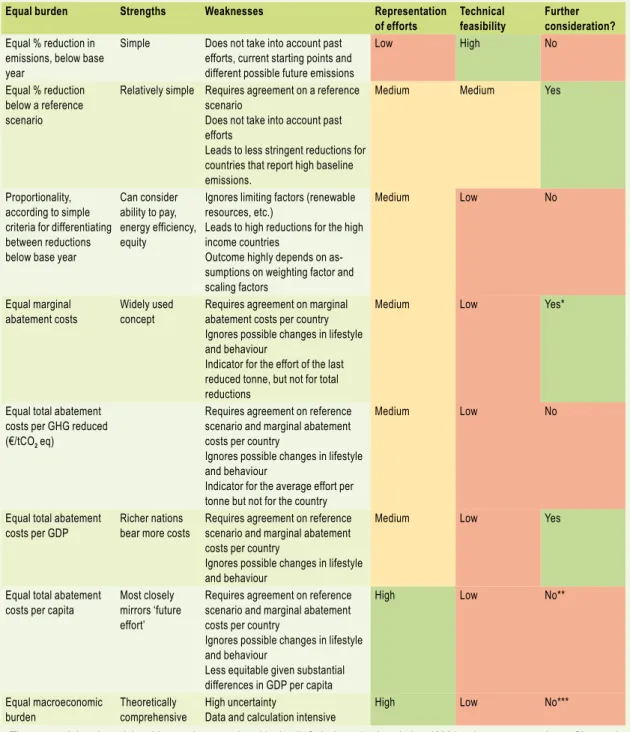
The various advantages and disadvantages of these options are described in more detail in the following subsections. We have also assessed whether any of these options could be used for detailed modelling (Chapter 3). The two criteria used for determining the suitability of the options for modelling are:
Representation of efforts:
1. All approaches intend to represent comparable efforts, but some
may be too simplistic or be misleading and, therefore, fail to give the right direction.
Technical feasibility:
2. Are data and tools available for calculating the efforts under this
approach?
We have summarised the evaluations inTable 2.1 and Table 2.2.
2.1.1 Equal percentage reduction in emissions below base year
This approach requires all countries to achieve a certain equal percentage reduction in their emissions, by a target year, compared to a base year.
A similar (not equal) percentage reduction below a base year was used for setting the emission reduction targets for Annex I countries in the first commitment period of the Kyoto Protocol. When the targets were negotiated, one requirement was that Annex I countries as a group reduce emissions by 5% below the 1990 level. The percentages of individual countries were adjusted upwards and downwards during the negotiations, taking into account national circumstances. For a detailed discussion, see Depledge (2000).
An approach involving the application of equal percentage reductions below a base year, can be easily implemented, since accurate figures on base year emissions are readily available. It is too simplistic, however, as it does not take into account national differences in future emission developments, base year emissions or past efforts, among others.
Using the EU and USA as examples, Figure 2.1 illustrates the implications of this option. Emis-sions in the USA have increased, up to 2005; consequently, to reach a level that lies 25% below that of 1990, requires the USA to achieve larger reductions than is required of the EU, for which the emissions have decreased since 1990. The figure also shows that the choice of base year is
important. Choosing 1990 as the base year would factor in past developments and efforts. Using 2005 as the base year would neglect efforts made before that year.
This approach seems to be rather simplistic and does not represent a good measure of compara-ble effort. Therefore, it will not be considered for further study here, although it does illustrate the need for differentiation between countries, to arrive at comparable efforts.
Table 2.1 Sharing approaches and their strengths and weaknesses – Equal future burden
Equal burden Strengths Weaknesses Representation
of efforts Technical feasibility Further consideration? Equal % reduction in
emissions, below base year
Simple Does not take into account past efforts, current starting points and different possible future emissions
Low High No
Equal % reduction below a reference scenario
Relatively simple Requires agreement on a reference scenario
Does not take into account past efforts
Leads to less stringent reductions for countries that report high baseline emissions.
Medium Medium Yes
Proportionality, according to simple criteria for differentiating between reductions below base year
Can consider ability to pay, energy efficiency, equity
Ignores limiting factors (renewable resources, etc.)
Leads to high reductions for the high income countries
Outcome highly depends on as-sumptions on weighting factor and scaling factors Medium Low No Equal marginal abatement costs Widely used concept
Requires agreement on marginal abatement costs per country Ignores possible changes in lifestyle and behaviour
Indicator for the effort of the last reduced tonne, but not for total reductions
Medium Low Yes*
Equal total abatement costs per GHG reduced (€/tCO2 eq)
Requires agreement on reference scenario and marginal abatement costs per country
Ignores possible changes in lifestyle and behaviour
Indicator for the average effort per tonne but not for the country
Medium Low No
Equal total abatement costs per GDP
Richer nations bear more costs
Requires agreement on reference scenario and marginal abatement costs per country
Ignores possible changes in lifestyle and behaviour
Medium Low Yes
Equal total abatement costs per capita
Most closely mirrors ‘future effort’
Requires agreement on reference scenario and marginal abatement costs per country
Ignores possible changes in lifestyle and behaviour
Less equitable given substantial differences in GDP per capita
High Low No**
Equal macroeconomic burden
Theoretically comprehensive
High uncertainty
Data and calculation intensive
High Low No***
v: The approach is selected, but this case is not analysed in detail. Only the reductions below 1990 levels are presented, see Chapter 4.
*: The approach is selected for further analysis, because it is commonly used, although it does not score well when using the criteria. **: This approach is not considered further, as it is less equitable given substantial differences in GDP per capita, although it does mirror future effort well.
Defining ‘comparable efforts’ 2
Table 2.2 Sharing approaches and their strengths and weaknesses – Equal endpoint
Equal endpoint Strengths Weaknesses Representation
of efforts
Technical feasibility
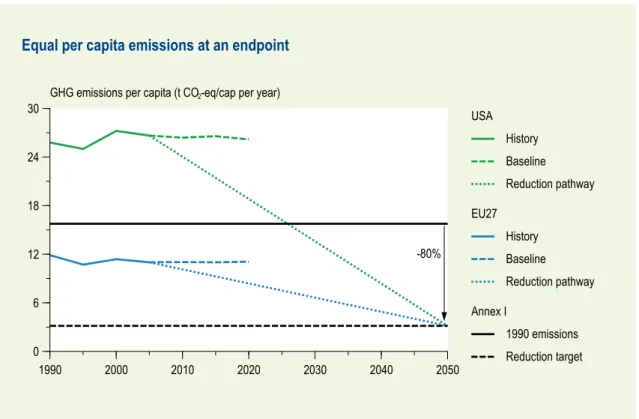
Further consideration? Equal per capita
emissions at an endpoint
No reference scenarios needed Simple
Not taking into account national circumstances
Medium High Yes
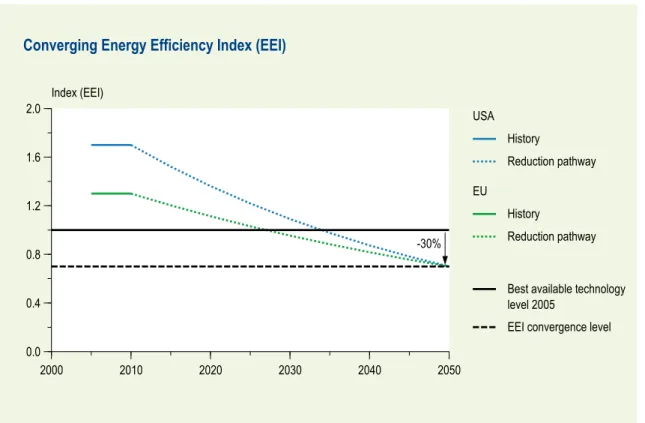
Achieving equal efficiency levels per sector
No reference scenarios needed for production Sectoral consideration allows detailed consideration of mitigation potential Internationally competing industries are treated the same in all countries
Data intensive
Efficiency indicators may not be defined for all sectors Efficiency endpoints need to be defined
May not allow emission trading Environmental effectiveness uncertain
High Low No
Triptych approach National circumstances are explicitly accommodated Explicitly allows for economic growth at improving efficiency in all countries Aims to put internationally competitive industries on same level
Complexity of the approach requires many decisions and sectoral data, making global application a challenge, and it may be perceived as not being transparent
Agreement on required projections of production growth rates for heavy industry and electricity may be difficult
High Medium Yes
1990 1995 2000 2005 2010 2015 2020 2025 0 2000 4000 6000 8000
10000 GHG emissions (Mt CO2-eq) USA History Reduction pathway Base year EU27 History Reduction pathway Base year
Equal reduction below base year
-25% -25%
Figure 2.1 Illustrative example of equal reduction below base year (example here: – 25% from 1990 to 2020)
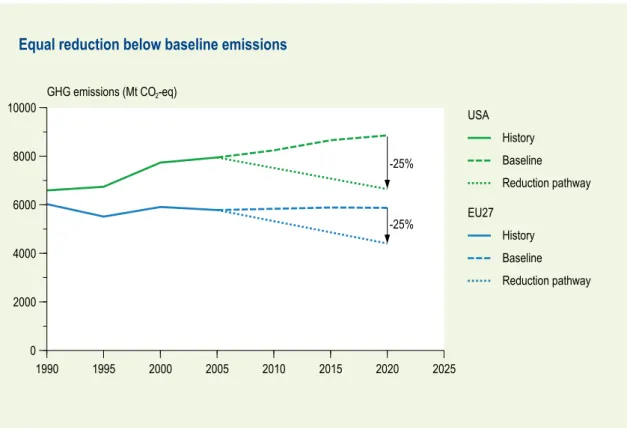
2.1.2 Equal percentage reduction below a reference scenario
An equal percentage reduction below a reference or Business-As-Usual (BAU) scenario is a simple approach for implementing simple relative reductions. Emissions have to be a certain equal percentage below the emission level in a scenario.
The results are highly dependent on the assumed reference scenario, and countries need to agree on the reference scenario chosen. Countries with a higher emission level in their refer-ence scenario, may have to make less of an effort to achieve the reductions (see Figure 2.2). Thus, this provides an incentive for Parties to inflate their reference projections. Such reference scenarios, usually, are the result of often unclear model calculations that depend on the inclusion of various assumptions. Moreover, a reference scenario always will be hypothetical, as it cannot be validated ex post. Reaching agreement on these scenarios, therefore, may be difficult.
In this approach, possible changes in future emissions are estimated within the constraints of the reference scenario, but past efforts are disregarded.
As this approach does account for the impact of trends, such as population, it can be considered to be a relevant representation of effort. In addition, it is relatively simple to implement. There-fore, we will study it in more detail in the following chapters.
1990 1995 2000 2005 2010 2015 2020 2025 0 2000 4000 6000 8000 10000 GHG emissions (Mt CO2-eq) EU27 History Baseline Reduction pathway USA History Baseline Reduction pathway
Equal reduction below baseline emissions
-25% -25%
Figure 2.2 Illustrative example of equal reduction, relative to a reference scenario (example here: –25 % from BAU in 2020)
Defining ‘comparable efforts’ 2
2.1.3 Proportional, according to simple criteria for differentiating between reductions
Several options have been proposed for differentiating between percentage reductions below a base year, proportionally per country, using certain simple indicators or criteria. We will discuss two illustrative options here.
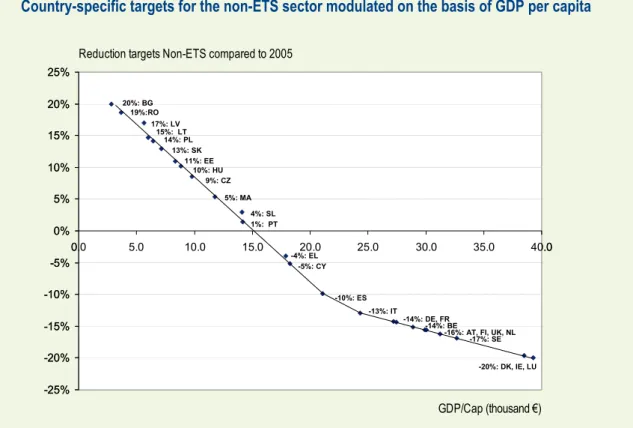
The European Commission has proposed that emission reductions within the EU be shared for those sectors not included in the Emissions Trading Scheme, and that this sharing be almost proportional to GDP per capita (EC, 2008). Figure 2.3 shows the required reductions/allowed increases as a function of GDP per capita. This proposal is based on the assumption that the higher the GDP per capita, the more stringent the required reduction percentage. The underly-ing philosophy is that the ‘effort’ by the wealthiest country of reducunderly-ing its emissions by 20%, is comparable to the effort by the least wealthy country of limiting its emission growth to +20%. Another simple option is a multi-criteria approach, as proposed during the Kyoto Protocol nego-tiations (see Torvanger and Godal, 2004). It comprises a differentiation between emission reduc-tions, based on a multi-criteria rule containing indicators for energy efficiency (emissions per unit of GDP), equity (emissions per capita) and the ability to pay (GDP per capita). The approach is similar to the one recently taken by the European Commission, but is not only based on GDP per capita, but also on three indicators. Deviation from the assumed overall reduction target for
Country-specific targets for the non-ETS sector modulated on the basis of GDP per capita
Taken from: The Impact Assessment: document accompanying the Package of Implementation measures for the EU's objectives on climate change and renewable energy for 2020
-25% -20% -15% -10% -5% 0% 5% 10% 15% 20% 25% 0.0 5.0 10.0 15.0 20.0 25.0 30.0 35.0 40.0 20%: BG 19%:RO 17%: LV 14%: PL 13%: SK 11%: EE 10%: HU 9%: CZ 5%: MA 1%: PT -5%: CY -10%: ES -13%: IT -14%: DE, FR -14%: BE
-16%: AT, FI, UK, NL -17%: SE 15%: LT 4%: SL -4%: EL -25% -20% -15% -10% -5% 0% 5% 10% 15% 20% 25% 0.0 5.0 10.0 15.0 20.0 25.0 30.0 35.0 40.0 GDP/Cap (thousand €) Reduction targets Non-ETS compared to 2005
20%: BG 19%:RO 17%: LV 14%: PL 13%: SK 11%: EE 10%: HU 9%: CZ 5%: MA 1%: PT -5%: CY -10%: ES -13%: IT -14%: DE, FR -14%: BE
-16%: AT, FI, UK, NL -17%: SE
-20%: DK, IE, LU 15%: LT
4%: SL
-4%: EL
Figure 2.3 Relationship between assigned reductions/allowed increases and GDP per capita in the EU Member States. Source: EC (2008)
Annex I countries (such as –25% compared to 1990 levels) depends on the deviation by that country from the group average, for one or more of the indicators.
The formula for the specific country’s reduction burden, measured as the relative change in emissions compared to 1990 levels (or 2005 levels) (Rcountry), is given as:
(1) + 〉 ⎟⎟ ⎠ ⎞ ⎜⎜ ⎝ ⎛ + ⎟⎟ ⎠ ⎞ ⎜⎜ ⎝ ⎛ 〈 = + + + + + + Annex Annex country country Annex base Annex country country Annex base Annex country country country POP GDP POP GDP z POP EM POP EM y GDP EM GDP EM x A R .
where A is an appropriate scalar, which is typically negative to secure the aggregate total reduc-tion level. POP, GDP and EM represent populareduc-tion, GDP and emissions, respectively. The factors
x, y and z are weights that add up to one. These weights can be subject to negotiation, but in our calculations they were equalised to one third. The approach can also be translated into a burden-sharing approach, solely based on per capita income (almost the approach described above), where weights x and y are set to 0 and z becomes 1.
This approach can account for differences in ability to pay, energy efficiency and per capita emissions (equity), but it still ignores a number of limiting factors, such as access to renewable energy resources, climatic differences and historically grown sectoral spreads, among others. However, this approach has been part of the Kyoto negotiations.
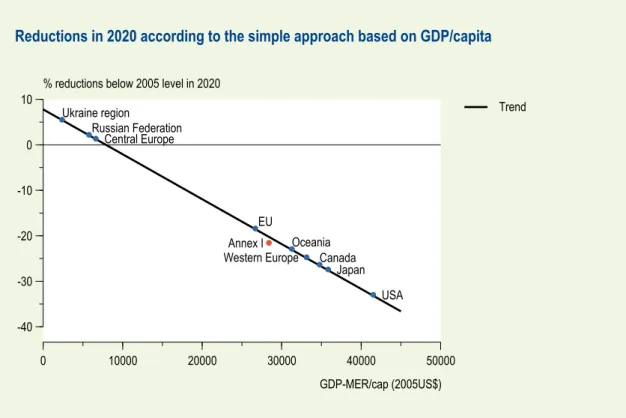
In the model analysis, in the next chapter, we have implemented a simple approach that is based on the approach presented above using GDP per capita. First, each country is to reduce emis-sions below its 2005 level by the same percentage (here 20% below 1990 level, which is 21.6% below 2005 level). Second, each country also has to reduce or increase the percentage that its GDP/capita is above or below that of the Annex I average, times a proportionality factor (here chosen to be 0.3 for illustrative purposes). The resulting reductions below the 2005 level, are shown in Figure 2.4. This model leads to high reductions, compared to the 2005 emission levels, for the high-income countries of the USA and Canada. Conversely, these countries benefit from the choice of 2005, for the reference year, since their emissions have shown an increase in the period from 1990 to 2005.
2.1.4 Equal marginal abatement costs
The first approach that uses costs would require countries to reduce emissions up to a level at which an equal MAC for the reduction of a unit of emissions (i.e. tCO2eq) is reached. For example, all countries would implement all mitigation options up to €50/tCO2-eq. If MAC curves for all countries were to be available, an abatement cost level could be chosen that would correspond to a certain targeted total amount of emissions. Figure 2.6 shows how the emis-sions reductions (points A and B) for individual countries can be derived, at the intersection of a country MAC curve and the line representing equal MACs. 1)