* Institute for Risk Assessment Sciences (IRAS), University of Utrecht. This report is based on the M.Sc. thesis of D. Bontje
This investigation has been performed for the account of the Directorate-General for
Environmental Protection, Directorate for Chemicals, Waste and Radiation, in the context of the project ‘International and National Environmental Quality Standards for Substances in the Netherlands’, RIVM-project no. 601501.
Contact: T.P. Traas
Expert Centre for Substances tp.traas@rivm.nl
National Institute for Public Health and the Environment, PO Box 1, 3720 BA Bilthoven, the Netherlands. Tel. 31-30-2749111, fax. 31-30-2742971
RIVM report 601501022/2005
A human exposure model to calculate harmonized risk limits
Model description and analysis D. Bontje*, T.P. Traas and W. Mennes
Rapport in het kort
Een humaan blootstellingsmodel om geharmonizeerde risicogrenzen te berekenen – modelbeschrijving en analyse
Het humane blootstellingsmodel zoals opgenomen in het Europese risicoschattingmodel EUSES mist een aantal blootstellingroutes via de bodem die wel zijn opgenomen in het Nederlandse blootstellingsmodel CSOIL. Dit rapport beschrijft hoe de twee modellen
gecombineerd zijn tot een nieuw model. Dit blootstellingsmodel is ‘Humanex’ genoemd. Het heeft tot doel om concentraties in het milieu te berekenen die de mens beschermen tegen nadelige effecten van chemische stoffen die zich kunnen verspreiden in het milieu. Deze zogenaamde milieurisicogrenzen zijn gebaseerd op gelijktijdige blootstelling van de mens via water, bodem, lucht en het dieet. Het model werd geanalyseerd aan de hand van
proefberekeningen met 17 stoffen. De stofeigenschappen bepalen welke van deze routes het meest bijdragen aan de totale blootstelling. De modelanalyse liet tevens zien welke
modelonderdelen nog verder kunnen worden verbeterd.
Abstract
A human exposure model to calculate harmonized risk limits - model description and analysis
The human exposure model, as integrated in the European risk assessment tool EUSES, lacks several exposure routes to contaminated soil that are part of the Dutch model CSOIL. This report describes how the two models are combined into a new model, called ‘Humanex’. This new model is aimed at calculating environmental concentrations for the protection of humans against hazardous effects of chemicals that can disperse into the environment. These
concentrations, or so-called environmental risk limits, are based on a cumulative exposure of humans by way of water, soil, air and the diet. The model was analysed in a study on 17 compounds. Analysis showed that substance properties determine which of the potential exposure routes are most important for the total exposure. The study also revealed wich model components could still be improved.
Contents
CONTENTS... 7 SAMENVATTING... 9 SUMMARY ... 11 1. INTRODUCTION ... 13 1.1 EXPOSURE MODELS... 141.2 INS-HUMANEX MODEL... 15
2. DESCRIPTION OF THE HUMANEX MODEL ... 17
2.1 THE HUMANEX-MODEL... 17 2.2 MODEL DESCRIPTION... 20 2.2.1 Fish module... 21 2.2.2 Air module... 21 2.2.3 Root Module ... 21 2.2.4 Plant module ... 22 2.2.5 Drinking water ... 23
2.2.6 Meat and Milk ... 24
2.2.7 Shower... 25
Soil and Dust ... 25
2.3 REVIEWING THE LIMITATIONS... 26
3. SENSITIVITY ANALYSIS OF HUMANEX... 29
3.1 INTRODUCTION TO SENSITIVITY ANALYSIS... 29
3.2 MONTE CARLO-LATIN HYPERCUBE... 29
3.3 USED COMPOUNDS FOR THE SENSITIVITY ANALYSIS... 30
3.4 SUMMARY OF THE SENSITIVITY ANALYSIS RESULTS... 30
3.4.1 Sensitivity analysis results per route of exposure... 31
3.5 CONCLUSIONS FROM THE SENSITIVITY ANALYSIS... 32
4. DETECTING IMPORTANT ROUTES AND MODULES ... 35
5. CALCULATING MAXIMUM PERMISSIBLE CONCENTRATIONS WITH HUMANEX... 37
5.1 MPC FORMULAE AND EXAMPLE CALCULATIONS... 37
5.1.1 Correction for the TCA ... 38
6. PREDICTING ROUTES OF EXPOSURE ... 41
6.1 SUBSTANCE PHYSICO-CHEMICAL PARAMETERS... 41
6.2 RELATION BETWEEN PHYSICO-CHEMICAL PROPERTIES AND PECREGS... 42
6.3 RELATION BETWEEN PECREGS AND THE ROUTE OF EXPOSURE... 43
6.4 RELATION BETWEEN PHYSICO-CHEMICAL PROPERTIES AND THE ROUTE OF EXPOSURE... 45
6.5 COMBINING THE ORIGIN OF EXPOSURE AND PHYSICO-CHEMICAL PROPERTIES... 46
6.6 CONCLUSIONS... 47
7. DISCUSSION AND CONCLUSIONS ... 49
7.1 DISCUSSION AND GENERAL CONCLUSIONS... 49
7.2 RECOMMENDATIONS FOR MODULE IMPROVEMENTS... 49
7.2.1 Fish module... 49
7.2.2 Air module... 49
7.2.3 Root module and Plant module ... 50
7.2.4 Drinking water module... 50
7.2.5 Meat and Milk Module ... 52
7.2.6 Shower Module... 52
7.2.7 Soil and Dust Module... 52
7.3 EMISSION TABLES IN EUSES ... 52
7.5 CHILDREN... 53
REFERENCES... 55
ACKNOWLEDGEMENTS... 59
APPENDIX I: EUSES SETTINGS FOR CALCULATIONS OF PECREGS ... 61
APPENDIX II: PARAMETER VALUES... 63
INDEX TO APPENDIX III: MODEL FORMULAS... 69
APPENDIX III: MODEL FORMULAS ... 71
APPENDIX IV: RESULTS OF SENSITIVITY ANALYSIS ... 97
APPENDIX V: CORRELATION DATA ... 107
APPENDIX VI: CORRELATION ANALYSIS RESULTS ... 109
APPENDIX VII: TOLERABLE DAILY INTAKES AND TOLERABLE CONCENTRATIONS IN AIR ... 111
APPENDIX VIII: LOADINGS OF PCA ... 113 APPENDIX IX: RELATIVE IMPORTANCE OF THE ROUTES OF EXPOSURE PER SUBSTANCE115
Samenvatting
Dit rapport beschrijft het humane blootstellingsmodel Humanex. Humanex is ontwikkeld om milieurisicogrenzen (MRG’s) af te leiden voor de effecten van stoffen op mens. MRG’s zijn uitgedrukt als concentraties in lucht, water, bodem en sediment die overeenstemmen met bepaalde beschermingsniveaus voor de mens of het milieu. MRG’s worden afgeleid in het project ‘(Inter)nationale normstelling stoffen (INS). MRG’s met het Humanex model zijn zodanig berekend dat de gecombineerde blootstelling door middel van voedsel, inhalatie, bodemcontact et cetera niet mag leiden tot overschrijding van humaan-toxicologische grenswaarden. Dit rapport beschrijft hoe het model is opgebouwd en bevat tevens een
nauwkeurige analyse van de onderdelen ervan. Hierdoor konden kritische blootstellingroutes en modelelementen geïdentificeerd worden. De modelanalyse laat zien dat een model nodig is om MRG’s te berekenen, vanwege de complexe interactie tussen stofeigenschappen en het grote aantal (potentiële) blootstellingsroutes.
Een van de doelen van de milieukwaliteitsnormen die de overheid vaststelt is het uitsluiten van ongewenste effecten van stoffen op de mens of het ecosysteem. Voor risico’s van
vluchtige stoffen voor de mens werd vaak aangenomen dat de blootstelling via inademing de belangrijkste rol speelt. Eerdere studies hebben echter laten zien dat de totale blootstelling ook via andere routes verloopt. Daarom zijn directe en indirecte routes gecombineerd in het Humanex model, gebaseerd op twee bestaande modellen: EUSES en CSOIL.
De Europese Unie heeft het computer programma EUSES ontwikkeld (European Union System for the Evaluation of Substances). EUSES bevat een multi-media blootstellingsmodel dat concentraties van stoffen kan voorspellen in het milieu, gebaseerd op (schattingen van) stofeigenschappen, productievolume en emissies. Het CSOIL model is ontwikkeld in
Nederland om de blootstelling van mensen die leven of werken op verontreinigde grond Dit model bevat een aantal blootstellingsroutes die afwezig zijn in EUSES.
Humanex combineert CSOIL en EUSES in een gecombineerd blootstellingsmodel. De volgende routes worden in aanmerking genomen: blootstelling via gewassen, vlees, melk en vis, bodemingestie, inademing van stof, huidcontact met bodemstof, inademing, drinkwater, permeatie van stoffen uit de bodem in drinkwater en douchen. De invoer voor het model begint met milieuconcentraties, die berekend worden met EUSES op basis van fysisch-chemische stofeigenschappen en emissiekarakteristieken.Vervolgens worden deze gecombineerd met gegevens over de humane blootstelling. Met behulp van een set vergelijkingen worden de concentraties in het milieu vertaald naar directe en indirecte blootstelling. De laatste stap vergelijkt de totale blootstelling met toxicologische grenswaarden, waarna het maximaal toelaatbaar risico (MTRhumaan) in de
Summary
This report describes the multi-compartment exposure model Humanex. Humanex is developed to calculate environmental risk limits (ERLs) for human exposure to chemicals. ERLs are expressed as concentrations in air, water, soil and sediment that are associated with defined levels of protection for man or environment. ERLs are derived in the project
‘(Inter)National Environmental Quality Standards (INS)’. ERLs calculated by the Humanex model are such that the combined exposure by way of food, inhalation, soil contact et cetera does not exceed human-toxicological standards. This report contains a detailed description of the Humanex model and a model analysis to identify dominant exposure routes and model elements. Model analysis shows that the combined model is needed to calculate the ERLs due to the complex interaction between properties of chemicals and the multitude of potential exposure routes.
One of the objectives of environmental quality standards set by the government is that exposure to substances should not result in adverse effects on man and ecosystems. For volatile substances it is assumed that inhalation is the predominant route of exposure for man. Previous studies have shown that this underestimates total exposure, therefore direct and indirect exposure of man was combined in the Humanex model. The Humanex model is based on two existing models, EUSES and CSOIL.
The European Union has developed the computer program EUSES (European Union System for the Evaluation of Substances) to assess the exposure of Europeans to contaminants in the environment. EUSES contains a multi-media exposure model that can predict concentrations of substances in the environment, based on estimates for production volume, compound properties and emission.
The CSOIL model was developed in the Netherlands to estimate the exposure of humans who live on contaminated sites. The model includes several exposure routes not present in EUSES. Humanex combines the CSOIL and EUSES model into a comprehensive model for human exposure. The following routes are considered: exposure from crops, meat milk and fish, soil ingestion, dust inhalation, dermal exposure to dust, inhalation of contaminant, drinking water, permeation of contaminant from the pore water into the drinking water and the exposure from showering with polluted drinking water.
The model needs input concentrations in the environment, calculated with EUSES. This requires physico-chemical properties of substances and production information. Subsequently, these are combined with data on human exposure into a set of equations tot calculate exposure by way of fish, cattle, drinking water, air, soil, crops and dust. These contaminant
concentrations in human exposure media are subsequently used to calculate direct and indirect human exposure. The model contains a final procedure to calculate maximum permissible concentrations (MPChuman), based on a comparison of estimated total human exposure and
1.
Introduction
The ‘Project Setting (Inter)National Environmental Quality Standards (INS)’ exists since 1989. The aim of the project is to derive environmental risk limits (ERLs) for air, water, sediment and soil for selected substances. ERLs (Table 1) have been derived for a large number of substances [41] and serve as advisory values to set environmental quality standards (EQS, Table 1) by the government for various policy purposes [42]. The most important policy goals are:
• Develop source-orientated policy and policies to further reduce and control emissions to meet the general basis of the overall environmental policy, which is sustainable development [42,43]. Sustainable development means that the quality of the environment is guaranteed for the next generation and beyond. Exposure to substances should not result in adverse effects on man and ecosystems.
• Systematically evaluate the environmental quality with national, regional and local monitoring programs that measure the concentration of substances in the environment.
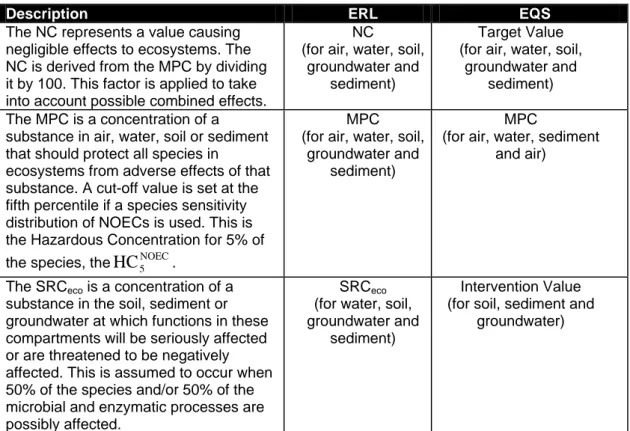
Table 1. Environmental Risk Limits (ERLs) and the related Environmental Quality Standards (EQS) that are set by the Dutch government in The Netherlands for the protection of ecosystems.
NC Negligible Concentration
MPC Maximum Permissible Concentration
SRCeco Serious Risk Concentration for the ecosystem
Description ERL EQS
The NC represents a value causing negligible effects to ecosystems. The NC is derived from the MPC by dividing it by 100. This factor is applied to take into account possible combined effects.
NC (for air, water, soil,
groundwater and sediment)
Target Value (for air, water, soil,
groundwater and sediment) The MPC is a concentration of a
substance in air, water, soil or sediment that should protect all species in
ecosystems from adverse effects of that substance. A cut-off value is set at the fifth percentile if a species sensitivity distribution of NOECs is used. This is the Hazardous Concentration for 5% of the species, theHC5NOEC.
MPC (for air, water, soil,
groundwater and sediment)
MPC
(for air, water, sediment and air)
The SRCeco is a concentration of a
substance in the soil, sediment or groundwater at which functions in these compartments will be seriously affected or are threatened to be negatively affected. This is assumed to occur when 50% of the species and/or 50% of the microbial and enzymatic processes are possibly affected.
SRCeco
(for water, soil, groundwater and
sediment)
Intervention Value (for soil, sediment and
groundwater)
Since the EQSs are supposed to protect both ecosystems and man, special attention has been paid to substances that are volatile and can be expected to expose man by inhalation of contaminated air [44]. For volatile substances it is assumed that inhalation through air is the predominant route of exposure for man. A previous study showed that this is not always true
[18]. Calculating the exposure to man only from the air compartment was found to underestimate total exposure.
In 1995 the Committee on Setting Integrated Environmental Quality Objectives (Stuurgroep Integrale Normstelling Stoffen) concluded that multiple routes of exposure should be taken into account when calculating MPCs so no relevant route of exposure would be ignored. The committee also confirmed that it was necessary to take the partitioning of substances into account when setting maximum permissible risk concentrations for water, sediment, soil and air [10]. This partitioning of substances is formalised in the concept of multi-media exposure models [17,30]. Multi-media exposure models [17] as implemented in EUSES [23] can predict concentrations of substances in the environment. To protect humans from multi-compartimental exposure, environmental quality standards should be based on human exposure through multiple pathways. It is assumed that chemicals may partition from one compartment to another, driven by thermodynamic gradients between the compartments. The present report describes the multi-compartment exposure model Humanex that was developed to meet this goal.
1.1
Exposure models
When a contaminant is produced for some time it may accumulate in the ecosystem and eventually enter the human food chain. To assess the exposure of a person through food one has to actually measure the concentration of the contaminant for every single item of food and measure total food intake. This is not feasible for the purpose of general risk assessment and a model is needed. The model consists of mathematical equations describing the exposure of humans to contaminants, using information on diet, behaviour and contaminant properties. Exposure assessment is based on an average person. Different models are already available for exposure assessment. The two most important ones for the present purpose are briefly described.
The European Union has developed the computer program EUSES (European Union System for the Evaluation of Substances) to assess the exposure of Europeans to contaminants in the environment. With estimates for production volume, compound properties and emission, the model calculates concentrations in the environment. These predicted environmental concentrations (PECs) are then used to calculate the exposure of humans through air, drinking water, meat, milk, fish and crops.
The CSOILmodel was developed in the Netherlands to estimate the exposure of humans who live on contaminated sites. The model includes routes not present in EUSES: exposure from home grown crops, soil ingestion, dust inhalation, dermal exposure to dust, inhalation of contaminant evaporated from the soil or ground water, permeation of contaminant from the pore water into the drinking water and the exposure from showering with polluted drinking water.
By combining the CSOIL and EUSES model a comprehensive model can be built to describe multi-media exposure. This new multi-media exposure model should be in agreement with the concept of partitioning of substances and calculates human exposure and is named INS-Humanex.
The ERLs calculated by Humanex are meant to protect humans from exposure to chemicals at background levels due to diffuse(non-local) emissions. This is obviously a different goal than the current Intervention Values, which are based on local exposure due to soil pollution. The exposure scenario in CSOIL for humans that are exposed to polluted soil, whether direct or indirect, is different from the one used in this study.
1.2
INS-Humanex model
In this report a new procedure to derive MPCs for humans is presented. Well-documented exposure routes of humans were combined. This effectively gave rise to a new model named Humanex and it is programmed in Excel. It needs the input concentrations for the four compartments soil, surface water, air and pore water.
Humanex combines human exposure routes from CSOIL and EUSES. This approach is based on the predicted environmental concentrations (PECs) produced by EUSES. To calculated PECs physico-chemical properties of substances and production information is needed. The PECs, substance properties, and data about human exposure are combined into a set of equations (Chapter 2). A thorough analysis of the model was performed in the form of a sensitivity analysis (Chapter 3). Humanex calculates contaminant concentrations in e.g.: fish, cattle, drinking water, air, crops and dust. These contaminant concentrations in human exposure media are subsequently used to calculate the direct and indirect human exposure (Chapter 4). Then, total human exposure is compared to toxicological threshold values. Based on this comparison ‘safe’ environmental levels are calculated (Chapter 5). The influence of physico-chemical properties and predicted environmental concentrations on the main route of exposure were studied (Chapter 6). The use and validity of the Humanex model is discussed and suggestions for improved are made in the final section (Chapter 7).
2.
Description of the Humanex model
2.1
The Humanex-model
The purpose of this project is to calculate human risk limits, maximum permissible concentrations (MPChuman), for exposure to chemicals from non-local sources. The Humanex
model predicts the relative and absolute exposure of a man to a single substance. It is possible to calculate the MPChuman for all compartments if the tolerable daily intake (TDI) is also
known. First, contaminant concentrations in all human exposure media need to be calculated. The EUSES program [23] is used to calculate predicted environmental concentrations for the regional scale (PECreg values). These PECreg values are subsequently used to calculate the
direct and indirect human exposure. From this exposure the estimated total exposure (ETE) for humans is calculated. The ETE is compared to the TDI after which the maximum permissible concentrations in the environment are calculated. This procedure is explained in Chapter 5. First, the model itself is discussed in the next sections.
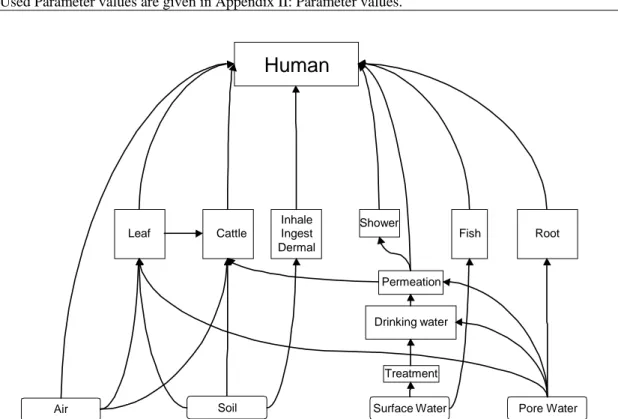
The Humanex model combines the EUSES routes with the CSOIL routes of exposure. Because CSOIL and EUSES use different scenarios for assessing exposure, the models are very complementary in a combined model (see Figure 1 and Table 2). Overlap is only observed for exposure through crops (Table 3). All exposure routes in the combined Humanex model use the same environmental concentrations as input. These are for the compartments surface water, air, pore water (groundwater) and soil. The formulas and parameter values are derived from the most recent CSOIL-update and the EUSES manual (Table 4).
Compartments are assumed to be at steady-state concentrations when using the predicted concentrations of the regional scale (PECreg) as input for the Humanex calculations. When routes were both modelled by EUSES and Coil, such as the exposure through crops, then the parameter values used are specifically stated in Appendix II. In this project EUSES is used to predict environmental concentrations of most of the substances, for other compounds the PECs are from EU-RAR-reports that are based on expert use of EUSES.
Table 2. The Humanex model combines routes of exposure from EUSES and from CSOIL into a new model.
EUSES-model CSOIL-model Humanex-model
Air Air Air
n.i. Inhalation of contaminant evaporated from the soil n.i. Differentiation between inside and outside air. n.i.
Meat1 n.i. Meat
Milk2 n.i. Milk
Fish n.i. Fish
Crops: root, leaf Home grown crops: root, leaf Crops: root, leaf Drinking water
purification
n.i. Drinking water purification
n.i. Permeation of contaminant from the soil into the drinking water
Permeation of contaminant from the soil into the drinking water n.i. Showering with drinking water Showering with drinking water
n.i. Soil ingestion Soil ingestion
n.i. Dust inhalation Dust inhalation
n.i. Dermal exposure to dust Dermal exposure to dust n.i. = not implemented, 1 Meat = all meat sources, 2 Milk = all diary products
Unless special precaution is taken, Humanex can only be used for calculations with non-dissociating organic compounds and not for other compounds such as metals.
Table 3. Used compounds.
Nr. Compound CAS data from: Nr. Compound CAS data from:
1 triethanolamine 102-71-6 EPIWIN 17 acrylaldehylde 107-02-8 RAR EUR 19728 EN
2 diethylene glycol 111-46-6 EPIWIN 18 cumene 98-82-8 RAR EUR 19726 EN
3 ethylene glycol 107-21-1 EPIWIN 19 bis-pentabromo-phenyl ether 1163-19-5 RAR EUR 20402 EN
4 methanol 67-56-1 EPIWIN 20 ethyl acetoacetate 141-97-9 RAR EUR 30396 EN
5 tribromomethane 75-25-2 EPIWIN 21 linear alkylbenzenes 67774-74-7 RAR EUR 19011 EN 6 tetrahydriothiophene 110-01-1 EPIWIN 22 methacrylic acid 79-41-4 RAR I.01.36 7 butyl acetate 123-86-4 EPIWIN 23 pentabromodiphenylether 32534-81-9 RAR EUR 19730 EN
8 butanol 71-36-3 EPIWIN 24 chlorocresol 1570-64-5 RAR EUR 19757 EN
9 methyl tert-butyl ether 1634-04-4 EPIWIN 25 methylene dianaline 101-77-9 RAR EUR 19727 EN
10 methyl ethyl ketone 78-93-3 EPIWIN 26 biphenylol 90-43-7 Art. [35]
11 cyclohexylamine 108-91-8 EPIWIN 27 4-chloro-m-cresol 59-50-7 Art. [35]
12 ethyl acetate 141-78-6 EPIWIN 28 Ibuprofen 15687-27-1 Art. [35]
13 dodecylbenzene 123-01-3 EPIWIN 29 Ivermectin 70288-86-7 Art. [35]
14 hexachlorobutadiene 87-68-3 EPIWIN 30 Oxytetracycline 79-57-2 Art. [35]
15 nonylphenol 84852-15-3 RAR EUR 20387 EN 31 Triclosan 3380-34-5 Art. [35] 16 chloro-alkanene 85535-84-8 RAR EUR 19010 EN
RAR: European Union Risk Assessment Report produced via the Institute for Health and Consumer Protection by the European Chemicals Bureau. RAR documents available via internet: http://ecb.jrc.it/
Table 4. Origin of formulas and parameter values.
Origin of EUSES exposure formulas EUSES manual [7].
Origin of CSOIL exposure formulas Appendix 6 of RIVM report nr. 711701022. Origin of EUSES parameter values EUSES manual [7].
Origin of CSOIL parameter values Revised CSOIL 200 dataset in RIVM report 711701021
Used Parameter values are given in Appendix II: Parameter values.
Human
Cattle Inhale Ingest Dermal Shower Fish Root Leaf Permeation Drinking water TreatmentAir Soil Surface Water Pore Water
In the following paragraphs brief descriptions are given about the models from which the building blocks for Humanex are derived and how the building blocks function. In the end of this chapter strengths and weaknesses of the modules are reviewed.
‘EUSES facilitates the quantitative assessment of the risks posed by new and existing substances and the environment’ [7]. EUSES is capable of assessing risk to man, consumers, workers, sewage treatment plants micro-organisms populations and certain ecosystems. It is capable of predicting environmental concentrations on all scales, with the scale of a country being named the regional scale (PECregs).
These PECregs represent concentrations in the soil, air, pore water and surface water. PECregs are the predicted environmental concentrations on the scale of one country. The prediction is based on the mostly factual way of production and usage of the product of concern. This means that if the way of production or usage changes than the PECregs will change to. Any calculation based on PECregs is only valid as long as the entered data is still a representation of the reality. When the amount of produced chemical is increased than the PECregs should increase proportional. If increased production volumes mean a change in the type of production than PECregs have become invalid and new PECregs must be calculated based on the new way of production.
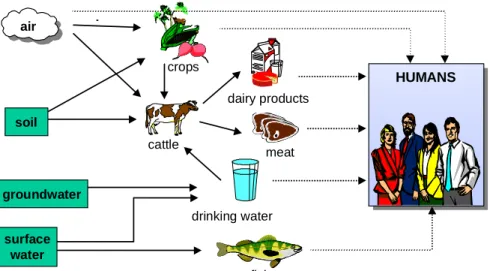
The exposure to a given compound can be calculated using production volumes, compound properties and emission estimates. Routes of exposure in EUSES for humans are air, drinking water, meat, milk, fish and crops (Figure 2).
‘The CSOIL model is developed to calculate the serious risk concentrations (SRC) at which human toxicological maximum permissible risk limits (MPR or TDI) is exceeded. The model is used to quantify the human exposure to soil pollutants for a residential situation at a local scale’[22].
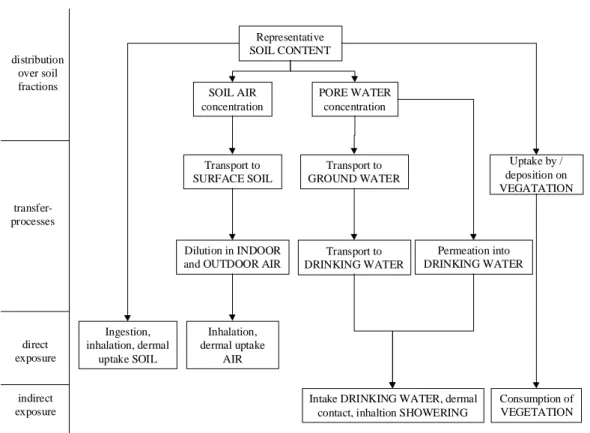
CSOIL does not use estimates of concentrations for the compartment soil data must be entered derived from measurements from which concentrations in soil solids, soil air and pore water are calculated. From there on concentrations in the contact media are calculated. The following routes of exposure are present in CSOIL: exposure from home grown crops, soil ingestion, dust inhalation, dermal exposure to dust, inhalation of contaminant evaporated from the soil, permeation of contaminant from the pore water into the drinking water and the exposure from showering with polluted drinking water (Figure 3).
soil air fish meat dairy products crops drinking water HUMANS surface water groundwater cattle
Humanex is based on multi-media exposure pathways. Just like EUSES it is a generic model and assumptions are made on the distributions of the contaminants over the compartments and the compartments are assumed to be homogenous and well mixed; e.g. there is no spatial difference within one compartment.
2.2
Model Description
The Humanex model is implemented in an Excel file with several work sheets. One work sheet contains the compound data such as Kow, solubility, Henry’s law constant, molecular
weight, PECregs et cetera. The Input sheet contains default values for the formulas. Default values can always be altered, if no value is entered the default is used. Each route of exposure has a separate work sheet in which the formulas are implemented; the data needed for these formulas is gained from the input sheet with default values. The Input sheet also has a table in which routes of exposure can be toggled on and off. The Output sheet which calculates overall exposure, calculates maximum permissible concentrations and generates tables which show the absolute exposure and the absolute and relative importance of each route of exposure, and from which compartment the exposure originates. The Output sheet also checks for improper solubility and vapour pressures at input concentrations and MPCs.
Below follows a summary of each module. Parameter values are listed in Appendix II and the exact formulas are in the Appendix III. The following section gives a brief description of the processes in the exposure routes and are meant to point out any possible difference between EUSES, CSOIL, and Humanex formula implementation. The summary also gives the limitations of each module.
Representative SOIL CONTENT SOIL AIR concentration PORE WATER concentration Transport to SURFACE SOIL Transport to GROUND WATER Uptake by / deposition on VEGATATION Consumption of VEGETATION Dilution in INDOOR
and OUTDOOR AIR
Inhalation, dermal uptake AIR Ingestion, inhalation, dermal uptake SOIL Transport to DRINKING WATER Permeation into DRINKING WATER
Intake DRINKING WATER, dermal contact, inhaltion SHOWERING distribution over soil fractions transfer-processes direct exposure indirect exposure
2.2.1 Fish module
Used compartments: surface water (Figure 4).
Processes: The fish module is the same as in EUSES and consists of only one formula to calculate the concentration of contaminants in fish, for this a bioconcentration factor (BCF) is used. This BCF predicts the ratio between the concentration in fish and the predicted environmental concentration in the surface water.
Limitations:
1. Molecular weight must be less then 700 g/mol 2. Used Log Kow must be between 1 and 10
3. The QSAR on which the BCF is based is based on a limited amount of data-points and near the outer limits of log Kow 1 and 10 the estimation becomes less reliable. Also, the
BCF is only valid for the neutral fraction of dissociating compounds [24].
4. Only freshwater fish is consumed which may over-estimate exposure, as mainly sea fish is consumed [13].
2.2.2 Air module
Used compartments: Air (Figure 5).
Processes: Formulas are from EUSES, and only direct exposure to air is modelled in this module. Concentrations in air are equal to the PECreg air. The same air concentrations are assumed for indoors, outdoors and at work.
Optional: It is possible to activate a module in which contaminant evaporates from soil into the outdoor air and in to the basement as in CSOIL. There will the contaminant accumulation in the basement and diffusion into the house
will occur. Extended descriptions of this route of exposure are available [19,22,37,40]. All data and conclusions presented in this report are based on module settings in which this option was not activated. SimpleBox calculates the concentrations of the PEC being in steady state, all transport between soil and air compartment has been taken into account. To model this soil to air evaporation would mean abandoning the assumption that the calculated concentrations are in steady state.
Limitations:
1. No basement accumulation was modelled.
2. No differentiation in indoor, outdoor and work air concentrations was modelled for reasons of simplicity.
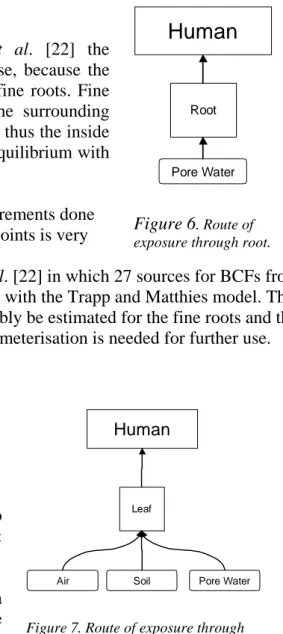
2.2.3 Root Module
Used compartments: pore water (Figure 6).
Processes: The root module is the same as in EUSES and CSOIL, but CSOIL parameter values are used. The root consists of a water fraction and a lipid fraction. The water fraction is considered to be in equilibrium with the pore water and has the same concentration as the pore water. The lipid fraction is assumed to behave like octanol. Depending on the lipophilicity, expressed as the Kow of the neutral organic compound, the root lipids will reach
equilibrium with the pore water surrounding the root. The source of all contaminant is the pore water; the PECreg, agricultural pore-water.
Fish
Surface Water
Human
Figure 4. Route of exposure through fish.
Human
Air
Figure 5. Route of exposure through air.
According to the verification in Rikken et al. [22] the concentration in the roots is realistic worst case, because the model is used for thick roots but is based on fine roots. Fine roots reach equilibrium more quickly with the surrounding pore water. Potatoes and carrots are thicker and thus the inside of these thicker root products could not be in equilibrium with the centre of the root.
Limitations:
The root concentration factor is based on measurements done on barley (r2 = 0.96), but the number of 7 data-points is very low and only based on a few compounds [2].
A validation study has been done in Rikken et al. [22] in which 27 sources for BCFs from literature are compared with the BCFs predicted with the Trapp and Matthies model. This comparison concludes that the BCF can reasonably be estimated for the fine roots and that more experiments, model modification and parameterisation is needed for further use.
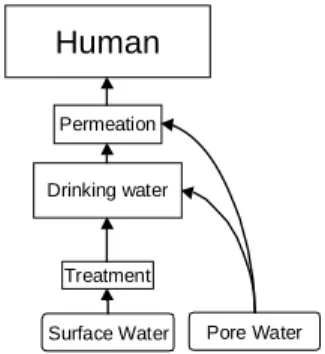
2.2.4 Plant module
The formulas in the Humanex plant module is based on the PLANTX model of Trapp and Matthies [28]. The same model is used in EUSES and CSOIL. The parameters have been taken from the latest CSOIL edition.
Used compartments: The plant takes up contaminant from a number of compartments: air, soil and pore water (Figure 7).
Transport from pore water to the plant
The plant evaporates water and thus creates a flux (mass transport) of water towards the xylem of the plant; this stream is called the transpiration stream. The flux of water
originates in the pore water and can contain contaminants. These contaminants travel with the water in the xylem and into the leaves. The transpiration stream concentration factor (TSCF) is calculated with the method of Briggs et al. [2] and with the method of Hsu et al. [47]. In Humanex and in CSOIL the highest value of these are chosen as the TSCF. In EUSES only the method of Briggs is used with a minimum and a maximum log Kow. The TSCF always has
a minimum value of 0.04 in Humanex and in CSOIL.
Transport from air to the plant
A flux is calculated based on a partitioning coefficient of the contaminant between water and air and the partitioning coefficient between plant and water. This latter partitioning coefficient is likewise calculated as the concentration ratio between root and pore water. The fraction bound to aerosols is taken into account in Humanex as in EUSES; this is not done in CSOIL. If the concentration in the plant is higher than in the air than the flux is negative, thus reducing the amount of contaminant in the plant. Otherwise the concentration increases.
Concentration in the plant
The above water flux and air flux are added and together form a constant rate of input of contaminant. (Although it is possible to have evaporation of contaminant out of the plant.) The input flux can be countered by photo-degradation, the metabolism of the plant and the
Human
Leaf
Air Soil Pore Water
Figure 7. Route of exposure through stem and leaves
Human
Root
Pore Water
Figure 6. Route of exposure through root.
growth rate of the plant. The growth rate of the plant can by default cause a lower end concentration in the plant by growth dilution. Many elimination and metabolism rates are unknown and are set at zero as a worst case scenario. In EUSES, CSOIL and in Humanex photo-degradation rate and the metabolism rate of the plant are zero.
Soil particle resuspension / deposition
Transport from the soil to leaf can take the form of small soil particles, which splash up against the stems and leaves of plants when it rains or when the wind blows. These particles are part of the dirt on the outside of the plant, which are washed of mostly before consumption. The concept is taken from the CSOIL2000R model and is now part of Humanex. This process is not implemented in EUSES.
Final concentration in stem and leaves
The concentration in plant is calculated by adding the concentration in plants together with the contamination from deposition and is expresses as kg contaminant per kg fresh weight plant.
Limitations: Points of limitation are in Rikken et al. [22], and summarised below:
1. The calculation of the TSCF is only valid in the range of log Kow minus 0.5 to plus 4.5.
Outside this range a minimum value of 0.04 for the TSCF is used.
2. This model is only valid for non-dissociating (neutral) organic compounds.
3. The model generates the concentration of contaminants in a plant, which is an abstraction of real plants. This model is used to predict the concentration in grass for cattle, and to predict the concentration in the leafy plants humans eat. Fruit, seeds and stems are not modelled in this way and non-leafy parts are expected to be less contaminated than the xylem. This means using this model to predict the concentration in fruit, seeds and stems is a worst-case scenario.
4. The model assumes continues exponential growth. This means the model only applies to plants that are eaten before they stop growing. This is correct for grass and lettuce. But many plant parts slow their growth towards the end of the growth season.
5. The empirical parameters for TSCF and the ‘b’-value for the conversion of plant lipids to octanol are derived from a small amount of experiments.
6. There are no experimental data available for substances with a high log Kow.
7. It would be good to have specific parameter values for grass so the exposure through grass for cattle can be assessed more precisely. Currently cattle and humans eat the same generic vegetable fodder.
The predictions of the BCF calculated with the Trapp and Matthies PLANTX-model are compared with at least 6 groups of compound [22]. The calculated BCFs deviated log units above and below the measured BCFs. The main point of concern is that only one set of equations (or PLANTX-model) is used to simulate all type of consumed plant types using default parameters [27]. These parameters are not incorrect by default because many plants behave likely but validation is limited. The predicted concentration in the plant has an uncertainty of at least one log unit [22].
2.2.5 Drinking water
Used compartments: Surface water, pore water (Figure 8).
Processes: Drinking water is either produced from groundwater or from purified surface water. Drinking wa-ter is transported through the network of the supplier to the households. Contaminant in soil can permeate through
Human
Permeation Drinking water
Treatment
Surface Water Pore Water
Figure 8. Route of exposure through drinking water.
the pipes into the drinking water close to the buildings where pipes are assumed to be made of PE or PUC and permeable. During the last part of the transport of the drinking water to the households permeation of the contaminants through a low-density polyethylene tube, as worst-case scenario, into the water supply can occur. This is modelled using CSOIL formulas. The speed in which the tube is infiltrated by the compound is expressed with the permeation coefficient (m2/d). As a default this value was set as 1.4*10-6 m2/d for all compounds used in this report. The production of drinking water is modelled through the use of EUSES formulas. A purification factor for surface water is derived from a table from Hrubec and Toet using physicochemical properties, such as Henry coefficient, log Kow, purification system and
biodegradability of the compound [12]. As a worst-case scenario the most contaminated source for the drinking water is used: either unpurified groundwater or purified surface water.
Limitations:
1. The derivation of an accurate purification factor is quite difficult. The table used in EUSES is based on a preliminary assessment of the removal percentage of organic chemicals by the diverse treatment systems [12]. This table has not been validated with new and more recent data. The worst-case scenario to use the most contaminated water as source for drinking water can cause a great over-estimation of the exposure through drinking water. Improving the estimation of the purification factor can only reduce this. Jager et al. proposes to use a fixed uniform purification factor of 0.15 based on 8 pesticides as worst-case situation [14].
2. The permeation model is based on experiments with a limited amount of compounds. The permeability coefficients of other compounds have to be estimated [36,39].
3. The permeation model is obsolete (paragraph 7.2.4).
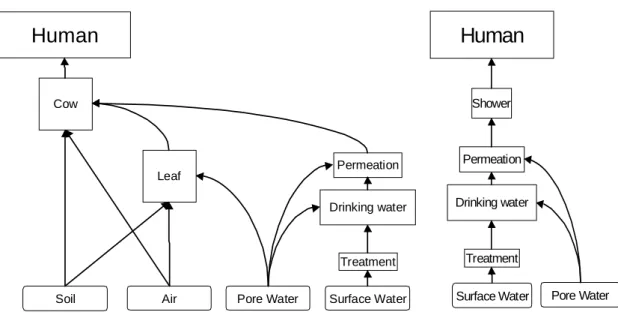
2.2.6 Meat and Milk
Used compartments:All four compartments: Air, soil, pore water and. surface water (Figure 9 next page).
Processes: All calculations are based on EUSES formulas. Cattle is exposed through grass fodder, air, drinking water and soil particles on the grass. The exposure of cattle is totalled to a daily average expressed in the units kg/d. An experimental derived bio transfer coefficient (BTF) with units d/kg is used together with the contaminants log Kow to calculate the
concentration of contaminant in meat and milk. A BTF is in general similar to a BCF.
Limitations:
1. The BTF for meat is derived from a data set with compounds with a range of 1.5 to 6.5 [29]. Outside this range the BTF should not be calculated, but if the contaminants log Kow
is outside this range it is set to 1.5 or 6.5 [7].
2. The BTF for milk is derived from a data set with compounds with a range of 3 to 6.5 [29]. Outside this range the BTF should not be calculated, but if the contaminants log Kow is
outside this range it is set to 3 or 6.5 [7].
3. The drinking water for cattle is the same as human drinking water in Humanex. Cattle are not modelled in CSOIL and in EUSES cattle drink the same water as humans.
4. Outside the previous mentioned range of log Kow the BTFs should not be estimated.
5. The predicting formulas should only be used to predict BTFs for the type of substances on which the formula is derived from, i.e. lipophilic, non-metabolisable narcotic substances. 6. The BTFs are based on data from 1988. Measurements are based on a limited number of
data points on a limited number of compounds and limited explained variance [29]. (For BTFmeat n=36, r2 = 0.66, and for BTFmilk n =29, r2 = 0.53.)
7. Only cattle is used for BTF measurements, other meat sources such as pork and chicken are ignored.
8. All dairy products in the EUSES model are lumped together and a BTF for milk is used to calculate the concentration in this dairy. Milk is less fat than cheese and butter. Thus the calculated concentrations for the diary is an underestimation because fat has the tendency to accumulate compounds for which the BTF is used [24]. A future solution can be found by considering the exposure to milk-fat instead of exposure to milk and diary, since it is this fat that contains the lipophilic substances and is used in many food items. More experiments would be welcome to decrease the uncertainty in the relationship between log Kow and BTF, to increase the range in which the relation is valid more species should be
used when doing this.
2.2.7 Shower
Used compartments: surface water and pore water (Figure 10).
(Processes: Drinking water is used to take a shower. While showering, contaminant from the water can be absorbed through the skin. Droplet formation of the water will increase the surface-volume ratio and will increase the evaporation rate of the contaminant from water to air. An increased temperature of the water also increases the rate of evaporation. The dermal and inhaled exposure is calculated using the physic-chemical parameters: Henry, molecular mass and Kow. All formulas are based on CSOIL. More information in Otte et al. [19].
Soil and Dust
Used compartments: soil (Figure 11).
Soil ingestion: Adults and especially children ingest soil on purpose and by accident. This soil is then digested and the contaminant is released partly into the digestive tract after which the chemical can be absorbed into the body. For some compounds this the main route of exposure in CSOIL. The parameters involved in this route have been revised and updated [16,19].
Human
Inhale Ingest Dermal Soil Figure 11. Route of exposures through inhalation, dermal ab-sorption and ingestion.Human
Cow
Leaf Permeation
Drinking water
Treatment
Air Pore Water Surface Water Soil
Figure 10. Route of exposures through the cow derived products meat and milk.
Human
Shower Permeation Drinking water TreatmentSurface Water Pore Water
Figure 10. Route of exposures through showering.
Dust inhalation: When breathing air dust is also inhaled, with a different exposure regime for indoors and outdoors. Dust particles are composed partly of soil. 75% of all inhaled particles is considered to be retained in the longs. Outdoors the concentration of dust particles is higher but the fraction of soil in these particles is lower. Indoors the concentration of dust particles is lower but the soil content is higher in each particle. The concept of this exposure route has not been evaluated because it is a minor contributor to the overall exposure in CSOIL [22].
Dermal exposure to dust and soil: Particles contact the skin after which the contaminant in the soil fraction can absorb through the skin into the body. The amount of exposed surface area (skin) is higher outdoors and lower indoors. The amount of particles per square meter skin is higher outdoors and lower indoors. The concept of this exposure route has not been evaluated because it is a minor contributor to the overall exposure in CSOIL [22].
Limitations:
1. While dust inhalation and dust exposure are both routes of exposure in CSOIL each route uses different amounts of dust per particle even when comparing outside situation with outside situations.
2. According to the model all compounds behave the same. Molecular size or weight or hydrophobicity has no effect on the dermal absorption speed, but dermal absorption speed should be compound dependent.
3. All ingested contaminant is considered to be absorbed into the body in the same amount as was the case in the toxicology study for that compound on which the TDI is based. This means that the relative absorption for soil compared to the relative absorption food is equal but should be less. Generally an overestimation of the exposure will be the result because soil is expected to release it contaminant less easily than food but compound specific data is lacking, except for lead.
2.3
Reviewing the limitations
An overall limitation of the input is whether or not the concentrations in water are below the solubility of a compound. This was checked for input and output concentrations in the compartments pore water and surface water. For the maximum concentrations in pore air and the air compartment the Henry-coefficients were used to compare with the maximum possible concentrations. CSOIL was developed for volatile and persistent compounds. EUSES-modules are based on predictive formulas that are based on relative hydrophobic and persistent compounds. This would make the Humanex model only usable for persistent compounds in theory.
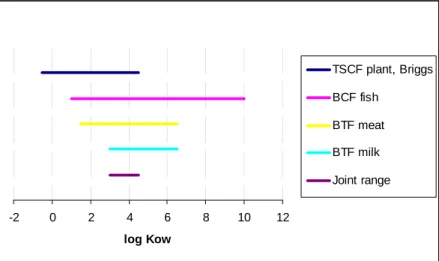
If all the module limitations and requirements would be taken in to account than the EUSES and thus Humanex model would have a small confined range of applicability.
Only a small Kow range has a valid regression range in all QSARs. The joint regression ranges
Figure 12. All regression ranges in the EUSES equations have a small overlap from log Kow 3 to 4.5. After a figure of Schwatz [24].
This limited range of applicability needs careful consideration. When only a few percent of the total exposure goes through a route which is outside the regression range of the compound then this can be ignored. Problems arise if tens of percents of the total exposure is derived through routes which are used outside their range of application. Then the predicted exposure is very uncertain. For all compounds it has been checked that if the exposure through a route is 5% or more of the total exposure, the log Kow does indeed fall within the range of
application of the corresponding QSAR for that route of exposure.
For methanol with log Kow of –0.8 the exposure is 86% through air, 8% through fish and 7%
of the total exposure is through leafy products. The QSAR for the leaf model is log Kow 0.5 to
4.5. Thus the exposure through leaf could be underestimated with an unknown magnitude, therefore expected exposure pattern for methanol can not stated.
For dodecyl benzene with log Kow of 8.7 the exposure is 78% through root, 9% through fish
and 5 percent through meat and 5 percent through milk. The QSAR for the meat module is log
Kow 1.5 to 6.5, and for the exposure through milk the QSAR is valid from log Kow 3.0 to 6.5.
Large molecules can have a high log Kow but a large molecule is less easily resorbed than
smaller molecules. Exposure can differ 2 orders of magnitude because the model does not consider a reduced resorption. This means the exposure through milk and meat can combine to a total exposure of 100% or be less than 0.1 %. The deviation can be either way and is unknown.
The log Kow of pentabromodiphenylether is 6.6 and 22 percent of the exposure is through
meat and also 22 percent of the exposure is through milk. Both QSARs for milk and meat have an upper limit of log Kow of 6.5. This small difference is ignored.
All formulas in EUSES and CSOIL are meant for neutral non-ionising organic chemicals. While this is the case for most chemicals tested in EUSES and in the RAR reports this not the case for all 31 compounds used in this report.
-2 0 2 4 6 8 10 12 log Kow TSCF plant, Briggs BCF fish BTF meat BTF milk Joint range
3.
Sensitivity analysis of Humanex
To learn how the model reacts to its input, a sensitivity analysis was done. A sensitivity analysis is performed to find the most sensitive parameters. These parameters must be the most accurate parameter to get accurate output from the relevant routes of exposure. A diverse set of compounds, of which half of them are volatile, was used for this analysis. The results of the sensitivity analysis are presented in the following sections based on 17 substances that are in realistic (relative) concentrations in the environment (Table 5).
3.1
Introduction to sensitivity analysis
The output of a model will respond to its input, e.g.: doubling the concentration of a contaminant in the surface water will cause a twofold increase in exposure from this compartment. A model is very sensitive to a specific parameter if a small change in the value of that parameter results in a large change in the output value. A model is insensitive to a parameter if a large change in the input parameter result in an unnoticeable change of the output value. The Humanex model has 198 input parameters, and some are sensitive and most are not sensitive.
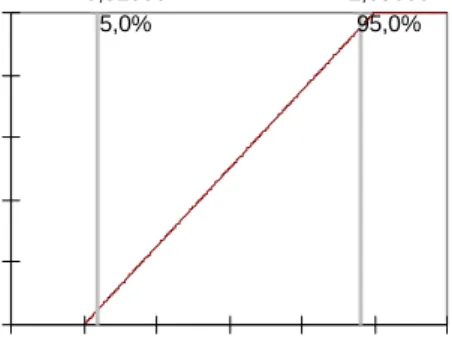
To find out how the Humanex model reacts to its input a sensitivity analysis was done. This was done by multiplying all input parameters with a value chosen randomly between 0.9 and 1.1. This deviation was set as a uniform distribution (Figure 13) with a maximum of 1.1 and a minimum of 0.9 (average 1.0).
3.2
Monte Carlo-Latin Hypercube
The Monte Carlo–Latin Hypercube method was use for randomly assigning values to parameters, and rerunning the model with these parameter sets. The next step in the sensitivity analysis is to relate the varied input with the corresponding output. For this Standardised Regression Coefficients (SRC) were calculated by the @RISK programme [1].
An SRC of one or minus one between an input parameter and an output value means that the output is completely dependent upon these input parameters.
Uniform: average 1; min. 0,9; max. 1,1)
X <= 0,91000 5,0% X <= 1,09000 95,0% 0,0 0,2 0,4 0,6 0,8 1,0 0,85 0,9 0,95 1 1,05 1,1 1,15 parameter value c u m a la ti v e c hange of s a m p ling v a lue or l e s s
Figure 13. Uniform distibution with an average of 1 and a 10% variation.
Most coefficients that will be found are low and in the range of minus 0.4 to plus 0.4.
SRC values bigger than minus 0.4 and plus 0.4 are interesting and SRC values of +/- 0.7 are considered sensitive and should be determined with more precision (Figure 14).
Figure 14. The arbitrary set range for interpreting the sensitivity for parameters. The range in which a parameter is interesting or sensitive seems large but a few parameters per module utmost are expected to be sensitive. When all parameters in a module are equally important than the SRC-values of these parameters will be the same but low.
A parameter value that depends on other altered parameter values was not altered. This would otherwise cause a doubling of the effect of the first distribution.
When fractions were altered such as the time at work, the time outside, and the time at home which always add up to 24 hours total than the largest parameter was more dependent on the smaller parameter values. E.g. Tindoor = 24 -new value of Twork – new value of Toutdoors. Thus
Tindoor was not altered directly with 10% percent (or less) but is dependent upon its smaller
complementing fractions. The same method was used for other fraction (F) that together add up to one, e.g. Fair, Fwater and Fsolids in soil add to one.
Calculated output values were automatically recorded and regressed on the input by the @RISK program.
3.3
Used compounds for the sensitivity analysis
For all compounds used in the sensitivity analysis (Table 5) a summary of the compound data is in Appendix V: Correlation data.
Table 5. Substances used for the sensitivity analysis.
Substance CAS Substance CAS
bis-pentabromophenyl-ether 1163-19-5 Ivermectin 70288-86-7
butanol 71-36-3 methanol 67-56-1
butylacetate 123-86-4 methylethylketone 78-93-3 cyclohexylamine 108-91-8 methyl-tert-butyl ether 1634-04-4 diethylene glycol 111-46-6 pentabromodiphenylether 32534-81-9
ethylacetate 141-78-6 tetrahydriothiophene 110-01-1 ethylene glycol 107-21-1 tribromomethane 75-25-2
hexachlorobutadiene 87-68-3 triethanolamine 102-71-6 Ibuprofen 15687-27-1
3.4
Summary of the sensitivity analysis results
As explained in the introduction to sensitivity analysis a high value of the SRC near minus or plus one means a highly sensitive parameter. Changing this parameter in value will cause a great change in the output of the model.
0
Range of SRC-value of a parameter
-0.4
-0.7
-1
0,4
0.7
1
sensitive not very sensitive sensitive
moderatly sensitive moderatly
Some parameters are always sensitive such as: body weight, intake rates of media (food, air, water, and soil) and predicted environmental concentrations. These parameters are not taken into account in the evaluation of the effects of the compounds on the sensitivity of the Humanex model for parameter values. Parameters that are always sensitive are listed in
Table 6.
Table 6. The predictable sensitive parameter values.
PECregionals: Human physiology: Consumption rates: Surface water Body weight Intake leaf
Pore water of agricultural soil Intake root
Agricultural soil Intake drinking water
Air Intake fish
Intake air
Intake soil
Body weight (BW) has an SRC of –0.6 to –0.7 on the total exposure with 15 compounds. In the cases of Ivermectin and bis-pentabromophenyl-ether BW has a real low SRC of less than -0.2. This is because the root lipid to octanol conversion factor (b-value) is highly sensitive in these cases. SRCs for intake rates differ according to the importance of the corresponding route of exposure. Where air is the main route of exposure the SRC IHair is up to 0.57. When drinking water is the main route of exposure the SRC IHdrw is up to 0.58. Where fish is the 65 % of the main route of exposure the SRC IHfish is up to 0.47 (hexachlorobutadiene).
3.4.1 Sensitivity analysis results per route of exposure
The highest relative exposure is given for each module. As compounds behave differently, a different compound is expected to be most important per module (Table 7).
Fish Module
The highest exposure through fish is 65.2 % with hexachlorobutadiene. The SRC for the Kow
parameter over total exposure is 0.41, that is moderately sensitive.
Air Module
The exposure to tetrahydrothiophene is for 93 % through air. The sensitive parameters are the intake rates of air (SRC of 0.56) and body weight (SRC of –0.59).
Root Module
The highest exposure through root is 47 % with the veterinary drug Ivermectin. The SRC for b-value is 0.92, that is highly sensitive. Even when the exposure via root is only 20 percent, as with bis-pentabromophenyl-ether than the SRC is still 0.78.
Plant Module
Exposure to diethylene glycol is mainly through drinking water. But the exposure to leafy plant products is the highest with DEG, that is 35.6 % with an SRC of –0.23 for the density of plant tissue and SRC of –0.13 for the volume of the leaf. None of these SRCs are sensitive.
Drinking Water Module
The highest exposure through drinking water is 98.3 % with ethylene glycol. The SRC for body weight and intake rate of drinking water are sensitive but no other parameters are sensitive.
Meat and Milk Module
The indirect exposure of humans to bis-pentabromophenyl-ether is for 30.8 % through meat and 30.7 % through milk. Cattle take the contaminant up by eating soil particles attached to the grass. These particles contain the contaminant. This explains the SRC of 0.16 for the RHOsolid-parameter value and SRC of 0.15 for the dry weight soil-parameter value. Kow has
an SRC of 0.26. Kow is used in the BTF calculations. All three parameters are insensitive.
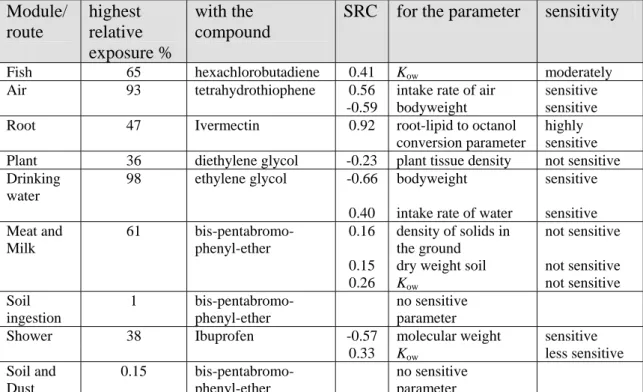
Table 7. Sensitivity analysis results per route of exposure. Module/ route highest relative exposure % with the compound
SRC for the parameter sensitivity
Fish 65 hexachlorobutadiene 0.41 Kow moderately
Air 93 tetrahydrothiophene 0.56 intake rate of air sensitive
-0.59 bodyweight sensitive
Root 47 Ivermectin 0.92 root-lipid to octanol conversion parameter
highly sensitive Plant 36 diethylene glycol -0.23 plant tissue density not sensitive Drinking
water
98 ethylene glycol -0.66 bodyweight sensitive 0.40 intake rate of water sensitive Meat and Milk 61 bis-pentabromo-phenyl-ether 0.16 density of solids in the ground not sensitive 0.15 dry weight soil not sensitive
0.26 Kow not sensitive Soil ingestion 1 bis-pentabromo-phenyl-ether no sensitive parameter
Shower 38 Ibuprofen -0.57 molecular weight sensitive
0.33 Kow less sensitive Soil and Dust 0.15 bis-pentabromo-phenyl-ether no sensitive parameter Soil Ingestion Module
Soil ingestion is at most relevant for one percent with bis-pentabromophenyl-ether and no parameter corresponding to this route has an SRC outside the minus 0.1 to plus 0.1 range.
Shower Module
The highest exposure through showering is with Ibuprofen for 38 %. The sensitive parameter is molecular weight with SRC of –0.57 and less sensitive Kow with SRC of 0.30. Molecular
weight is related to Kow and size. The more hydrophobic and larger a molecule is the more
difficult the molecule diffuses into the skin of man, hence the negative related SRC of –0.57.
Soil and Dust Module
The exposure to soil through dust inhalation and dermal exposure to soil particles is of minor importance and total together at maximum 0.15 percent. The total exposure is not sensitive for the parameters in these routes.
3.5
Conclusions from the sensitivity analysis
Parameters are either from the physico-chemical properties, module-formulas, human-descriptive-parameters or PECregs. For the physico-chemical properties Kow and molecular
weight are sensitive. For the module formulas the b-value value for root-lipid to octanol conversion parameter was highly sensitive. Parameters describing the exposure through soil
eaten by cattle are not unimportant. Human descriptive parameters, such as intake rates, for the corresponding main route of exposure are always sensitive. PECregs are also sensitive. The uncertainty in the above parameters must be the low to run the model to create precise output. It is more useful to estimate the uncertainty in the parameters from Table 6, Kow,
molecular weight and the b-value than estimating the uncertainty in other compound parameters or in the model parameters.
Above conclusions are based on the results of the sensitivity analysis which is not an uncertainty analysis in which the uncertainty in the output parameters is established. What must be kept in mind is that a less sensitive parameter with a big uncertainty can have more effect on the total uncertainty than a highly sensitive parameter with a low uncertainty. Thus it is still needed to improve the modules to remove the uncertainty in a main route of exposure. E.g. for linear alkylbenzenes the main route of exposure is through root but with a Kow of 9.12
the BCF is quite uncertain. The BCF is even more uncertain than the uncertainty in the intake rate of root products by humans.
4.
Detecting important routes and modules
All 31 compounds behave different due to their compound properties and thus have different routes of exposing adult humans. For each route the minimum and maximum relative exposure is listed in Table 8. The compound causing the relative highest or lowest exposure through a specific route is also shown. That each compound has different PECregs and different absolute exposure does not matter because all calculated exposure is relative.
Table 8. Minimum and maximum percentile of the total exposure per route.
Compound CAS min % Route max % Compound CAS
cumene 98-82-8 2.5E-2 Drinking water Both 98.3 ethylene glycol 107-21-1
acrylaldehylde 107-02-8 3.4E-3 Fish EUSES 81.4 hexachlorobutadiene 87-68-3
methylene dianaline 101-77-9 5.3E-6 Stem and leaves Both 35.6 diethylene glycol 111-46-6 methylene dianaline 101-77-9 1.3E-7 Root Both 85.1 Linear Alkylbenzenes 67774-74-7 methyl-tert-butyl ether 1634-04-4 8.4E-5 Meat EUSES 30.8 bis(pentabromophenyl) ether 1163-19-5 tetrahydriothiophene 110-01-1 2.2E-3 milk EUSES 30.7 bis(pentabromophenyl) ether 1163-19-5
Linear Alkylbenzenes 67774-74-7 0.0E+0 Air EUSES 99.7 cumene 98-82-8
methylene dianaline 101-77-9 9.9E-12 Soil ingestion CSOIL 0.5 bis(pentabromophenyl) ether 1163-19-5
diethylene glycol 111-46-6 2.9E-2 Shower CSOIL 51.1 nonylphenol 84852-15-3
methylene dianaline 101-77-9 1.2E-13 Soil inhalation CSOIL 0.01 bis(pentabromophenyl) ether 1163-19-5 methylene dianaline 101-77-9 2.6E-12 Soil contact CSOIL 0.1 bis(pentabromophenyl) ether 1163-19-5 EUSES: route is modelled according to EUSES formulas and parameter values.
Both: route is modelled according to EUSES and CSOIL formulas and parameter values, Stem and leaves and Root module are very similar in EUSES and CSOIL.
CSOIL: route is modelled according to CSOIL formulas and parameter values.
Permeation from the pore water in to the drinking water is modelled with CSOIL formulas. More compound data can be found in Appendix V: Correlation data.
Table 8 shows the maximum and minimum percentile participation of a route to the total exposure. The table clearly shows that routes that are from the CSOIL model do not influence the total exposure much. The routes soil ingestion, soil inhalation and soil contact hardly contribute to the total exposure, with at most 0.5 % for soil ingestion. The exception is showering which can contribute to 51 % to the total exposure to Ibuprofen.
Drinking water can contribute up to 98 % of the total exposure but the permeation part in the drinking water module has no influence on the total exposure as predicted in the review of the limitations of the permeation concept in paragraph 2.2.5 above.
When the soil contains an amount of contaminant at background concentration than the soil compartment plays no role in the total exposure. From this can be concluded that direct soil contact routes have little importance for the INS concept of calculating exposure from background concentrations, for the studied compounds.
The most important routes measured in maximum contribution to the exposure are the four routes: air (100 %), drinking water (98 %), root (85 %) and fish (81 %). The routes stem and leaves (36 %), meat (31 %) and milk (31 %) are also important, (Table 10). The total maximal exposure from bovine products is 62 %.
Deposition of rain splash is not an important route but can be included. The permeation model is by definition unnecessary in the Humanex concept (paragraph 2.2.5). The CSOIL exposure routes soil ingestion, dust inhalation and dermal exposure to dust are unnecessary for the calculation of the possible exposure in the Humanex concept. The shower exposure route (maximum 51 %) from CSOIL is needed. Evaporation from the soil was not modelled during the sensitivity analysis because it violates the assumption of steady state between the compartments.
Direct soil contact is not very important for exposure to background concentrations, contrary to the CSOIL scenario of living on contaminated soil. Soil consumption by children can be quite high therefore it is better to keep the direct soil contact routes in Humanex. Thus, Humanex needs routes of exposure from both EUSES and CSOIL.
Table 9. Contribution of deposition to total exposure. Compound total exposure through
deposition in % total exposure through leaves in % bis-pentabromophenyl-ether 3.74 4.1 chloro-alkanene 1.38 1.4 Biphenylol 0.80 30.2 Triclosan 0.36 3.9 Nonylphenol 0.26 0.5 Dodecylbenzene 0.07 1.9 Hexachlorobutadiene 0.03 0.2
Only compounds with relative much exposure through deposition are shown.
Table 10. The importance of each route in descending order. (Data from Table 8).
Route max % Origin Comment
Air 100 EUSES
Drinking water 98 Both possible without permeation than EUSES formulas only Root 85 Both possible with EUSES only
Fish 81 EUSES
Shower 51 CSOIL
Stem and leaves 36 Both possible without deposition than EUSES formulas only
Meat 31 EUSES
milk 31 EUSES
Soil ingestion 0.5 CSOIL Soil contact 0.1 CSOIL Soil inhalation 0.01 CSOIL
5.
Calculating Maximum Permissible Concentrations
with Humanex
5.1
MPC formulae and example calculations
With the Humanex model that predicts the relative and absolute exposure of a man to one compound at a time it is possible to calculate maximal permissible concentrations for all used compartments if the maximum permissible risk (MPR) or tolerable daily intake (TDI) is also known. First, with the Humanex model, contaminant concentrations in all human exposure media can be calculated. These contaminant concentrations can subsequently be used to calculate the direct and indirect human exposure. From this exposure the Estimated Total Exposure (ETE) for humans is calculated (Figure 15).
Compound properties Industry Cat. Use cat. Production Formulation Processing Private Use Recovery Emission Tables SimpleBox Predicted Environmental Concentrations, at Regional scale: Air, Porewater, Soil, Surface water (dissolved)
EUSES and Csoil exposure formulas
Estimated Total Exposure
Ratio
Estimated Total Exposure/ Tolerable Daily Intake
Correction: TCA = MPCair Maximal Permissible Concentrations
Concentration in media (e.g.,food, air)
Production volumes EUSES Humanex - exposure Humanex- MPCs Check: TCA > MPCair Yes No Most strict: MPC eco or MPChuman MPC
Human intake behaviour
Figure 15. Steps taken to calculate the MPChuman. Information needed to calculate a MPChuman: compound properties, production information, use and application information, human behaviour data, human toxicological data and the program EUSES to calculate the PECregs and Humanex.
Second, the ETE is compared with the Tolerable Daily Intake (TDI). If the ETE divided by the TDI is higher than 1 than the PECs (mg/kg of mg/m3) must be proportionally lowered until the ETE is equal to the TDI otherwise humans are at risk of adverse effects. When the ETE is equal to the TDI, the adjusted PECs represent MPChuman for each compartment. An
ETE/TDI with a value of less than one indicates that the exposure is lower than allowed and no risk ensues.