Noise Monitor 2010
Trend- and validation measurements of environmental noise
RIVM Letter report 630650001/2011 D.E. Lolkema et al.
Colophon
© RIVM 2011
Parts of this publication may be reproduced, provided acknowledgement is given to the 'National Institute for Public Health and the Environment', along with the title and year of publication.
D.E. Lolkema
E.N.G. Verheijen
C.J.M. Potma
J. Jabben
Contact:
Jan Jabben
Centre for Environmental Monitoring
j.jabben@rivm.nl
This investigation has been performed by order and for the account of the Ministry of Infrastructure and the Environment, within the framework of the project ‘Kenniscentrum Geluid’, project number M/630650/11.
Abstract
Noise Monitor 2010
Trend- and validation measurements of environmental noise
Along the A2, a new noise measurement series started in June 2010 after the reconstruction due to road widening had been completed. Between 2000 and 2008, the noise levels hardly changed at this location; the road consisted of six lanes with a dense asphalt concrete paving. In 2009, no measurements were conducted at this point because of the extensive road works. In the new situation, the A2 has been widened to ten lanes with double-layer porous asphalt. In this new situation, the noise level dropped considerably because the average distance from the measuring point to the lanes has increased and because of the sound reducing properties of the porous asphalt layer. Along the A12 at Voorburg, a slight increase in noise was measured in 2010. This may indicate a slight deterioration of the porous pavement which dates from 2007. Along the A10-West in Amsterdam, as in 2009, the measured noise level remained the same in 2010.
Setup and purpose of noise monitoring
These are the main results of the Noise Monitoring Program of RIVM for road traffic in 2010. The Noise Monitoring Program follows the trends in road traffic noise at four fixed points: the A2 at Breukelen, the A10-West in Amsterdam, the A12 at Voorburg and the N256 at Colijnsplaat (Zeeland). In addition, noise from rail and air traffic is monitored. For rail traffic, data from two noise monitoring sites provided by ProRail were analysed. The measurements are used to identify trends in noise emissions and to validate Statutory Standard Calculation
methods for road- and rail traffic at the measurement sites. Railways
For railways, the measurements are in line with calculations according to the standard statutory calculation method. For road traffic, the measured values at the N256, as in previous years, are higher than the calculated values.
Pilot aircraft noise
Like last year, this report contains a comparison of measurements of aircraft noise at Zegveld (20 km south of Schiphol airport) with noise data sets from the Integrated Noise Model (INM). INM is used in many studies to determine the noise levels around airports. The measurements in Zegveld are in fair agreement with the noise data from INM.
Rapport in het kort
Geluidmonitor 2010
Trend- en validatiemetingen aan omgevingsgeluid
Langs de A2 is medio 2010 een nieuwe meetreeks van de geluidbelasting gestart, nadat de reconstructie van de weg als gevolg van de verbreding is afgerond. Tussen 2000 en 2008 zijn de geluidniveaus op deze locatie nauwelijks veranderd; dit betrof de geluidbelasting van tweemaal drie rijstroken met standaard dicht asfalt beton. In 2009 is op dit punt niet gemeten vanwege de omvangrijke wegwerkzaamheden. In de nieuwe situatie is de A2 verbreed naar twee keer vijf rijstroken en voorzien van dubbellaags poreus asfalt. In deze situatie is de geluidbelasting fors gedaald doordat de gemiddelde afstand van het meetpunt tot de rijstroken is toegenomen (de reconstructie) en door de geluidreductie van het asfalt. Op de A12 bij Voorburg is in 2010 een lichte geluidtoename gemeten. Dit kan wijzen op een lichte veroudering van het poreuze wegdek dat in 2007 is aangelegd. Op de A10-West in Amsterdam is, evenals in 2009, in 2010 het gemeten geluidsniveau gelijk gebleven.
Opzet en doel geluidmonitor
Dit zijn de belangrijkste resultaten van het Geluidmonitorprogramma van het RIVM in 2010 voor het wegverkeer. De monitor volgt de trends in het geluid van wegverkeer op vier vaste meetpunten: de A2 bij Breukelen, de A10-West bij Amsterdam, de A12 bij Voorburg en de N256 bij Colijnsplaat (Zeeland). De geluidmonitor volgt op enkele locaties ook de geluidbelasting van rail- en vliegtuigverkeer; voor railverkeer worden twee meetlocaties van ProRail gebruikt. De metingen worden gebruikt om trends in de geluidsemissies te volgen en te toetsen aan de Wettelijke standaard Nederlandse Reken- en Meetvoorschriften voor wegverkeer en railverkeer.
Railverkeer
Voor railverkeer zijn de metingen in lijn met de berekeningen volgens het standaard Reken- en Meetvoorschrift. Voor wegverkeer zijn de gemeten
waarden op de N256, evenals in voorgaande jaren, wat hoger dan de berekende waarden.
Pilot metingen luchtvaartgeluid
Net als vorig jaar bevat deze rapportage een vergelijking van metingen van vliegtuiggeluid bij Zegveld (op 20 kilometer ten zuiden van Schiphol) met geluidgegevens van toestellen uit het Integrated Noise Model (INM). INM wordt in veel studies gebruikt om de geluidbelasting rondom luchthavens te bepalen. De metingen in Zegveld zijn redelijk in overeenstemming met de geluidgegevens uit INM.
Trefwoorden:
Contents
Summary 6
1 Introduction 8
1.1 Monitor locations 8
2 Road traffic noise 9
2.1 A2 motorway near Breukelen 9
2.2 A10-West motorway in Amsterdam 12
2.3 A12 motorway near Voorburg 16
2.4 N256 motorway Noord-Beveland 18
3 Railway noise 22
3.1 Monitoring stations ProRail 22
3.2 Results 22 3.3 Influence of speed 24 3.4 Conclusion 25 4 Airport noise 26 4.1 Introduction 26 4.2 Measurement set up 26 4.3 Results 27
4.4 Comparison with INM data 29
4.5 Conclusion 30
5 Conclusions 31
References 32
Appendix 1 Locations of measurement stations 34
Appendix 2 Description of measurement equipment 35
Appendix 3 Measured versus calculated noise N256 36
Appendix 4 Emission of railway vehicles 37
Summary
The Noise Monitor 2010 describes the results of the RIVM Noise Monitoring Program for road traffic and railway noise in 2010. The results are used to monitor trends in noise emission and to validate the standard calculation methods for road traffic noise and railway noise at the measurement sites. In this summary the main findings from the 2010 measurements are presented in short.
Road traffic noise
The RIVM Noise Monitoring Program contains four permanent monitoring stations: i) the A2 motorway near Breukelen, ii) the A10-West motorway in Amsterdam, iii) the A12 motorway near Voorburg and iv) the N256 in the province of Zeeland.
A2 motorway near Breukelen
The A2 motorway near Breukelen has undergone a major reconstruction from 2006 till mid-2010. The road has been widened from three to five lanes for both sides of the road and the road surface, which used to be Dense Asphalt Concrete (DAC), has been replaced by Double Layer Porous Asphalt (DLPA). The 2010 measurements showed a considerable decrease in noise level. This is a
combined result of road displacement, speed reduction and quieter road surface.
A10-West motorway in Amsterdam
Noise levels at this location have increased steadily from 2003 up until 2008, only interrupted in 2006 after the introduction of an 80 km/h speed limit. In 2009 however, noise levels at this location decreased. Measurements from 2010 also showed a decrease in noise levels at this location, however, this decrease lies within the measurement uncertainty.
A12 motorway near Voorburg
In the period 2005-2008 noise levels at this location decreased due to the introduction of a new speed limit and a repaving of the DLPA layer. In 2009, noise levels remained more or less the same, and the 2010 measurements showed an increase of 1 dB. This might be an indication that aging of the DLPA diminishes the sound reducing properties of the DLPA.
N256 motorway near Colijnsplaat (Noord-Beveland, province of Zeeland)
This location is used to validate the noise emissions calculated according to the Dutch standard calculation method for road traffic noise (RMW, 2006) at this specific site. As for previous years, measured average sound power levels are higher than the levels calculated according to the Dutch standard calculation model RMW2006.
Railway noise
The measured railway noise emission at normal driving speeds corresponds well with the calculated emission according to the national calculation method. Also, the speed-dependency of the noise emission is in line with the national standard. These results do not differ from the results of previous years.
Aircraft noise
The results of a pilot study on aircraft identification and sound power assessment show reasonable agreement with the source data from the
international Integrated Noise Model. The measurement site is at Zegveld, just outside a designated Quiet Area. Noise levels have been measured from various types of aircraft flying to and from Amsterdam Airport Schiphol (17 km away).
1
Introduction
The RIVM Noise Monitoring Program aims at monitoring noise emissions from road, railway and aircraft traffic under various meteorological conditions, by use of continuously operating measurement sites. The measurements can be used to analyse trends in noise emissions, and validate the noise propagation models which are used to support the Dutch national noise policies. The results and interpretation of the 2010 measurements are presented in this report. 1.1 Monitor locations
Monitoring road traffic noise takes place at the: A2 motorway near Breukelen;
A10-West motorway in Amsterdam; A12 motorway near Voorburg;
N256 provincial road near Colijnsplaat (Noord-Beveland, province of Zeeland). The latter site aims at monitoring the noise emission of three vehicle categories (passenger cars, medium and heavy trucks) separately. Measurements are used to assess the speed-dependency of the noise emission per vehicle category and to compare the results with the emissions according to the Dutch standard calculation method for road traffic noise (RMW, 2006).
Monitoring railway traffic takes place at:
Esch (railway line ‘s-Hertogenbosch – Eindhoven); Tilburg (railway line Breda – Tilburg).
These sites are operated and maintained by ProRail, the Dutch rail infrastructure management organization.
A pilot monitoring campaign for aircraft noise takes place at Zegveld, 17 km south of Amsterdam Airport Schiphol.
The geographical locations of these monitoring stations are shown in Appendix 1.
2
Road traffic noise
2.1 A2 motorway near Breukelen
2.1.1 Description
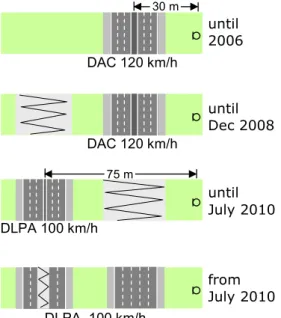
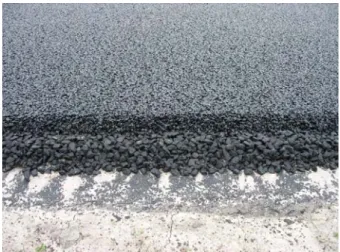
The permanent monitoring station at the A2 motorway near Breukelen has been operational since the year 2000. The motorway near the monitoring site has undergone a major reconstruction from 2006 till mid-2010. The road has been widened from 3 lanes to 5 lanes in each direction, while the road surface, which used to be Dense Asphalt Concrete (DAC), has been replaced by Double Layer Porous Asphalt (DLPA, Figure 2). In addition, the maximum speed has been reduced from 120 to 100 km/h. From December 2008 until July 2010, all traffic in both directions was directed over the new southbound road, which is further away from the monitoring site, see Figure 1. In the second half of 2010, the new northbound road opened and at the same time, the inner two southbound lanes closed for several months. Anticipating the new situation, in 2009 the
microphone has been replaced from a height of +1.5 meters to a height of +4 meters with respect to the road surface.
30 m 75 m until 2006 until Dec 2008 until July 2010 from July 2010 DAC 120 km/h DAC 120 km/h DLPA 100 km/h DLPA 100 km/h
Figure 1 Top-view of A2 motorway near Breukelen during different stages of the reconstruction works.
Figure 2 Double Layer Porous Asphalt (DLPA) at the A2 motorway near Breukelen.
2.1.2 Monitor results 2000 – 2010
Figure 3 shows the yearly average 24-hour noise level distributions for the years 2005-2008 and the year 2010. The noise level distributions for previous years can be found in the Noise Monitor 2007 (Schreurs et al., 2008). Note that the noise level in 2010 refers to two distinct traffic situations that existed in that year as described in the previous section.
2005 2006 2007 2008 60 65 70 75 80 0 12 0 12 0 12 0 12 Hour Ho u rly a v g L A e q ( d B( A )) (DAC) A2 Breukelen 2010 60 65 70 75 80 0 12 Hour (DLPA) A2 Breukelen -construction work
Figure 3 Average 24-hour noise level distributions, measured at the A2 motorway near Breukelen over the years 2005-2008 and for the year 2010.
Table 1 shows the equivalent noise levels for the day, evening and night time periods, as well as the weighted 24-hour average Lden for the years 2002-2008
and the year 2010. Levels for previous years can be found in the Noise Monitor 2007 (Schreurs et al., 2008).
Table 1 Equivalent noise levels LAeq and Lden, A2 Breukelen 2002-2008 and 2010. 2002 2003 2004 2005 2006 2007 2008 2010 LAeq, 07-19h 77.7 77.9 78.0 78.0 77.9 77.6 78.0 69.1 LAeq, 19-23h 76.2 76.6 76.6 76.5 76.4 76.3 76.7 67.4 LAeq, 23-07h 73.2 73.7 73.7 73.7 73.7 73.5 73.8 65.2 Lden 80.8 81.2 81.3 81.2 81.2 81.0 81.4 72.6
In the years 2000-2008 the noise levels hardly changed. Only the year 2008 shows a slight increase which is probably due to the construction work. The noise level in 2010 decreased considerably as a combined result of road closure, diversions and a new road surface. For this particular year, it is more interesting to look at the monthly averaged noise level distributions, see Figure 4. Although the northbound road, which is closest to the measurement site, was only taken into use in the second half of 2010, no significant increase in noise levels is observed here. 65 66 67 68 69 70
jan feb mar apr may jun jul aug sep oct nov dec Month M o n th ly av erag ed L A eq ( d B (A )) (DLPA) A2 Breukelen -construction work
Figure 4 Monthly averaged noise levels at the A2 motorway near Breukelen for the year 2010.
2.1.3 Evaluation
As the A2 traffic was diverted during 2009 and the first half of 2010, meaningful noise monitoring was not possible in this period. In the second half of 2010 the northbound traffic returned to the original road. The year 2010 should therefore be regarded as a transition year. Its averaged noise emission does not
2.2 A10-West motorway in Amsterdam
2.2.1 Description
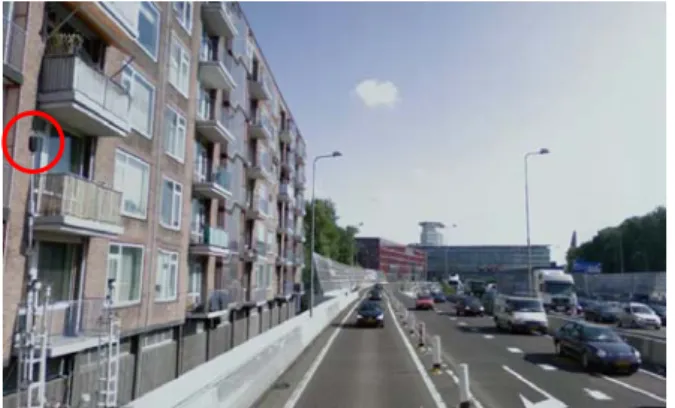
This RIVM noise monitor site is located at the east side of the A10-West in Amsterdam. Monitoring started in 2003. The noise monitor is located between the A10-West motorway and an apartment building (see Figure 5), so the monitor cannot be considered to be in the free field. A correction of 2 dB,
subtracted from the measured levels, is applied to the measurements in order to compensate for the façade reflection. The maximum speed is 80 km/h, which is strictly enforced using the average speed check system Trajectcontrole since November 2005.
Figure 5 The monitor location at the A10-West, indicated by the red circle on the left. On the right, the traffic in the north direction. The three exit lanes are separated from the main road by a low barrier. Source: Google StreetView.
The motorway is divided in twelve traffic lanes, of which three on each side are exits and weaving lanes. The road surface of the A10-West mostly consists of DLPA, but at some locations the road consists of a Porous Asphalt Concrete (PAC) layer or a Dense Asphalt Concrete (DAC) layer. The PAC layers are mainly situated at bridges and the DAC layers at exit lanes. At the location of the measurement site, the road surface consists of a PAC layer as well as a DAC layer at the exit lanes.
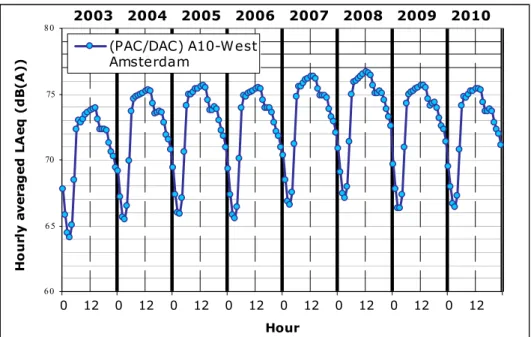
2.2.2 Monitor results 2003-2010
Figure 6 shows the yearly average 24-hour noise level distributions for the years 2003-2010. 2003 2004 2005 2006 2007 2008 2009 2010 6 0 6 5 70 75 8 0 0 12 0 12 0 12 0 12 0 12 0 12 0 12 0 12 Hour H o u rly a v e ra g e d L A e q ( d B (A )) (PAC/DAC) A10-West Amsterdam
Figure 6 Average 24-hour noise level distributions, measured at the A10-West motorway in Amsterdam over the years 2003-2010.
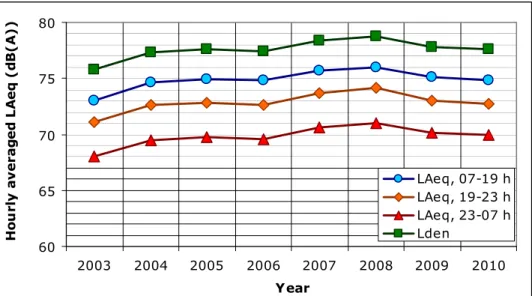
Table 2 and Figure 7 show the equivalent noise levels for the day, evening and night time periods, as well as the weighted 24-hour average Lden.
Table 2 Equivalent noise levels LAeq and Lden, A10-West Amsterdam 2003-2010.
2003 2004 2005 2006 2007 2008 2009 2010 LAeq, 07-19 h 73.0 74.6 74.9 74.8 75.7 76.0 75.1 74.8
LAeq, 19-23 h 71.1 72.6 72.8 72.6 73.7 74.2 73.0 72.7
LAeq, 23-07 h 68.0 69.5 69.8 69.6 70.6 71.0 70.1 70.0
60 65 70 75 80 2003 2004 2005 2006 2007 2008 2009 2010 Year Ho u rly av e rag e d L A e q ( d B (A )) LAeq, 07-19 h LAeq, 19-23 h LAeq, 23-07 h Lden
Figure 7 Equivalent noise levels LAeq and Lden measured at the A10-West in
Amsterdam.
Just like in 2009, the average sound levels in 2010 have decreased compared to the previous year, though less than in 2009. In 2009 the decrease was
approximately 1 dB. In 2010 the decrease is approximately 0.3 dB. This decrease however, is not present for all hours, which is shown in Figure 8.
-1,0 -0,8 -0,6 -0,4 -0,2 0,0 0,2 0,4 0,6 0,8 1,0 0 3 6 9 12 15 18 21 Hour D if fer en c e i n h o u rl y av er ag ed L A e q ( d B (A )) 20 10 -2 0 0 9
Figure 8 Difference in average 24-hour noise level distribution of the year 2010 compared to 2009. Measurements taken at the A10-West motorway in
Amsterdam.
Table 3 shows the number of vehicles and their average speeds measured at the site, using counting data provided by Rijkswaterstaat, the Dutch road authority.
Table 3 Traffic intensity and speed at the A10-West Amsterdam for the years 2004-2010. Data: Rijkswaterstaat-DVS, counting point 35675 Geuzeveld.
Daily traffic intensity Average traffic speed (km/h) Period Light vehicles Heavy vehicles Light vehicles Heavy vehicles
2004 98734 9554 92 81 2005 102535 9740 86 77 2006 98624 9584 72 77 2007 97280 9880 73 72 2008 97421 10010 72 71 2009 93400 9360 72 72 2010 89943 9480 72 71
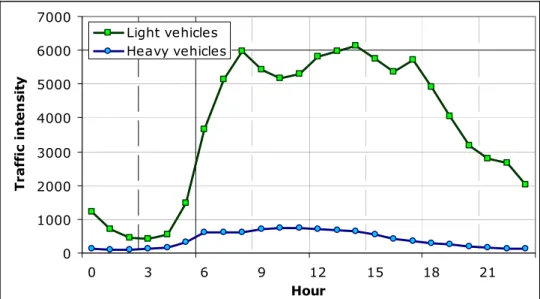
In 2010, the traffic intensity of light vehicles has decreased by 3.7% compared to 2009. Opposed to that, the traffic intensity of heavy vehicles has increased by 1.3%. The average 24-hour distribution of both traffic intensities is shown in Figure 9. Average speeds in both categories have hardly changed.
0 1000 2000 3000 4000 5000 6000 7000 0 3 6 9 12 15 18 21 Hour T ra ffic in te n sit y Light vehicles Heavy vehicles
Figure 9 The average 24-hour traffic intensity distribution for light and heavy vehicles at the A10-West Amsterdam for the year 2010.
2.2.3 Evaluation
The decrease in the observed noise level is in line with the decrease in traffic intensity of light vehicles. Note however that the decrease lies within the measurement uncertainty.
2.3 A12 motorway near Voorburg
2.3.1 Description
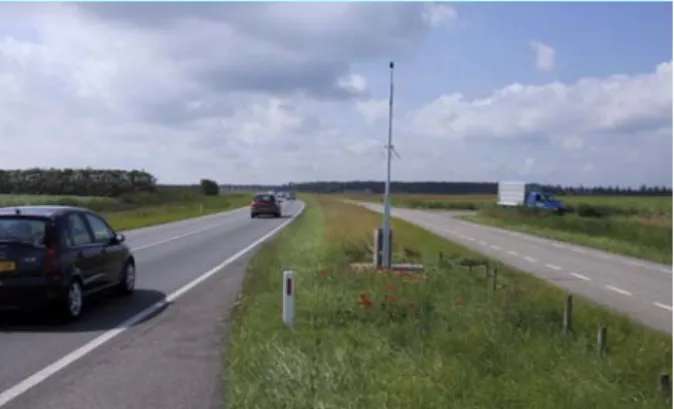
Noise monitoring at the A12 motorway near Voorburg started in July 2005. This is a two 3-lane road and a number of changes, both in speed limitations as in paving, have taken place. Initially, the speed limit was 100 km/h, the northern lanes consisted of Double Layer Porous Asphalt (DLPA) paving and the southern lanes consisted of Porous Asphalt Concrete (PAC). In November 2005, the speed limit was reduced to 80 km/h, which was enforced by Trajectcontrole. Then, in September 2007, the pavement in both directions was replaced with DLPA. Finally, in December 2009, another speed limiting measure was taken, called Dynamax. The Dynamax speed control means that at night (from 23:00 h to 05:00 h) and during the evening peak, the speed limit of 80 km/h is increased to 100 km/h. At the A12 motorway near Voorburg, Dynamax is operational at the southern lanes. An analysis of noise levels over the period December 2009 – September 2010 revealed no significant increase in noise levels (Verheijen et al., 2010).
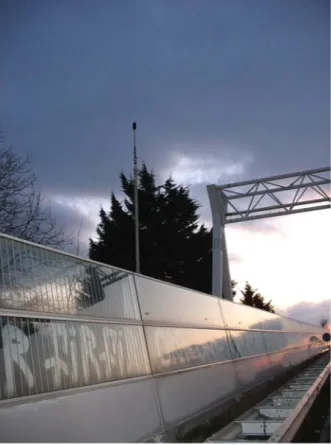
The microphone was initially placed on a traffic portal but due to accessibility and maintenance problems, the microphone was removed in July 2009 and installed alongside the northern traffic lanes in December 2009, see Figure 10. Difference due to this new microphone stand is estimated by model calculations to be +0.6 dB compared to the old situation (Verheijen et al., 2010).
Figure 10 Monitoring site at the A12 motorway near Voorburg, installed 12-12-2009.
2.3.2 Monitor results 2005-2010
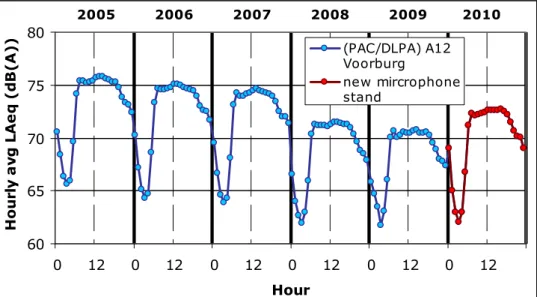
Figure 11 shows the yearly average 24-hour noise level distributions for the years 2005-2010. Noise level distributions for the years 2005 and 2009 are half-yearly averaged, as monitoring started in July 2005 and ended (by removal of the microphone) in July 2009. The measurements in 2010, with the new microphone stand and the Dynamax speed control system into effect, are indicated with a different color.
2005 2006 2007 2008 2009 2010 60 65 70 75 80 0 12 0 12 0 12 0 12 0 12 0 12 Hour H o u rly a v g L A e q ( d B (A )) (PAC/DLPA) A12 Voorburg new mircrophone stand
Figure 11 Yearly average 24-hour noise level distributions, measured at the A12 motorway near Voorburg over de years 2005-2010. The measurements with the new microphone stand and Dynamax speed control system into effect are in red.
Table 4 shows the equivalent noise levels for the day, evening and night time periods, as well as the weighted 24-hour average Lden for the years 2005-2010.
Noise levels for the years 2005 and 2009 are half-yearly averaged, as
monitoring started in July 2005 and ended (by removal of the microphone) in July 2009.
Table 4 Equivalent noise levels LAeq and Lden, A12 Voorburg 2005-2010.
2005 2006 2007 2008 2009 2010 LAeq, 07-19 h 75.5 74.7 74.2 71.3 70.2 72.4 LAeq, 19-23 h 73.8 73.0 72.5 69.4 68.5 70.6 LAeq, 23-07 h 70.2 69.3 68.9 66.2 66.1 67.3 Lden 78.1 77.3 76.9 74.0 73.6 75.1 2.3.3 Evaluation
2.4 N256 motorway Noord-Beveland
2.4.1 Description
Actual noise emission levels for passenger cars and trucks can be measured in remote areas with low traffic intensity. The N256 motorway in Noord-Beveland is such a location. In August 2004 RIVM set up a noise monitor site at the N256 motorway Noord-Beveland near Colijnsplaat in the province of Zeeland, see Figure 12. At the site, not only the noise levels, but also each car pass-by is registered together with the type of vehicle and its speed using an automated counting device. This information allows for determination of the noise emissions per vehicle category (light vehicles, middleweight trucks and heavy weight trucks). The road surface consists of a Dense Asphalt Concrete layer with stone chipping from 0-11 mm (DAC 0-11). The microphone is placed at a distance of 7.5 m from the road centerline at a height of 4 m.
Figure 12 RIVM monitoring site at N256 motorway (Noord-Beveland).
2.4.2 Method
To be able to match noise events unambiguously with individual car passes, only data between 02:00 to 04:00 a.m. is taken into account. Between 02:00 and 04:00 a.m. traffic intensity is usually low. Furthermore, only noise events with a separation time of more than 30 seconds (667 m at 80 km/h) are used to minimize the probability of measuring two or more events simultaneously. From the measured Sound Exposure Levels the SEL* values are derived,
according to the method described in Appendix 3. The SEL* values already
include the different correction factors which allows for easy comparison with the sound power level.
2.4.3 Monitor results 2004-2010
Table 5 shows the average sound power levels LWA for the different vehicle
categories for the years 2004-2010. The sound power levels were derived from the measured Sound Exposure Levels (SEL), using a reference speed of 80 km/h for light vehicles and 70 km/h for middle and heavy weight vehicles, see
Appendix 3. Also the difference with the sound power level calculated according to the Dutch standard calculation model RMW2006 is given.
Table 5 Sound power levels LWA as measured at the N256 Noord-Beveland
between 02:00 and 04:00 a.m. for the years 2004-2010, together with the difference between the years 2010 and 2009 and between 2010 and the Dutch standard calculation model RMW2006.
2004 2005 2006 2007 2008 2009 2010 Lightweight 106.0 105.8 105.6 105.3 105.7 105.9 106.0 Middleweight 109.4 109.1 108.6 108.5 108.9 108.4 108.4 Heavyweight 111.4 111.4 110.8 111.2 112.0 111.6 111.3 Difference 2010 - 2009 Measured 2010 - RMW2006 Lightweight +0.1 +3.6 Middleweight 0.0 +2.2 Heavyweight -0.3 +2.3
Figure 13 shows the SEL* values as function of the relative speed V/Vref for the
different vehicle categories. For each vehicle category the trendline with the according function is given, as well as the calculated value according to the Dutch standard calculation model RMW2006.
y = 14.695Ln(x) + 73.003 50.0 60.0 70.0 80.0 90.0 100.0 0.5 1.0 1.5 2.0 2.5 V/Vref SE L * (d B (A )) 5957 Light Vehicles RMW2006 y = 10.144Ln(x) + 75.418 50.0 60.0 70.0 80.0 90.0 100.0 0.5 1.0 1.5 2.0 V/Vref SE L * (d B (A )) 1355 Middleweight Vehicles RMW2006 y = 14.277Ln(x) + 78.305 50.0 60.0 70.0 80.0 90.0 100.0 0.5 1.0 1.5 2.0 V/Vref SE L* (d B (A )) 1439 Heavyweight Vehicles RMW2006
Figure 13 SEL* values derived from car passages between 02:00 and 04:00 a.m.
in the year 2010 as function of the relative speed (V/Vref) for light vehicles (upper panel, blue), middle weight vehicles (middle panel, orange) and heavy
2.4.4 Evaluation
Average sound power levels for passenger cars and trucks for the year 2010 stayed almost the same, compared to the previous year 2009. Over the years 2004-2010 no trend can be observed in the sound power levels for passenger cars and trucks. However, a large discrepancy between measured and calculated values is consequently found at this location. On the other hand, sample
measurements at the Amsterdamsestraatweg in Utrecht in 2009 do not show this discrepancy (Schreurs et al., 2010), whereas Peeters (Peeters, 2009) does find this discrepancy. At present, a revision of the source parameters in the Dutch calculation method is being prepared by the road authority
3
Railway noise
3.1 Monitoring stations ProRail
In 2005, the Dutch rail infrastructure management organization ProRail installed a small number of noise monitoring stations at specific locations along the railway network. RIVM has been granted access to the internet site containing the measurement data. In this Noise Monitor, pass-by measurements from the Esch and Tilburg stations are analysed, see Figure 14.
Figure 14 Measurement sites of ProRail. Tilburg (= mobile station) and Esch were operational during 2010.
The monitoring stations have been equipped with a microphone at 7.5 m from the track. Recognition of passenger trains is automated by reading the RFID tags of the vehicles. Freight trains cannot be identified this way, but are sorted out during post-processing by the web application. The noise monitoring stations render the SEL spectrum of the whole train pass-by as well as the SEL spectrum of the separate vehicles. A detailed description of the monitoring stations is given in Verheijen et al. (2008).
3.2 Results
The measurement data from the tracks and time periods given in Table 6 were used in the analysis. The selected months are based on periods in which the stations were fully operational. The monitoring stations do not allow for a direct calculation of the Lden. This is because not all pass-by's are measured.
Table 6 Measurement period and track.
site track line period (in 2010)
Esch A Eindhoven-Utrecht Jan. and May-Nov. Esch B Utrecht-Eindhoven Jan. and May-Oct.
Tilburg A Breda-Tilburg Jan.-Sep.
Instead of evaluating the Lden, the railway noise is evaluated by comparing the
measured normalized so-called emission number E* with the value that it should have according to the national Computation Method (RMR, 2006) and the
Emission Register1. The relationship between E* and the SEL is shown in
Appendix 4.
The measured noise emission is presented with and without correction for the local rail roughness. Applying a rail roughness correction is necessary if the measurement results need to be generalized. The pass-by measurements of each relevant train category (out of the eleven categories distinguished in the national computation method) are averaged and then compared to the value given by the Emission Register for that category. The results for 2010 are summarized in Table 7 and Figure 15.
Table 7 Normalized emission number E* in dB(A) according to the Emission Register (Aswin) and its deviation from measurement (measurement minus computation) in Esch (Es) and Tilburg (Tb).
Aswin without roughness
correction [dB] with roughness correction [dB] Category speed [km/h] E* Es Tb Es Tb 1 140 65.5 -0.2 1.4 0.0 1.6 2 140 66.7 -0.4 1.6 -0.3 1.8 4 90 63.4 0.7 0.7 0.8 0.9 8 140 60.3 -1.5 -2.7 -0.6 -0.7
Normalized Emission Number E* (1 vehicle per hour) in dB(A)
55 60 65 70
1. Mat64 2. ICR/DDM1 4. Cargo 8. DDM2/ICM4/IRM Aswin Esch Tilburg
Figure 15 Comparison of the emission number E* (normalized at 1 vehicle per hour) according to Aswin and the monitoring stations at Esch and Tilburg (without rail roughness correction).
The differences observed between measurements and calculations are mainly caused by:
The local rail roughness. Rail roughness tends to grow slowly until ProRail commissions the rails to be ground.
The actual pass-by speed. The Emission Register gives only the maximum speed, not the average actual speed. As the actual speeds may differ, the measured emission may deviate somewhat from the calculated emission. Deviations due to features related to the rolling stock. For instance, the wheel
roughness may vary slightly during the seasons. Variations of a few decibels on a seasonal scale are not exceptional (Verheijen et al., 2007a).
The measurement station at Esch is the only station that has been operational every year since 2006. The historical results, as can be found in the Noise Monitors since 2006, have been listed in Table 8. These series show that the normalized emission, corrected for rail roughness, can increase or decrease slightly between subsequent years. There is no clear trend.
Table 8 Deviation between measured and calculated E* in Esch with roughness correction (measurement minus computation).
Category 2006 2007 2008 2009 2010 1 0.8 0.4 0.3 0.9 0.0 2 0.4 0.1 -0.7 0.3 -0.3 4 - - - 1.9 0.8 8 0.6 0.7 1.6 -0.1 -0.6 3.3 Influence of speed
The dependency is assessed for the measurement site Tilburg. The speed-dependency is shown for the four train categories in Figure 16. A rail roughness correction is applied. It is remarked here that at present most of category 8 rolling stock consists of the IRM type, which is known to emit about 2 dB less noise than the category 8 curve (Verheijen, 2007b). The measured
speed-Category 1 50 60 70 80 90 100 110 40 60 80 100 120 140 160 Speed [ km/ h] LA e q [ d B (A )] Measurements RMR cat.1 LAeq = 12.6 Ln(speed) + 31.9 Category 2 50 60 70 80 90 100 110 40 60 80 100 120 140 160 Speed [km/h] LA e q [ d B (A )] Measurements RMR cat.2 LAeq = 16.0 Ln(speed) + 16.6 Category 4 50 60 70 80 90 100 110 40 60 80 100 120 Speed [km/h] LA e q [d B (A )] Measurements RMR cat.4 LAeq = 13.4 Ln(speed) + 29.8 Category 8 50 60 70 80 90 100 110 40 60 80 100 120 140 160 Speed [km/h] LA e q [ d B (A )] Measurements RMR cat.8 LAeq = 14.0 Ln(speed) + 16.7
Figure 16 The LAeq of the pass-by is plotted versus speed (corrected to standard rail roughness). The green curve shows the standard speed-dependency as calculated with the standard calculation method.
3.4 Conclusion
The railway noise emission at normal driving speeds, as measured at two monitoring sites in 2010, corresponds within 1 dB with the calculated emission according to the national calculation method. Also, the speed-dependency of the noise emission, as checked at the Tilburg site, is in line with the national
4
Airport noise
4.1 Introduction
There are several measurement systems for airport noise in the Netherlands that aim to monitor the noise levels as caused by airport noise by means of direct measurement. Amsterdam Airport Schiphol uses its own noise monitoring network, which is called NOMOS (NOise MOnitoring System). In addition there are the monitoring networks of ‘Geluidsnet’ (Geluidsnet, 2012), and
'Geluidconsult' using a ‘Luistervink’ system (Andringa et al., 2004) that acquire noise data in various municipalities in the neighborhood of airports. Rotterdam Airport uses RANOMOS (Rotterdam Airport NOise MOnitoring System) that allows one to relate complaints from inhabitants to specific airplanes.
Although the output of these measurement systems is not used in legislation regarding maximum allowable noise levels (these are evaluated using standard calculation of noise levels), the monitoring sites do provide valuable information as to trend developments and validation of standard models. For an extensive discussion of noise monitoring systems for airport noise see Jabben and Potma (2005) and Jabben et al. (2007).
As to the existing measurement systems, in general they do not provide - by standard - information on the noise levels caused by individual airplanes together with the type of the airplane. Such information can be useful, because in combination with the distance to the receiver the sound power levels
(indicating the amount of ‘emitted’ or produced noise) of airplanes in situ can be estimated. By consistently monitoring noise levels, airplane types and nearest distances between plane and receiver over relatively long periods of time, gradually a representative picture of noise emissions characteristics of the airport fleet can be determined. Such an approach is often used in measuring noise emission in situ along roadways or railway lines, but both on national and international level it is not practice in airport noise.
4.2 Measurement set up
4.2.1 Measurement site
In order to evaluate the possibilities to relate individual noise levels from
airplanes to the type of airplane and to assess sound power levels in situ, a pilot study was set up at a measurement site near the village of Zegveld, just outside the designated quiet area ‘Nieuwkoop and surroundings’. This site is located approximately 17 km south of Schiphol Airport, and when the southernmost runways are in use (the ‘Kaagbaan’ and the ‘Aalsmeerbaan)’, the monitor can register planes taking off from or landing at these runways.
4.2.2 Measuring apparatus
For this pilot study noise measurements were carried out using a RION NA-37 (RION, 2012). The NA-37 is capable of determining the sound source position based on sound arrival direction. The directional system allows to separate airplane noise events from other (ground) noise sources. For the analysis given
4.2.3 Airplane data
In order to connect the noise events that where identified as flights to specific aircraft data, the time of flight was matched manually with aircraft transponder information through the website Casper Live Aircraft Tracking (Casper, 2011). In this way airplane type, speed and height and minimum distance to the Zegveld receiver can be derived. From these data the sound power levels can be assessed for different types of aircraft. As not all aircraft provide transponder information, not all noise events as measured at Zegveld could be matched to a specific airplane. Also the transponder information regarding the position points of the flight tracks is less accurate as compared to the FANOMOS (Flight track and Aircraft NOise MOnitoring System) database from air traffic control. The aim of the pilot however is to obtain a sample set of passages for which noise event level and flight data can be matched and not to determine accumulated noise levels of all planes passing by. To this aim the data is considered sufficient.
4.2.4 Determination of sound power levels
To first approximation, the airplanes were considered as omnidirectional point sources. Sound power levels (LW re 10-12 W) were determined according to:
Lw ≈ SEL + 10log(4av) + 0.002a (4.1)
in which
LW : Sound Power Level in dB(A) re 10-12 Watt
SEL : Measured Sound Exposure Level at the receiver in Zegveld [dB(A)]
a : minimum distance [m] between airplane and receiver during passage
v : speed [m/s]
The last term in equation 4.1 accounts for an average noise attenuation of 2 dB per km due to air absorption.
4.3 Results
Measurements conducted between March and December 2010 were analyzed according to the method described in the previous section. In that period of time about 1750 events could be linked to specific flights using the Casper website. Of these aircraft, 60% were taking off from Amsterdam Airport Schiphol, while 40% were approaching the airport. Table 9 shows the calculated sound power levels LW for these flights, derived from the measured SEL values using Equation 4.1. The columns show the LW levels rounded off to the nearest integer, and the rows show the aircraft types that were encountered. Aircraft types with less than 5 recorded events are not shown in this table. The sound power levels reveal a range of about 15 dB for most types. The highest levels were found for the relatively old Airbus types (A330 and A310), although these were only measured once.
Table 9 Distribution of the derived sound power levels LW for descending and
ascending airplanes. LW ranges from 120 to 150 dB. Colors emphasize the
numbers of event: yellow 10-15, orange 16-25, dark orange 26-35, red 36-50.
Lw [dB] re 10-12 W
12
0 121 122 123 124 125 126 712 128 129 130 131 132 133 134 513 136 137 138 139 140 141 142 143 144 145 146 147 148 149 150
Descending/landing (1034 events) Total
a319 2 2 3 3 9 15 16 6 9 7 4 1 77 a320 2 5 2 4 10 20 20 15 8 4 2 1 1 94 a321 1 2 7 7 5 3 2 27 a330-200 1 1 2 5 2 9 3 2 3 1 1 30 b737-300 2 1 5 6 6 2 4 2 4 32 b737-400 1 1 2 1 2 2 1 1 1 12 b737-500 1 1 1 2 4 10 3 2 1 1 1 1 28 b737-600 1 1 1 2 2 1 5 2 1 16 b737-700 1 3 2 5 15 25 21 11 10 6 8 1 108 b737-800 1 1 2 9 32 29 37 48 28 21 9 7 2 1 1 228 b737-900 2 1 3 15 9 14 4 5 1 2 1 57 b747-400 1 8 10 15 21 26 16 10 4 4 2 1 1 119 b767-300 1 1 1 1 2 1 1 8 b777-200 1 1 4 4 10 5 5 4 1 3 1 1 40 bae-146-200 2 4 4 2 1 1 1 15 f100 1 2 4 6 3 5 3 2 2 1 29 f70 1 2 7 8 8 16 10 12 6 5 10 8 10 4 1 2 3 1 114
Ascending/take off (720 events) Total
a318 1 1 2 3 1 8 a319 5 5 9 13 5 5 3 1 46 a320 1 7 7 20 18 12 8 4 2 2 1 1 1 84 a321 1 4 5 18 14 11 4 2 1 60 a330-200 1 3 2 5 5 1 1 18 a340-300 1 4 1 3 3 12 b737-300 1 1 1 1 2 6 b737-700 1 2 3 3 12 16 9 6 2 1 1 56 b737-800 3 3 12 21 37 44 43 19 8 1 191 b737-900 1 1 5 8 4 9 1 1 1 31 b747-400 1 1 2 1 1 6 b777-200 1 2 6 11 10 11 17 7 3 1 69 bae-146-200 1 1 6 3 4 1 16 f100 1 2 5 3 8 6 4 3 32 f70 3 8 9 22 17 8 14 3 1 85 Lw [dB] re 10-12 W 12 0 121 122 123 124 125 126 712 128 129 130 131 132 133 134 513 136 137 138 139 140 141 142 143 144 145 146 147 148 149 150 120 125 130 135 140 145 150 155
a318 a319 a320 a321
a33 0-20 0 a340 -300 b737 -300 b737-400b737-5 00 b737 -600 b737-700b73 7-80 0 b737 -900 b747 -400 b76 7-30 0 b777 -200 ba e-146-200 f 100 f70 Lw [ d B r e 10-1 2 W ] descending ascending
4.4 Comparison with INM data
These measured results can be compared with the sound power levels that can be derived using the Integrated Noise Model (INM) of the Federal Aviation Association (FAA), which is widely used for evaluating aircraft noise (INM, 2007). From the Integrated Noise Model sound power levels LW in dB(A) can be estimated using different thrust settings for the aircraft types. The details are given in Appendix 5. In Figure 18 and Figure 19 the measured and estimated sound power levels are compared for descending and ascending aircrafts, respectively. The agreement for most aircraft types is reasonably well. Fairly large differences are found for descending A319 and ascending F100 and F70. Probably these aircraft apply different (off average) thrust settings than assumed in Appendix 5. 125 130 135 140 145 150 a319 a320 a330-200 b737-300b737-400b737-500b737-600 b737-700b737-800b737-900b747-4 00 b777-200 ba e-146-2 00 f100 f70 Lw [ d B r e 10-12 W ] Measured at Zegveld INM Descending
Figure 18 Measured and calculated sound power levels of descending flights near Zegveld. 130 135 140 145 150 Lw [ d B r e 10-12 W ] Measured at Zegveld INM Ascending
4.5 Conclusion
The results demonstrate that the measurement and analysis method described in this chapter in principal allows identifying noisy airplanes from more quiet airplanes. The method can be used to evaluate the fleet composition of an airport and to answer the question to which extent it uses the quietest airplanes available.
5
Conclusions
Road noise
The noise levels at the A2 motorway near Breukelen for the year 2010 have decreased considerably as a combined result of road displacement, speed reduction and quieter road surface. The year 2011 will probably have a more stable traffic situation.
The noise level at the A10-West motorway in Amsterdam has decreased by approximately 0.3 dB. This decrease lies within the measurement uncertainty, but it can also be attributed to the observed decrease in traffic intensity of light vehicles.
Noise levels at the A12 motorway near Voorburg have increased by 1 dB. This might be caused by aging of the DLPA surface.
Average sound power levels measured at the N256 motorway Noord-Beveland in 2010 are again higher than the levels calculated according to the Dutch standard calculation model RMW2006.
Railway noise
The measured railway noise emission at normal driving speeds corresponds within 1 dB with the calculated emission according to the national calculation method. Also, the speed-dependency of the noise emission is in line with the national standard.
Airport noise
Measurements performed at the Zegveld site demonstrate that it is possible to determine sound power levels of ascending and descending aircraft. The events could be linked to specific aircraft flying to and from Amsterdam Airport
Schiphol. On average, descending aircraft appear to be about 6 dB quieter than ascending aircraft at this measurement site (17 km from the runway).
The measured results compare fairly well with the source data of the Integrated Noise Model.
References
Andringa, T.C., van Hengel, P.W.J., Muchall, R., Nillesen, M.M. (2004) Aircraft sound level measurements in residential areas using sound source separation, Proceedings of Internoise conference, Prague.
Casper (22-07-2011), http://casperflights.com/ Geluidsnet (05-01-2012), http://www.geluidsnet.nl/
INM (2007) Integrated Noise Model (INM) version 7.0 User’s Guide, Federal Aviation Administration, Washington DC.
Jabben, J., Potma, C. (2005) Praktijkmogelijkheden Geluidmetingen Luchtvaart in het buitengebied van Schiphol, RIVM Report 680001001, RIVM, Bilthoven. Jabben, J., Potma, C., du Pon, B. (2007) Geluidmonitor 2006 (Noise Monitor 2006), RIVM Report 680300004, RIVM, Bilthoven.
Peeters, B. (2009) Actualisering emissiegetallen wegverkeer in het RMW, Proceedings national congress ‘Geluid, Trillingen en Luchtkwaliteit’. RION (05-01-2012), http://www.rion.co.jp/english/
RMW (2006) Ministry of Housing, Spatial Planning and the Environment, Appendix III to chapter 3 on Road Noise of the Reken- en Meetvoorschrift geluidhinder 2006.
RMR (2006) Ministry of Housing, Spatial Planning and the Environment, Appendix IV to chapter 4 on Railway Noise of the Reken- en Meetvoorschrift geluidhinder 2006.
Schreurs, E.M., Verheijen, E.N.G, Potma, C.J.M. and Jabben, J. (2008) Geluidmonitor 2007 (Noise Monitor 2007), RIVM Report 680740001, RIVM, Bilthoven.
Schreurs, E.M., Verheijen, E.N.G, Potma, C.J.M. and Jabben, J. (2010) Geluidmonitor 2009 (Noise Monitor 2009), RIVM Report 680740004, RIVM, Bilthoven.
Verheijen, E.N.G., Roovers, M.S. and Van den Brink, J.W. (2007a) Statistical analysis of railway noise: trackside monitoring of individual trains, Proceedings of the International Workshop on Railway Noise and Vibrations, Paper S5.1, Munich.
Verheijen, E.N.G. (2007b) Geluidemissie van de spoormaterieelcategorieën, Onderdeel 2 van project Analyse gegevens geluidmeetposten, report no. PRO020-01-16.
Verheijen, E.N.G., Potma, C.J.M. and Jabben, J. (2010) Effect van dynamische maximumsnelheden op geluid (Effect of dynamic speed limits on noise), RIVM letterreport 680013001, RIVM, Bilthoven.
Appendix 1 Locations of measurement stations
Appendix 2 Description of measurement equipment
Figure A1 Measurement system on road monitoring locations.
Figure A1 shows how the measurement system is used as monitor for raod noise.
One noise monitor consists of:
- microphone stand+pre-amp, manufactory Larson-Davis, type 2100K; - microphone, manufactory Larson-Davis, type 2541;
- statistical analyser, manufactory Larson-Davis, type 870; - gsm-modem with antenna;
- battery and charger; - container.
This type of microphone stand is useful for measurements outside. The
microphone itself is equipped with a rain cover and heating. The pre-amp has a heating to prevent the amp from moisture. The microphone is covered with a wind screen. The microphone stand comes with built-in pre-amp to amplify the signal. To prevent the microphone and the pre-amp from moisture, silica gel is used and will be replaced every three months. The statistical analyser measures the signal of the microphone and calculates various statistical parameters like A-weighted level LAeq. The analyser has an internal GSM modem with antenna,
which is connected to the microphone. A computer attached with a standard modem has to connect to the GSM modem, in order to retrieve the
Microphon cover antenna Microphone container charger battery Power supply
Appendix 3 Measured versus calculated noise N256
In order to compare measured Sound Exposure Levels with the calculated values according to the Dutch standard calculation model RMW2006, the SEL* has been
defined as:
SEL*
meas = SEL meas + 10·log(V/3600) + 10·log(R) + Dground + Dair (eq A1)
with:
SEL = Sound Exposure Level (dB(A)) of the measured vehicle pass-by
V = speed (km/h)
R = distance lane – receiver (6.7 en 9.2 m for nearest and farthest lane, respectively)
Dground = ground attenuation according to RMW2006, set at an average
value of 1 dB
Dair = air attenuation ~ 0.1 dB
According to the RMW2006 the SEL* value is given by:
SEL*
RMW06 = a + b·log (V/Vref) (eq A2)
where:
Vref = reference speed (80 km/h for light vehicles and 70 km/h for
middleweight and heavy vehicles)
If the measured SEL* are plotted against the relative speed V/Vref a logarithmic regression curve through the measurement points should coincide closely with the calculated SEL*
Appendix 4 Emission of railway vehicles
Table A3 gives an overview of the present acoustical categorization of the rolling stock.
Table A3 Categorisation scheme of rolling stock according to RMR (2006).
Category Description (braking system) Main train types
1 passenger (cast-iron block) Mat64
2 passenger (disc + add. cast-iron blocks) ICR; ICM3; DDM1
3 passenger (disc) SGM II/III, loco 1700
4 freight (cast-iron block) Cargo (cast-iron blocks) 5 passenger diesel-electr. (cast-iron block) DE
6 passenger diesel-hydraulic (disc) DM90, diesel loco 6400
7 metro (disc) metro of GVB and RET
8 modern intercity and regional (disc) ICM4; DDM2/3; IRM; ICK, SLT, GTW
9 high speed (mainly disc) Thalys; ICE3
10 light rail A32, Regio Citadis
11 silent freight Cargo (K-blocks)
The normalized emission number E*, that is judged in this research for a
number of the above categories, is based on a vehicle flow of 1 vehicle per hour. The relationship between the Sound Exposure Level and the normalized emission number E* is:
E* = SEL – 10 lg T + 10 lg a + Dground + Dair + Dmeteo – 10 lg Q (eq A3)
with:
E* = normalized emission number in dB(A) based on 1 vehicle per hour
Q = vehicle flow [#vehicles/hour] SEL = Sound Exposure Level
T = duration of the pass-by from buffer to buffer [seconds]
a = distance to heart of track (7.5 m)
Dbodem = ground attenuation (0.3 dB(A))
Dmeteo = meteocorrection (0 dB(A))
Dlucht = air attenuation (0.1 d(A))
The monitoring stations also give the number of vehicles within one pass-by. This number is used to normalize the emission. In this way, the resulting emissions can be compared mutually, independent of the vehicle flow Q.
Appendix 5 Aircraft types and INM NPD values
The calculated sound power levels of the recorded aircraft types at Zegveld are compared with the sound power levels as can be derived from the INM NPD tables. For the INM calculation, as average height for descending planes 680 m (2000 ft) was taken, while for ascending planes 1915 m (6300 ft) was used.
DESCENDING Aircraft type INM NPD id Thrust setting
(pounds)
LW (dB(A))
a319 Airbus A319 V2522A 2700
130
a320 Airbus A320 V2527A 2700
133
a330-200 Airbus A330-200 CF680E 6000
137
b737-300 Boeing 737-300 CFM563 3500
136
b737-400 Boeing 737-400 CFM563 3500136
b737-500 Boeing 737-500 CFM563 3500136
b737-600 Boeing 737-600 CF567B 4000137
b737-700 Boeing 737-700 CF567B 4000137
b737-800 Boeing 737-800 CF567B 4000137
b737-900 Boeing 737-900 CF567B 4000137
b747-400 Boeing 747-400 PW4056 10000143
b777-200 Boeing 777-200 GE90 17000138
bae-146-200 BAe 146-200 AL502R 1600
134
f100 Fokker 100 TAY650 3372
133
f70 Fokker 70 TAY620 3372
133
ASCENDING Aircraft type INM NPD id Thrust setting
(pounds)
LW (dB(A))
a319 Airbus A319 V2522A 14000
135
a320 Airbus A320 V2527A 14000
135
a321 Airbus A321 V2530 18000
138
a330-200 Airbus A330-200 CF680E 42000
144
b737-700 Boeing 737-700 CF567B 13000
139
b737-800 Boeing 737-800 CF567B 13000139
b737-900 Boeing 737-900 CF567B 13000139
b747-400 Boeing 747-400 PW4056 32000145
b767-400 Boeing 767-400 CF680C 25000137
b777-200 Boeing 777-200 GE90 41000138
bae-146-200 BAe 146-200 AL502R 1600
129
f100 Fokker 100 TAY650 4496