Contribution of secondary
inorganic aerosols to PM
10
and PM
2.5
in the Netherlands; measurement
and modelling results
Secondary inorganic aerosol (SIA) form the major fraction of particulate
matter (PM). SIA, containing ammonium nitrate and ammonium sulphate,
is almost completely of anthropogenic origin, and can be influenced by
abatement strategies. Precursor gases (NO
x, SO
2, NH
3) are emitted by traffic,
energy production and agricultural sources. The report improves the existing
knowledge on SIA, and its contribution to PM
10and PM
2.5. The focus here is
on the interpretation of measurements. Subjects studied are the climatology
and variability in time and space, the contribution to urban background
concentrations, and a comparison with modelling results.
The concentrations of secondary inorganic aerosol in the Netherlands is larger
than previously thought. The average contribution to PM
10was measured to
be 30 to 40%. This increased to more than 50% during periods with high PM
levels (i.e. ‘exceedance days’). Long-range transport and adverse meteorology
are the main reasons for these higher levels. For the period 1994 to 2007 SIA
concentrations decreased. However, from 2001 onwards, the trends weakened
which appears to be in line with changing (European) emissions of precursors.
The various data sets acquired in the BOP Program provided a good test
for the LOTOS-EUROS model.. It is concluded that the current policy tools
(monitoring, modelling) need further improvement.
This study is a BOP publication produced under the auspices of ECN.
The Netherlands Research Program on Particulate Matter (BOP) is a national
program on PM
10and PM
2.5. It is a framework of cooperation involving
the Energy research Centre of the Netherlands (ECN), the Netherlands
Environmental Assessment Agency (PBL), the Environment and Safety Division
of the National Institute for Public Health and the Environment (RIVM) and
TNO Built Environment and Geosciences.
Contribution of secondary inorganic
aerosols to PM
10
and PM
2.5
in
the Netherlands; measurement
and modelling results
E.P. Weijers (ECN), E. Sahan (ECN), H.M. ten Brink (ECN), M. Schaap (TNO),
J. Matthijsen (PBL), R.P. Otjes (ECN), F. van Arkel (RIVM)
Contribution of secondary inorganic aerosols to PM10 and PM2.5 in the Netherlands; measurement and modelling results
This is a publication of the Netherlands Research Program on Particulate Matter Report 500099006
E. P. Weijers
Contact: karin.vandoremalen@pbl.nl ISSN: 1875-2322 (print) ISSN: 1875-2314 (on line) This is a publication in the series: BOP reports Project assistant: Karin van Doremalen English editing: Annemieke Righart
Figure editing: PBL editing and production team Layout and design: RIVM editing and production team Cover design: Ed Buijsman (photographer: Sandsun) ECN Energy research Centre of the Netherlands PBL Netherlands Environmental Assessment Agency TNO Built Environment and Geosciences
RIVM National Institute for Public Health and the Environment
This study has been conducted under the auspices of the Netherlands Research Program on Particulate Matter (BOP), a national program on PM10 and PM2.5 funded by the Dutch Ministry of Housing, Spatial Planning and the Environment (VROM).
Parts of this publication may be reproduced provided that reference is made to the source. A comprehensive reference to the report reads as ‘Weijers, E.P., Sahan, E., Ten Brink, H.M., Schaap, M., Matthijsen, J., Otjes, R.P., Van Arkel, F. (2010) Contribution of secondary inorganic aerosols to PM10 and PM2.5 in the Netherlands; measurements and modelling results’.
The complete publication can be downloaded from the website www.pbl.nl. Netherlands Environmental Assessment Agency, (PBL)
PO BOX 303, 3720 AH Bilthoven, The Netherlands; Tel: +31-30-274 274 5;
Fax: +31-30-274 4479; www.pbl.nl/en
Rapport in het kort 5
Secundair anorganisch aërosol (SIA) vormt het grootste bestanddeel in fijn stof (PM). SIA, ammoniumnitraat en ammoniumsulfaat, is vrijwel geheel van antropogene oorsprong, en kan daarom beïnvloed worden door
beleidsmaatregelen. Precursor gassen (NOx, SO2, NH3) worden
geëmitteerd door verkeer, energieproductie en landbouw. Dit rapport draagt bij aan de kennis over SIA, en geeft een verbeterde schatting van de bijdrage aan PM10 en PM2.5. De nadruk ligt op de interpretatie van metingen (LML filter data, BOP meetcampagnes). De studie geeft inzicht in de variabiliteit in tijd en ruimte en de bijdrage aan de stedelijke achtergrondniveaus.
De gemiddelde concentraties van secundair inorganisch aërosol in Nederland zijn hoger dan voorheen werd aangenomen. De in deze studie gemeten bijdrage aan PM10 lag tussen 30 en 40%. Dit stijgt naar meer dan 50% tijdens periodes met hoge PM concentraties (zoals ‘overschrijdingsdagen’). De voornaamste redenen zijn lange-afstandstransport en ongunstige meteorologie. Over de hele periode 1994-2007 zijn de SIA concentraties afgenomen. Echter vanaf 2001, verliep de afname minder snel wat overeen komt met veranderingen in de Europese emissies. De verschillende data sets in het BOP programma waren een goede test voor het LOTOS-EUROS model. Een van de conclusies is dat de huidige beleidsinstrumenten (monitoring, modellering), verdere verbetering behoeven.
Trefwoorden
secundair anorganisch aërosol, ammonium nitraat, ammonium sulfaat, fijn stof, PM10, PM2.5, precursor gassen,
metingen, modellering, trend, temporele variabiliteit, ruimtelijke variabiliteit, Nederland
Contents 7
Contents
Rapport in het kort 5
1 Summary 9 1 Introduction 11 1.1 Background 11 1.2 Literature review 12 2 Experimental methods 15 2.1 Measurements 15 2.2 Modelling 17 3 Descriptive statistics 19 3.1 LML data set 19 3.2 BOP filter data set 21 3.3 MARGA system data set 21
4 Results 25 4.1 Spatial variability 25 4.2 Temporal variability 28 5 Discussion 35
5.1 Trends for NH4, NO3 and SO4 during 1994 to 2007 in the LML data set 35
5.2 Representativeness of the LML data set 38
5.3 Levels of secondary inorganic aerosol at regional, city background and traffic locations 42 5.4 Modelling of SIA by LOTOS-EUROS compared to the filter and MARGA measurements 49
References 57
Summary 9
Secondary inorganic and organic aerosols form a major fraction of particulate matter (PM). In the Netherlands, secondary inorganic aerosol (SIA) comprises on average up to 50% of the total PM concentrations. SIA, containing ammonium nitrate and ammonium sulphate, is produced in air, in droplets and on particles from sulphur dioxide, nitrogen oxides and ammonia, following complex chemical reactions. SIA is almost completely of anthropogenic origin, as its precursor gases are largely emitted by traffic, energy production and agricultural sources. Emission densities of ammonia and nitrogen oxides in the Netherlands are among the highest in Europe. SIA not only plays an important role in air quality but also in environmental issues, such as climate change, acidification and eutrophication. To efficiently reduce SIA concentrations, emissions of precursor gases are regulated on a European scale, by means of, for instance, national emission ceilings. Important uncertainties regarding SIA still exist, even though considerable progress has been made over the last decades. Filter measurements have at least 25% uncertainty. In addition, ammonium nitrate is semi-volatile, which hampers a precise measurement. Consequently, uncertainties when dealing with SIA in the Netherlands are:
absolute concentration and relative distribution
spatial and temporal behaviour, especially during episodes of high PM concentrations
contribution to urban levels of PM chemical formation
agreement between modelling and measurement The SIA climatology and variability in time and space is treated in this report, in relation to PM standards. Special attention was given to the urban increment and modelling performance. The basis for this study consisted of dedicated and routine measurements, and LOTOS-EUROS simulations. Three different data sets were used:
daily BOP filter series (2007-2008) hourly MARGA system series (2007-2008) daily LML filter series (1994-2008)
In addition, SIA filter data sets from abroad (Belgium, Germany) were used for comparison (2006-2008).
The most important results from this study are summarised here.
The contribution of SIA to PM10 and PM2.5 in the
Netherlands is larger than previously thought. This notion should be taken into account in air pollution policy as
emission reductions regarding SIA(-precursors) could then become more effective in the attainment of PM standards. It is envisaged that tools for monitoring and modelling, that are vital in air quality management in the Netherlands, need improvement and that more research is necessary. SIA dominates the PM composition, especially when
increased PM levels occur. The average contribution of SIA to PM10 in the Netherlands was estimated to be 30 to
40%. This increased to between 45 and 55% on days when PM10 was above 40 ug/m3 (and became 25 to 35% when
PM10 was less than 40 μg/m3). Long-range transport and
meteorology are the main factors influencing these higher levels.
The trends in SIA concentrations have been determined for the period between 1994 and 2007. Up to 2000, a considerable decrease was estimated for all SIA
components (especially for sulphate). From 2001 onwards, the downward trends become weaker. These trends are in line with changes in precursor emissions. Because the amount of SIA in PM appears to be higher than previously thought (see above), such trends estimations have become less certain.
The various data sets acquired in the BOP programme provided a good test for the LOTOS-EUROS model. The model underestimated the SIA levels and did not reproduce the observed gradients in SIA. This affected the estimates of the presence of SIA in PM. The temporal variability (seasonal, daily, hourly) was captured rather well. Further research is necessary to improve the model’s performance.
Contribution of SIA to PM larger than previously thought
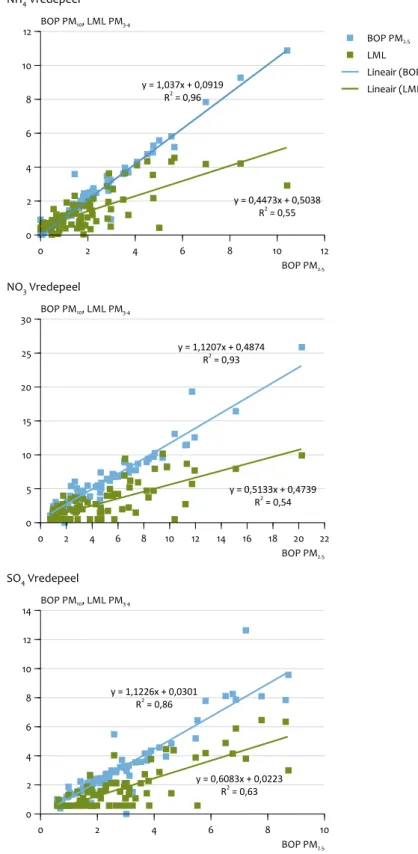
Substantial differences were observed between the SIA concentrations in the Netherlands Air Quality Monitoring Network (LML) (PM3-4) and those measured simultaneously
in the BOP campaign for PM2.5. The LML concentration for
total SIA, on average, was 36% lower. This was particularly the case for nitrate and sulphate. Deviations with simultaneously measured PM10 levels in the Belgian data set Chemkar were
of the same magnitude as those in the BOP data. It was concluded that the LML data appeared to underestimate the (assumed) PM3-4 fraction. As a consequence, the contribution
of SIA to PM10 and PM2.5 is in fact larger than was assumed
until now. The reason for the discrepancy is unknown and further research is necessary.
Spatial and temporal variability
The various data sets suggested that SIA concentrations in PM are larger in the southern and western part of the Netherlands. In particular, higher levels were observed in the urbanised regions, such as in Breda and Rotterdam, and in a rural region like Vredepeel. The regional contribution dominated the presence of SIA at the urban locations. Urban increments of SIA in PM10 of up to 3.8 μg/m3 were estimated
(depending on the compared locations). Similar results were calculated in German and Belgian data sets. The largest contribution to the urban PM10 increment came from nitrate
(2 μg/m3), followed by anthropogenic sulphate (1.2 μg/m3).
Parts of these increments are in the coarse mass fraction . The data suggest that coarse sea salt particles act as reactive sinks for nitric and sulphuric acid resulting in Cl depletion and HCl gas release. Street increments due to SIA appeared negligible in both PM10 and PM2.5.
Exceedance days
On exceedance days, or more general, on days with high PM concentrations, the increase in SIA was larger than the average increase in PM (or any other component therein). The SIA contribution on such days rose to 55%, making SIA (and nitrate, in particular) primarily responsible for these high PM levels. A relationship with wind direction was established: the high levels occurred when the wind direction was within 50º to 220º, where the major source areas are localised. Such wind directions often coincided with the occurrence of high pressure systems (mainly in winter). Under such circumstances, the supply of cold air from the European continent leads to stagnant (non-dispersive) conditions and lower mixing heights. However, next to the long-range contribution, an additional local production is suggested, which needs further clarification.
Trends
Linear trends were calculated from the LML data set (1994-2007). A decrease in the SIA contribution of 5.1 µg/m3 was
estimated over these 14 years. Presumably, this is a lower limit for a corresponding decrease of SIA in PM10 (the cut-off
diameter in the LML data set is assumed to be between 3 and 4 μm). The change was largest for sulphate: -2.3 µg/m3 and
lowest for ammonium (-1.2 µg/m3). The change for nitrate was
-1.7 µg/m3. The trends for the components at the various LML
locations did not differ greatly. Only at Vredepeel trends were weaker or absent. Downward trends between 1994 and 2000 were stronger than those starting in 2001.
The trends between 1994 and 2007 were qualitatively in line with decreasing emissions of the precursors derived from the European emissions data set, as reported by the European Monitoring and Evaluation Programme (EMEP). The slowing down after the year 2000 can be explained by the decreasing pace in precursor emission reductions. Decreases in the precursor emissions do not cause an equal decrease in SIA concentrations. Non-linear processes determining the conversion from precursor gas to SIA constituent, depend on prevailing chemical composition of the atmosphere and meteorological conditions (temperature, humidity). During the course of this study, it became apparent that the representativeness of the LML data, for PM10 and PM2.5, is
less clear (see above). Trends given here will only be valid for the mass fraction captured. It is this mass fraction that needs to be determined more precisely.
Modelling with LOTOS-EUROS
The various data sets acquired in the BOP programme, provided a good test for the LOTOS-EUROS (LE) model. The comparison showed that the model underestimates the SIA levels and does not reproduce the observed spatial gradients. It was noted that the underestimation compared to the LML data (used for validation in the past decade) was lower or absent. Further inspection revealed that baseline values appeared well estimated for ammonium and sulphate, and that the underestimation predominantly took place at the peak concentrations. For nitrate, the variability towards high concentrations was much better captured, and a systematic relative underestimation was found. The model is able to reproduce the seasonal and average diurnal variation of the SIA components. The performance of the LE model could improve further by verification of the equilibrium module, inclusion of coarse mode nitrate, and through a better understanding of the processes concerning SIA formation with a detailed analysis of the hourly data set, which is currently available.
Introduction 11
1.1 Background
This report describes research on the presence and properties of secondary inorganic aerosol (SIA) in the Netherlands, as executed within the BOP programme. SIA (ammonium, nitrate and sulphate) is important as it contains the major constituents of the particulate matter fractions PM10 and
PM2.5. In reference to the new EU Air Quality Directive , the
dominating presence of SIA is essential to the attainability of the concentration limit values of PM10 and PM 2.5, as prescribed
by thise directive. In particular, their role in the occurrence of the so-called exceedance days is important.
The majority of SIA precursors (SO2, NH3 and NOx) is of
anthropogenic origin. It has long been known that their reaction products play a role in the acidification of soil and water and eutrophication of ecosystems. The main cause of acidification is the airborne deposition of sulphur. The deposition of nitrogen compounds (nitrogen oxides and ammonia) is the cause of eutrophication of many ecosystems both on land and in the sea, but also contributes increasingly to acidification.
Air pollution may travel over long distances and cross national borders. In order to limit air pollution (including ground-level
ozone) and its consequences, the European Community has policies in place, limiting individual sources and national totals of atmospheric emissions of pollutants. In 2001, the European Directive 2001/81/EC - or NEC Directive - came into force. The NEC directive sets National Emission Ceilings for sulphur dioxide (SO2), nitrogen oxides (NOx), volatile organic
compounds (VOCs) and ammonia (NH3), and is binding for
every EU Member State (ceilings to be adhered to by 2010). Parallel to the development of the EU NEC Directive, the EU Member States – together with central and eastern European countries, the United States and Canada – have negotiated the ‘multi-pollutant’ protocol under the Convention on Long-Range Transboundary Air Pollution (the so-called Gothenburg protocol, agreed on in November 1999). These two agreements are the most important instruments to bring about emission reductions within Europe.
Although the emissions of the different pollutants drastically decreased over the last 20 years, there still is a need for additional reduction measures to meet the NEC requirements in the Netherlands. This is particularly the case for the NOx ceiling (industry en transport) and the SO2 ceiling
(industry). The determination of levels and trends of the SIA components is important in the assessment of the effects of these abatement strategies.
Introduction
1
This study is conducted under the auspices of the Netherlands Research Program on Particulate Matter (BOP), a national
program on PM10 and PM2.5, funded by the Netherlands Ministry
of Housing, Spatial planning and the Environment (VROM). The program is a framework of cooperation, involving four Dutch institutes: the Energy research Centre of the Netherlands (ECN), the Netherlands Environmental Assessment Agency (PBL), the Environment and Safety Division of the National Institute for Public Health and the Environment (RIVM) and TNO Built Envi-ronment and Geosciences.
The goal of BOP is to reduce uncertainties about particulate matter (PM) and the number of policy dilemmas, which com-plicate development and implementation of adequate policy measures. Uncertainties concerning health aspects of PM are not explicitly addressed.
The approach for dealing with these objectives is through the
integration of mass and composition measurements of PM10 and
PM2.5, emission studies and model development. In addition,
dedicated measurement campaigns have been conducted to research specific PM topics.
The results of the BOP research program are published in a special series of reports. The subjects in this series, in general terms, are: sea salt, mineral dust, secondary inorganic aerosol (this report), elemental and organic carbon (EC/OC), and mass closure and source apportionment. Some BOP reports concern specific PM topics: urban background, PM trend, shipping emissions, EC/OC emissions from traffic, and attainability of
PM2.5 standards. Technical details of the research program are
condensed in two background documents; one on measure-ments and one on model developmeasure-ments. In addition, all results are combined in a special summary for policy makers
Although vast scientific knowledge on SIA exists (as described in the next section), uncertainties remain regarding spatial and temporal variability, chemical mechanisms and modelling issues. Some of these items were selected within the BOP programme for further research. In particular, the following has been addressed in this report:
background levels, increments of city and street levels due to SIA
– One of the research goals formulated in the BOP
programme regarding secondary inorganic aerosol is the assessment of its presence in regional background air, as well as in urban air. In the design of reduction policy this issue is of interest because the (summated) SIA constitutes the largest contribution to airborne PM in the Netherlands, and can, to a certain degree, be manipulated by the implementation of political and technical measures aimed at the limitation of the emissions of the respective precursors. In particular, with (daily) exceedances for PM10 occurring mainly in
city areas, it is important to know to which extent the SIA components are ‘responsible’ for the increments in particulate matter in the urban background environment and in city streets. Also of interest are the conditions during which these days occur, in particular, the meteorological circumstances.
long-term trends in NH4, NO3 and SO4.
– Because of its timespan (1994-2007), the LML data set
provides an exquisite base for estimating the changes in SIA concentrations over the past years. Obviously, from a political point of view, it is important to assess whether the reduction strategies have been successful. The questions here are (1) if the trends observed correspond to expectations one may have considering the reduction measures limiting the emissions of SIA precursors, over the past years (in the EU), and (2) what are the reasons behind the trends and are these trends in line with current understanding? For this report, these questions have been addressed in qualitative terms, including a comparison with emission data from outside the Netherlands.
representativeness of the LML data set
– A precise estimate of the measured mass fraction in
the LML data set is not known. As these results are used for modelling purposes (OPS/LOTOS-EUROS) there is an increasing need for a more precise
determination. The BOP measurement campaigns allow the comparison between LML data (Vredepeel; PM3-4)
and simultaneously measured filter data, at the same location, for PM2.5 (and PM10).
agreement between modelling results and measurements (LOTOS-EUROS)
– The complex formation pathways for SIA are
represented in chemistry transport models in a simplified manner. In the Netherlands, the LOTOS-EUROS model (LE) is used to assess SIA levels in Europe, and for the Netherlands in particular. Although the BOP programme was not aimed to improve the modelling approaches for SIA, the data from the BOP campaign did provide a good test case for the LE model. This is especially true considering the fact that, for the first time, an hourly data set was available for a full-year period (at Cabauw). Hence, for this report, LE results
were compared to the MARGA data to study the performance in the simulation of time series and to estimate the average levels of nitrate, sulphate and ammonium. Furthermore, the report presents possible explanations of the differences that were noted, and gives directions for model improvement.
This research could be carried out, because of the availability of three different data sets, containing the results from analyses of the chemical content of particulate matter over various time scales:
daily filters (≈PM3-4) collected in the 1994-2007 period from
6 regional sites within the National Air Quality Monitoring Network (LML)
daily filters (PM10 and PM2.5) collected between August
2007 and September 2008 from 5 different types of sites (regional, urban background, traffic) (within the BOP programme)
‘on-line’ hourly measurements of SIA (PM10)
concentrations, at Cabauw, Schiedam and Hoek van Holland (partly within the BOP programme)
First, a concise review of recent literature on SIA is given.
1.2 Literature review
1.2.1 Chemical composition
Secondary Inorganic Aerosol (SIA) is composed of acids (sulphuric acid, nitric acid) and ammonium sulphate (NH4HSO4, (NH4)2SO4) and ammonium nitrate (NH4NO3) salts.
Other (less abundant) constituents are sodium sulphate (Na2SO4), calcium sulphate (CaSO4), sodium nitrate (NaNO3)
and calcium nitrate (CaNO3). They are denoted ‘secondary’
since they are the products of physical and chemical processes after emission into the atmosphere. The majority of the secondary sulphates in PM10 are a combination of
sulphuric acid and ammonium sulphate. The dominant secondary nitrate is ammonium nitrate, while a small portion may be associated with sodium.
‘Primary’ aerosols are emitted directly into the atmosphere, either by industry or natural phenomena (sea spray, wind blown dust). The SIA levels are dominant in particulate matter (PM). In urban areas they compromise up to 50% of the measured PM mass (e.g., Tsyro et al., 2003; Erisman and Schaap, 2004; Putaud et al., 2003) and are of great importance during periods with high PM concentrations (in particular, on exceedance days of PM10). SIA and the precursors have
a serious environmental impact when deposited on the earth’s surface (acidification and eutrophication). Due to their lifetimes (days to weeks) these effects are observed in ecosystems that are far away from the source areas. In addition, the SIA components play an important role in climate: directly, through the reflection and absorption of incoming solar radiation, and indirectly through the formation of condensation nuclei for cloud and fog droplets (IPCC, 2007).
1.2.2 Emission sources
Gaseous precursors of SIA are sulphur dioxide (SO2),
Introduction 13
ammonia (NH3). SO2 is released by coal-burning power
plants, cement industry and other industrial sources, such as smelters, industrial boilers, and oil refineries. Nitrogen mono-oxides and di-oxides are mostly emitted during fossil-fuel combustion, especially in cars, trucks, off-road vehicles (e.g., construction equipment and ships), power plants, and other industrial sources. Other sources of NO are bacterial processes, wildfires and lightning. Agricultural activity is the major emission source of ammonia. Additional (much smaller) contributions come from non-agricultural sources, such as oil refineries and fuel combustion. The presence of precursor gases is generally related to the strength of the corresponding emissions. However, ambient concentrations of sulphate and nitrate are not necessarily proportional to the concentrations of the precursor gases, because the rate at which they form depends on factors, such as temperature, relative humidity, and availability of NH3/NH4 (Seinfeld and
Pandis,1998; Bergin et al., 2005).
Measurements and modelling studies indicate that sulphur compounds may travel regional and even intercontinental distances, although emission takes place at point (industry) or line sources (e.g., Andrea et al., 1988; Park et al., 2004; Bergin et al., 2005). Since the oxidation of sulphate from sulphur oxide is slow, complete oxidation takes several days. During this long residence time in the air, sufficient atmospheric mixing occurs, such that pollutants generally are well distributed, regionally. Both local and regional sources contribute to the particle pollution. In practice, local and regional contributions to PM mass can be estimated by subtracting the rural concentration from the measured urban concentration after pairing a monitoring site in urban areas with a nearby rural site (e.g., EPA, 1997). The same practice was used in this study. As a result of such measurements in the highly urbanised region around (and including) New York, the percentage of transported sulphate was estimated at above 93%, while for nitrate this was between 54 and 65% (Allen and Turner, 2008). Since 1980 there has been an increased awareness of the effects of regional transport of air pollution. SO2 emission and sulphate particles in 20 European
countries have been reduced by 80 and 65%, respectively, since the LRTAP Convention in 1979 (EMEP report, 2004). In an increasing number of studies, nitrate has been found to be an important component in fine particulate matter (Magliano et al., 1999; Putaud et al. 2003; Schaap et al., 2008; Ten Brink et al., 2007). Observations and model results showed that in regions of elevated NOx and NH3 emissions,
such as in Europe and parts of North America, ammonium nitrate concentrations may be quite high and actually exceed those of sulphate (Schaap et al., 2003; Christoforou
et al., 2000; Wieprecht et al., 2004). Similar to sulphate,
the contribution of nitrate to particulate matter has also been found on a regional scale, but there is still not enough experimental data available on Europe (Ten Brink et al., 1997; Schaap 2003; EMEP report, 2004).
1.2.3 Formation pathways Sulphate particles
SO2 changes into particulate sulphate on a gas-phase or
aqueous-phase transformation path. In the first case, SO2 is
converted into sulphuric acid gas (H2SO4) by reacting with
hydroxyl radicals (OH·), oxygen (O2) and small amounts
of water vapour, as shown in the reactions 1 to 3, below. Sulphuric acid gas has a low vapour pressure, indicating a slow evaporation rate (Bauer et al., 2007). It condenses on existing particles and nucleates at high relative humidity, to form a H2SO4 droplet or, in the presence of NH3 gas, becomes
neutralised as (bi-)ammonium sulphate (reactions 4 to 5). In the marine or remote continental troposphere and in the stratosphere, where the major aerosol component is H2SO4 near the sources of gaseous NH3, ammonium
sulphate dominates, depending on the supply of NH3 relative
to the rate of H2SO4 formation. Since the conversion of
hydrogen sulfite (HSO3) to sulphuric acid (H2SO4) is fast, the
oxidation of sulphur dioxide (SO2) critically depends on the
presence of OH· radical. Since these radicals are formed by photochemistry, the gas-to-particle-conversion of SO2 knows
a diurnal, seasonal and latitudinal cycle in relation to the varying solar intensities.
OH∙ + SO2àHSO3 (1)
HSO3 + O2à HO2 + SO3 (2)
SO3 + H2O à H2SO4 (3)
H2SO4 + NH3à NH4HSO4 (4)
NH4HSO4 + NH3à (NH4)2SO4 (5)
The aqueous pathway takes place when SO2 is dissolved
in a droplet produced by fog or clouds. If ozone (O3) and
hydrogen peroxide (H2O2) are also dissolved in this droplet,
SO2 is quickly oxidised to H2SO4. If, in addition, NH3 is present,
the H2SO4 is neutralised to NH4HSO4 (Claes, 1998). Compared
to the gas-phase oxidation of SO2, the aqueous pathway
is much faster and depends on cloudiness. Therefore, it dominates in the winter period, in the lower and middle troposphere when clouds are abundantly present.
Nitrate particles
Generally, atmospheric nitrate arises from the oxidation of nitrogen dioxide (NO2) to nitric acid (HNO3), producing
particles as the result of reactions with ammonia or sodium chloride. NO rapidly oxidises to NO2 giving an extra
contribution. During the daytime, the main pathway of nitric acid formation is the reaction of NO2 with the OH radical
(reaction 6), which has a larger reaction rate than the SO2
oxidation by OH (reaction 1). During the night-time, due to low OH concentrations, the reaction of NO2 with O3 becomes
important (reactions 7 to 9). Ammonia gas reacts reversibly with HNO3 to form the ammonium salt NH4NO3 (reaction
10), which is semi-volatile and may release its gas-phase precursors under conditions of low atmospheric NH3, or at
high temperatures (e.g., Claes et al., 1998; Worobiec et al., 2003). The concentrations of NH4NO3, therefore, are often
seen to be higher during the night-time or colder periods of the year (e.g., Pun and Seigneur, 2001; Ten Brink et al., 2007).
OH∙ + NO2à HNO3 (6)
O3 + NO2à NO3 + O2 (7)
NO2 + NO3à N2O5 (8)
N2O5 + H2O à 2 HNO3 (9)
NH3 + HNO3
D
NH4NO3 (10)In marine and coastal atmospheres, HNO3 is also converted
into sodium nitrate (NaNO3) through the reaction with
sea salt particles, resulting in the release of HCl (reaction 11). In contrast to NH4NO3, NaNO3 is non-volatile (Schaap,
2003), meaning that the partitioning of HNO3 into sea salt is
irreversible. Similarly, in the presence of soil dust, HNO3 is
adsorbed easily onto these particles, forming stable products, such as Ca(NO3)2 and Mg(NO3)2 (reactions 12 to 13).
NaCl + HNO3à NaNO3 + HCl (11)
CaCO3 + 2 HNO3à Ca(NO3)2 + CO2 + H2O (12)
MgCl2 + 2 HNO3à Mg(NO3)2+ 2 HCl (13)
Generally, the chemical transformations of SO2 to particulate
sulphate and NO2 to particulate nitrate reactions compete
with each other for the available OH· radicals and NH3.
Ammonia is preferentially trapped by sulphate to form ammonium sulphate. The amount of ammonium nitrate becomes significant when the total NH3 exceeds the sulphate
by a factor of two or more on a mole basis (Schaap, 2003). Therefore, in an NH3-limited environment, reducing
(NH4)2 SO4 concentrations by one molecule would increase
NH4NO3 concentrations by two molecules. This implies that
reducing SO2 emissions might actually result in an NH4NO3
increase that exceed the reductions in (NH4)2 SO4 where the
availability of NH3 is limited.
1.2.4 Contribution of SIA components to PM10 and PM2.5
Compiled experimental data between 1994 and 1997 have shown that nitrate concentrations in the wintertime range between 4 and 6 µg/m3 over large areas of Europe. An
apparent maximum of 7 µg/m3 exists in Switzerland and
northern Italy. In the north of Europe, nitrate levels are below 2.5 µg/m3. Sulphate concentrations were measured between
3 and 7 µg/m3 in large parts of Europe. Only in the more remote
regions, the concentrations were of the order of 2 to 3 µg/m3.
Modelled concentration values suggest that sulphate and nitrate contribute 25 to 50% and 5 to 35% to PM2.5, respectively,
in Europe (Schaap, 2003).
In an extensive seven-week long field campaign to determine the chemical composition of PM2.5 at six different urban
background sites (Duisburg, Prague, Amsterdam, Helsinki, Barcelona and Athens; 2002-2003), the secondary inorganic aerosols, on average, accounted for about 40% of the PM2.5
mass. The contribution of sulphate to PM2.5 ranged between
14 and 31%. Sulphate was the dominant secondary anion in all
cities, except for Amsterdam, where nitrate concentration was higher than sulphate. The contribution of NH4 to PM2.5,
was between 7 and 10%. The ammonium nitrate concentration typically peaked in wintertime when the ambient
temperatures were low (Sillanpaa et al., 2006).
At different measuring locations in the Flemish region of Belgium (between 2001 and 2003), sulphate was the SIA component contributing most with an average concentration of 3.2 µg/m3 (contribution to PM
2.5 was 18%). Nitrate and
ammonium showed an average of 2.6 µg/m3 and 2.1 ug/m3,
respectively (being contributions to PM2.5 of around 10 and
8%). On a seasonal basis, nitrate was of comparable level to sulphate in winter, but in summer sulphate was obviously more important, having a larger thermal stability (Torfs et al., 2007).
In another field campaign (in three different urban
background locations in Germany; 2002-2003) the secondary ions comprised 40% of total PM10 (more specifically: 17%
(nitrate), 16% (sulphate) and 7% (ammonium)). The presence of SIA in the PM2.5 fraction was only slightly higher: 17, 18 and
9%, confirming that most of these compounds are found in the fine particulate mass fraction (Quass et al., 2004). Measured and modelled SIA concentrations at different sites in the Netherlands fall within the range observed for the rest of Europe. In a comparison study of two sites (Vredepeel and De Zilk; 1998 to 1999), the nitrate and sulphate concentrations were 2.2 to 4.2 and 2.7 to 6 µg/m3, respectively (Visser et al.,
2001). A campaign in November 2001 at rural Cabauw resulted in concentration values for nitrate and sulphate of 3.3 and 2.1 µg/m3, respectively (with a maximum of 12 µg/m3 for both
Experimental methods 15
2.1 Measurements
2.1.1 Location and measurement period
The locations of the monitoring sites are shown in Figure 2.1. With respect to the SIA measurements, eight locations of the Dutch National Air Quality Monitoring Network (LML) are included:
Central region: De Zilk and Bilthoven
Region North: Kollumerwaard, Valthermond, Witteveen and Wieringerwerf
Region South: Vredepeel and Huijbergen
All locations are defined as ‘regional’. Bilthoven, however, is part of the Utrecht agglomeration. Daily filter collection took place from 1 January 1994 to 31 December 2007. In the remainder the data set is denoted by ‘LML data set’. In the year 2000, the filter collection at Witteveen was ceased and moved to Valthermond (some 22 kilometres to the north-east).
The BOP filter measurements took place every second day, at the following six locations (between 15 August 2007 and 04 September 2008):
rural: Hellendoorn, Cabauw (roughly 50 km northeast of Rotterdam) and Vredepeel
urban background: Schiedam
traffic: Rotterdam-Overschie and Breda A full chemical analysis (including SIA) was performed every fourth day. The MARGA systems were situated at Schiedam (urban; DCMR), Hoek van Holland (marine; maintenance by DCMR) and Cabauw (regional). These instruments were deployed for seven months (1 August 2007 to 21 February 2008) at Schiedam, for 12 months at Cabauw (1 August 2007 to 31 July 2008) and for two months (1 September 2007 to 10 October 2007) at Hoek van Holland. In this way, the MARGA data set of hourly measurements was fully overlapped by the BOP filter data set, and for four months by the LML data set. A number of daily filters was selected to provide a data set of interesting episodes (e.g., days with high concentrations). These data were not included when calculating average concentrations or periodical behaviour. A description of the measurement strategies and experimental techniques will be included in the BOP report ‘Measurements in the BOP national program on PM10 and PM2.5: a technical background
document’ (Matthijsen et al., 2010 to be published).
2.1.2 LML data set
NO3, SO4 and NH4 (as well as Cl) are measured by the
LML, on a daily basis, using Low Volume Samplers (LVS). A constant flow (2500 l per 24 hours) passes a PM filter. Concentrations of SIA are then determined with the aid of ion-chromatography. For a diagram of the instrument see Visser et al. (2001). Data quality of this set is guaranteed by the Dutch National Institute for Public Health and the Environment (RIVM).
In the LML data set, concentration values for nitrate and sulphate are sometimes labelled as ‘below detection limit (DL)’. For the ammonium data, no DL is given. For the period between 1994 and 2001, the detection limits were
0.744 μg/m3 (NO
3) and 0.769 μg/m3 (SO4). After 2001, the DLs
were changed to 0.992 μ/m3 and 1.153 μg/m3. The number of
nitrate concentration values below DL varied between 8 and 21%; for sulphate, this was between 4 and 14% (Table 2.1). In terms of percentage, the number of data points below DL was largest for Valthermond and Witteveen. The amount of missing data relates to the absolute concentration at a location. Concentrations at Witteveen and Valthermond were among the lowest in the LML data set.
Concentration values denoted ‘below DL’ were replaced by 0.5*DL. In case of the sulphate time series, values lower than the DL were also listed. These were left unaltered, as were the (small) negative concentrations observed in the ammonium series.
2.1.3 BOP filter data set
The filters were collected according to the reference method described in the European Standard (EN12341). The measurement instrument was SEQ47/50 (Leckel GmbH, Germany). The chemical analyses for SIA were performed at the ECN. The number of days on which one of the SIA concentrations was lower than the DL was 17 (out of 1041). These were replaced by zero.
2.1.4 MARGA system data set
During the BOP campaign, hourly concentrations of inorganic components of aerosol (sulphate, nitrate, ammonium, sodium, chloride, potassium, calcium and magnesium) and the related gas-phase components in ambient air (nitric acid, nitrous acid, SO2, ammonia and hydrochloric acid) were
measured by the MARGA system (Monitoring instrument for AeRosols and GAses). The MARGA consists of two boxes: a sampling unit and an analytical unit. A mass flow
controlled air pump draws 1 m3 ambient air per hour through
the sampling box. During the campaign, an URG PM10 head
impactor was positioned as inlet on a height of four metres. The sampler unit has a Wet Rotating Denuder (WRD) for gas sampling and a Steam Jet Aerosol Collector (SJAC). Gasses are dissolved in water in the WRD, which is present as a thin film on its wall. Aerosol components have a slow diffusion speed and therefore do not dissolve in the WRD. Aerosol is collected in the SJAC (Khlystov et al., 1995). The air, stripped from water-soluble gases, is drawn through a glass mixing chamber and a 2-micron cut-off glass cyclone. In the mixing chamber, a water supersaturated condition is created by means of steam injection, forcing a water vapour condensation process.
Through condensational growth, aerosol components are quantitatively separated in the cyclone.
The detection system was continuously controlled by internal calibration with components not found in ambient air. Sample flows from the MARGA were tested once a month. The systems were compared twice (before and after the campaign) by means of external standard solutions containing all relevant components. All data were processed with the purpose to increase the quality and quantity of the data set. The data coverage ranged between 58 and 66% at Schiedam and between 68 and 82% at Cabauw. Software crashes were the main reason for the absence of data. Other
Locations of the measurement sites. Green for LML sites; blue for BOP sites and MARGA sites.
Figure 2.1
Cabauw Schiedam
Hoek van Holland De Zilk Witteveen Bilthoven Huijbergen Kollumerwaard Wieringerwerf Breda Rotterdam Vredepeel Hellendoorn Valthermond
Overview of regular and BOP measurement locations
BOP and Marga location Marga location BOP location Regular location
Number of samples with concentration values below the detection limit
# <DL # all data % Bilthoven 387 4844 8 De Zilk 820 4680 18 Huijbergen 738 4652 16 NO3 Kollumerwaard 691 4818 14 Valthermond 541 2615 21 Vredepeel 434 4797 9 Wieringerwerf 595 4669 13 Witteveen 301 2055 15 Bilthoven 177 4845 4 De Zilk 333 4680 7 Huijbergen 472 4652 10 SO4 Kollumerwaard 361 4815 7 Valthermond 350 2615 13 Vredepeel 332 4797 7 Wieringerwerf 335 4669 7 Witteveen 287 2055 14 Table 2.1
Experimental methods 17
data were lost due to servicing events and the validation process. Results from 31 December 2007 and 01 January 2008 were excluded from the data set, as New Year’s Eve fireworks lead to unusually high SIA concentrations, that is, above 100 µg/m3.
The MARGA data were compared with BOP filter data for the overlapping period (August 2007 - February 2008). For Cabauw, the absolute levels were in good agreement. However, the MARGA measurements in Schiedam appeared to deviate from the filter results. Assuming the routine filter measurements were executed without errors, the deviation was ascribed to the MARGA system in Schiedam. Both MARGA instruments were regularly tested during experimental campaigns with standard solutions. No significant differences were observed during these control tests. It was therefore concluded that the inlet flow entering the MARGA did not correspond to the measured flow. With this in mind, was decided to recalculate the MARGA concentrations at Schiedam. The correlation coefficients between the MARGA data and the filter data, for SIA, were high at this location: 0.91 (NH4), 0.93 (NO3), 0.98 (SO4) and
0.93 (Cl). For the correction factor, the average of the 4 regression coefficients was used: 0.67, 0.65, 0.69 and 0.58 (average is 0.65). In view of the regression coefficients for Cabauw (0.87 (NH4), 1.01 (SO4), 1.00 (NO3) and 1.18 (Cl);
average is 1.01), no change was made for the MARGA time series at Cabauw and Hoek van Holland.
2.2 Modelling
LOTOS-EUROS is a three-dimensional chemistry transport model (CTM) of intermediate complexity, covering Europe, developed by the Netherlands Organisation for Applied Scientific Research (TNO) and the National Institute for Public Health and the Environment (RIVM). The idea behind the model is that it should contain all relevant processes (explicitly or in a parameterised form) in such a way that hourly calculations over periods of years are feasible. The European domain ranges between 10° W to 60° E, and 35° to 70° N, with a regular 0.5 x 0.25 longitude/latitude grid. The model includes nesting and zoom options. In the vertical, the model covers the lower 3.5 kilometres of the atmosphere, divided into three dynamical vertical layers and a boundary layer of 25 metres. ECMWF analysis fields are used as the meteorology that is driving the transport. The model is used for several gases and aerosol compositions, and photochemistry with the CBM-IV scheme is included. The model yields output of hourly concentrations. The full model is described in Schaap et al. (2008).
Secondary inorganic aerosol formation in the model is represented along different pathways. The oxidation of SO2
to sulphate and NOx to nitric acid are described in the CBM-IV
gas-phase chemistry routine. The routine incorporates the gas-phase reactions presented in Section 1.2.3. Besides the oxidation of sulphur dioxide by the OH radical, another important oxidation pathway, particularly in winter, is the formation of sulphate in clouds. Due to insufficient data on clouds, this process is difficult to explicitly represent in a model. Therefore, it is represented with a first order reaction
constant that varies with cloud cover and relative humidity, similar to the approach followed by Matthijsen et al. (2002). The sulphuric acid formed is assumed to condense directly and is neutralised by ammonia. When sulphuric acid is completely neutralised, excess ammonia (further denoted as free ammonia) can react with nitric acid under formation of (volatile) ammonium nitrate. This equilibrium is very sensitive to ambient conditions, and is calculated in LOTOS-EUROS using ISORROPIA (Nenes et al., 1999). Note that the model does not include the formation of coarse mode nitrate. Within the framework of this study, LOTOS-EUROS v1.3 was used to simulate the year of the BOP measurement programme, to compare its results to the detailed data on both the SIA components and their gaseous counterparts. The model validation against LML data was laid down in the technical background report by Schaap et al. (2009). Here, the model was run from 1 August 2007 to 31 July 2008. Two sets of runs were made: one on the 0.5° lon x 0.25° lat grid of the full model domain, and one nested run over the Netherlands, from 3° to 9° E and from 49° to 55° N, on a 0.125° lon x 0.0625° lat grid. We have used the results of the nested simulation to compare against observations.
Descriptive statistics 19
This chapter summarises the basic features of the different data sets. The statistics provide insight in central tendency and dispersion. In order to obtain a first impression of the behaviour in time, validated series and correlation coefficients are presented.
3.1 LML data set
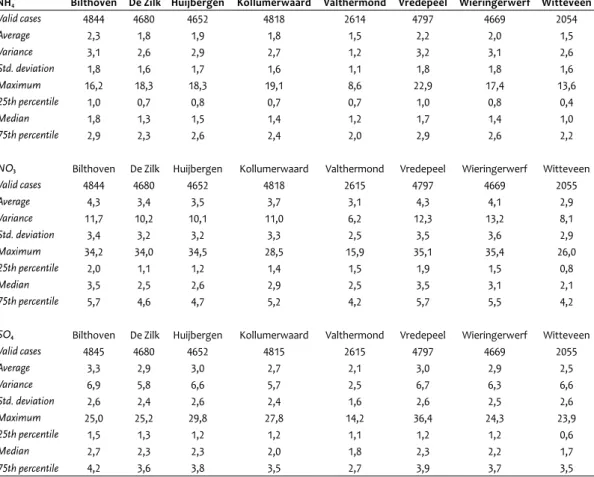
Table 3.1 provides the averages, as well as other statistics for the LML locations, with respect to SIA.
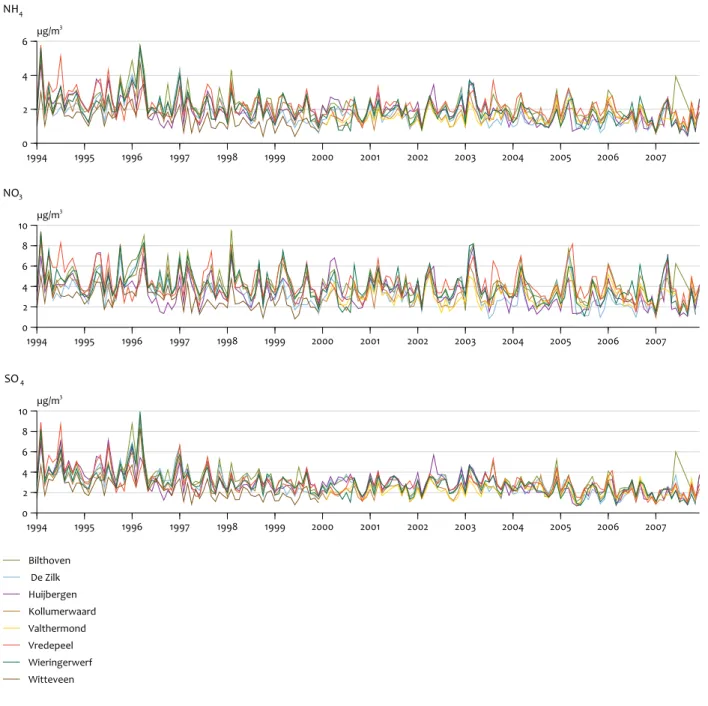
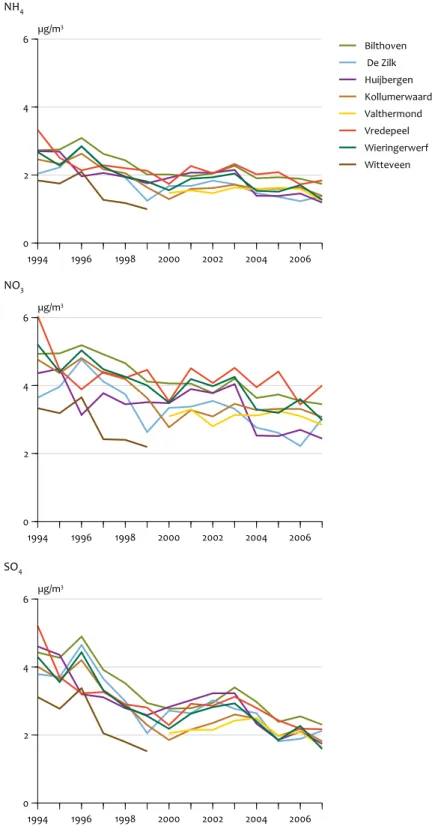
Figure 3.1 shows the validated time series as calculated for the LML data set (average monthly concentrations). The corresponding correlation coefficients (based on daily values) are given in Table 3.2.
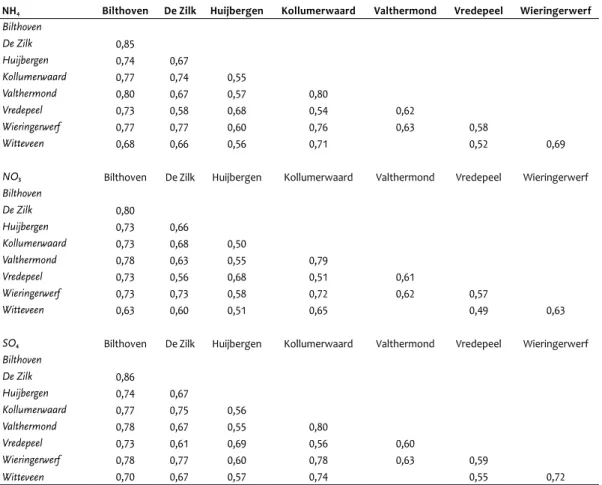
Generally, correlation between time series was moderate (0.50-0.75) to high (>0.75) which was (obviously) reflected in the rather similar behaviour in time, in Fig 3.1. The largest coefficients (0.55-0.86) were calculated for sulphate and the lowest (0.49-0.80) for nitrate. For every SIA component, the strongest relationship was observed between the sites at Bilthoven and De Zilk. The weakest similarity existed between
Descriptive statistics
3
Descriptive statistics of the LML data set
NH4 Bilthoven De Zilk Huijbergen Kollumerwaard Valthermond Vredepeel Wieringerwerf Witteveen
Valid cases 4844 4680 4652 4818 2614 4797 4669 2054 Average 2,3 1,8 1,9 1,8 1,5 2,2 2,0 1,5 Variance 3,1 2,6 2,9 2,7 1,2 3,2 3,1 2,6 Std. deviation 1,8 1,6 1,7 1,6 1,1 1,8 1,8 1,6 Maximum 16,2 18,3 18,3 19,1 8,6 22,9 17,4 13,6 25th percentile 1,0 0,7 0,8 0,7 0,7 1,0 0,8 0,4 Median 1,8 1,3 1,5 1,4 1,2 1,7 1,4 1,0 75th percentile 2,9 2,3 2,6 2,4 2,0 2,9 2,6 2,2
NO3 Bilthoven De Zilk Huijbergen Kollumerwaard Valthermond Vredepeel Wieringerwerf Witteveen
Valid cases 4844 4680 4652 4818 2615 4797 4669 2055 Average 4,3 3,4 3,5 3,7 3,1 4,3 4,1 2,9 Variance 11,7 10,2 10,1 11,0 6,2 12,3 13,2 8,1 Std. deviation 3,4 3,2 3,2 3,3 2,5 3,5 3,6 2,9 Maximum 34,2 34,0 34,5 28,5 15,9 35,1 35,4 26,0 25th percentile 2,0 1,1 1,2 1,4 1,5 1,9 1,5 0,8 Median 3,5 2,5 2,6 2,9 2,5 3,5 3,1 2,1 75th percentile 5,7 4,6 4,7 5,2 4,2 5,7 5,5 4,2
SO4 Bilthoven De Zilk Huijbergen Kollumerwaard Valthermond Vredepeel Wieringerwerf Witteveen
Valid cases 4845 4680 4652 4815 2615 4797 4669 2055 Average 3,3 2,9 3,0 2,7 2,1 3,0 2,9 2,5 Variance 6,9 5,8 6,6 5,7 2,5 6,7 6,3 6,6 Std. deviation 2,6 2,4 2,6 2,4 1,6 2,6 2,5 2,6 Maximum 25,0 25,2 29,8 27,8 14,2 36,4 24,3 23,9 25th percentile 1,5 1,3 1,2 1,2 1,1 1,2 1,2 0,6 Median 2,7 2,3 2,3 2,0 1,8 2,3 2,2 1,7 75th percentile 4,2 3,6 3,8 3,5 2,7 3,9 3,7 3,5
Descriptive statistics of the LML data set. The Witteveen data series covers the period between 1994 and 1999. From 2000 onwards, they are replaced by data from nearby Valthermond.
Vredepeel and Witteveen. After averaging the entire data set, correlations between ammonium and sulphate and between ammonium and nitrate appeared highest (0.93 and 0.92); nitrate and sulphate correlated considerably less (0.73).
Time series of average monthly concentrations of LML data over 14 years.
Figure 3.1 1994 1995 1996 1997 1998 1999 2000 2001 2002 2003 2004 2005 2006 2007 0 2 4 6 µg/m 3 NH4
Time series of average monthly concentrations of LML data over 14 years
1994 1995 1996 1997 1998 1999 2000 2001 2002 2003 2004 2005 2006 2007 0 2 4 6 8 10 µg/m 3 NO3 1994 1995 1996 1997 1998 1999 2000 2001 2002 2003 2004 2005 2006 2007 0 2 4 6 8 10 µg/m 3 Bilthoven De Zilk Huijbergen Kollumerwaard Valthermond Vredepeel Wieringerwerf Witteveen SO4 Figure 3.1
Descriptive statistics 21
3.2 BOP filter data set
The statistics concerning the BOP filter data is presented in Table 3.3.
The correlation coefficients differed more than those calculated for the LML dataset. For both mass fractions, the strongest correlations existed between the urban locations (Schiedam – Rotterdam: ≥ 0.86; Schiedam and Breda: ≥0.81). The weakest correspondences were mostly observed for the Cabauw series. PM2.5 showed similar results to PM10: a
strong(er) correspondence between the Rotterdam and Schiedam locations was calculated, but correlation with Cabauw remained relatively low. When averaging over all sites, the strongest correlation in both PM10 and PM2.5 was
between ammonium and nitrate (0.90 and 0.86, respectively), indicating the formation of ammonium nitrate. As in the LML data set, the lowest correlation was observed between nitrate and sulphate (0.63 and 0.67).
3.3 MARGA system data set
The statistics concerning the MARGA data (hourly concentrations) are presented in Table 3.4.
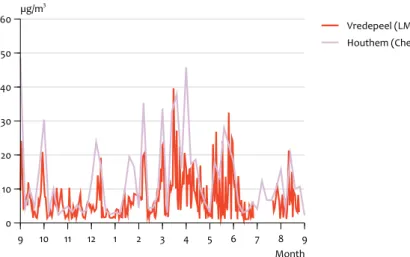
The time series at the three sites showed a high similarity with respect to SIA (Table 3.5). The largest correlation coefficients were calculated between Schiedam and Hoek van Holland. Figure 3.2 shows the time series of the hourly SIA
concentrations at the three MARGA sites, between August 2007 and February 2008. Note the high similarity in time variation (hourly) between measurements at locations some 50 km apart.
Correlation coefficients between the LML sites calculated for the daily concentrations (1994-2007)
NH4 Bilthoven De Zilk Huijbergen Kollumerwaard Valthermond Vredepeel Wieringerwerf
Bilthoven De Zilk 0,85 Huijbergen 0,74 0,67 Kollumerwaard 0,77 0,74 0,55 Valthermond 0,80 0,67 0,57 0,80 Vredepeel 0,73 0,58 0,68 0,54 0,62 Wieringerwerf 0,77 0,77 0,60 0,76 0,63 0,58 Witteveen 0,68 0,66 0,56 0,71 0,52 0,69
NO3 Bilthoven De Zilk Huijbergen Kollumerwaard Valthermond Vredepeel Wieringerwerf
Bilthoven De Zilk 0,80 Huijbergen 0,73 0,66 Kollumerwaard 0,73 0,68 0,50 Valthermond 0,78 0,63 0,55 0,79 Vredepeel 0,73 0,56 0,68 0,51 0,61 Wieringerwerf 0,73 0,73 0,58 0,72 0,62 0,57 Witteveen 0,63 0,60 0,51 0,65 0,49 0,63
SO4 Bilthoven De Zilk Huijbergen Kollumerwaard Valthermond Vredepeel Wieringerwerf
Bilthoven De Zilk 0,86 Huijbergen 0,74 0,67 Kollumerwaard 0,77 0,75 0,56 Valthermond 0,78 0,67 0,55 0,80 Vredepeel 0,73 0,61 0,69 0,56 0,60 Wieringerwerf 0,78 0,77 0,60 0,78 0,63 0,59 Witteveen 0,70 0,67 0,57 0,74 0,55 0,72 Table 3.2
Descriptive statistics of BOP filter data
PM10
NH4 Hellendoorn Breda Vredepeel Rotterdam Schiedam Cabauw
Valid cases 98 79 99 86 88 105 Average 1,4 2,3 2,2 1,9 1,8 1,8 Variance 1,6 5,5 4,6 6,2 5,0 4,1 Std. deviation 1,3 2,3 2,1 2,5 2,2 2,0 Maximum 7 11 11 15 10 10 25th percentile 0,5 0,6 0,7 0,4 0,4 0,5 Median 1,1 1,6 1,7 1,1 0,9 1,2 75th percentile 1,8 3,3 2,7 2,1 2,1 2,3
NO3 Hellendoorn Breda Vredepeel Rotterdam Schiedam Cabauw
Valid cases 98 79 100 86 88 105 Average 4,1 5,4 5,3 5,0 4,9 4,8 Variance 8,5 16,1 17,0 18,4 18,3 14,2 Std. deviation 2,9 4,0 4,1 4,3 4,3 3,8 Maximum 16 20 26 22 24 17 25th percentile 2,0 2,6 2,4 2,5 2,2 2,1 Median 3,3 4,5 4,3 3,5 3,2 3,5 75th percentile 5,5 7,5 7,3 6,9 7,3 6,5
SO4 Hellendoorn Breda Vredepeel Rotterdam Schiedam Cabauw
Valid cases 98 79 100 86 88 105 Average 2,5 3,9 3,2 3,3 3,5 2,7 Variance 2,6 11,6 7,5 7,8 8,0 5,1 Std. deviation 1,6 3,4 2,7 2,8 2,8 2,3 Maximum 11 23 16 21 23 17 25th percentile 1,4 2,1 1,6 1,9 2,0 1,3 Median 2,1 3,1 2,4 2,7 2,9 2,2 75th percentile 3,3 4,6 3,7 3,4 3,6 3,2 PM2.5
NH4 Hellendoorn Vredepeel Rotterdam Schiedam Cabauw
Valid cases 103 105 99 94 85 Average 1,5 2,0 1,6 1,7 1,6 Variance 2,3 3,6 3,7 4,1 2,3 Std. deviation 1,5 1,9 1,9 2,0 1,5 Maximum 9 10 9 9 7 25th percentile 0,5 0,7 0,4 0,4 0,6 Median 1,2 1,5 0,9 0,9 1,1 75th percentile 2,1 2,8 2,2 2,0 2,1
NO3 Hellendoorn Vredepeel Rotterdam Schiedam Cabauw
Valid cases 103 105 99 94 84 Average 3,6 4,4 3,6 3,9 4,1 Variance 11,5 12,6 13,9 16,6 12,1 Std. deviation 3,4 3,6 3,7 4,1 3,5 Maximum 21 20 21 20 16 25th percentile 1,4 1,8 1,0 1,1 1,7 Median 2,6 3,1 2,1 2,1 3,1 75th percentile 4,9 6,1 4,7 5,6 5,8
SO4 Hellendoorn Vredepeel Rotterdam Schiedam Cabauw
Valid cases 103 105 99 94 84 Average 2,5 2,9 2,5 2,9 2,6 Variance 3,6 4,8 4,1 5,5 4,5 Std. deviation 1,9 2,2 2,0 2,3 2,1 Maximum 10 14 16 18 16 25th percentile 1,2 1,5 1,5 1,6 1,3 Median 2,3 2,3 2,1 2,5 2,2 75th percentile 3,3 3,5 2,9 3,4 3,3 Table 3.3
Descriptive statistics 23
Time series of hourly NH4, NO3 and SO4 concentrations at the three MARGA sites, between August 2007 and
February 2008. 2007 2008 0 5 10 15 20 25 NH
Time series of hourly NH₄, NO₃ and SO₄ concentrations (MARGA) at the three locations
2007 2008 0 10 20 30 40 Schiedam Cabauw HvH SO 2007 2008 0 10 20 30 40 NO3 4 4 µg/m3 µg/m3 µg/m3
The statistics concerning the MARGA data
PM10 NH4 NO3 SO4
Schiedam Cabauw HvH Schiedam Cabauw HvH Schiedam Cabauw HvH
Valid cases 3332 3807 1112 3297 4064 1081 3142 4028 1030 Average 2,4 2,2 1,6 6,0 5,7 4,5 4,1 2,9 3,1 Std. deviation 2,9 2,3 2,3 5,6 5,1 4,8 3,7 2,6 2,6 Maximum 24 18 11 37 34 28 39 27 18 25th percentile 0,5 0,6 0,1 2,0 2,1 1,1 1,9 1,3 1,5 Median 1,2 1,3 0,6 4,0 4,1 2,8 3,1 2,1 2,3 75th percentile 3,3 3,1 2,3 8,1 8,0 6,5 4,9 3,6 3,7 Table 3.4
Correlation coefficients between the MARGA sites calculated for the hourly concentrations
NH4 Schiedam Cabauw NO3 Schiedam Cabauw SO4 Schiedam Cabauw
Cabauw 0.90 Cabauw 0.90 Cabauw 0.81
HvH 0.96 0.93 HvH 0.97 0.86 HvH 0.90 0.84
Table 3.5
Results 25
4.1 Spatial variability
4.1.1 LML data
Averages per LML location (with standard deviation) are shown in Figure 4.1 and summarised in Table 4.1. Irrespective of the component, the highest concentrations were observed at Bilthoven (Utrecht agglomeration), Vredepeel (rural, region south) and, to a lesser extent, Wieringerwerf. The lowest levels were measured at Witteveen and Valthermond (region north: Witteveen: 1994-1999; Valthermond: 2000-2007). No attempt was made to correct for the contribution of sea salt to sulphate (as data for sodium were not available).
The high SIA concentrations at Bilthoven were comparable to those observed at Vredepeel, a location known to be affected by the nearby emissions from livestock activity. It is likely that the relatively high SIA presence at Wieringerwerf occurred for the same reason. It was noted that the distribution for the three components, in terms of percentage, was rather independent of location (Table 4.1).
4.1.2 BOP filter measurements
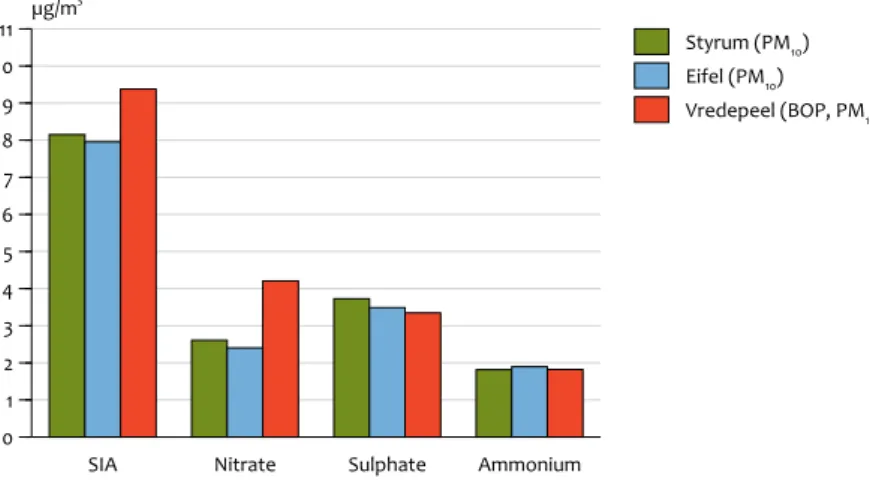
Averages per location (with standard deviation) are shown in Figure 4.2 and summarised in Table 4.2. The highest levels were measured for every component, at the urban traffic location Breda, which resulted in the largest contribution of SIA to PM10 in the BOP filter data set (11.6 µg/m3). Especially
sulphate was enhanced here (SO2 emissions possibly coming
from the Antwerp region).
Regarding the other BOP locations, higher levels of ammonium and nitrate, in both PM10 and PM2.5, were
measured at Vredepeel (similar to the LML network), resulting in the second largest contribution to PM: 10.6 µg/m3 (PM
10) and 9.4 µg/m3 (PM2.5). This was followed by
the two sites in the Rotterdam region, where maximum concentrations of sulphate prevailed (probably caused by nearby industry). Furthermore was observed that the Rotterdam location showed rather low levels of PM2.5 (as yet
unexplained). The lowest concentrations were measured at Hellendoorn: here, the SIA contribution to PM10 and PM2.5 was
8.0 µg/m3 and 7.6 µg/m3, respectively.
Results
4
Average concentrations of NH4, NO3 and SO4 over 14 years, at all LML sites (measurements at Witteveen performed
up to 1999; after that replaced by the Valthermond location).
Figure 4.1 Bi lth ov en Vr ed ep ee l W ie rin ge rw er f H uijb er ge n Ko llu m er w aa rd D e Zi lk W itt ev ee n Va lth er m on d 0 2 4 6 8 10 12 µg/m 3 SO4 NO3 NH4
4.1.3 MARGA measurements
Averages for the two (three) locations (with standard deviation) are shown in Figure 4.3 and summarised in Table 4.3. In general, SIA levels at Schiedam were higher, compared to Cabauw. The largest increase was observed for sulphate: +1.2 μg/m3 (+41%). In the case of nitrate and ammonium,
differences with Cabauw appeared moderate, that is, less than 0.3 μg/m3 (<8%). Sulphate at Hoek van Holland was
comparable with that at Schiedam (3.4 to 3.5; averages over two months), but the nitrate concentration was considerably lower here.
In summary, we concluded that the three data sets led to similar observations. Always, nitrate contributed most to the PM fractions, followed by sulphate and ammonium. When averaged over all data sets, the total SIA concentrations were Average concentrations of NH4, NO3 and SO4 and their contribution to SIA
LML NH4 NO3 SO4 SIA NH4 NO3 SO4
Jan 1994 - Dec 2007 µg/m3 % in SIA
Bilthoven 2.3 4.3 3.3 9.9 23 43 34 De Zilk 1.8 3.4 2.9 8.0 22 42 36 Huijbergen 1.9 3.5 3.0 8.3 23 41 35 Kollumerwaard 1.8 3.7 2.7 8.3 22 45 33 Valthermond 1.5 3.1 2.1 6.8 23 46 32 Vredepeel 2.2 4.3 3.0 9.5 23 45 32 Wieringerwerf 2.0 4.1 2.9 8.9 22 46 32 Witteveen 1.5 2.9 2.5 6.9 22 42 36 Total average 1.9 3.6 2.8 8.3 23 44 34 Table 4.1
Average concentrations of NH4, NO3 and SO4 measured in PM10 and PM2.5, for the period from September 2007 until
August 2008, at the six BOP locations.
Figure 4.2
Breda VredepeelRotterdam Schiedam Cabauw Hellendoorn 0 2 4 6 8 10 12 measured in PM10
Average concentrations of NH4, NO3 and SO at six BOP locations4
SO4 NO3 NH4
VredepeelRotterdam Schiedam Cabauw Hellendoorn 0 2 4 6 8 10 12 measured in PM2.5 Breda µg/m3 µg/m3
Results 27
Average concentrations of NH4, NO3 and SO4 and total SIA in PM10 and PM2.5
BOPfilter-PM10 NH4 NO3 SO4 SIA NH4 NO3 SO4
Aug 2007 - Aug 2008 µg/m3 % in SIA
Hellendoorn 1.4 4.1 2.5 8.0 17 52 31 Breda 2.3 5.4 3.9 11.6 20 47 34 Vreedenpeel 2.2 5.3 3.2 10.6 20 50 30 Rotterdam 1.9 5.0 3.3 10.2 19 49 32 Schiedam 1.8 4.9 3.5 10.2 18 48 34 Cabauw 1.8 4.8 2.7 9.3 19 52 29 Total average 1.9 4.9 3.2 10.0 19 49 32 BOPfilter-PM25 NH4 NO3 SO4 SIA NH4 NO3 SO4
Aug 2007 – Aug 2008 µg/m3 % in SIA
Hellendoorn 1.5 3.6 2.5 7.6 20 48 32 Breda Vreedenpeel 2.0 4.4 2.9 9.4 21 48 31 Rotterdam 1.6 3.6 2.5 7.7 21 47 32 Schiedam 1.7 3.9 2.9 8.5 20 46 35 Cabauw 1.6 4.1 2.6 8.3 19 50 32 Total average 1.7 3.9 2.7 8.3 20 47 32
Average concentrations of NH4, NO3 and SO4 and total SIA in PM10 and PM2.5, as measured between September 2007
and August 2008, at the six BOP locations.
Table 4.2
Averages of NH4, NO3 and SO4 (in PM10) over the period from August 2007 to February 2008, at Schiedam and
Cabauw (above), and over a two-month period (September-October) in 2007 that included the MARGA operation at Hoek van Holland (HvH).
Figure 4.3
Schiedam Cabauw Hoek van Holland 0 4 8 12 16 September 2006 - October 2007 µg/m3 Schiedam Cabauw 0 4 8 12 16 µg/m 3 SO4 NO3 NH4 August 2007 - February 2008
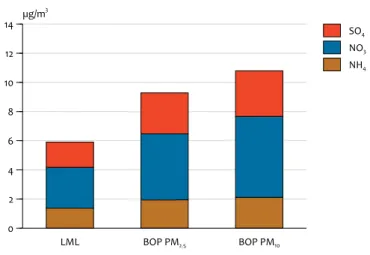
lowest in the LML data set and highest in the MARGA (PM10)
data set. It is supposed that – apart from different types of locations, collection cut-off diameters, instrumental design and measurement periods – volatilisation losses from the filters (absent in the MARGA system) also played a role here. In spite of the concentration differences measured between locations, the above shows that the component distributions in PM appeared rather similar. In the MARGA data set, the distribution, on average, was 50% for nitrate, 30% for sulphate and 20% for ammonium, rather close to what was found in the BOP filter data (49%, 32% and 19%, respectively). In the LML set (restricted to regional locations) relatively more ammonium and less nitrate and sulphate was measured.
The comparability between the various data sets is discussed further in Section 5.2.
4.2 Temporal variability
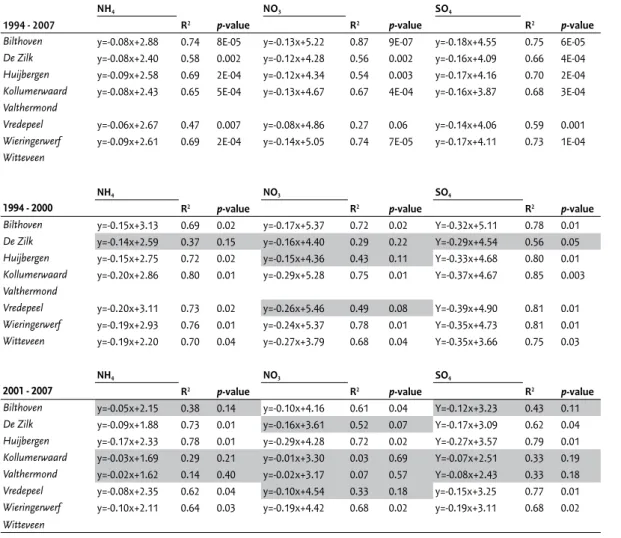
4.2.1 Linear trend analysis LML filter data
The average annual SIA concentrations during the period from 1994 to 2007 are shown in Figure 4.4, for every LML location. On average, concentration levels decreased during these 14 years. Downward trends could be observed between 1994 and 2000, particularly in the case of sulphate. After the year 2000, however, the downward trend seemed to weaken or was even absent, with exceptions during shorter time intervals. For example, for sulphate, there was a rise up to 2003 and a decrease from 2004 onwards. The year 2003 was characterised by enduring dry episodes in the summer. In the figure, the variation between the trends at the various locations appeared smallest for sulphate and largest for nitrate. This could already be anticipated from the correlation coefficients (Table 3.2). After the localised emissions (main source areas: Rotterdam and surroundings, southern part of the province Zeeland, Antwerpen area and IJmuiden) and fast chemical conversion, the meteorological variability determined the concentration levels in the (downwind) regions. The same kind of argument could be applied for NH3 and NH4. At first, the formation of NH4 depended on
the quantity of SO2. With sufficient NH3, the formation of
ammonium nitrate started. Precursors of nitrate were emitted from traffic in the highly urbanised areas in the western (except Zeeland) and southern part of the country, and, hence, large gradients may have existed. These emissions may have easily influenced measurements at an LML location. Moreover, the chemical formation route was more complex and slower.
From Figure 4.1 it was concluded that the Valhermond and Witteveen levels were rather similar, in spite of the fact that these were calculated for different (consecutive) periods. Figure 4.4 shows that the trends for these two locations did not match very well for the year 2000: concentrations at Valthermond appeared higher than at Witteveen. The long-term behaviour has been quantified in Table 4.4, which summarises the results from linear regression analyses. The dependent variable here was the concentration. The number of years since the start of the measurements was chosen as the independent variable. The resulting regression coefficient gave the change in concentration in µg/m3 per
year. The so-called p-value has been estimated, giving the chance that the calculated result was based on coincidence. In general, when p<0.05, the linear relationship was
considered to be ‘statistically significant’, meaning that, with a 95% certainty, the change in concentration could not be attributed to coincidental circumstances.
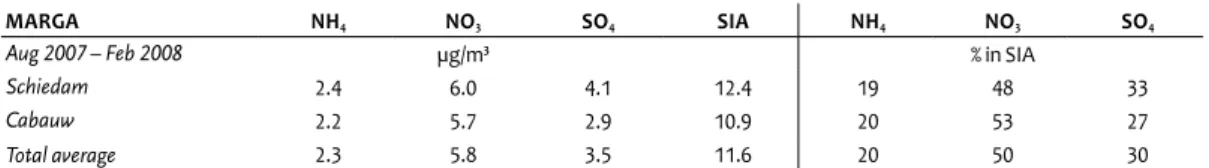
Total averages of NH4, NO3 and SO4
MARGA NH4 NO3 SO4 SIA NH4 NO3 SO4
Aug 2007 – Feb 2008 µg/m3 % in SIA
Schiedam 2.4 6.0 4.1 12.4 19 48 33
Cabauw 2.2 5.7 2.9 10.9 20 53 27
Total average 2.3 5.8 3.5 11.6 20 50 30
Total averages of NH4, NO3 and SO4 (in PM10) and their contribution to SIA over the seven-month period at Schiedam
and Cabauw.
Results 29
Annual averages of NH4, NO3 and SO4 at the LML sites, from 1994 to 2007 (Witteveen data were only available
between 1994 and 1999, and for Valthermond between 2000 and 2007).
Figure 4.4 1994 1996 1998 2000 2002 2004 2006 0 2 4 6 µg/m 3 Bilthoven De Zilk Huijbergen Kollumerwaard Valthermond Vredepeel Wieringerwerf Witteveen NH4
Yearly averages of NH4, NO3 and SO4 at the LML sites from 1994 to 2007
1994 1996 1998 2000 2002 2004 2006 0 2 4 6 µg/m 3 NO3 1994 1996 1998 2000 2002 2004 2006 0 2 4 6 µg/m 3 SO4