Informative Inventory
Report 2018
Emissions of transboundary air pollutants
in the Netherlands 1990-2016
RIVM Report 2018-0013
D. Wever et al.
Informative Inventory
Report 2018
Emissions of transboundary air pollutants in the Netherlands 1990-2016
Colophon
© RIVM 2018
Parts of this publication may be reproduced, provided acknowledgement is given to: National Institute for Public Health and the Environment, along with the title and year of publication.
DOI 10.21945/RIVM-2018-0013
D. Wever (author), RIVM
P.W.H.G. Coenen (author), TNO R. Dröge (author), TNO
G.P. Geilenkirchen (author), PBL M. ’t Hoen (author), PBL
B.A. Jimmink (author), RIVM W.W.R. Koch (author), TNO A.J. Leekstra (author), RIVM R.A.B. te Molder (author), RIVM C.J. Peek (author), RIVM
S.M. van der Sluis (author), PBL W.L.M. Smeets (author), PBL J. Vonk (author), RIVM
Contact: Dirk Wever RIVM - MIL/DMO Dirk.wever@rivm.nl
This investigation has been performed by order and for the account of the Ministry of Infrastructure and Water Management, within the framework of Air and Noise (LG).
This is a publication of:
National Institute for Public Health and the Environment
P.O. Box 1 | 3720 BA Bilthoven The Netherlands
Synopsis
Informative Inventory Report 2018
Emissions of transboundary air pollutants in the Netherlands 1990-2016 Decrease in ammonia emissions; entire time series adjusted downwards
With a total 127.4 Gg in 2016, slightly more ammonia was emitted than in 2015 and the ceiling set by the European Union was met
(128 kilotons). The increase in ammonia emissions was mainly caused by an increase in the number of dairy cows. This increase in emissions was partly countered by an increase in low-emission housing systems for pigs and poultry.
The total ammonia emissions for the period between 1990 and 2015 have been adjusted downwards. This is because of new insights gained into several emission factors that have been used to calculate emissions. These new insights are: the new digestibility of feed (pasture, fodder and silage) for dairy cows causes lower total ammoniacal nitrogen (TAN) levels in the manure; the emission factor for the surface application of manure has decreased and different digestibilities are used for the periods cows spend in animal houses and grazing, respectively.
However, this decrease in ammonia emission is partly countered by new insights into the emission factors from two low-emission manure
application techniques.
Decrease in nitrogen oxide emissions; yet the entire time series adjusted significantly upwards
Emissions of nitrogen oxides continue to decrease slightly; the Netherlands is, therefore, complying with the emission ceilings set in this regard. The total nitrogen oxides emissions for the period between 1990 and 2015 were adjusted significantly upwards by 29.2 Gg in 2015 as result of the new emission source crop residues applied to soil and the reallocation of the nitrogen oxide emissions from several
(agricultural) sources, from the memo-category 11C to the agriculture sector.
Emissions of sulphur dioxides and non-methane volatile organic
compounds continue to decrease slightly; which means the Netherlands is complying with the emission ceilings set in this regard.
Besides the substances mentioned above, the report also includes emissions of carbon monoxide, particulate matter, heavy metals and persistent organic pollutants. The emissions of most of these substances decreased during the 1990 – 2016 period. This downward trend may, especially, be attributed to cleaner fuels, cleaner car engines and to emission reductions in industry as a whole.
This report is concluded by the Informative Inventory Report 2018, drawn up by RIVM and partner institutes, which collaborate to analyse and report emission data each year. This is obligatory for member states. The analyses are used to support Dutch policy.
Publiekssamenvatting
Informative Inventory Report 2018
De uitstoot van ammoniak is in 2016 gestegen ten opzichte van 2015 en ligt met 127,4 kiloton onder het maximum dat vanuit Europa voor
Nederland is bepaald. De toename wordt vooral veroorzaakt doordat er meer melk- en kalfkoeien gehouden worden. De toename wordt voor een deel afgezwakt door een gemiddeld lagere uitstoot als gevolg van schonere stalsystemen.
De berekeningen voor de ammoniakemissie uit de landbouw zijn
complex omdat veel factoren er invloed op hebben. Dat zijn bijvoorbeeld de diersoort, de leeftijdscategorie, de huisvesting en de wijze waarop de mest op het land wordt gebruikt. Nieuwe inzichten in deze
emissiefactoren zorgen ervoor dat de totale uitstoot van ammoniak tussen 1990 en 2015 met terugwerkende kracht over de gehele linie naar beneden is bijgesteld. Zo blijkt de mate waarin rundveevoer wordt verteerd, voor een lagere hoeveelheid ammoniakaal stikstof (TAN) in de rundveemest te zorgen dan eerder was berekend. Daardoor komt er minder ammoniak vrij als de mest op het land wordt gebruikt. Binnen de gestelde periode waren een paar veranderingen te zien als gevolg van de nieuwe inzichten. Zo is de emissiefactor voor bovengrond gebruik van mest naar beneden bijgesteld, waardoor de uitstoot in de eerste helft van de jaren negentig omlaag is gegaan. Daar staat
tegenover dat de emissiefactoren voor een aantal emissiearme manieren van mest op het land verspreiden (uitrijden), hoger zijn geworden. Desondanks blijft het emissiearme uitrijden van mest nog altijd een effectieve maatregel om de uitstoot van ammoniak zoveel mogelijk te beperken.
De uitstoot van stikstofoxiden, zwaveldioxiden en niet-methaan vluchtige organische stoffen blijven net als in voorgaande jaren licht dalen. Voor deze stoffen blijft Nederland voldoen aan de gestelde ‘plafonds’. Ook is de uitstoot van koolmonoxide, fijnstof, zware metalen en persistente organische stoffen tussen 1990 en 2016 bijna zonder uitzondering gedaald. Dit komt vooral door schonere brandstoffen, schonere automotoren en door emissiebeperkende maatregelen in de industrie, met apparatuur om stof, stikstofdioxide en zwaveldioxide af te vangen.
Dit en meer blijkt uit de Informative Inventory Report (IIR) 2018. Het RIVM analyseert en rapporteert hierin jaarlijks met diverse
partnerinstituten de uitstoot van stoffen. Lidstaten van de Europese Unie zijn hiertoe verplicht. Nederland gebruikt de analyses om beleid te onderbouwen.
Kernwoorden: emissies, grootschalige luchtverontreiniging, emissieregistratie
Contents
Introduction — 9 1
National inventory background — 9 1.1
Institutional arrangements for inventory preparation — 10 1.2
The process of inventory preparation — 10 1.3
Methods and data sources — 13 1.4
Key source analysis — 14 1.5
Reporting, QA/QC and archiving — 14 1.6
Explanation on the use of notation keys — 19 1.7
Trends in emissions — 23 2
Trends in national emissions — 23 2.1
Trends in sulphur dioxide (SOx) — 24 2.2
Trends in nitrogen oxides (NOx) — 26 2.3
Trends in ammonia (NH3) — 27 2.4
Trends in non-methane volatile organic compounds (NMVOC) — 28 2.5 Trends in PM2.5 — 29 2.6 Trends in PM10 — 30 2.7 Trends in Pb — 31 2.8 Energy — 33 3
Overview of the sector — 33 3.1
Public electricity and heat production (1A1a) — 34 3.2
Industrial Combustion (1A1b, 1A1c and 1A2) — 38 3.3
Other Stationary Combustion (1A4ai, 1A4bi, 1A4ci and 1A5a) — 42 3.4
Fugitive emissions (1B) — 46 3.5
Transport — 49 4
Overview of the sector — 49 4.1 Civil aviation — 51 4.2 Road Transport — 56 4.3 Railways — 73 4.4
Waterborne navigation and recreational craft — 76 4.5
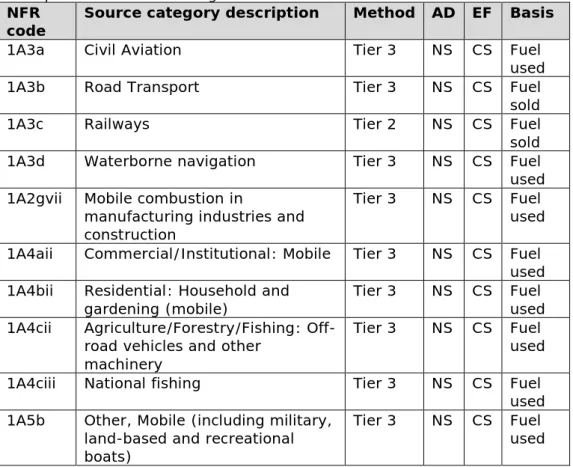
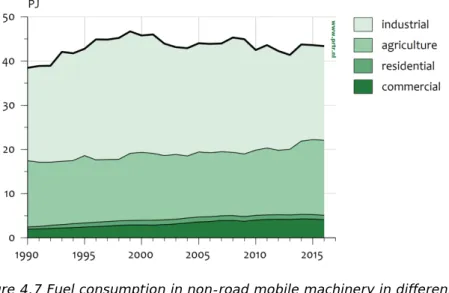
Non-road mobile machinery (NRMM) — 83 4.6
National fishing — 89 4.7
Industrial Processes and Product Use (NFR 2) — 95 5
Overview of the sector — 95 5.1
Mineral products (2A) — 99 5.2
Chemical industry (2B) — 100 5.3
Metal production (2C) — 102 5.4
Solvents and product use (2D) — 105 5.5
Other production industry (2H) — 111 5.6
Agriculture — 115 6
Overview of the sector — 115 6.1
Manure management — 118 6.2
Crop production and agricultural soils — 123 6.3
Waste (NFR 5) — 129 7
Overview of the sector — 129 7.1
Solid waste disposal on land (5A) — 131 7.2
Composting and anaerobic digestion (5B) — 133 7.3
Waste incineration (5C) — 135 7.4
Waste-water handling (5D) — 138 7.5
Other waste (5E) — 138 7.6
Other — 141 8
Overview of the sector — 141 8.1
Other sources (6A) — 141 8.2
Response to the reviews — 145 9
Combined CLRTAP and NEC review 2015 — 145 9.1
NEC review 2017 — 145 9.2
Recalculations and other changes — 147 10
Recalculations of certain elements of the IIR2017 — 147 10.1
Improvements — 147 10.2
Effects of recalculations and improvements — 147 10.3
Projections — 151 11
Spatial distributions — 155 12
Background for reporting — 155 12.1
Methodology for disaggregation of emission data — 155 12.2
Maps with geographically distributed emission data — 156 12.3
References — 161
Appendix 1 Key category analysis results — 169 Appendix 2 Implementing status of review recommendations — 184
Introduction
1
The United Nations Economic Commission for Europe’s 1979 Geneva Convention on Long-Range Transboundary Air Pollution (CLRTAP) was accepted by the Netherlands in 1982. Furthermore, the European Community adopted the National Emission Ceiling Directive (NECD) in 2001 to set national emission-reduction commitments for EU Member States. Additionally, the European Community adopted the Revised National Emission Ceiling Directive in 2016.
Parties under the CLRTAP and European member states for the NECD are obligated to report their emission data annually. Under the CLRTAP, these data are reported to the Conventions’ Executive Body in
compliance with the implementation of the Protocols to the Convention (accepted by the Netherlands) and for the NECD these are reported to the European Commission. For both the CLRTAP and the NECD, reports must be prepared using the Guidelines for Reporting Emissions and Projections Data under the Convention on Long-range Transboundary Air Pollution 2014 (UNECE, 2014).
The Informative Inventory Report 2018 (IIR 2018) comprises the national emissions reporting obligation for both the CLRTAP and the NECD with respect to the pollutants SOx, NOX, NMVOC, NH3, PM2.5, other particulate matter (PM10, TSP and Black Carbon (BC)), CO, priority heavy metals (Hg, Pb and Cd), heavy metals (As, Cr, Cu, Ni, Se and Zn) and several persistent organic pollutants (POP).
The Dutch IIR 2018 is based on data from the national Pollutant Release and Transfer Register (PRTR). The IIR contains information on the Netherlands’ emission inventories for the years 1990 to 2016, including descriptions of methods, data sources, QA/QC activities carried out and a trend analysis. The inventory covers all anthropogenic emissions to be reported in the Nomenclature for Reporting (NFR), including individual polycyclic aromatic hydrocarbons (PAHs), which are to be reported under persistent organic pollutants (POP) in Annex IV.
National inventory background 1.1
Emission estimates in the Netherlands are registered in the national Pollutant Release and Transfer Register (PRTR). This PRTR database is the national database for the sectorial monitoring of emissions to air, water and soil of pollutants and greenhouse gases. The database was set up to support national environmental policy, as well as to report to the framework of National Emission Ceilings (EU), the CLRTAP, the United Nations Framework Convention on Climate Change (UNFCCC) and the Kyoto Protocol (National System). The PRTR encompasses keeping abreast of the state of the art, the process of data collection, processing and registration, and reporting on emission data for some 350 compounds. Emission data (for the most significant pollutants) and documentation can be found at www.prtr.nl.
Instead of using the defaults from the EMEP/EEA air pollutant emission inventory guidebook 2016 (EMEP/EEA, 2016), the Netherlands often applies country-specific methods with associated activity data and
emission factors. The emission estimates are based on the official statistics of the Netherlands (e.g. on energy, industry and agriculture) and on environmental reports issued by companies in the industrial sectors. Both nationally developed and internationally recommended emission factors have been used.
Institutional arrangements for inventory preparation 1.2
The Dutch Ministry of Infrastructure and Water Management (IenW) bears overall responsibility for the emission inventory and submissions made to CLRTAP and NECD. A Pollutant Release and Transfer Register (PRTR) system has been in operation in the Netherlands since 1974. Since 2010, the Ministry of IenW has outsourced the full coordination of the PRTR to the Emission Registration team (ER team) at the National Institute for Public Health and the Environment (RIVM).
The main objective of the PRTR is to produce annually a set of unequivocal emission data that is up to date, complete, transparent, comparable, consistent and accurate. Emission data are produced in annual (project) cycles. In addition to the RIVM, various external agencies/institutes contribute to the PRTR by performing calculations or submitting activity data:
• Netherlands Environmental Assessment Agency (PBL); • Statistics Netherlands (CBS);
• Netherlands Organisation for Applied Scientific Research (TNO); • Rijkswaterstaat (RWS):
o Centre for Water Management (RWS-WD); o Centre for Transport and Navigation (RWS-DVS); o Water, Traffic and Environment (RWS-WVL);
o Human Environment and Transport Inspectorate (RWS-ILT). • Deltares;
• Wageningen Environmental Research; • Wageningen UR Livestock Research; • Wageningen Economic Research;
• Fugro-Ecoplan, which coordinates annual environmental reporting (AER) by companies.
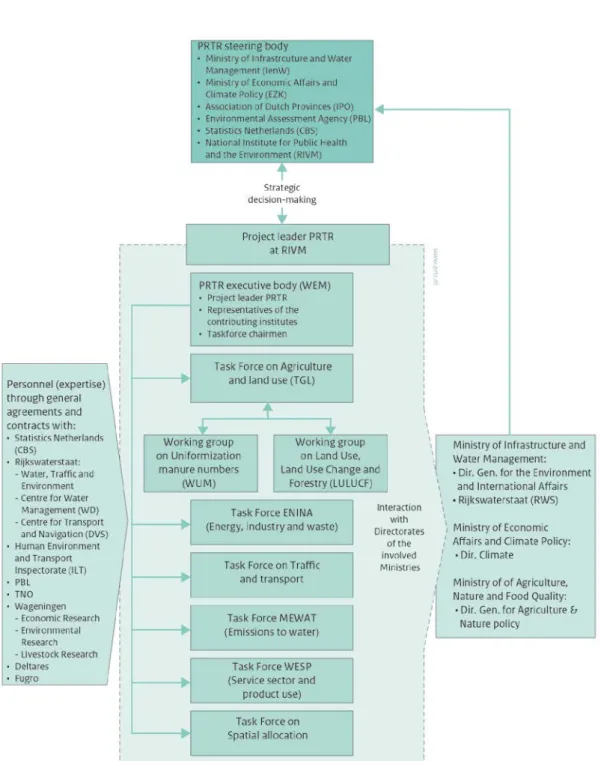
Each of the contributing institutes has its own responsibility and role in the data collection, emission calculations and quality control. These are laid down in general agreements with RIVM and in annual project plans. The process of inventory preparation
1.3
Data collection 1.3.1
For the collection and processing of data (according to pre-determined methods), the PRTR is organized according to task forces. The task forces consist of sector experts from the participating institutes.
Methods are compiled on the basis of the best available scientific views. Changes in scientific views lead to changes in methods and to the recalculation of historical emissions. The following task forces are recognized (see Figure 1.1):
• Task Force on Agriculture and Land Use - TgL;
• Task Force on Energy, Industry and Waste Management - ENINA; • Task Force on Traffic and Transportation;
• Task Force on Water - MEWAT;
Every year, after the emission data have been collected, several quality control checks are performed by the task forces during a yearly ‘trend analysis’ workshop. After being approved by participating institutes, emission data are released for publication (www.prtr.nl). Subsequently, these data are disaggregated to regional emission data for national use (e.g. 5 x 5 km grid, municipality scale, provincial scale and water authority scale).
Figure 1.1 The organizational arrangement of the Netherlands Pollutant Release and Transfer Register (PRTR)
Point-source emissions
As result of the Netherlands’ implementation of the EU Directive on the European Pollutant Release and Transfer Register (E-PRTR), since 2011 about 1,000 facilities have been legally obligated to submit data on their emissions of air pollutants when they exceed a certain threshold. For some pollutants, the Dutch implementation of the E-PRTR directive (VROM, 2008) has set lower thresholds. As a consequence, the total amount of the main pollutants reported for each subsector meets approximately 80% of the subsector total. This criterion was set as a safeguard for the quality of the supplementary estimate for Small and Medium-sized Enterprises (SMEs).
As from 1 January 2010, the above-mentioned companies can only
submit their emissions as a part of an Annual Environmental Report (AER) electronically. All these companies have emission monitoring and
registration systems with specifications that correspond with those of the competent authority. Usually, the licensing authorities (e.g. provinces, central government) validate and verify the reported emissions.
Information from the AERs is stored in a separate database at the RIVM and formally remains the property of the companies involved.
Data on point-source emissions in the AER database are checked for consistency by the task forces. The result is a selection of validated data on point-source emissions and activities (ER-I), which are then stored in the PRTR database (Peek, 2018). The ER-I data is combined with
supplementary estimates for Small and Medium-sized Enterprises (SMEs). Several methods are applied for calculating these emissions. TNO has derived emission factors for NOx emissions from small installations, such as Van Soest-Vercammen et al. (2002); while, for other substances, the Implied Emission Factors (IEFs) derived from the AERs are applied to calculate sector emissions.
Data storage 1.3.2
In cooperation with the contributing research institutes, all emission data are collected and stored in the PRTR database managed by the RIVM. Emission data from the ER-I database and from collectively estimated industrial and non-industrial sources are stored in the PRTR database (see Figure 1.2Figure ). The PRTR database, consisting of a large number of geographically distributed emission sources (about 700), contains complete annual records of emissions in the Netherlands. Each emission source includes information on the NACE-code (Nomenclature
statistique des Activités économiques dans la Communauté Européenne)
and industrial subsector, separate information on process and
combustion emissions, and the relevant environmental compartment and location. These emission sources can be selectively aggregated per NFR category.
Figure 1.2 The data flow in the Netherlands Pollutant Release and Transfer Register (PRTR)
Methods and data sources 1.4
Methods used in the Netherlands are documented in several reports and protocols, and in meta-data files available from www.prtr.nl. However, some reports are only available in Dutch. For greenhouse gases (http://english.rvo.nl/nie), particulate matter (PM) and all emissions related to mobile sources, the documentation has been translated into English.
In general, two emission models are used in the Netherlands: • A model for emissions from large point sources (e.g. large
industrial and power plants), which are registered separately and supplemented with emission estimates for the remainder of the companies within a subsector (based mainly on IEFs from the individually registered companies). This is the so-called bottom-up method.
• A model for emissions from diffuse sources (e.g. road transport, agriculture), which are calculated from activity data and emission factors from sectorial emission inventory studies in the
Netherlands (e.g. SPIN documents produced by the ‘Cooperation project on industrial emissions’).
In addition, these assumptions are important to consider:
• Condensable emissions are only included for transport emissions, not for emissions from domestic wood burning or industrial emissions.
• Road transport emissions have been calculated using ‘on-road’ measured emission factors, so emission data are insensitive to ‘the diesel scandal’.
Key source analysis 1.5
A trend assessment was carried out for the emission inventory of all components, in addition to a level assessment, in order to identify key source categories. In both approaches, key source categories were identified using a cumulative threshold of 80%. Key categories are those which, when summed together in descending order of magnitude, add up to more than 80% of the total level (EMEP/EEA, 2016). The level assessments were performed for both the latest inventory year (2015), as well as for the base year of the inventory (1990). The trend
assessments aim to identify categories for which the trend is
significantly different from that of the overall inventory. See Appendix 1 for the actual analysis.
Reporting, QA/QC and archiving 1.6
Reporting 1.6.1
The Informative Inventory Report is prepared by the inventory compiling team at RIVM (RIVM-NIC), with contributions made by experts from the PRTR task forces.
QA/QC 1.6.2
The RIVM has an ISO 9001:2015 based QA/QC system in place. The PRTR quality management is fully in line with the RIVM QA/QC system. Part of the work for the PRTR is done by external agencies (other institutes). QA/QC arrangements and procedures for the contributing institutes are described in an annual project plan (RIVM, 2017). The general QA/QC activities meet the international inventory QA/QC requirements described in Part A, Chapter 6 of the EMEP inventory guidebook (EMEP/EEA, 2016).
There are no sector-specific QA/QC procedures in place within the PRTR. In general, the following QA/QC activities are performed:
Quality Assurance (QA)
QA activities can be summarized as follows:
• For the energy, industry and waste sectors, emission calculation in the PRTR is based mainly on AERs made by companies
(facilities). The companies themselves are responsible for the data quality; the competent authorities (in the Netherlands, mainly provinces and local authorities) are responsible for checking and approving the reported data, as part of the annual quality assurance;
• As part of the RIVM quality system, internal audits are performed at the Department for Data and environment (DMO) of the RIVM Centre for Environmental Quality (MIL);
• Furthermore, there are annual external QA checks conducted on selected areas of the PRTR system.
Quality Control (QC)
A number of general QC checks have been introduced as part of the annual work plan of the PRTR (for results, see Table 1.1). The QC checks built into the work plan focus on issues such as the consistency, completeness and accuracy of the emission data. The general QC for the inventory is largely performed within the PRTR as an integrated part of the working processes. For the 2018 inventory, the PRTR task forces filled in a standard-format database with emission data from 1990 to 2016. After an automated first check of the emission files by the data exchange module (DEX) for internal and external consistency, the data becomes available to the specific task force for checking consistency and trends (error checking, comparability, accuracy). The task forces have access to information on all emissions in the database by means of a web-based emission reporting system and they are facilitated by the ER team with comparable information on trends and time series. Several weeks before a final data set is fixed, a trend verification workshop is organized by the RIVM (see Text box 1.1). The results of this workshop, including actions for the task forces to resolve the identified clarification issues, are documented at RIVM. Required changes to the database are then made by the task forces.
Table 1.1 Key items of the verification actions on data processing 2017 and NFR/IIR 2018
QC Item/action Date Who Result Documentation * Automated initial
check on internal and external data consistency
During each upload
Data Exchange
Module (DEX) Acceptance or rejection of uploaded sector data
Upload event and result logging in the PRTR database
Input of hanging issues for this inventory 28-06-2017 RIVM-PRTR List of remaining issues/actions from last inventory
“Actiepunten voorlopige cijfers 2016 v 28 juni 2017.xls”
Input for checking allocations from the PRTR-database to the NFR tables 06-11-2017 RIVM-NIC List of allocations “NFR-ER-Koppellijst-2017-11-06-dtt54.xlsx”
Input for error checks PM fractions
05-12-2016
RIVM-PRTR Updated list of required actions
“Controle PM fracties.xlsx”
Input for trend analysis
05-12-2017
RIVM-PRTR Updated list of required actions
“Actiepunten definitieve cijfers v 5 december 2017.xls”; “Verschiltabel_LuchtActueel 05-12-2017.xlsx”
* All documentation (e-mails, data sheets and checklists) are stored electronically on a data server at RIVM.
Trend analysis workshops 07-12-2017 Sector specialists, RIVM-PRTR Explanations for observed trends and actions to resolve before finalizing the PRTR dataset
− “Emissies uit de landbouw reeks 1990-2016.pptx”; − “Presentatie ENINA TrendAnalyse reeks 1990-2016_v1.pptx”; − Trendanalyse verkeer 2017.pptx”;
− WESP Trendanalyse reeks 7-12-2017.pptx”;
− TA-dag NEC plafonds NL v1.pptx”.
Input for resolving the final actions before finalizing the PRTR dataset
14-12-2017
RIVM-PRTR Updated Action list
Actiepunten definitieve cijfers v 14 december 2017.xls” Request to the contributing institutes to endorse the PRTR database 20-12-2017 till 21-12-2017 PRTR project secretary, representatives of the contributing institutes Reactions of the contributing institutes to the PRTR-project leader − Email (20-12-2017 10:17) with the request to endorse the PRTR database;
− “Actiepunten definitieve cijfers v 19 december 2017.xls”; Emails with consent from PBL, Deltares and CBS (CBS 2017 17:15; PBL 21-12-2017 18:35; Deltares 20-12-2017 10:24).
Input for compiling the NEC report (in NFR-format) 15-12-2017 RIVM-NIC List of allocations for compiling from the PRTR-database to the NFR-tables “ NFR-ER-Koppellijst-2017-12-15-dtt54_BJenBL.xlsx” List of allocations for compiling from the PRTR database to the NFR tables
13-03-2018
RIVM Input for compiling the EMEP/LRTAP report (NFR format) “NFR-ER-Koppellijst-2018-03-08-dtt54-DW.xlsx”
Text box 1.1 Trend verification workshops
About a week in advance of a trend analysis meeting, a snapshot from the database is made available by the RIVM in a web-based application (Emission Explorer, EmEx) for checks by the institutes involved, sector and other experts (PRTR task forces) and the RIVM PRTR team. In this way, the task forces can check for level errors and consistency in the algorithm/method used for calculations throughout the time series. The task forces perform checks for relevant gases and sectors. The totals for the sectors are then compared with the previous year's data set. Where significant differences are found, the task forces evaluate the emission data in greater detail. The results of these checks form the subject of discussion at the trend analysis workshop and are
subsequently documented.
Furthermore, the PRTR team provides the task forces with time series of emissions for each substance for the individual sub-sectors. The task forces examine these time series. During the trend analysis for this inventory, the emission data were checked in two ways: 1) emissions from 1990 to 2015 from the new time series were compared with the time series of last years’ inventory and 2) the data for 2016 were compared with the trend development for each gas since 1990. The checks of outliers are performed on a more detailed level of the sub-sources in all sector background tables:
• annual changes in emissions; • annual changes in activity data;
• annual changes in implied emission factors and • level values of implied emission factors.
Exceptional trend changes and observed outliers are noted and discussed at the trend analysis workshop, resulting in an action list. Items on this list have to be processed within two weeks or dealt with in next year’s inventory.
Archiving and documentation
Internal procedures are agreed on (e.g. in the PRTR work plan) for general data collection and the storage of fixed data sets in the PRTR database, including the documentation/archiving of QC checks. As of 2010, sector experts can store related documents (i.e. interim results, model runs, etc.) on a central server at the RIVM. These documents then become available through a limited-access website. Moreover, the updating of monitoring protocols for substances under the CLRTAP is one of the priorities within the PRTR system. Emphasis is placed on the documentation of methodologies for calculating SOx, NOx, NMVOC, NH3, PM10 and PM2.5. Methodologies, protocols and emission data (including emissions from large point sources on the basis of Annual Environmental Reports), as well as emission reports such as the National Inventory Report (UNFCCC) and the Informative Inventory Report (CLRTAP), are made available on the website of the PRTR: www.prtr.nl.
Quantitative uncertainty 1.6.3
Uncertainty estimates of total national emissions are calculated using a tier 2 method (Monte Carlo analysis). Most uncertainty estimates were based on the judgement of emission experts from the task forces ENINA (energy/industry/waste), Traffic and Transport, Agriculture, and WESP (product use). For agriculture, the judgement of experts was combined
with a Tier 1 uncertainty calculation. In the tier 1 uncertainty calculation of agriculture, it was assumed that emissions from manure management and manure application were completely correlated with each other. The expert elicitation was set up following the expert elicitation guidance in the IPCC 2006 Guidelines (motivating, structuring, conditioning, encoding and verification). These judgements of experts were made for activity data and emission factors separately on the level of emission sources (which is more detailed than the NFR categories). Correlations between the activity data and emission factors of different emission sources have been included in the Monte Carlo analysis. These correlations are included for the following type of data:
• Activity data:
o The energy statistics are known better on an aggregated level (e.g. for industry) than they are on a detailed level (e.g. for the industrial sectors separately). This type of correlation is also used for several transport sectors (shipping and
aviation);
o The number of animals in animal subcategories that make up one emission source (e.g. non-dairy cattle, pigs, etc.) are correlated.
• Emission factor:
o The uncertainty of an emission factor from stationary combustion is assumed to be equal for all of the emission sources in the stationary combustion sector. This type of correlation is also used for several transport sectors (shipping and aviation);
o Emission factors for the different animal categories are assumed to be partly correlated. In some cases part of the input data for calculating EFs is the same or EFs are derived from other animal categories.
The results of the Monte Carlo analysis are presented in Table 1.2. For agriculture, the result of the tier 1 error propagation result was included in this table (instead of the Monte Carlo analysis result) because the correlations between the agricultural emission sources need further investigation.
Table 1.2 Uncertainty (95% confidence ranges) for NH3, NOx, SO2, NMVOC, PM10
and PM2.5 for each NFR category and for the national total, calculated for
emissions in 2016. NFR-Category NH3 NOx SO2 NMVOC PM10 PM2,5 1 156% 15% 29% 81% 28% 27% 2 49% 68% 91% 33% 35% 35% 3 25% 120% 88% 23% 36% 5 100% 100% 102% 96% 100% 99% 6 94% 28% 68% 68% Total 24% 17% 29% 40% 18% 21% Uncertainty estimates from earlier studies (van Gijlswijk et al., 2004 and RIVM, 2001) are presented in Table 1.3. These uncertainty estimates of NH3 and NOx are similar to the NH3 and NOx uncertainty calculated for
2016. The uncertainty for SO2 in 2016 increased compared with the studies of van Gijlswijk et al (2004) and RIVM (2001). This can be explained by the fact that the uncertainty of the SOx emission factor from chemical waste gas, coal and cokes is assumed to be rather uncertain.
Table 1.3 Uncertainty (95% confidence ranges) in earlier studies for NH3, NOx
and SO2 emissions in 1999 (RIVM, 2001) and 2000 (Van Gijlswijk et al., 2004)
Component Tier 1 for 1999 Tier 1 for 2000 Tier 2 for 2000
NH3 ± 17% ± 12% ± 17%
NOx ± 11% ± 14% ± 15%
SO2 ± 8% ± 6% ± 6%
Explanation on the use of notation keys 1.7
The Dutch emission inventory covers all relevant sources specified in the CLRTAP that determine the emissions to air in the Netherlands. Because of the long history of the inventory, it is not always possible to specify all sub-sectors in detail. This is the why notation keys are used in the emission tables (NFR). These notation keys will be explained in Table 1.4 up to Table 1.6. For most cases in which ‘NE’ has been used as a notation key, the respective source is assumed to be negligible and sometimes there is also no method available for estimating the
respective source. IE notation keys have been included in the category listed under Notes in NFR-tables, see column D.
Table 1.4 The Not Estimated (NE) notation key explained
NFR code Substance(s) Reason for not estimated
All PCBs respective sources are assumed negligible
1A1b NH3, Pb-Zn, PAHs, HCBs respective source is assumed negligible; not method available
1A1c All, except SOx and NOx respective sources are assumed negligible 1A2a NH3, As, Cu, Ni, Se, PAHs HCBs respective sources are assumed negligible
1A2b HCBs respective sources are assumed negligible
1A2c Pb, Cd, As, Se, PAHs, HCBs respective sources are assumed negligible 1A2d Pb, Cd, As, Se, PAHs, HCBs respective sources are assumed negligible 1A2e Pb-Zn respective source is assumed negligible; not
method available
1A2gvii HCBs respective source is assumed negligible
1A3b-d HCBs respective sources are assumed negligible
1A4aii HCBs respective source is assumed negligible
1A4bi NH3 respective source is assumed negligible
1A4bii HCBs respective source is assumed negligible
1A4ci NH3, Pb-Zn respective source is assumed negligible
1A4cii HCBs respective source is assumed negligible
1A4ciii Pb-As, Se, HCBs respective source is assumed negligible 1A5a NH3, Pb-Zn, HCBs respective source is assumed negligible
NFR code Substance(s) Reason for not estimated
1A5b HCBs respective source is assumed negligible
1B1a NMVOC, SOx, CO, Pb-Zn, HCBs respective source is assumed negligible
1B2 SOx respective sources are assumed negligible
1B2c Pb-Zn, PCDD/PCDF, PAHs, HCBs respective sources are assumed negligible 1B2d All, except NOx respective sources are assumed negligible 2D3b, 2D3c All respective sources are assumed negligible
3B NMVOC respective sources are assumed negligible
3D, except
3Dc, 3Df TSP, PM10, PM2.5 respective sources are assumed negligible 3Da4 NOx, NH3, TSP, PM10, PM2.5 respective source is assumed negligible 3De NOx, SOx respective source is assumed negligible 3Df NOx, NMVOC, SOx, NH3, CO, Pb-Se respective source is assumed negligible
3F All respective sources are assumed negligible
3I All respective sources are assumed negligible
6A All, except NH3, TSP, PM10, PM2.5 respective sources are assumed negligible
Table 1.5 The Included Elsewhere (IE) notation key explained
NFR13 code Substance(s) Included in NFR code
1A2f All 1A2gviii
1A3aii(i) All 1A3ai(i)
1A3ei All 1A2f, 1A4cii, 1B2b
1B1a TSP, PM10, PM2.5 2H3
1B1b NOx, NMVOC, SOx, TSP, PM10, PM2.5 1A2a
1B2ai NMVOC 1B2b
1B2c NMVOC, TSP, PM10, PM2.5, CO 1B2b
NOX and SOx 1A1C
2A2 NOx, NMVOC, SOx 2A6
2A5a NMVOC 2H3
2A5b NOx, NMVOC, SOx 2A6
2A5c NOx, NMVOC, SOx 2A6
2B1 NMVOC, NH3 2B10a 2B2 NMVOC, NH3 2B10a 2B5 NMVOC, NH3 2B10a 2B6 NMVOC, NH3 2B10a 2B7 NMVOC, NH3 2B10a 2B10b NMVOC, NH3 2B10a 2C4 All 2C7c 2C7d All 2H3 2D3g NMVOC 2B10a 2G All 2D3i 2L All 2H3 5A NOx, SOx, TSP, PM10, PM2.5, BC, CO 1A1a 5B2 NOx, SOx, TSP, PM10, PM2.5, BC, CO 1A4ai 5D1 NOx, SOx, TSP, PM10, PM2.5, BC, CO 1A4ai 5D2 NOx, SOx, TSP, PM10, PM2.5, BC, CO 1A4ai
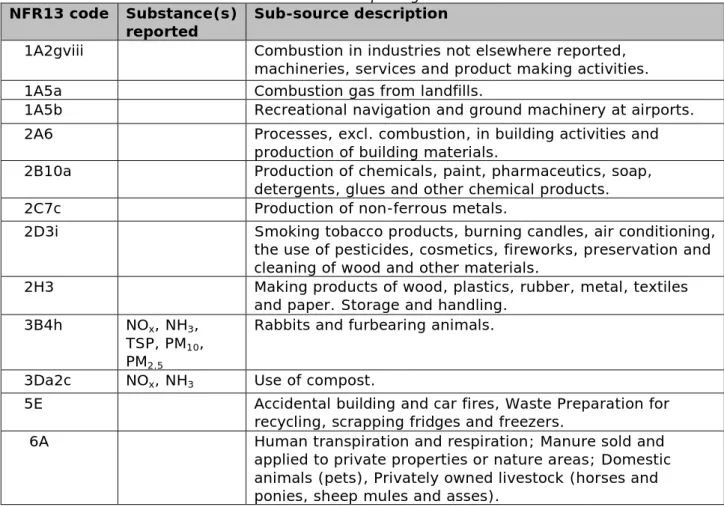
Table 1.6 Sub-sources accounted for in reporting ‘other’ codes
NFR13 code Substance(s)
reported Sub-source description
1A2gviii Combustion in industries not elsewhere reported, machineries, services and product making activities. 1A5a Combustion gas from landfills.
1A5b Recreational navigation and ground machinery at airports. 2A6 Processes, excl. combustion, in building activities and
production of building materials.
2B10a Production of chemicals, paint, pharmaceutics, soap, detergents, glues and other chemical products. 2C7c Production of non-ferrous metals.
2D3i Smoking tobacco products, burning candles, air conditioning, the use of pesticides, cosmetics, fireworks, preservation and cleaning of wood and other materials.
2H3 Making products of wood, plastics, rubber, metal, textiles and paper. Storage and handling.
3B4h NOx, NH3, TSP, PM10, PM2.5
Rabbits and furbearing animals. 3Da2c NOx, NH3 Use of compost.
5E Accidental building and car fires, Waste Preparation for recycling, scrapping fridges and freezers.
6A Human transpiration and respiration; Manure sold and applied to private properties or nature areas; Domestic animals (pets), Privately owned livestock (horses and ponies, sheep mules and asses).
Trends in emissions
2
Trends in national emissions 2.1
The Dutch NH3 emission series are dangling about the national emission ceiling set for the year 2010 (NEC2010). For NOx, SOx and NMVOC, the Netherlands was in compliance with the respective ceilings in 2016. The emissions of all substances showed a downward trend in the 1990-2016 period (see Table 2.1). The major overall drivers for this trend were:
• emission reductions in the industrial sectors; • cleaner fuels;
• cleaner cars.
Road transport emissions have decreased by 87% since 1990 for
NMVOC, by 77% for PM, by 72% for NOx and by 99% for SOx, despite a growth in road transport of 13%. The decrease is mainly attributable to European emission regulations for new road vehicles. For PM and NOx, standards have been set for installations by tightening up the extent of the emission stocks of heating installations (BEES). In meeting these requirements, Dutch industrial plants have realized a reduction of 93% in PM emissions and 62% in NOx emissions since 1990. Sections 2.2-2.8 elaborate in greater detail on the drivers for the downward emission trend for specific substances.
Table 2.1 Total national emissions, 1990-2016
Main Pollutants Particulate Matter Other
NO x N M V OC SO x NH 3 PM 2. 5 PM 10 TS P BC CO Year Gg Gg Gg Gg Gg Gg Gg Gg Gg 1990 656 498 197 350 52 75 98 13 1142 1995 555 357 136 223 39 56 74 11 915 2000 464 252 78 175 29 44 52 10 750 2005 406 190 67 153 22 36 44 8 722 2010 334 175 35 133 17 30 37 5 675 2015 268 149 31 126 13 27 34 3 569 2016 254 141 28 127 13 26 33 3 559 1990-2016 period1) -401 -357 -169 -223 -39 -49 -65 -10 -583 1990-2016 period2) -61% -72% -86% -64% -76% -65% -66% -76% -51% -611) Absolute difference in Gg 2) Relative difference to 1990 in %
Priority Heavy Metals POPs Other Heavy Metals Pb Cd Hg DIOX PAH As Cr Cu Ni Se Zn Year Mg Mg Mg g I-Teq Mg Mg Mg Mg Mg Mg Mg 1990 332 2.1 3.6 744 20 1.3 12 37 73 0.4 224 1995 153 1.1 1.5 68 10 0.9 8.5 38 84 0.3 146 2000 27 1.0 1.1 33 5.1 0.9 5.0 39 19 0.5 95 2005 30 1.8 1.0 31 5.1 1.3 4.3 41 10 2.6 88 2010 38 2.6 0.6 33 4.8 0.6 3.8 45 2 1.5 102 2015 9 0.6 0.6 23 4.7 0.6 3.4 45 2 1.0 103 2016 9 0.7 0.6 23 4.8 0.7 3.7 41 2 0.6 100 1990-2016 period 1) -323 -1.5 -3.0 -721 -15 -0.6 -8.1 4.7 -71 0.3 -124 1990-2016 period 2) -97% -70% -83% -97% -76% -45% -69% 13% -97% 65% -55% 1) Absolute difference in Gg 2) Relative difference to 1990 in %
Trends in sulphur dioxide (SOx) 2.2
The Dutch SOx emissions (reported as SOx) decreased by 169 Gg in the 1990-2016 period, corresponding to 86% of the national total in 1990 (Figure 2.1). The main contributions to this decrease came from the energy sector, industry and the transport sector. The use of coal declined and major coal-fired electricity producers installed flue-gas desulphurization plants. The sulphur content in fuels for the (chemical) industry and traffic was also reduced. At present, industry and the energy and refining sectors (IER) is responsible for 97% of the national SOx emissions.
Trends in nitrogen oxides (NOx) 2.3
The Dutch NOx emissions (NO and NO2, expressed as NO2) decreased by 376 Gg in the 1990-2016 period, corresponding to 61% of the national total in 1990 (Figure 2.2). The main contributors to this decrease were road transport and the energy sector. Although emissions per vehicle decreased significantly in this period, an increase in the number and the miles travelled by vehicles partially negated the effect on total road transport emissions. The shares of the different NFR categories in the national total did not change significantly.
Trends in ammonia (NH3) 2.4
Most of the NH3 emissions (at present, 86%) come from agricultural sources. From 1990 to 2013, the decreasing trend in NH3 due to emission reductions from agriculture also showed up in the decreasing trend of the national total. From 2014 onwards, however, NH3 emissions rose to a national total of just around 128 Gg, which is the maximum level set for this by the European Union for 2010 on. As a result of the abolishment of milk quotas in 2015, breeding and dairy cattle numbers increased. Despite higher implementation grades of low-emission housing, also in pigs and poultry, total NH3 emissions have increased in recent years.
Trends in non-methane volatile organic compounds (NMVOC) 2.5
The Dutch NMVOC emissions decreased by 351 Gg in the 1990-2016 period, corresponding with 72% of the national total in 1990 (Figure 2.4). All major source categories contributed to this decrease: transport (introduction of catalysts and cleaner engines), product use (intensive programme to reduce NMVOC content in consumer products and paints) and industry (introducing emission abatement specifically for NMVOC).
Trends in PM2.5 2.6
PM2.5 emissions are calculated as a specific fraction of PM10 by sector (based on Visschedijk et al., 2007). They decreased by 39 Gg in the 1990-2016 period, corresponding to 76% of the national total in 1990 (Figure 2.5). The two major source categories contributing to this
decrease were the industrial sector (combustion and process emissions), which was due to cleaner fuels in refineries and the side effect of
emission abatement for SOx and NOx, and the transport sector.
Trends in PM10 2.7
Dutch PM10 emissions decreased by 49 Gg in the 1990-2016 period, corresponding to 65% of the national total in 1990 (Figure 2.6). The major source categories contributing to this decrease were:
• industry (combustion and process emissions), due to cleaner fuels in refineries and the side-effect of emission abatement for SOx and NOx;
• traffic and transport.
PM10 emissions from animal husbandry in agriculture did not change significantly; neither did the emissions from consumers (1A4bi). Trends in Pb
2.8
Lead (Pb) emissions in the Netherlands decreased by 323 Mg in the 1990-2016 period, corresponding to 97% of the national total in 1990 (Figure 2.7). This decrease is attributable to the transport sector, where, due to the removal of Pb from gasoline, the Pb emissions collapsed. The remaining sources are industrial process emissions, particularly from the iron and steel industry.
Energy
3
Overview of the sector 3.1
Emissions from this sector include all energy-related emissions from stationary combustion. Furthermore, it includes fugitive emissions from the energy sector.
Part of the emissions from stationary combustion for electricity production and industry (NFR categories 1A1 and 1A2) are reported based on environmental reports made by large industrial companies. For SOx and NH3, 98% of the emissions were reported based on
environmental reports, while for other pollutants this was 65%
(NMVOC), 73% (NOx) and 47% (PM10) in 2016. It should be noted that these percentages include not only the data directly from the AERs, but also the initial gap filling at company level performed by the competent authorities. The emission data in the Annual Environmental Reports (AERs) come from direct emission measurements or from calculations using fuel input and emission factors. Most of the emissions from other stationary combustion (categories 1A4 and 1A5) were calculated with energy statistics and default emission factors.
As it is for most developed countries, the energy system in the
Netherlands is largely driven by the combustion of fossil fuels. In 2016, natural gas supplied about 38% of the total primary fuels used in the Netherlands, followed by liquid fuels (46%) and solid fossil fuels (16%). The contribution of non-fossil fuels, including renewables and waste streams, is rather limited (5%). Figure 3.1 and Figure 3.2 show the energy supply and energy demand in the Netherlands.
The energy statistics are available on the website of Statistics
Netherlands. The following link refers to the energy statistics of 2016. Using the button “Change selection” on the website, it is possible to select the data for another year.
Energy statistics of 2016:
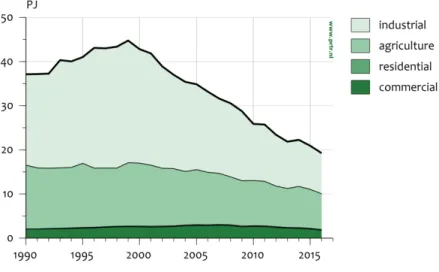
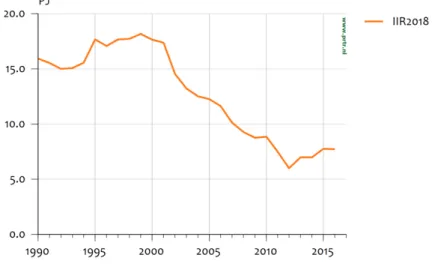
Figure 3.1 Energy supply in the Netherlands (only the total fuel used is shown)
Figure 3.2 Energy demand in the Netherlands (only the total fuel used is shown)
Public electricity and heat production (1A1a) 3.2
Source category description 3.2.1
In this sector, one source category is included: Public electricity and heat production (1A1a). This sector consists mainly of coal-fired power stations and gas-fired cogeneration plants, with many of the latter being operated as joint ventures with industries. A relatively small amount of energy is generated by waste incineration plants in the Netherlands through energy recovery, see also Peek et al. 2018. All waste incineration plants recover energy and are included in NFR category 1A1a. Relative to other countries in the EU, nuclear energy and renewable energy (biomass and wind) provide a small amount of the total primary energy supply in the Netherlands.
Key sources 3.2.2
The sector 1A1a is a key source for the pollutants mentioned in Table 3.1.
Table 3.1 Pollutants for which the Public electricity and heat production (NFR 1A1a) sector is a key source
Category / Sub-category Pollutant Contribution to national total of 2016 (%)
1A1a Public electricity and
heat production SOx 25
NOx 7.1 PM2.5 1.8
Hg 36
Overview of shares and trends in emissions 3.2.3
An overview of the trends in emissions is shown in Table 3.2. For almost all pollutants, emissions decreased between 1990 and 2016, while fuel consumption increased over the same period.
The NOx and SOx emissions decreased by 78% and 86%, respectively. Other pollutant emissions decreased by 35% to 88%. The decrease in emissions was partly caused by a shift in energy use. Furthermore, the decrease in emissions was due to technological improvements. The only pollutant for which the emissions have increased is NH3, due to an increase in activity rate. For Se, the increase by a factor of 28 was caused by environmental reports being considered for the later years, while for the earlier years, little or no information was available.
Table 3.2 Overview of trends in emissions
Main Pollutants Particulate Matter Other
NO x N M V OC SO x NH 3 PM 2. 5 PM 10 TS P BC CO Year Gg Gg Gg Gg Gg Gg Gg Gg Gg 1990 83 0.7 48 0 1.9 2.2 2.3 0 8.2 1995 62 1.1 17 0.039 0.4 0.5 0.5 0 7.4 2000 51 2.2 15 0.038 0.3 0.3 0.3 0 15.8 2005 43 0.6 10 0.252 0.4 0.5 0.5 0 8.2 2010 26 0.3 7 0.074 0.2 0.3 0.4 0 5.0 2015 20 0.5 9 0.090 0.3 0.4 0.5 0 4.2 2016 18 0.5 7 0.099 0.2 0.3 0.4 0 4.1 1990-2016 period1) -65 -0.2 -42 0.099 -1.6 -1.9 -1.9 0 -4.1 1990-2016 period2) -78% -35% -86% -88% -88% -83% -50% Priority Heavy Metals POPs Other Heavy Metals
Pb Cd Hg DIOX PAH As Cr Cu Ni Se Zn Year Mg Mg Mg g I-Teq Mg Mg Mg Mg Mg Mg Mg 1990 16 0.95 1.9 568 0.17 0.50 0.62 2.05 2.49 0.02 40.7 1995 2 0.16 0.4 6.0 0.05 0.20 0.37 0.44 1.41 0.05 3.3 2000 0.2 0.08 0.4 0.1 0.00 0.08 0.19 0.17 0.08 0.45 0.3 2005 0.2 0.09 0.4 0.7 0.01 0.16 0.33 0.28 1.91 1.68 0.5 2010 0.3 0.18 0.2 1.2 0.01 0.11 0.14 0.15 0.16 1.33 3.9 2015 0.2 0.03 0.2 1.0 0.03 0.06 0.16 0.18 0.17 0.91 4.1 2016 0.1 0.04 0.2 1.1 0.02 0.04 0.20 0.21 0.12 0.57 4.3 1990-2016 period1) -16 -0.9 -1.7 -567 -0.16 -0.46 -0.4 -1.8 -2.4 0.6 -36.4 1990-2016 period2) -99% -96% -89% -100% -90% -92% -68% -90% -95% 2803% -89% 1) Absolute difference 2) Relative difference to 1990 in %
Activity data and (implied) emission factors 3.2.4
Emission data are based on Annual Environmental Reports (AERs) and collectively estimated industrial sources. For this source category, 97 to 100% of the emissions are based on AERs. To estimate emissions from collectively estimated industrial sources, National Energy Statistics (from Statistics Netherlands) are combined with implied emission factors from the AERs or with default emission factors (see Table 3.3).
Methodological issues 3.2.5
Emissions are based on data in Annual Environmental Reports (AERs) from individual facilities (Tier3 methodology). The emissions and fuel consumption data in the AERs are systematically examined for
inaccuracies by checking the resulting implied emission factors (IEFs). If environmental reports provide data of high enough quality, the
information is used for calculating an ‘implied emission factor’ for a cluster of reporting companies (aggregated by NACE code). These emission
factors are fuel- and sector-dependent and are used to calculate the emissions from companies that are not individually assessed.
EF ER-I (NACE, fuel) =
Emissions ER-I (NACE, fuel) Energy use ER-I (NACE, fuel)
where:
EF = Emission factor
ER-I = Emission Registration database for individual companies Next, combustion emissions from the companies that are not individually assessed in this NACE category are calculated from the energy use according to the Energy Statistics (from Statistics Netherlands),
multiplied by the implied emission factor. If the data from the individual companies are insufficient to calculate an implied emission factor, then a default emission factor is used (see Table 3.3).
ER-C_emission (NACE, fuel) = EF ER-I(NACE, fuel) * Energy Statistics (NACE, fuel)
where:
ER-C = Emission Registration database for collective emission sources
The total combustion emissions are the sum of the emissions from the individual companies (ER-I) plus the emissions from the companies that are not individually assessed (ER-C).
Table 3.3 Default emission factors for electricity production (g/GJ)
Substance
name Natural gas Biogas Cokes Diesel LPG Petroleum Coal Fuel oil Wood
Hydrocarbons 12 9 91 15 2 10 3 7 120 Sulphur dioxide 2 370 87 46 300 450 10 Nitrogen oxides as NO2 37 27 100 60 27 50 45 64 120 Carbon monoxide 15 20 12,437 30 10 10 50 10 70 PM10 0.15 2 6 4.5 2 1.8 60 22.5 1 Total Suspended Particles (TSP) 0.15 2 10 5.0 2 2.0 100 25.0 1
Uncertainties and time series consistency 3.2.6
Source-specific QA/QC and verification 3.2.7
The emissions and fuel consumption data in the AERs are systematically examined for inaccuracies by checking the resulting implied emission factors. If environmental reports provide data of high enough quality (see Section 1.6 on QA/QC), the information is used.
Source-specific recalculations 3.2.8
Source-specific recalculations:
• Revision of activity data on biogas.
Source-specific planned improvements 3.2.9
There are no source-specific planned improvements. Industrial Combustion (1A1b, 1A1c and 1A2) 3.3
Source category description 3.3.1
This source category consists of the following categories: • 1A1b Petroleum refining
• 1A1c Manufacture of solid fuels and other energy industries • 1A2a Iron and steel
• 1A2b Non-ferrous metals • 1A2c Chemicals
• 1A2d Pulp, paper and print
• 1A2e Food processing, beverages and tobacco • 1A2f Non-metallic minerals
• 1A2gviii Other
The sector 1A2gviii includes industries for mineral products (cement, bricks, other building materials, glass), textiles, wood and wood products, machinery.
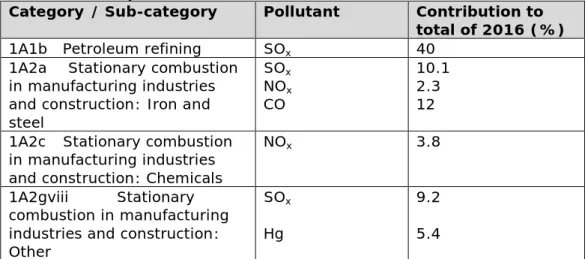
Key sources 3.3.2
The sectors 1A1b, 1A2c and 1A2gviii are key sources for the pollutants mentioned in Table 3.4.
Table 3.4 Pollutants for which the Industrial combustion (NFR 1A1b, 1A1c and 1A2) sector is a key source
Category / Sub-category Pollutant Contribution to total of 2016 (%) 1A1b Petroleum refining SOx 40
1A2a Stationary combustion in manufacturing industries and construction: Iron and steel SOx NOx CO 10.1 2.3 12 1A2c Stationary combustion
in manufacturing industries and construction: Chemicals
NOx 3.8
1A2gviii Stationary combustion in manufacturing industries and construction: Other
SOx Hg
9.2 5.4
Overview of shares and trends in emissions 3.3.3
An overview of the trends in emissions is shown in Table 3.5. Emissions have been reduced since 1990 for most pollutants, except for dioxins. A reduction in the emission of main pollutants has been due to an
improvement in the abatement techniques used. Fluctuations in dioxin emissions have been caused by differences in the fuels used and/or incidental emissions. The reduction in the emissions of SOx and PM10is mainly due to a shift in fuel use by refineries, i.e. from oil to natural gas.
Table 3.5 Overview of trends in emissions
Main Pollutants Particulate Matter Other
N Ox N M V OC SO x NH 3 PM 2. 5 PM 10 TS P BC CO Year Gg Gg Gg Gg Gg Gg Gg Gg Gg 1990 101 6.3 110 0.57 6.1 7.9 8.3 0.37 266 1995 78 6.9 89 0.32 5.0 6.4 6.6 0.36 215 2000 49 2.1 46 0.05 2.8 4.0 4.7 0.29 160 2005 49 2.6 46 0.06 0.9 1.8 2.0 0.11 153 2010 40 3.9 24 0.43 0.35 0.5 0.8 0.02 124 2015 35 2.9 20 0.40 0.30 0.4 0.6 0.01 96 2016 33 2.5 19 0.43 0.27 0.4 0.5 0.01 92 1990-2016 period1) -67 -3.8 -91 -0.14 -5.9 -7.5 -7.8 -0.36 -174 1990-2016 period2) -67% -61% -83% -25% -96% -95% -93% -98% -65%
Priority Heavy Metals POPs Other Heavy Metals
Pb Cd Hg DIOX PAH As Cr Cu Ni Se Zn Year Mg Mg Mg g I-Teq Mg Mg Mg Mg Mg Mg Mg 1990 1.9 0.14 0.18 0.01 0.99 0.17 2.5 1.4 64 0.04 2.9 1995 3.9 0.17 0.08 1.02 0.38 0.15 3.1 2.3 79 0.05 3.5 2000 0.04 0.01 0.11 0.35 0.004 0 0.51 0.15 17 0.002 0.84 2005 0.01 0.003 0.004 0.94 0.10 0.78 0.08 0.09 7 0.08 0.51 2010 3.1 1.28 0.02 5.79 0.13 0.013 0.14 1.13 0.02 0.12 9.8 2015 0.09 0.001 0.05 0.19 0.10 0.001 0.01 0.00 0.11 0.0001 1.2 2016 0.04 0.001 0.04 0.19 0.10 0.001 0.01 0.00 0.11 0.0001 0.6 1990-2016 period1) -1.84 -0.14 -0.14 0.18 -0.89 -0.17 -2.47 -1.39 -64 -0.04 -2.29 1990-2016 period2) -98% -99% -77% 2,118% -90% -100% -100% -100% -100% -100% -78% 1) Absolute difference 2) Relative difference to 1990 in %
Activity data and (implied) emission factors 3.3.4
Petroleum refining (1A1b)
All emission data have been based on Annual Environmental Reports (AERs).
Manufacture of solid fuels and other energy industries (1A1c) Emission data have been based on AERs and collectively estimated industrial sources.
Iron and steel (1A2a)
Emission data have been based on AERs and collectively estimated industrial sources. For this source category, 1% of the SOx emissions were collectively estimated (in 2016), thus 99% were based on the AERs. Non-ferrous metals (1A2b)
Emission data have been based on AERs and collectively estimated industrial sources. For this source category, 21% of the NMVOC
emissions, 9% of the NOx emissions and 29% of the SOx emissions were collectively estimated (in 2016).
Chemicals (1A2c)
Emission data have been based on AERs and collectively estimated industrial sources. For this source category, 4% of the NOx emissions, 3% of the SOx emissions and 3% of the NMVOC emissions and 1% of the PM10 emissions were collectively estimated (in 2016).
Pulp, paper and print (1A2d)
Emission data have been based on AERs and collectively estimated industrial sources. For this source category, 31% of NMVOC emissions and 11% of NOx emissions were collectively estimated (in 2016).
Food processing, beverages and tobacco (1A2e)
Emission data have been based on AERs and collectively estimated industrial sources.
Non-metallic minerals (1A2f)
Emission data have been based on AERs and collectively estimated industrial sources. Emissions from non-metallic minerals were allocated to 1A2gviii.
Other (1A2gviii)
This sector includes all combustion emissions from the industrial sectors that do not belong to the categories 1A2a to 1A2e. Emission data have been based on AERs and collectively estimated industrial sources. For some of the above-mentioned categories, emissions were not entirely available from the AERs. For these sectors, emissions were calculated using National Energy Statistics and implied emission factors from the environmental reports or default emission factors (see Table 3.6).
Methodological issues 3.3.5
Emissions are based on data in the AERs from individual facilities (Tier 3 methodology). The emissions and fuel consumption data in the AERs are systematically examined for inaccuracies by checking the resulting implied emission factors. If environmental reports provide data of high enough quality, the information is used to calculate an ‘implied emission factor’ for a cluster of reporting companies (aggregated by NACE code). These emission factors are fuel- and sector-dependent and are used to calculate the emissions from companies that are not individually assessed.
EF ER-I (NACE, fuel) =
Emissions ER-I (NACE, fuel) Energy use ER-I (NACE, fuel)
where:
EF = Emission factor
ER-I = Emission Registration database for individual companies Next, combustion emissions from the companies that are not individually assessed in this NACE category are calculated from the energy use according to the Energy Statistics (from Statistics Netherlands),
multiplied by the implied emission factor. If the data from the individual companies are insufficient to calculate an implied emission factor, then a default emission factor is used (see Table 3.6).
ER-C_emission (NACE, fuel) = EF ER-I(NACE, fuel) * Energy Statistics (NACE, fuel)
where:
ER-C = Emission Registration database for collective emission sources
The total combustion emissions are the sum of the emissions from the individual companies (ER-I) plus the emissions from the companies that are not individually assessed (ER-C).
Table 3.6 Emission factors for the industrial sector (g/GJ)
Substance
name Natural gas Biogas Cokes Diesel LPG Petro-leum Coal Fuel oil Wood
Hydrocarbons 12 9 91 15 2 10 3 7 120 Sulphur dioxide 2 370 87 46 300 450 10 Nitrogen oxides as NO2 37 27 100 60 27 50 45 64 120 Carbon monoxide 15 20 12437 30 10 10 50 10 70 PM10 0.15 2 6 4.5 2 1.8 60 22.5 1 Total Suspended Particles (TSP) 0.15 2 10 5.0 2 2.0 100 25.0 1
Uncertainties and time series consistency 3.3.6
Uncertainties are explained in Section 1.7.
Source-specific QA/QC and verification 3.3.7
The emissions and fuel consumption data in the AERs were systematically examined for inaccuracies by checking the resulting implied emission factors. If the environmental reports provided data of high enough quality (see Section 1.6 on QA/QC), the information was used.
Source-specific recalculations 3.3.8
Source-specific recalculations:
• Revision of activity data on biogas.
Source-specific planned improvements 3.3.9
There are no source-specific planned improvements.
Other Stationary Combustion (1A4ai, 1A4bi, 1A4ci and 1A5a) 3.4
Source-category description 3.4.1
This source category comprises the following subcategories:
• 1A4ai Commercial/Institutional: Stationary. This sector comprises commercial and public services, such as banks, schools and hospitals, trade, retail and communication. It also includes the production of drinking water and miscellaneous combustion emissions from waste handling activities and from waste-water treatment plants;
• 1A4bi Residential: Stationary. This sector refers to domestic fuel consumption for space heating, water heating and cooking. About three-quarters of the sector’s consumption of natural gas is used for space heating;
• 1A4ci Agriculture/Forestry/Fisheries: Stationary. This sector comprises stationary combustion emissions from agriculture, horticulture, greenhouse horticulture, cattle breeding and forestry;
• 1A5a Other stationary. This sector includes stationary combustion of waste gas from dumping sites.
Key sources 3.4.2
The Small combustion sector is a key source of the pollutants presented in Table 3.7.
Table 3.7 Pollutants for which the Small combustion (NFR 1A4 and 1A5) sector is a key source
Category / Sub-category Pollutant Contribution to total of 2016 (%) 1A4ai Commercial/institutional, Stationary NOx 2.8
1A4bi Residential, stationary NOx NMVOC CO PM10 PM2.5 BC Cd Hg Dioxine PAH 3.1 8.1 14 7.9 16 20 9.3 6.0 30 87 1A4ci Agriculture/forestry/fishing, Stationary NOx 4.2
Overview of shares and trends in emissions 3.4.3
An overview of the trends in emissions is shown in Table 3.8. Emissions of almost all pollutants have decreased since 1990, while fuel use has increased slightly.
Table 3.8 Overview of trends in emissions
Main Pollutants Particulate Matter Other
NO x N M V OC SO x NH 3 PM 2. 5 PM 10 TS P BC CO Year Gg Gg Gg Gg Gg Gg Gg Gg Gg 1990 43 16.3 3.2 0 2.7 2.8 5.5 0.9 81 1995 46 17.0 1.4 0 2.5 2.7 5.2 0.9 86 2000 40 15.6 0.9 0 2.3 2.4 4.8 0.9 83 2005 37 15.2 0.7 0 2.3 2.4 4.7 0.8 85 2010 38 15.3 0.6 0 2.2 2.3 4.5 0.7 85 2015 26 13.9 0.6 0 2.1 2.1 4.4 0.7 83 2016 26 14.0 0.6 0 2.1 2.2 4.5 0.7 84 1990-2016 period1) -17 -2.3 -2.6 0 -0.6 -0.6 -1.0 -0.3 3 1990-2016 period 2) -40% -14% -81% -23% -23% -19% -28% 4%
Priority Heavy Metals POPs Other Heavy Metals
Pb Cd Hg DIOX PAH As Cr Cu Ni Se Zn Year Mg Mg Mg g I-Teq Mg Mg Mg Mg Mg Mg Mg 1990 0.78 0.07 0.12 108 3.8 0.05 3.5 0.72 2.7 0.0036 2 1995 0.12 0.05 0.04 8.1 4.0 0.02 0.05 0.34 0.5 0.0018 0.77 2000 0.08 0.05 0.03 7.3 3.9 0.01 0.00 0.32 0.01 0.0000 0.70 2005 0.08 0.05 0.03 7.0 4.1 0.00 0.01 0.35 0.2 0.0001 0.76 2010 0.09 0.05 0.03 6.8 4.1 0.01 0.00 0.38 0.02 0.0000 0.82 2015 0.09 0.06 0.04 7.0 4.2 0.00 0.00 0.41 0.01 0.0000 0.86 2016 0.09 0.06 0.04 7.1 4.3 0.00 0.00 0.42 0.01 0.0000 0.89 1990-2016 period1) -0.68 -0.01 -0.08 -101 0.5 -0.04 -3.5 -0.31 -2.7 -0.0036 -1.1 1990-2016 period2) -88% -11% -69% -93% 13% -94% -100% -42% -100% -100% -55% 1) Absolute difference 2) Relative difference to 1990 in %
Activity data and (implied) emission factors 3.4.4
Commercial/institutional (1A4ai)
Combustion emissions from the commercial and institutional sectors have been based on fuel consumption data (from Statistics Netherlands) and emission factors (see Table 3.9).
Table 3.9 Emission factors for stationary combustion emissions from the services sector (g/GJ)
Substance
name Natural gas Biogas Diesel LPG Petroleum Coal Fuel oil Wood
Hydrocarbons 12 8 15 2 10 3 7 40 Sulphur dioxide 2 87 46 300 450 10 Nitrogen oxides as NO2 1) 80 60 40 50 45 64 120 Carbon monoxide 15 20 30 10 10 50 10 70 PM10 0.15 2 4.5 2 1.8 60 22.5 1 Total Suspended Particles (TSP) 0.15 2 5.0 2 2.0 100 25.0 1 1) see table on NO
x emission factors in Van Soest-Vercammen et al. (2002) for the services sector and in Kok (2014) for the agriculture sector
Residential (1A4bi)
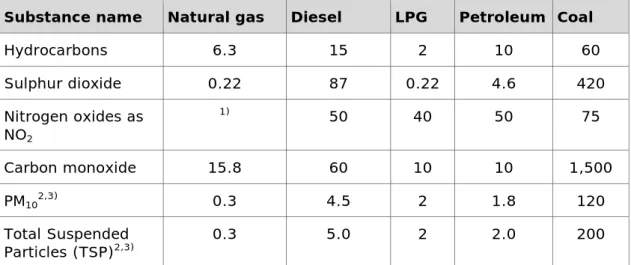
Combustion emissions from central heating, hot water and cooking have been based on fuel consumption data (from Statistics Netherlands) and emission factors (see Table 3.10). The fuel most used in this category is natural gas. The use of wood in stoves and fireplaces for heating is almost negligible compared to the amount of natural gas used. Combustion emissions from (wood) stoves and fireplaces have been calculated by multiplying the fuel consumption per apparatus type and fuel type (Statistics Netherlands) by emission factors per household (Jansen & Dröge, 2011).
Table 3.10 Emission factors for combustion emissions from households (g/GJ)
Substance name Natural gas Diesel LPG Petroleum Coal
Hydrocarbons 6.3 15 2 10 60 Sulphur dioxide 0.22 87 0.22 4.6 420 Nitrogen oxides as NO2 1) 50 40 50 75 Carbon monoxide 15.8 60 10 10 1,500 PM102,3) 0.3 4.5 2 1.8 120 Total Suspended Particles (TSP)2,3) 0.3 5.0 2 2.0 200
1) See table on NOx emission factors in Van Soest-Vercammen et al. (2002) and Kok
(2014)
2)See table on dust emissions from Visschedijk et al. (2007). 3)See table on dust emissions from Jansen et. al. (2016).