equator
Climate conscious design of hotels around the
Academic year 2019-2020
Master of Science in de ingenieurswetenschappen: architectuur
Master's dissertation submitted in order to obtain the academic degree of
Counsellor: Thomas Bockelandt
Supervisor: Prof. ir. Wim Boydens
Student number: 01505719Deze pagina is niet beschikbaar omdat ze persoonsgegevens bevat.
Universiteitsbibliotheek Gent, 2021.
This page is not available because it contains personal information.
Ghent University, Library, 2021.
5
ACKNOWLEDGEMENTS
Writing this master thesis was an interesting experience and taught me a lot. However, this was not possible without the great deal of support and assistance from numerous people. Therefore, this section is reserved to express my sincere gratitude to these people.
First of all, I would like to thank my supervisor Wim Boydens for his expertise and guidance and for giving me the opportunity to develop myself in the world of sustainable building design. I would also like to thank Thomas Bockelandt for his constructive feedback and his valuable assistance in the practical aspect of this thesis. The proper analysis, structuring and combination of relevant information with own research into a complete harmonious and comprehensive work was not possible without them.
I would like to acknowledge the whole staff of the University of Ghent for providing engaging learning processes and broadening my horizon.
Last but not least, a special thanks goes out to my family and friends for the much support, encouragement and willingness to listen and help. They made this experience even more pleasant.
6
ABSTRACT
The aim of this study was to define 'neutral' hotel concepts for the climate zone around the equator and to write out strategies for a harmonic combination of passive climatic design guidelines and (‘state of the art’) sustainable technologies and to describe the range of improvement potential. The study contained 3 chapters, each focused on a specific research field. ‘The energy demand of a guest room’, ‘The system analysis of a guest room’ and ‘The total hotel building analysis’. Besides a literature review providing overall performance ranges, the dynamic simulation software, TRNSYS, was used and incorporated in a performance assessment method. On the one hand, as a means to test the feasibility and influence of different variables, on the other hand as a starting point to conduct further design exploration. A specific type of guest room with 3 cooling systems (air based fan coil units, water based chilled ceilings and a hybrid air-water cooling system) was analysed to determine the requirements for sufficient comfort and good operability of each system, and to find out how these requirements were influenced by various building envelope parameters. Finally, energy flows in a reference hotel were simulated so that 5 promising HVAC concepts could be developed.
Hotel complexes of major global players have worked for years towards standards that take little or no account of the local context. With regard to energy use, water use and CO2 emissions, the performance of the complex strongly depends on the way techniques and strategies are used. Hotel chains are demanding to make their sustainability label stronger by commemorating the way in which their complexes are built. Especially in hot and humid climates there is a strong challenge for this. Decent indoor climate is commonly achieved by high energy intensive air conditioning systems. To reduce the hotel’s reliance on high grade energy yet still provide comfort for the occupants the designer has to consider more holistically the strategies used for environmental control given a particular building function, design and context. Other more energy efficient and environmentally friendly alternatives have been proposed. The established methodology, incorporating sensitivity analysis helps stakeholders in a building project to prioritize the resource allocation to the most influential design factors at the earliest opportunity. Besides optimisation of individual systems, interactions between cooling, ventilation and/or sanitary hot water systems have been investigated, creating higher levels of synergy and energy efficiency. In the perspective of passive climatic design, several important relations between passive heat prevention, heat modulation and heat dissipation strategies have been uncovered. For the cooling system analysis on a room basis, specific conditions ranging from building envelope parameters to system parameters have been determined to enable condensation risk free operation of the chilled ceiling cooling system. A better performing hybrid cooling system combining chilled ceilings and air convector cooling has been found successful. Different cooling and ventilation schedules can also be proposed for optimal operation. In the case of total HVAC building design, performance enhancement was possible throughout the development of hybrid configurations with novel high-efficient technologies. The 5 concepts are as follows: a vapour compression based chiller with AHU’s, FCU’s and cooling water heat recovery as preheating for (sanitary) hot water; A solar driven absorption chiller with AHU’s, FCU’s and solar thermal storage for (sanitary) hot water; A solar driven adsorption chiller with solid desiccant dehumidification, chilled ceilings and solar thermal storage for (sanitary) hot water; A vapour compression based chiller with CHP, PV panels, AHU’s and heat pumps for (sanitary) hot water and lastly a polyvalent 4-pipe heat pump for both cooling, heating and sanitary hot water.
8
TABLE OF CONTENTS
ACKNOWLEDGEMENTS ... 5 ABSTRACT ... 6 LIST OF FIGURES ... 10 LIST OF TABLES ... 11 LIST OF ABBREVIATIONS ... 13PROBLEM STATEMENT AND OBJECTIVE ... 15
METHODOLOGY ... 16 INTRODUCTION ... 17 CLIMATE ... 17 HOTEL ... 19 COMFORT ... 20 ENERGY ... 23
1. ENERGY DEMAND OF A GUEST ROOM ... 27
PART1.HEATPREVENTION ... 28
Literature study ... 28
Simulation based analysis ... 33
Building simulation model ... 33
Results and discussion ... 39
Orientation ... 39
Window-to-wall ratio ... 41
Window and glazing type ... 41
Sun protection ... 43
Facade type ... 47
Summary ... 51
PART2.HEATMODULATION&DISSIPATION ... 51
Literature study ... 51
Simulation based analysis ... 54
Building simulation model ... 54
Results and discussion ... 54
Thermal inertia facade ... 54
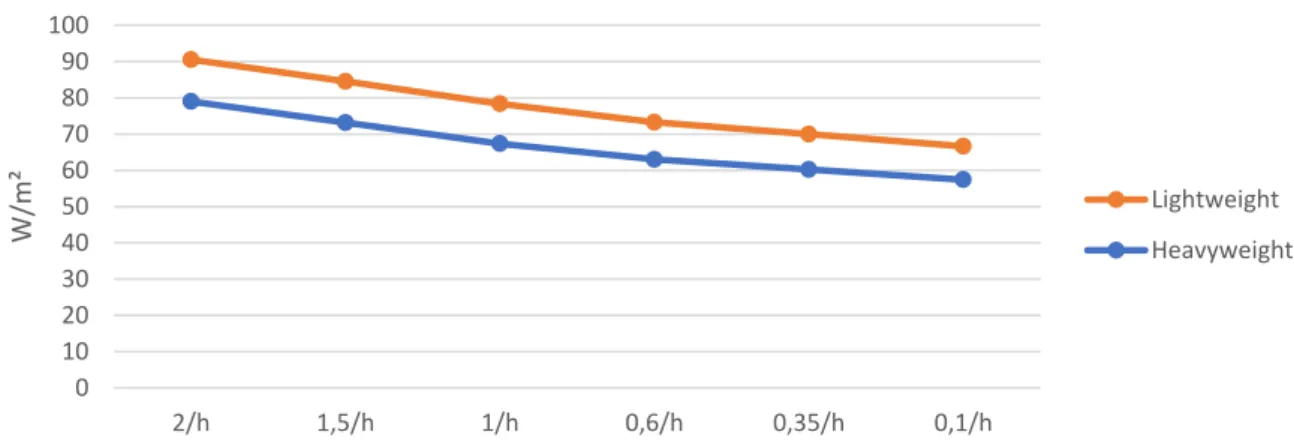
Infiltration ... 56
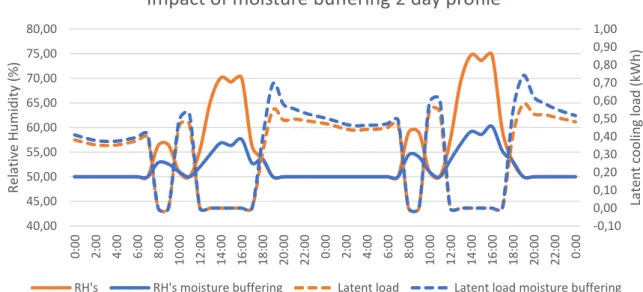
Moisture buffering ... 58
Ventilation ... 59
Comfort set points ... 60
Summary ... 61
2. SYSTEM ANALYSIS OF A GUEST ROOM ... 62
PART1.AIRBASEDCOOLING ... 62
Literature study ... 62
Simulation based analysis ... 64
Building simulation model ... 64
Results and discussion ... 65
Comfort and feasibility ... 65
Energy consumption ... 67
PART2.WATERBASEDRADIANTCOOLING ... 70
9
Simulation based analysis ... 74
Building simulation model ... 74
Results and discussion ... 75
Comfort and feasibility ... 75
Energy consumption ... 83
PART3.HYBRIDCOOLING ... 85
Literature study ... 85
Simulation based analysis ... 88
Building simulation model ... 88
Results and discussion ... 88
Comfort and feasibility ... 88
Energy consumption ... 93
Summary ... 95
3. TOTAL HOTEL BUILDING ANALYSIS ... 96
PART1.SIMULATIONBASEDANALYSIS ... 97
Building simulation model ... 97
Results and discussion ... 101
Cooling demand ... 101
Hot water demand ... 106
Total energy demand ... 108
PART2.HVACCONCEPTDESIGNEXPLORATION ... 109
CONCEPT 1 ... 111
Ventilation system ... 111
Chilled water cooling system ... 111
(Sanitary) hot water system ... 113
CONCEPT 2 ... 114
Ventilation system ... 114
Chilled water cooling system ... 114
(Sanitary) hot water system ... 116
CONCEPT 3 ... 117
Ventilation system ... 117
Chilled water cooling system ... 119
(Sanitary) hot water system ... 119
CONCEPT 4 ... 120
Ventilation system ... 120
Chilled water cooling system ... 120
(Sanitary) hot water system ... 122
CONCEPT 5 ... 123
Ventilation system ... 123
Chilled water cooling system ... 123
(Sanitary) hot water system ... 125
SUMMARY ... 126
FUTUREWORK ... 127
REFERENCE LIST ... 128
APPENDIX A ... 131
10
LIST OF FIGURES
FIGURE 1–KÖPPEN-GEIGER CLIMATE CLASSIFICATION FOR SOUTHEAST ASIA (BECK ET AL.,2018) ... 18
FIGURE 2–PMV/PPD THERMAL COMFORT CATEGORIES ... 21
FIGURE 3-GLOBAL SHARE OF BUILDINGS AND CONSTRUCTION FINAL ENERGY USE AND CO2 EMISSIONS,2017.(GLOBAL STATUS REPORT 2018,2018) ... 24
FIGURE 4–BUILDING ENERGY CODES BY JURISDICTION,2017-2018(GLOBAL STATUS REPORT 2018,2018) ... 25
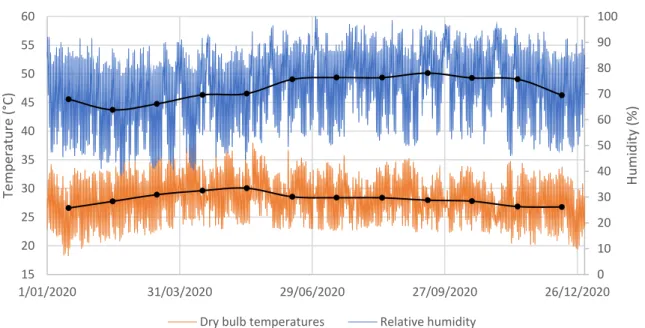
FIGURE 5–DRY BULB TEMPERATURE AND RELATIVE HUMIDITY PROFILE OF HO CHI MINH ... 33
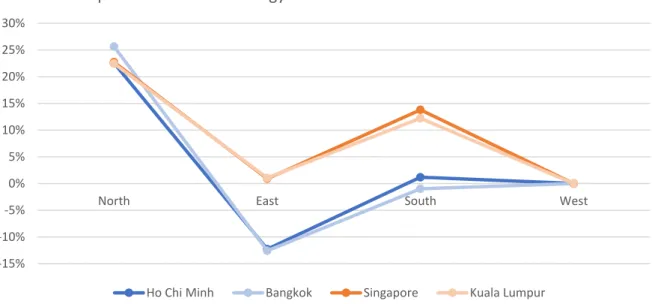
FIGURE 6–CLIMATE COMPARISON OF 4 SOUTHEAST ASIAN CITIES ... 34
FIGURE 7–FLOOR PLAN SIMULATED HOTEL GUEST ROOM ... 34
FIGURE 8–OCCUPANCY HOTEL GUEST ROOM ... 36
FIGURE 9–OCCUPANCY LIGHTING HOTEL GUEST ROOM ... 36
FIGURE 10–DIMENSIONS AND LAYOUT OF FIXED SHADING ... 38
FIGURE 11–SENSIBLE COOLING LOAD PROFILE FOR WEST AND SOUTHERN ORIENTED ROOMS ... 39
FIGURE 12–IMPROVEMENT IN ANNUAL ENERGY DEMAND FOR DIFFERENT CITIES RELATIVE TO WESTERN ORIENTATION ... 40
FIGURE 13–ANNUAL SENSIBLE ENERGY DEMAND FOR DIFFERENT WINDOW-TO-WALL RATIOS ... 41
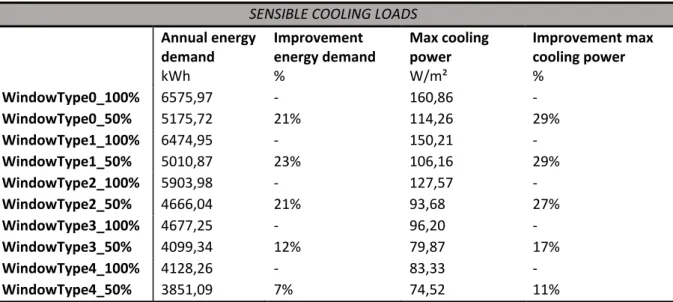
FIGURE 14–SENSIBLE COOLING LOAD SPECTRUM FOR DIFFERENT WINDOW TYPES ... 42
FIGURE 15–IMPROVEMENT IN ANNUAL SENSIBLE ENERGY DEMAND FOR DIFFERENT WINDOW TYPES RELATIVE TO WINDOW TYPE 1 ... 43
FIGURE 16–SENSIBLE COOLING LOADS FOR DIFFERENT SUNSCREENS ... 43
FIGURE 17–LOAD CONSISTENCY AND MEAN DEVIATION FOR DIFFERENT SUNSCREENS ... 44
FIGURE 18–IMPROVEMENT POTENTIAL MAXIMUM COOLING POWER FOR DIFFERENT ORIENTATIONS AND DIFFERENT SUNSCREENS ... 45
FIGURE 19–ANNUAL SENSIBLE COOLING DEMAND FOR DIFFERENT ORIENTATIONS AND DIFFERENT TYPES OF FIXED SHADING ... 46
FIGURE 20–ANNUAL SENSIBLE COOLING DEMAND FOR DIFFERENT WINDOW TYPES AND SUNSCREENS ... 46
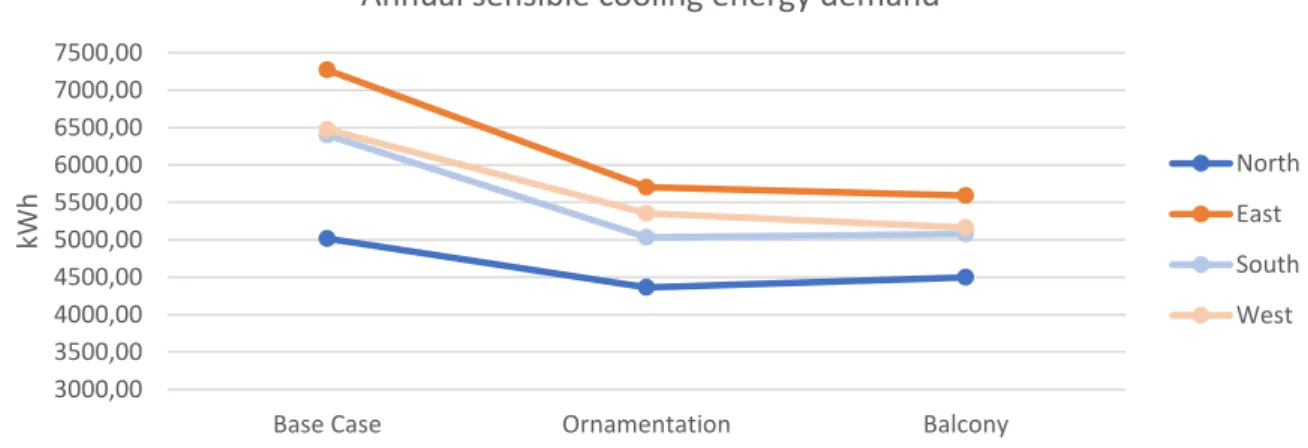
FIGURE 21–SENSIBLE COOLING LOADS FOR DIFFERENT FACADE TYPES ... 47
FIGURE 22–IMPROVEMENT POTENTIAL SENSIBLE COOLING DEMAND FOR DIFFERENT WWR’S AND FACADE TYPES RELATIVE TO FACADE TYPE 1 ... 48
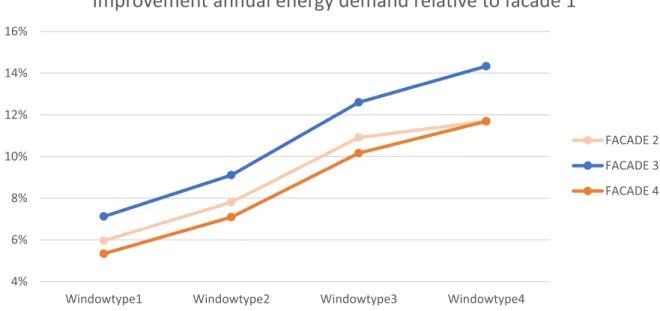
FIGURE 23–IMPROVEMENT POTENTIAL SENSIBLE COOLING DEMAND FOR DIFFERENT WINDOW AND FACADE TYPES RELATIVE TO FACADE 1 ... 49
FIGURE 24–MAXIMUM IMPROVEMENT POTENTIAL OF INDIVIDUAL PARAMETERS ... 51
FIGURE 25–IMPROVEMENT IN PEAK COOLING POWER REQUIREMENT FOR DIFFERENT FACADE TYPES AND WWR’S RELATIVE TO FACADE TYPE 1 ... 55
FIGURE 26–COOLING LOAD PROFILE FOR DIFFERENT FACADE TYPES WITH SAME INSULATION VALUES AND DIFFERENT AMOUNTS OF THERMAL MASS ... 55
FIGURE 27–IMPROVEMENT IN PEAK COOLING POWER REQUIREMENT FOR DIFFERENT FACADE TYPES AND WINDOW TYPES RELATIVE TO FACADE TYPE 1 ... 56
FIGURE 28–MAXIMUM SENSIBLE COOLING POWER REQUIREMENTS FOR DIFFERENT WALL TYPES AND INFILTRATION AIR CHANGE RATES ... 57
FIGURE 29–INPUT PARAMETERS DETAILED MOISTURE BUFFER STORAGE MODEL TRNSYS ... 58
FIGURE 30–EFFECT OF ADDITIONAL MOISTURE BUFFERING ON THERMAL COMFORT AND LATENT COOLING LOADS IN A HOTEL GUEST ROOM ... 59
FIGURE 31–LATENT COOLING LOAD PROFILE FOR DIFFERENT VENTILATION RATES AND SCHEDULES ... 59
FIGURE 32–SIMULATION MODEL TRNSYS AIR BASED COOLING ... 64
FIGURE 33–TEMPERATURES AND RH’S IN HOTEL GUEST ROOM WITH IMPROVED BUILDING ENVELOPE AND AIR BASED COOLING SYSTEM ... 67
FIGURE 34–RELATIONSHIP BETWEEN HUMAN-BODY EXERGY CONSUMPTION AND MEAN RADIANT TEMPERATURE FOR DIFFERENT AIR VELOCITY’S (SHUKUYA,2015) 71 FIGURE 35–RELATIONSHIP BETWEEN HUMAN-BODY EXERGY CONSUMPTION AND AIR VELOCITY FOR DIFFERENT MEAN RADIANT TEMPERATURES (SHUKUYA,2015) 72 FIGURE 36–SIMULATION MODEL TRNSYS WATER BASED RADIANT COOLING ... 74
FIGURE 37–RH’S IN HOTEL GUEST ROOM FOR DIFFERENT INFILTRATION RATES WITH A 120M³/H VENTILATION RATE AND 10G/KG ABSOLUTE HUMIDITY SUPPLY .... 78
FIGURE 38–INDOOR AIR TEMPERATURES IN HOTEL GUEST ROOM FOR DIFFERENT CC COOLING TEMPERATURES ... 78
FIGURE 39–RH’S IN HOTEL GUEST ROOM FOR DIFFERENT HUMIDITY SUPPLY RATIOS WITH A 120M³/H VENTILATION RATE AND 1 INFILTRATION ACH ... 79
FIGURE 40–TEMPERATURES AND RH’S IN HOTEL GUEST ROOM UNDER CHILLED CEILINGS SETUP FOR DIFFERENT COOLING AND VENTILATION SCHEDULES ... 83
FIGURE 41–3 PILLAR HYBRID COOLING DIAGRAM ... 86
FIGURE 42–SCHEMATIC OF THE HYBRID RADIANT COOLING SYSTEM WITH AIRBOX CONVECTOR (KIM ET AL.,2018)... 87
FIGURE 43–SIMULATION MODEL TRNSYS HYBRID COOLING ... 88
FIGURE 44–INDOOR AIR TEMPERATURES IN HOTEL GUEST ROOM FOR DIFFERENT COOLING AND VENTILATION SCHEDULES ... 91
FIGURE 45–RH’S IN HOTEL GUEST ROOM FOR BOTH RADIANT AND HYBRID COOLING AND DIFFERENT COOLING AND VENTILATION SCHEDULES ... 92
FIGURE 46–SKETCHUP MODEL OF REFERENCE HOTEL AS INPUT IN SIMULATION SOFTWARE ... 97
FIGURE 47–ZONE DIVISION IN REFERENCE HOTEL ... 98
FIGURE 48–SIMULATION MODEL TRNSYS REFERENCE HOTEL ... 100
FIGURE 49–OVERVIEW MULTIZONE SIMULATION MODEL TRNBUILD REFERENCE HOTEL ... 100
FIGURE 50–ANNUAL COOLING DEMAND FOR DIFFERENT TYPES OF ZONES ... 101
FIGURE 51–COMPARISON SHARE OF ANNUAL COOLING DEMAND AND RESPECTIVE FLOOR AREA FOR DIFFERENT TYPES OF ZONES ... 101
FIGURE 52–ANNUAL AVERAGE SENSIBLE COOLING DEMAND PER UNIT AREA FOR DIFFERENT TYPES OF ZONES ... 102
FIGURE 53–ANNUAL AVERAGE LATENT COOLING DEMAND PER UNIT AREA FOR DIFFERENT TYPES OF ZONES ... 102
FIGURE 54–COOLING LOAD PROFILE FOR ROOMS AND MAIN SERVICES FOR THE 1ST AND 2ND OF MAY ... 104
FIGURE 55–MAXIMUM SENSIBLE COOLING POWER REQUIREMENTS FOR DIFFERENT TYPES OF ZONES ... 105
FIGURE 56–MAXIMUM LATENT COOLING POWER REQUIREMENTS FOR DIFFERENT TYPES OF ZONES ... 106
FIGURE 57–CONCEPT 1 ... 112
FIGURE 58–CONCEPT 2 ... 115
FIGURE 59–HUMIDITY RATIOS AND DRY BULB TEMPERATURES DURING DIFFERENT VENTILATION AIR TREATMENT STAGES ... 117
FIGURE 60–CONCEPT 3 ... 118
11
FIGURE 62–SCHEMATIC OPERATION MODES OF A POLYVALENT HEAT PUMP ... 123
FIGURE 63–CONCEPT 5 ... 124
FIGURE 64–SELECTION OF OPERATION MODES OF A DOUBLE CIRCUIT POLYVALENT HEAT PUMP ... 125
FIGURE 65–KÖPPEN-GEIGER CLIMATE CLASSIFICATION ... 131
FIGURE 66–BUILDING ENERGY CERTIFICATION PROGRAMMES BY JURISDICTION,2017-2018(GLOBAL STATUS REPORT 2018,2018) ... 132
FIGURE 67–IMPROVEMENT POTENTIAL OF DIFFERENT SUNSCREENS ON DIFFERENT WINDOW TYPES ... 135
FIGURE 68–IMPROVEMENT POTENTIAL OF DIFFERENT WINDOW TYPES ON DIFFERENT SUNSCREENS ... 136
FIGURE 69–RELATIONSHIP BETWEEN TSV AND CSV IN A RADIANT COOLING SETUP FOR DIFFERENT HUMIDITY’S AND AIR VELOCITY’S ... 138
FIGURE 70–DIFFERENT TYPES OF NATURAL VENTILATION (EDGE BUILDINGS,2017)... 138
FIGURE 71–CONCEPT OF A HYBRID VERTICAL RADIATIONAL COOLING SYSTEM WITH CONTINUOUS NATURAL CROSS VENTILATION ... 139
FIGURE 72–VERTICAL DEHUMIDIFYING AND COOLING PANEL ... 139
FIGURE 73–SHARE OF SERVICES IN REFERENCE HOTEL VIA THE EDGE GREEN BUILDING APP (EDGEBUILDINGS |BUILD AND BRAND GREEN, N.D.) ... 140
FIGURE 74–COP OF COMMON VAPOUR COMPRESSION CHILLERS AT PART LOAD OPERATION ... 140
LIST OF TABLES
TABLE 1–INDOOR ENVIRONMENTAL QUALITY CATEGORIES ... 20TABLE 2–PMV/PPDIEQ CATEGORIES. ... 21
TABLE 3–IAQ CATEGORIES WITH CORRESPONDING CO2 ABOVE OUTDOORS IN PPM ... 23
TABLE 4–IAQ CATEGORIES WITH AIRFLOW PER PERSON ... 23
TABLE 5–MONTHLY CLIMATE DATA HO CHI MINH ... 33
TABLE 6–WALL AND FLOOR BUILD-UPS OF HOTEL GUEST ROOM ... 35
TABLE 7–DIMENSIONS WINDOW HOTEL GUEST ROOM ... 35
TABLE 8–PROPERTIES WINDOW HOTEL GUEST ROOM ... 35
TABLE 9–CONSTANT PARAMETERS SIMULATION MODEL HOTEL GUEST ROOM ... 37
TABLE 10–VARIABLE PARAMETERS SIMULATION MODEL HOTEL GUEST ROOM PART 1 ... 37
TABLE 11–PROPERTIES OF DIFFERENT WINDOW TYPES ... 37
TABLE 12–DIFFERENT FACADE TYPE BUILD-UPS ... 38
TABLE 13–INPUT MATRIX SIMPLIFIED SIMULATION SCENARIO’S ... 38
TABLE 14–SOLAR RADIATION CHARACTERISTICS HO CHI MINH ... 39
TABLE 15–SENSIBLE COOLING LOADS FOR DIFFERENT ORIENTED EXTERIOR WALLS ... 39
TABLE 16–SENSIBLE COOLING LOADS HOTEL GUEST ROOM SITUATED UNDER ROOF ... 40
TABLE 17–SENSIBLE COOLING LOADS FOR DIFFERENT WINDOW-TO-WALL RATIOS ... 41
TABLE 18–SENSIBLE COOLING LOADS FOR DIFFERENT WINDOW TYPES ... 41
TABLE 19–EFFECT OF WWR’S WITH DIFFERENT WINDOW TYPES ON ANNUAL SENSIBLE COOLING LOADS ... 42
TABLE 20–SENSIBLE COOLING LOADS FOR DIFFERENT SUNSCREENS ... 44
TABLE 21–SENSIBLE COOLING LOADS FOR DIFFERENT TYPES OF FIXED SHADING ... 45
TABLE 22–ANNUAL SENSIBLE COOLING DEMAND FOR DIFFERENT SUNSCREENS ... 45
TABLE 23–ANNUAL SENSIBLE COOLING DEMAND IN DIFFERENT ORIENTATIONS FOR DIFFERENT TYPES OF FIXED SHADING ... 46
TABLE 24–SENSIBLE COOLING LOADS FOR DIFFERENT FACADE TYPES ... 47
TABLE 25–ANNUAL SENSIBLE COOLING DEMAND FOR DIFFERENT WINDOW-TO-WALL RATIOS AND FACADE TYPES ... 48
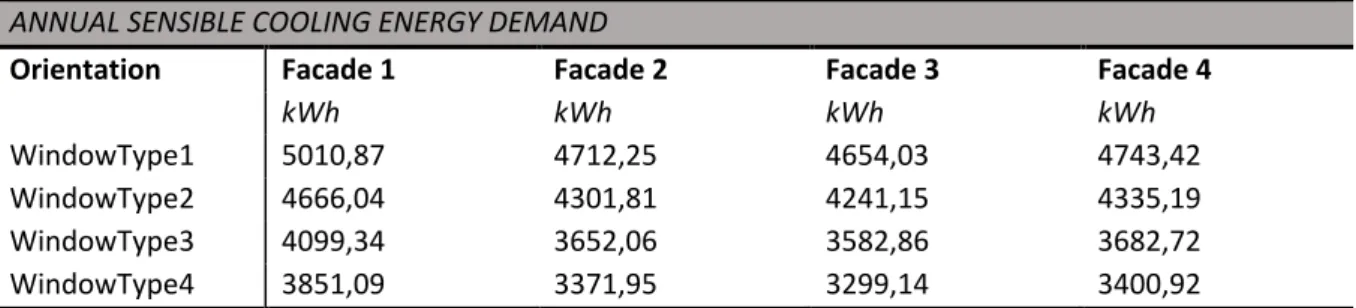
TABLE 26–ANNUAL SENSIBLE COOLING DEMAND FOR DIFFERENT WINDOW AND FACADE TYPES ... 48
TABLE 27–OVERVIEW OF ANNUAL SENSIBLE COOLING DEMAND OF COMBINED STRATEGIES ... 50
TABLE 28–VARIABLE PARAMETERS SIMULATION MODEL HOTEL GUEST ROOM PART 2 ... 54
TABLE 29–INTERNAL WALL BUILD-UPS FOR HOTEL GUEST ROOM ... 54
TABLE 30–MAXIMUM SENSIBLE COOLING POWER REQUIREMENTS FOR DIFFERENT FACADE TYPES AND WINDOW-TO-WALL RATIOS ... 55
TABLE 31–SENSIBLE COOLING LOADS FOR DIFFERENT INFILTRATION AIR CHANGE RATES IN NATURAL PRESSURE CONDITIONS ... 56
TABLE 32–LATENT COOLING LOADS FOR DIFFERENT INFILTRATION AIR CHANGE RATES IN NATURAL PRESSURE CONDITIONS ... 57
TABLE 33–EFFECT OF ADDITIONAL MOISTURE BUFFERING ON LATENT COOLING LOADS IN A HOTEL GUEST ROOM ... 58
TABLE 34–EFFECT OF VENTILATION AT LEAST 1H PRIOR TO COOLING ON LATENT COOLING LOADS IN A HOTEL GUEST ROOM ... 59
TABLE 35–EFFECT OF INCREASED COMFORT SET POINTS ON SENSIBLE COOLING LOADS IN A HOTEL GUEST ROOM ... 60
TABLE 36–EFFECT OF INCREASED COMFORT SET POINTS ON LATENT COOLING LOADS IN A HOTEL GUEST ROOM ... 60
TABLE 37–COMFORT CRITERIA FROM VARIOUS THEORETICAL ADAPTIVE COMFORT MODELS ... 65
TABLE 38–ANALYSIS OF AIR BASED COOLING SYSTEM ... 66
TABLE 39–CONDENSATE FLOW RATES IN AN AIR BASED COOLING SYSTEM FOR DIFFERENT OPERATIONS ... 67
12
TABLE 41–FLUID FLOW RATES TO COOLING COILS IN AN AIR BASED COOLING SYSTEM ... 68
TABLE 42–ENERGY CONSUMPTION OF PUMPS IN AN AIR BASED COOLING SYSTEM FOR ONE HOTEL GUEST ROOM ... 69
TABLE 43–ENERGY CONSUMPTION OF FANS IN AN AIR BASED COOLING SYSTEM FOR ONE HOTEL GUEST ROOM ... 69
TABLE 44–ENERGY SAVING OF SENSIBLE HEAT RECOVERY IN AN AHU... 69
TABLE 45–ANALYSIS OF CHILLED CEILING FEASIBILITY IN BASELINE SCENARIO WITH NO VENTILATION ... 75
TABLE 46–ANALYSIS OF CHILLED CEILING FEASIBILITY WITH VENTILATION AND IMPROVED BUILDING ENVELOPE ... 76
TABLE 47–CONDENSATION HOURS FOR DIFFERENT INFILTRATION RATES, HUMIDITY RATIOS AND CC TEMPERATURES... 77
TABLE 48–ANALYSIS OF CHILLED CEILING FEASIBILITY WITH A HIGH VENTILATION RATE AND HIGH PERFORMANT BUILDING ENVELOPE ... 80
TABLE 49–COMPARISON OF DIFFERENT COMFORT CRITERIA ON THE FEASIBILITY OF CHILLED CEILINGS ... 80
TABLE 50–COMPARISON OF DIFFERENT CITIES ON THE FEASIBILITY OF CHILLED CEILINGS ... 81
TABLE 51–COMPARISON OF DIFFERENT COOLING AND VENTILATION SCHEDULES ON THE FEASIBILITY OF CHILLED CEILINGS ... 82
TABLE 52–ENERGY CONSUMPTION OF CHILLER IN A WATER BASED RADIANT COOLING SYSTEM FOR ONE HOTEL GUEST ROOM... 83
TABLE 53–FLUID FLOW RATES TO COILS AND CHILLED CEILING IN A WATER BASED COOLING SYSTEM ... 84
TABLE 54–ENERGY CONSUMPTION OF PUMPS IN A WATER BASED RADIANT COOLING SYSTEM FOR ONE HOTEL GUEST ROOM ... 84
TABLE 55–ENERGY CONSUMPTION OF FANS IN A WATER BASED RADIANT COOLING SYSTEM FOR ONE HOTEL GUEST ROOM ... 84
TABLE 56–ANALYSIS OF HYBRID COOLING FEASIBILITY WITH A HIGH VENTILATION RATE AND IMPROVED BUILDING ENVELOPE ... 89
TABLE 57–COMPARISON THE FEASIBILITY OF A REGULAR CC COOLING SYSTEM TO A HYBRID COOLING SYSTEM FOR LOW TEMPERATURE COOLING ... 90
TABLE 58-COMPARISON THE FEASIBILITY OF A REGULAR CC COOLING SYSTEM TO A HYBRID COOLING SYSTEM FOR HIGH TEMPERATURE COOLING ... 91
TABLE 59–COMPARISON OF THE FEASIBILITY OF A REGULAR CC COOLING SYSTEM TO A HYBRID COOLING SYSTEM WITH DIFFERENT OPERATING SCHEDULES ... 92
TABLE 60–ANALYSIS OF WINDOW OPENING POTENTIAL FOR A HYBRID COOLING SYSTEM DURING DAY AND NIGHT-TIME ... 93
TABLE 61–ENERGY CONSUMPTION OF CHILLER IN A HYBRID COOLING SYSTEM FOR ONE HOTEL GUEST ROOM ... 94
TABLE 62–FLUID FLOW RATES TO COILS AND CHILLED CEILING IN A HYBRID COOLING SYSTEM ... 94
TABLE 63–ENERGY CONSUMPTION OF PUMPS IN A HYBRID COOLING SYSTEM FOR ONE HOTEL GUEST ROOM ... 94
TABLE 64–ENERGY CONSUMPTION OF FANS IN A HYBRID COOLING SYSTEM FOR ONE HOTEL GUEST ROOM ... 94
TABLE 65–ANNUAL ENERGY CONSUMPTION OF DIFFERENT SYSTEMS FOR ONE HOTEL GUEST ROOM ... 95
TABLE 66–IMPROVEMENT POTENTIALS IN ENERGY EFFICIENCY OF THE WATER BASED AND HYBRID COOLING SYSTEM RELATIVE TO THE AIR BASED COOLING SYSTEM . 95 TABLE 67–WALL, FLOOR AND ROOF BUILD-UPS OF REFERENCE HOTEL ... 99
TABLE 68–PROPERTIES WINDOWS REFERENCE HOTEL ... 99
TABLE 69–ANNUAL AVERAGE SENSIBLE, LATENT AND TOTAL COOLING ENERGY DEMANDS FOR DIFFERENT TYPES OF ZONES ... 103
TABLE 70–MAXIMUM SENSIBLE, LATENT AND TOTAL COOLING POWER REQUIREMENTS FOR DIFFERENT TYPES OF ZONES ... 105
TABLE 71–DAILY HOT WATER DEMAND CHARACTERISTICS ... 107
TABLE 72–TOTAL HOT WATER DEMAND FOR THE ROOMS AND MAIN SERVICES ... 107
TABLE 73–TOTAL HOT WATER ENERGY DEMAND FOR THE REFERENCE HOTEL ... 108
TABLE 74–TOTAL ENERGY DEMAND PROFILE OF THE REFERENCE HOTEL ... 108
TABLE 75–SOLAR RADIATION AND GAIN FOR HO CHI MINH ... 116
TABLE 76–SOLAR THERMAL COLLECTOR SIZE DETERMINATION FOR HO CHI MINH ... 117
TABLE 77–ENERGY PRODUCTION OF PV PANELS FOR HO CHI MINH ... 122
TABLE 78–ENERGY COVERAGE OF PV ELECTRICITY PRODUCTION FOR VARIOUS ENERGY-CONSUMING BRANCHES IN THE HOTEL ... 122
TABLE 79–OVERVIEW OF ADVANTAGES AND DISADVANTAGES OF THE CONCEPTS ... 126
TABLE 80–CLIMATE CLASSIFICATION CRITERIA ... 131
TABLE 81–ANNUAL AVERAGE SHADING FACTORS FOR HORIZONTAL SHADING DEVICES AT DIFFERENT LOCATIONS (EDGE BUILDINGS,2017) ... 132
TABLE 82–ANNUAL AVERAGE SHADING FACTORS FOR VERTICAL SHADING DEVICES AT DIFFERENT LOCATIONS (EDGE BUILDINGS,2017)... 133
TABLE 83–ANNUAL AVERAGE SHADING FACTORS FOR COMBINED SHADING DEVICES AT DIFFERENT LOCATIONS (EDGE BUILDINGS,2017) ... 133
TABLE 84–CHARACTERISTICS OF MACROCLIMATE IN 4 DIFFERENT SOUTHEAST ASIAN CITIES ... 134
TABLE 85–CHARACTERISTICS OF MATERIALS USED IN TRNBUILD SIMULATION MODELS ... 134
TABLE 86–DIMENSIONS HOTEL GUEST ROOM ... 134
TABLE 87–EFFECT OF ORIENTATION ON ANNUAL COOLING LOADS FOR DIFFERENT LOCATIONS ... 135
TABLE 88–TOTAL ANNUAL COOLING LOADS FOR DIFFERENT WINDOW-TO-WALL RATIOS... 135
TABLE 89–MOISTURE BUFFERING PROPERTIES OF DIFFERENT MATERIALS FOR BUFFER STORAGE HUMIDITY MODEL ... 136
TABLE 90–OVERVIEW MAIN TRNSYS COMPONENTS USED IN SIMULATION MODELS ... 137
TABLE 91–MAXIMUM DEPTH OF FLOOR TO CEILING HEIGHT RATIO FOR DIFFERENT NATURAL VENTILATION TYPES (EDGE BUILDINGS,2017) ... 138
13
LIST OF ABBREVIATIONS
AASF Annual average shading factor
AC Air-conditioning
ACH Infiltration air change rate (1/h)
Af Tropical rainforest climate
AHU Air handling unit
Am Tropical monsoon climate
ASEAN Association of south-east Asian nations
ASHRAE American Society of Heating Refrigerating and Air-conditioning Engineers
Aw Tropical savanna climate with dry winter
BIPV Building integrated photovoltaics
BMS Building management system
BWh Hot desert climate
CAV Constant air volume
CC Chilled ceiling
CHP Combined heat and power
Clo Clothing level
COP Coefficient of performance
CPC Compound parabolic collectors
CSV Comfort sensation vote
DF Daylight factor
DOAS Dedicated outdoor air system
DSF Double skin facades
DX Direct evaporation
EC Electronically commutated
EER Energy efficiency ratio
ET Equivalent temperature
ETC Evacuated tube collectors
EUI Energy use intensity (kWh/m²)
FCU Fan coil unit
FPC Flat plate collector
GBI Green building index
GDP Gross domestic product
GHG Greenhouse gas emissions
g-value Total solar energy transmittance
GWP Global warning potential
HAM Heat air moisture
HC Hybrid cooling
HP Heat pump
HR Heat recovery
HVAC Heating, ventilation and air-conditioning
IAQ Indoor air quality
IEQ Indoor environmental quality
IFC International Finance Corporation
IPCC The intergovernmental panel on climate change
LED Light-emitting diode
LOTUS Vietnamese green building certification scheme
Low-e Low emissivity
LSA Local sensitivity analysis
LSC Luminescent solar concentrator
Met Metabolism
n50 Air change rate at 50 Pascal (1/h)
NV Naturally ventilated
NZEB Nearly zero-energy building
OAT One at a time
OT Operative temperature
PCM Phase change materials
PMV Predicted mean vote
PPD Percentage of persons dissatisfied
Ppm Parts per million
PSV Preferred sensation vote
PV Photovoltaic
PVES Photovoltaic equivalent surface
14
R² Coefficient of determination
RES Renewable energy sources
RH Relative humidity (%)
ROI Return on investment
SBS Sick building syndrome
SF Shading factor
SFP Specific fan power (kW/(m³/s))
SHF Sensible heat factor
SHGC Solar heat gain coefficient
SHW Sanitary hot water
TER Total efficiency ratio
TSV Thermal sensation vote
UHI Urban heat island
U-value Thermal transmittance (W/m²K)
VAV Variable air volume
VIP Vacuum insulation panels
w humidity ratio (g/kg)
WMO World Meteorological Organization
WOT Window opening threshold temperature
15
PROBLEM STATEMENT AND OBJECTIVE
Hotel complexes of major global players have worked for years towards standards that take little or no account of the local context. Moreover the technical and structural concepts are important factors in achieving good functionality, especially the sustainability performance of the complex with regard to energy use, water use and CO2 emissions. Hotel chains are demanding to make their sustainability label stronger by commemorating the way in which their complexes are built. Especially in hot humid climates there is a strong challenge for this. The building industry has taken maximum advantage of high technological machines to control light, temperature and comfort in their buildings. Many contemporary architects have indulged themselves and settled clients with buildings that cannot function independently of space-conditioning machinery. This use of equipment to modify climate has led to the problem of the ‘man-made climate’ which can be replicated around the world. The engineering systems associated with this man made climate and corresponding architecture have required high grade energy in order to provide comfort. Today we need to reduce the building’s reliance on high grade energy yet still provide comfort inside for the occupants. This obviously goes further than optimizing the efficiency of the machines itself.
The designer has to consider more holistically the strategies used for environmental control given a particular building function, design and context. This study will deliver a variety of parameter dependant strategies for hotels around the equator. These strategies are directions that can be taken for a harmonic combination of passive climatic design and (‘state of the art’) sustainable technologies and energy systems. They have planning implications for the designer, it has tactical consequences and carries responsibilities for the end user. Hence, they touch the whole process of ‘hotel making’.
16
METHODOLOGY
The study is composed of an introduction and three main chapters. The introduction is subdivided in four main themes sketching the background, setting the tone and outlining where further chapters will be built upon. Two of them, ‘Climate’ and ‘Hotel typology’ form constants for further research. The other two, ‘Comfort’ and ‘Energy’ are variables that need to be researched, tested and combined in the most optimal and effective way.
The three main chapters, ‘Energy demand of a guest room’, ‘System analysis of a guest room’ and ‘Total hotel building analysis’, each consists of a more specific literature study and a case study analysis through the use of an energy simulation software, to discuss and compare the results under a controlled experimental setup. In the literature study, a review of research and existing practices will be conducted, to establish performance ranges based on available information and considering multiple scenarios.
Beneficial to the literature studies, an aspiration was to organise valuable scientific data in a systematic way not only for the simulating and writing to happen in a coherent way but also to provide an overview of existing research. The different inputs of literature studies gave useful referential guidelines. Nonetheless, most of these studies mainly focus on the general suitability of strategies based on climatic considerations and do not fully explore the potential limits and/or expected performance considering particularities of the building. Beyond that, the energy requirements of a building not only depend on the individual performance of the envelope components (walls, windows and roofs) and HVAC and lighting systems, etc. but also on their overall performance as an integrated system within the unique building. In this sense the simulation assisted case study within each chapter becomes the crucial yardstick for developing qualitative strategies and considering the dynamic and complex interactions between building parameters in every field of climate conscious designing. Simulations will be done by the advanced dynamic modelling program TRNSYS. Dynamic simulations can have great impact on the design process since it will provide detailed information on intrinsic values of certain interventions and on the viability of the whole integrated concept of the building. Sensitivity analyses will therefore be a crucial part in defining best performers on a comfort and energy level. Both local and multivariate sensitivity analyses will be performed.
It is also important to evaluate cost-effective analysis of strategies employed in energy efficient buildings, especially for more developing regions. These regions profit from a focus on passive strategies with relative low initial investments and strategies with short payback periods to promote further development. On the other hand, including a cost analysis with extra parameters such as ROI will reduce the range of initial improvement potential and (too) quickly exclude those more ambitious ideas. Therefore this study will cleverly ignore the financial aspect of the proposed strategies.
In theory there is a level of clarity and rationality in this approach, but it is a simplistic assumption to think that a climate conscious design is just a collection of strategies, rather it is a synthesis of a range of factors that are both within and outside the domain of climate conscious design. It is therefore important to touch on the variety of tangible and intangible parameters and keep somehow the general picture in mind. Instead of going really in depth on one aspect, the study will rather try to set up a framework that addresses the importance of different aspects and in which detailed analysis is possible.
17
INTRODUCTION
Climate
Climate can be defined as the broad meteorological or average weather conditions pertaining to a region typically over a period of 30 years. Additionally it includes statistics such as day-to-day or season variations. The Intergovernmental Panel on Climate Change (IPCC) gives following definition.
“Climate in a narrow sense is usually defined as the ‘average weather,’ or more rigorously, as the statistical description in terms of the mean and variability of relevant quantities over a period ranging from months to thousands or millions of years. The classical period is 30 years, as defined by the World Meteorological Organization (WMO). These quantities are most often surface variables such as temperature, precipitation, and wind. Climate in a wider sense is the state, including a statistical description, of the climate system.” (Glossary. Global Warning of 1.5°C, 2018)
The main, nearly constant, variables that determine a climate are latitude, altitude, terrain and proportion of land to water as well as nearby oceans and/or mountains. However more unpredictable variables are influencing the climate of a place. Therefore the subdivision in two levels of climate need to be made. First, the macroclimate, the global conditions of the region created by the dominant geographical features. Second, these dominant features are modified by local site conditions, the microclimate. In general, this study will focus on countries located around the equator and more specifically Southeast Asia. Vietnam, Singapore, Cambodia, Philippines, Malaysia and Indonesia to name a few. These countries are dominated by hot and humid climates. An important research question can be phrased like this. “How does the (hot humid) climate impact the decisions made on the technically related aspects providing comfort for the occupant? Which macro- and micro-parameters of climate and local conditions influence these design decisions initially and occupant behaviours following?”
MACROCLIMATE
No two locations have exactly the same climate. Nevertheless, macroclimates vary within a limited range and uniformities are discernible over widely separated areas when the set of geographic relationships occurring in one area parallels that of another. In order to classify the macroclimate and simplify climatic similarities and differences to enhance scientific understanding, different climate schemes have been devised. All schemes follow either an empirical approach which uses observed environmental data or a genetic approach which uses the causal elements that give rise to the patterns of macroclimate. Descriptive vs. explanatory. Genetic schemes are more difficult to synthesize, hence empirical schemes will be used.
Lippsmeier classifies 5 main climate zones based on temperature and relative humidity’s. Szokolay defines 4 main climate types largely based on human comfort. The most used climate classification scheme however is that of Wladimir Köppen introduced in 1936, presented in a later version in 1961 by Rudolf Geiger and updated by M.C. Peel in 2007. The Köppen scheme suggests five main climatic zones according to mean annual temperature, precipitation and vegetation types. Type A: Tropical (equatorial), type B: arid, type C: temperate, type D: cold and type E: polar. Type A, meaning the temperature of the coolest month is 18°C or higher, is further differentiated on the amount of precipitation in 3 subclasses. More temperate or colder macroclimates are categorized into more subclasses but fall out of the research domain of this study. The main climate types researched in this study are denoted by the abbreviation Af (no dry season), Am (short dry season, monsoon) and Aw (winter dry season, tropical savannah) in the Köppen-Geiger-Pohl system.
Globally the most common macroclimate class by land area is arid B (30.2%) followed by cold D (24.6%), tropical A (19.0%), temperate C (13.4%) and polar E (12.8%). However the most dominant individual climate type is BWh (hot desert) (14.2%), followed by Aw (tropical savannah) (11.5%) (Peel & Finlayson, 2007). It is undeniable that there is a great demand for an optimal design strategy for climate and energy conscious buildings in these regions. More data can be found in appendix A (Table 80), (Figure 65).
18
Figure 1 – Köppen-Geiger climate classification for southeast Asia (Beck et al., 2018)
The majority of Southeast Asia has a tropical hot and humid macroclimate with a wet and dry season caused by seasonal shift in winds or monsoon. Regions nearer to the equator experience little seasonal change and stable temperatures. This is the classic situation in hot humid climates where higher temperature air can hold more moisture or evaporative heat, thus increasing the amount of energy and heat exchange needed in order to enable temperature change. The seasonal change of this macroclimate will not change from hot to cold but more from humid to relatively dry which imposes big challenges on building design.
Regions near the equator have the highest angle of incidence of the sun, which controls the amount of solar radiation and therefore the temperature of the atmosphere at a particular point. These regions are in a heat surplus for most time of the year. Due to the both immense sensible and latent heat, this climate is one of the most challenging in adjusting oneself to acceptable comfort levels and achieving indoor environmental comfort. However warm climates have a potential far beyond that found in more temperate and cool climates. Unlike cool climates where the sense of exposure requires a defensive strategy, warm climates even though the sometimes harsh conditions can adopt a more responsive active strategy.
MICROCLIMATE
The design and application of strategies derived from the global climatic parameters of macroclimate sound straightforward but in reality the climate variables which one has to take into account are numerous and the interactions are complex. This is a result of the microclimate of a place, which typically occur at scales of less than 1 km, inducing more variables. A second, crucial point of departure is therefore the site and building context. A site has different characteristics and building design often starts with planning for an optimal orientation. The avoidance of heat gain can be effected at the site level through shading from the landscape. The heating pattern is also affected by the proximity of oceans which produces higher rainfall and smaller diurnal ranges in temperature than land mass dominated areas. Wind flow, lighting effects such as reflection and absorption, acoustic levels and air pollution, pedestrian and vehicular circulation, topography, density of vegetation coverage, rain exposure and water run-off are all variables that could affect the microclimate. Due to the extreme range of possibilities and also due to the rather small impact of these variables, the microclimate will most of the time be omitted in this study. Nevertheless, in every project the need for careful analysis of the site is required to determine the modification to the macroclimatic conditions and to design a more specific and climate conscious building.
19 In urban context however the vertical scale of the environment and the extent of the horizontal area of the city affects temperature, humidity, wind and solar radiation and often creates its own microclimate significantly deviating from the macroclimate. This phenomenon is known as the ‘Urban heat island effect’ (UHI) or urban canyons and canopies. In dense cities, there is a nocturnal elevation in temperature and the difference in average annual temperature compared to rural areas ranges from 3 to 5°C and is expected to rise 1°C per decade. This increases the heat loads of buildings in these areas.
INDOOR CLIMATE
Due to urbanisation, westernization, growth in GDP and wealth, the liveability of cities and the increased use of air-conditioning, the expectation of a perfectly controlled temperate climate within the building has anchored itself in the building industry. The recent use of equipment in buildings to modify indoor climate has led to the problem of man-made climate, which can replicated around the world, hence it is universal. The universal aspect of the man-made climate is sometimes a lost opportunity for climate conscious and responsive architecture. The universal indoor climate separates the visitors from the place they have come to experience, defeating the purpose of a building. Buildings have been produced to override, rather than complement, nature.
The pragmatic and physical parameters associated with this indoor environmental control are regulated by the laws of science, in particular the laws of thermodynamics. Sometimes these pragmatics are hindered by a desire to respond to the poetic aspects of climate. Some architects seek to use the building as an implement, not just to override the climate, but to enhance and expose our senses to the spectrum of thermal and visual delight (Hyde, 2000). Therefore we need to see these parameters not as physical constraints or as fixed axioms, but as a challenge and use them to establish contrast in the building. Research has shown that visitor’s expectations on indoor climate may be very different than the assumption of the universal climate as the optimum in every region of the world. It is also found that a variation of air temperature and indoor climate is healthier than one daily or seasonal fixed value. This positive thermal alliesthesia brings us to the specific fields of thermal (adaptive) comfort.
Hotel
Tourism has claimed a substantial part in society and outpaced many other economic sectors. The phenomenal growth of tourism can be explained by a number of factors. The renaissance, established by commercial, cultural and educational interests and widening trade, led to a persistent growth in tourism. The political, social and economic implications of the industrial revolution gave a further impetus. This increase has been drastically accelerated by advancement in transport, world financial and political stability, a better availability of information about the cultural property and the nature of the travel location, and the digitalizing world in general.
Due to the high carbon intensity and continuing growth, tourism will constitute a growing part of the world’s greenhouse gas emissions. Today more than 8% of global greenhouse gas emissions is by virtue of tourism (Lenzen et al., 2018). Besides energy draining and large CO2 consuming activities like transport, shopping and food, the hotel industry’s resource management (energy and water) could contribute to the long-term sustainability of the tourism sector.
Tourism captures an immense variety of persons. To examine each of their requirements it is necessary to form them into categories. The main categories of tourism are: ‘cultural’ tourism; ‘business’ tourism; ‘geographical’ tourism and ‘visiting family and friends’ tourism.
HOTEL TYPOLOGY
Hence many types of hotels exist; luxury, middle grade, town or country, resort, business, leisure, sports, transit or travel orientated (air, sea, road), only bed and breakfast or with full facilities. Even with these groups, to which a good many others can be added, each hotel has its individual character and it is highly unlikely that it could be repeated exactly in any other location, and if it was to be repeated, it would not be fully subjected to the (micro)climate conditions and not lead to the most energy efficient way (Principles of Hotel Design, 1970).
20
Besides the local climate, it is of utmost importance that hotels know their target audience or their most prevailing type of tourism. It is only then a hotel can decide which strategies it can follow concerning the provision of adequate comfort, the improvement in energy efficiency, the decrease in climate impact and their investment opportunities. The type of hotel this study will focus on is a business oriented hotel with extra activities and services to provide a reasonable amount of cultural tourism. Nevertheless, it must be said that hotels conform to certain design patterns , because of the basic similarity of some of their functions and activities inside. In this sense learning from other hotels, not necessarily the same type or microclimate, by looking at usage patterns, the distribution of energy flows, waste management, their operation of renewable energy sources but even so their marketing and awareness-raising strategies are not fruitless.
Comfort
The assessment of indoor living comfort or the ‘indoor environmental quality’ in general is based on multiple variables that influence how indoor environment is perceived by individuals. IEQ, from the engineering point of view, can be achieved with adequate thermal comfort, indoor air quality, visual comfort, quality of natural and artificial lighting and acoustic comfort. This section will briefly describe some general aspects and peculiarities of thermal comfort and indoor air quality. The equatorial climates are considered one of the most challenging conditions in achieving indoor thermal comfort and air quality because both sensible and latent heat are immense.
Following European standard, EN 15251, newly designed hotel buildings should at least provide an indoor environmental quality of category II (normal level of expectation) and aim for category I (high level of expectation) due to the occupation of sometimes fragile and sensitive persons with special requirements (EN 15251, 2006). The standard EN ISO 7730 categories indoor environment quality in classes A, B and C.
Table 1 – Indoor environmental quality categories
THERMAL COMFORT
The American Society of Heating, Refrigerating and Air Conditioning Engineers (ASHRAE) determines thermal comfort as “that state of mind which expresses satisfaction with the thermal environment” (ASHRAE Standard 55-2004. Thermal Environmental Conditions for Human Occupancy, 2004). This satisfaction with the thermal environment for everyone in a space is challenging due to the large variations, from person to person, both physiologically and psychologically. Our body converts a certain portion of the supplied energy into mechanical work and internal heat and transfers the surplus of energy back to the surroundings using all available sensible and latent heat transfer mechanisms in order to come into a state of equilibrium with his surroundings. These mechanisms and thus comfort levels are strictly personal.
However conditions that a specified range of people find thermally acceptable and comfortable can be defined. Through extensive laboratory research many studies concluded acceptable thermal conditions from linear regressive models with 80% acceptability. The most well-known method to define overall thermal comfort was established by P.O. Fanger, in the form of the so-called predicted mean vote (PMV) and predicted percentage dissatisfied (PPD). Using heat-balance equations he combined effects of different personal and environmental parameters. Six parameters, that determined the main heat gains and losses, were used. Air temperature (°C),
21 mean radiant temperature of interior surfaces (°C), air velocity (m/s) and relative humidity (%) representing the physical conditions and metabolic rate (Met) and clothing insulation (clo) describing the personal conditions. The pattern of testing people and measuring comfort temperatures through surveys was laid down by Thomas Bedford who built a seven-category ranked scale known as the ‘Bedford Scale’. This was the first time multivariate statistical analysis from measurements of people and environment was done. Fanger in his PMV/PPD model later refined the scale of thermal comfort conditions between cold (mark −3) and hot (mark +3) to extrapolate a neutral temperature. Thermal neutrality is found when the indoor operative temperature (combining the effects of air temperature and mean radiant temperature) coincides with the group’s mean thermal sensation of “neutral” (value = 0) on the 7-point comfort scale.It is worth saying that Fanger did not notice any significant difference in types of people concerning their climatic background, for example hot humid. The predicted mean vote (PMV) and the predicted percentage of dissatisfaction (PPD) are widely used as the international thermal comfort standard ISO 7730 for HVAC building design. The European standard, EN 15251, assigns categories to ranges of PMV and PPD. Again category II (-0,5 < PMV < 0,5) should be the minimal aim for newly designed hotels.
Table 2 – PMV/PPD IEQ categories.
Figure 2 – PMV/PPD thermal comfort categories
ADAPTIVE COMFORT
Previous standards indicate that in conventional air-conditioning design the comfortable range of temperature is to be set at 24.5–26.5 °C and relative humidity levels as 40–60%. However, in several field studies in equatorial climates it became apparent that these comfort ranges do not fully comply with observed thermal comfort requirements. In general it can be said that the international standard for indoor climate, ISO 7730 based on Fanger’s predicted mean vote (PMV/PPD) equations, does not adequately describe comfortable conditions (F. Nicol, 2004).
First of all, the international standard is based on theoretical analyses of human heat exchange with the environment calibrated using the results from experiments in special climate-controlled laboratories, which differ significantly from experiments in real-life situations. Additionally these standards use steady state models instead of dynamic models. Time is an important factor in thermal comfort which any prediction must take in to account. Short-term changes which may be a minor source of error in itself are not adequately looked at in these steady-state models and taken together they can create significant errors.
Studies from for example Sharma & Ali (1986), Busch (1992) and R. de Dear & Brager (1998) which related observed thermal sensation in situations they normally experience on the ASHRAE/Bedford scale to the physical environment, found that conditions in which the subjects were comfortable (TSV = 0) differed from the predictions of ISO 7730. Depending on the exact climate, field studies have found that subjects can be comfortable at temperatures up to or even exceeding 30°C especially if the building is naturally ventilated or
22
they are using a fan. It is widely accepted that the neutral temperature in naturally ventilated buildings is higher than that in the air-conditioned buildings and are strongly related to the corresponding mean outdoor temperatures.However Humphreys & Fergus Nicol (2002)demonstrated that the errors in ISO 7730 are not only confined to NV buildings but also occur in AC buildings.
These result, stating that thermal neutrality was higher than that based on previous standards, triggered further revision of existing models and development of new adaptive models. Most adaptive model equations include steeper slopes than regular models or standards which implies that people living in these hot humid climates adapt to a wider range of indoor operative temperatures relative to the same magnitude of outdoor air temperature increases than those living in more neutral climates (Toe & Kubota, 2013). People in equatorial climates can feel ‘neutral’ in higher temperatures.
In different field researches, both in a residential and work environment, it was also observed that the subjects who reported “neutral” as thermal sensation vote, the percentage of “very comfortable” or “comfortable” as comfort sensation vote was often lower than the percentage of these latter comfort sensation in the situation where subjects reported ‘cool’ as TSV. In the same way subjects who reported “cold” as TSV, the percentage of respondents who reported “less comfortable” and “uncomfortable” was low. This shows that people do not have a negative impression of “cold” and most of the time prefer cooler conditions rather than the ‘neutral’ condition extrapolated from the research (Kubota et al., 2018). Also in the study of Kitagawa et al. (1999) it was found that the most comfortable vote has been obtained not in neutral thermal sensation but in thermal sensation situated between neutral and slightly cool.
The conclusion that people still prefer a cooler environment even though there is often a higher acceptable temperature and higher tolerance than expected, leads us to the relation of thermal preference and thermal sensation. Preferred temperature is defined as the indoor operative temperature coinciding with equal numbers of preference votes for “warmer” and “cooler” temperatures (Cândido et al., 2011). The field study of R. J. de Dear et al. (1991) in Singapore concluded a neutral temperature of 28.5°C, while whereas subjects could choose their own temperature, the value of 25,4°C was found. We can explain this difference as the difference between active and passive comfort. Active comfort, a vibrant condition and a desire for development, passive comfort, a physiologically easy condition and a desire for deficiency. This raises the question of the correct applicability of TSV, CSV and PSV in a certain situation.
Thermal comfort was linked to the available means of thermal adaptation by Baker N. and Standeven M. They called it the ‘adaptive opportunity’. This encompasses possibilities of opening windows, having input in set point temperatures and lowering blinds on a building level, but also changing clothes, taking a shower and spatial reorganisation of oneself. People who have control over their environment are more tolerant of it. The opposite of this so called forgiveness factor or a lack of adaptive opportunity can give rise to discomfort. We can distinguish three groups of adaptive behaviour. Regulating the rate of internal heat generation (change activity), regulating the rate of the body’s physiological condition and heat loss (change clothing, sweating) and regulating the thermal environment (open a window, turning on fans but also moving to another room). Besides the physiological and behavioural adaptation, psychological adaptations, for example a lower comfort expectation and higher tolerance of a climate conscious hotel that lives in sympathy with the natural rhythms of the outdoors, are also probable but are not yet fully understood.
“Thermal comfort must be seen as a self-regulating system, incorporating not only the heat exchange between the person and the environment but also the physiological, behavioural and psychological responses of the person and the control opportunities afforded by the design and construction of the building (J. F. Nicol & Humphreys, 1973).”
However the behaviour of international hotel guests has often been seen as a problem by HVAC engineers and building simulators. International guests are less forgivable and their actions to ensure their comfort can often appear random. Because the guests themselves can make or break any strategy for ensuring comfort and can drastically change the amount of energy used, it is crucial that they know when and how they can influence the
23 operation of systems and strategies. The designer, engineer or building simulator must also ensure that controls do not conflict with each other.
Humidity control and air velocity, two parameters less prevailing in general standards, will also play an important role in the proper functioning of strategies later on. Previous studies concluded minor influence of air humidity on thermal comfort. However in climates with higher temperatures, high humidity will reduce the range of temperatures which guests find comfortable and lead to other types of discomfort, such as increased sweating. The need for surfaces of both people and buildings to breathe and take advantage of air movement is particularly important in this climate as movement of the air impacts convective heat losses and water evaporation. Traditionally, air speed has been framed in terms of maximum permissible limits. We will later on see that airspeeds should become a real variable and that the inverse way of thinking by defining minimum air speeds is sometimes more valuable.
All of the above teaches us not only to be very cautious with exact values of thermal comfort due to the range and intrinsic fluctuations of the criteria but also the flexibility one has to change comfort levels and impact the building in perspective of energy efficiency. In later research thermal comfort will be a variable on the applicability and energy efficiency of systems.
IAQ
Indoor air quality is next to thermal comfort recognized as a central comfort parameter in obtaining an excellent indoor environmental quality. It does not need to be elucidated that ‘sick building syndrome’ (SBS) is a real phenomenon, creating health problems, problems with concentration, irritation of throat and nausea. It is of utmost importance that guests can stay in a high air quality building even though the sometimes short period of visit.
A good indicator of perceived indoor air quality along with the amount of human presence is the concentration of CO2, defined in ppm as volumetric unit. IAQ categories can be arranged by the difference in concentrations of C02 in indoor and outdoor air. In this way minimum air flow rates can be set up. The air flow rate can also be designed regarding to the bio effluents emitted by persons and emissions from building (building materials and appliances). The correct design of ventilation and infiltration rates in terms of comfort and energy efficiency will be discussed in following chapters.
Table 3 – IAQ categories with corresponding CO2 above outdoors in PPM Table 4 – IAQ categories with airflow per person
Energy
Energy demand in the ASEAN (Association of Southeast Asian Nations) member countries has increased by around 260% between the 1980’s and the 2010’s, while the world’s energy demand has only increased by 56% in the same period. The growing economy is a major accomplice to energy increase. Generally, a 1000 euro increase in GDP per capita results in a 30 to 40 kWh electricity increase, except for Vietnam which has a high accessibility to electricity. However the energy resource profiles and the use of energy for different fields are not uniform through the ASEAN countries. In Singapore electricity is the main energy resource, ditto for Vietnam. In more developing or low-income countries other (bio)fuels are also important.
24
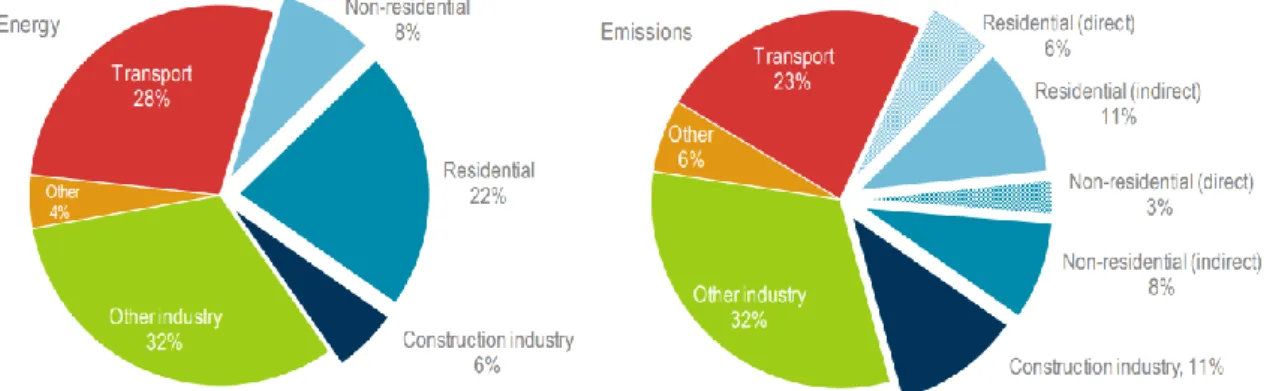
The building sector is an essential economic sector, representing more than 10% of global economy. But more importantly building construction, operations and everything related presents the highest energy demand compared to any other sector and is responsible for approximately 36% of global final energy use and nearly 40% of energy‐related carbon dioxide (CO2) emissions in 2017 (Global Status Report 2018, 2018).
Figure 3 - Global share of buildings and construction final energy use and CO2 emissions, 2017. (Global Status Report 2018, 2018)
ENERGY PROFILES SPACE COOLING Because of the increasing standards of life, the universalization of modern international style architecture, the economic growth and the affordability of air conditioning, the energy needs for cooling have increased in a rather dramatic way (ANTINUCCI et al., 1992). “Space cooling and appliances and other plug loads are the fastest growing building end uses; however, only space cooling has grown in energy intensity per unit floor area (Global Status Report 2018, 2018)”. Space cooling was responsible for nearly 8.5% of total final electricity consumption in the world and roughly 15% of peak electricity demand in 2019 (Cooling, Tracking Report 2020, 2020) (Industry as a Partner for Sustainable Development - Refrigeration, 2002).
The serious penetration of air conditioning in residential and hotel context, where operating hours are extensive, impacts the absolute energy consumption of buildings greatly and is a major concern for energy security as well as for urban and global warming. While high performing AC units are available, average efficiencies of air conditioners have only increased around 15% globally since 2010 available (Cooling, Tracking Report 2020, 2020). Instead of increasing market penetrability of more efficient AC units, it is preferred to research and develop alternative cooling systems that have the potential to be much more energy efficient in the long run.
URBANISATION Most of the international higher star hotels are situated in cities. Cities in itself consume a great majority (around two thirds) of energy production worldwide and are major contributors to greenhouse gas emissions (GHG). Besides the direct relationship between economic growth, energy consumption and CO2 emissions, studies indicated an even stronger impact of urbanisation, population density and city operation on energy consumption. While socio-economic conditions of some countries in southeast Asia differ greatly, most of them experience or experienced similar rapid urbanization.
The Population Division of the Department of Economic and Social Affairs of the United Nations has been issuing estimates and projections of the urban and rural populations of all countries in the world (2018 Revision of World Urbanization Prospects, 2018). The percentage of population residing in urban areas in the southeast Asian region in 2020 is 50,0% compared to a global percentage of 56,2% (half of human population on less than 2% of the earth's surface). However, between 1970-2020 the average annual rate of change of the percentage urban in southeast Asia was double the amount compared to world statistics and more than six times the rate of change in Europe. Today the percentage of the annual rate of change of the urban population in the southeast Asian region is still high (2,21%).
25 However cities are not to be blamed. Urban form, layout and the way buildings are built is what count. Compact or dense cities are more resource efficient than sprawl development. It is not urbanisation, but rather inefficient spatial organization, the way people commute, how they use energy and the amount of wasteful energy sources that badly contribute to energy consumption and GHG emissions. Denser cities with limited green areas and higher buildings with low albedo materials enhance the ‘urban heat island’ effect and increase (peak) energy consumption for air conditioning. It worsens air quality, decreases efficiency of air conditioners and generally increases the ecological footprint of cities and buildings.
Urban areas account for 80% of economic output, consume between 60% and 80% of energy, and emit approximately 75% of GHG. As the population of these cities continue to grow, more buildings will be constructed and the energy demand for cooling and air conditioning will continue to rise, making these areas key to tackling climate crises (Kamal-Chaoui & Robert, 2009). Obviously this is just the tip of the iceberg, and even though this is not the focal point of this study, hotels as a somewhat prominent infrastructure in the urban landscape can provide many opportunities to demonstrate a city's pledge to sustainability. While urban authorities make decisions and set up building energy codes that determine the built environment, hotels can and must improve their own sustainability label, not only increasing their own energy and operation efficiency but ensuring cross-pollination in the whole sector.
POLICIES Building energy codes or standards, set out by a jurisdiction, focus on reducing the energy used for a specific building end use. Greater adoption and improvement in building energy codes are necessary to continue to improve energy performance for new hotels. Building certification programs on the other hand can be voluntary or mandatory and focus on different parts of (energy) performance of a building. As shown in (Figure 4) in southeast Asia building energy codes are mandatory only for part of the sector in major cities and building energy certifications are still primarily voluntary. LOTUS is a holistic green building certification system for Vietnamese construction practices to evaluate if a building is a ‘green’ or not. It benchmarks building performance and encourages integrated building design and construction. The International Finance Corporation (IFC) also launched its green building certification program EDGE in Vietnam in 2015. In the case of Malaysia where building codes and standards for green building are not mandatory, the green building index (GBI) was developed and used as a rating tool. Next to energy efficiency it takes sustainable building planning, use of recycled materials and green technologies into consideration.
26
TRIAS ENERGETICA So how do we tackle this wicked problem? Energy conscious opportunities are possible in all phases, from building planning and design to construction and maintenance. This study will focus on building planning and design. The principle of 'trias energetica', a three-step strategy, serves as the basis for creating a hierarchy in the design measures that increase the energy efficiency of a building, its sustainability label and his climate awareness.
The first measure is trying to reduce the energy consumption of the building by simply limiting the need for energy. Building physics and corresponding parameters are examined. Building orientation, compactness, use of sunscreens and use of low g-value window glass are some of the passive measures to reduce solar heat gain and thus energy demand for cooling. Although incorporating vernacular elements in an international hotel context is not straightforward, it is worth knowing how local people use passive measures and cope with such a tough hot humid climate. The second measure is to use renewable energy sources (RES). From a certain point on, it becomes more attractive to go for additional renewable energy sources than to further limit energy demand. Solar, wind and water energy can be used. It is important to design a site specific, reliable and interesting combination of different RES to increase energy efficiency and self-dependence. “Successful architecture never takes an inflexible approach to energy efficiency or any other design element” (Wright et al., 1982).
The third and last measure is the optimisation and energy conservation of the finite energy sources that inevitably have to be used. Energy conservation can be defined as the strategy of adjusting energy using systems to ensure IEQ with the lowest possible use of energy per unit of output without affecting or causing disruption in life styles (de Winter & Cox, 1978). A hotel with high energy efficiency is more competitive and is able to attract more guests. Cooling with a high-temperature water regime, heat recovery during ventilation, installing energy-efficient LED’s are among the possibilities. Rated performance of systems often do not reflect operational energy consumption. Operation at partial load and the efficiency of the distribution system need to be considered as well.
The ‘trias energetica’ gives a rough indication on how the study is set up. Chapter 1: lowering energy demand, Chapter 2: optimizing energy efficiency of active systems and Chapter 3: exploring RES possibilities in a total hotel complex. Reducing operational costs and emissions will therefore be more important in this study, rather than reducing upfront capital costs.