Outstanding environmental issues. A review of the EU's environmental agenda
59
0
0
Hele tekst
(2)
(3) Outstanding Environmental Issues A review of the EU's environmental agenda. Netherlands Environmental Assessment Agency at RIVM in cooperation with the European Environment Agency. National Institute for Public Health and the Environment.
(4) Design and lay-out: Studio RIVM Photo credits:. Front cover: European Space Agency; p. 17: D.J. Gjeltema, p. 25, 35, 42: PhotoAlto; p. 50: ANP.. Printing:. Wilco bv, Amersfoort. ISBN 90-6960-117-6 NUR 940. @ RIVM, Bilthoven, The Netherlands, September 2004 All rights reserved. No part of this publication may be reproduced, stored in a retrieval system, or transmitted, in any form or by any means, electronic, mechanical, photocopying, recording, or otherwise, without the prior written permission of RIVM.. 2.
(5) Outstanding Environmental Issues. Contents. Preface 5 Main findings 7 1. The quality of growth 9. 2. Climate change and energy 13. 2.1 Trends and targets 13 2.2 Energy and industry 16 2.3 Transport 18 2.4 Renewable energy 19 2.5 Policy challenges and opportunities 20 3. Materials and waste 23. 4. Nature and biodiversity 27. 4.1 Trends and targets 27 4.2 Fishery 30 4.3 Forestry 32 4.4 Agriculture 36 4.5 Policy challenges and opportunities 39 5. Human health and environment 41. 5.1 Trends and targets 41 5.2 Transport 44 5.3 The chemical industry 46 5.4 Policy challenges and opportunities 47 6. The EU’s citizens and the global environment 49. 7. References 53. 3.
(6)
(7) Outstanding Environmental Issues. Preface. Recently the Dutch Ministry of Housing, Spatial Planning and the Environment requested the Netherlands Environmental Assessment Agency at the RIVM to evaluate the European Union’s environmental track record, and to analyse the remaining unresolved environmental problems. The purpose of this assessment was to support the Dutch presidency of the EU scheduled during the second half of 2004. We have responded to the Ministry’s request by carrying out, in co-operation with the European Environment Agency, an analysis of the main facets of the EU’s 6th Environmental Action Programme, whose results are presented in this report. During the preparatory phase we received valuable comments from the European Commission, Member States and the European Topic Centres on Nature Protection and Biodiversity and on Air and Climate Change. Our main findings are that EU policy has successfully reduced a number of pressures on the environment and led to economic investments that have benefited the health of people and ecosystems. But there are still considerable pressures on the European environment, with climate change, loss of biodiversity and air pollution in urban areas as the major issues. If natural resources are to be preserved, they should be given a clear economic value – something requiring the involvement of EU policy-makers, who are best placed to take cost-effective action. Currently, the most important issue is the extent to which the environmental part of the EU’s ‘Lisbon strategy’ supports or threatens the economic and social aspects of this strategy. Although it is not easy to answer this explicitly, our analysis clearly shows that, rather than hampering economic development, European environmental policy to date has steered economic growth in a direction that is both clean and competitive. We hope this document will prove to be a source of inspiration for the EU Environment Council, and the new European Commission and Parliament. The report can be downloaded from the RIVM website www.rivm.nl.. Professor Klaas van Egmond Director of the Netherlands Environmental Assessment Agency. 5.
(8)
(9) Main findings. Main findings. 1 EU policy has successfully reduced a number of pressures on the environment. It has also triggered investments in the economy that have benefited the health of people and ecosystems. If all existing policies are properly implemented and enforced by member states, certain pressures will be further reduced. However, future policies should focus particularly on three environmental issues that have not yet been resolved satisfactorily: climate change, loss of biodiversity and air pollution in urban areas. 2 Although greenhouse gas emissions in the EU-25 are now several percent below 1990 levels, a further substantial reduction is needed to slow global warming. Great potential for CO2 reduction is provided by large ongoing investments in Europe’s energy, industry and transport sectors. To exploit this potential, the prospects for a large and stable market for low-CO2 technology will need to be improved, including the use of economic incentives. Such prospects can be provided by mutual agreement on long-term emission targets, or otherwise on targeted parts of the energy system. 3 Because biodiversity continues to decline, it is essential to preserve this crucial natural resource. Alongside the claim on land use that this will entail, we expect to see increases in food consumption, energy-crop production, infrastructure and built-up areas, and also in the need to adapt to climate change. Remarkably, we do not yet know whether there is sufficient land – either within or outside the EU – to meet these needs. A study on the long-term sustainability of future claims on land use, both within and outside the EU, would clarify whether the different policies that put a claim on land use are in balance and might constitute a first step towards the further integration of policy on land use into EU sectoral policies. 4 The eco-efficiency of the material-waste chain in the EU has been improved by more energy-efficient production of materials, increased recycling and improved waste treatment. To further enhance this trend, the EU and national governments should highlight the associated ecological and economic impacts (materials and waste are directly responsible for 25 % of greenhouse gas emissions), so that consumers are more motivated to reduce waste and policy-makers can increase economic incentives for saving resources in industry.. 7.
(10) Outstanding Environmental Issues. 5 Nitrogen pollution caused by livestock farming and excess use of nutrients in crop management is gradually diminishing. As a consequence of reform of the Common Agricultural Policy (CAP), the conditions that allow farmers to operate within ecological constraints have further improved. We recommend that the effectiveness of CAP reforms at the Member State level should be carefully monitored. This is not only because the full implementation of these reforms is a crucial step towards meeting the targets of various directives and policies relating to agriculture and the environment, but also because preserving farmlands with a high nature value and biodiversity requires more and better-targeted funding. The latter issue can be usefully addressed in the 2004 review of the Rural Development Regulation of the CAP. 6 In Western Europe, EU environmental policy has resulted in a relatively clean and healthy environment. Nevertheless, between two and eight percent of the total burden of disease in the EU-25 can still be attributed to environmental factors (this figure varies nationally and even regionally). Major contributors to these risks are poor urban air quality – mainly due to high concentrations of fine particles and ozone – and noise nuisance. Transport is a major source of each. To achieve a healthier environment for all Europeans in a cost-effective way – an important EU objective – emission and noise standards in the transport sector should be further tightened. 7 Finally, because successful policies to date have been based mainly on regulation, the thematic strategies in the EU’s Sixth Environmental Action Programme are almost certain to give rise to new regulations. For several reasons, it is recommended that these regulations should have a greater focus on target-setting and market-based instruments. Not only will this improve the efficiency of policies (bringing higher benefits at lower cost), it will also ensure that environmental concerns are further integrated into economic decision-making. Such regulations should also lead to ecoefficient innovations, demonstrating to industry that environmental measures and European competitiveness can go hand in hand.. 8.
(11) 1 The quality of growth. 1. The quality of growth. Environmental policy has improved the quality of growth in the EU In recent decades environmental policy in the EU has reduced a number of pressures on the environment, leading to economic growth that is more sustainable ecologically.. The Lisbon strategy In the Lisbon (2000) and Gothenburg (2001) Council meetings, EU leaders expressed the EU’s ambition to become the most dynamic and competitive region in the world with sustainable economic growth, more and better jobs, greater social cohesion and increased environmental protection. Figure 1.1 shows that a number of EU countries have succeeded in simultaneously achieving high levels of labour productivity, greater social cohesion and an eco-efficient economy, as indicated by the positive relationship between decreasing greenhouse gas intensity and increasing labour productivity (left), decreasing income inequality with increasing labour productivity (middle) and decreasing greenhouse gas intensity with decreasing inequality (right). This suggests that a variety of socio-economic and environmental objectives can go hand in hand.. Figure 1.1 Empirical relationships between economic, social and environmental performance in. 1,2. Profit versus planet. Profit versus people. GHG emissions per unit GDP. Inequality. 7. 1,0. is defined as the ratio. 0,8. distribution in each Mem-. 0,8. 0,6. 0,6 4. 0,4. 0,4 3. 0,2. 0,2. ber State (sources: Eurostat, 2004; EEA, 2003).. GHG emissions per unit GDP. 1,0. 5. between the upper and lower 20% of the income. 1,2. 6. the EU-15 Member States in 2001. Income inequality. People versus planet. 2 0,0. 0,0 50. 75. 100. 125. 150. Labour productivity per hour. 50. 75. 100. 125. 150. Labour productivity per hour. 2. 3. 4. 5. 6. 7. Inequality. 9.
(12) Outstanding Environmental Issues. Eco-efficiency versus absolute decoupling Whereas economic growth is becoming more eco-efficient, as, for example, measured by environmental pressure per unit of GDP, the absolute pressure on the environment (e.g. from emissions of CO2 ) is likely to increase or remain at a high level (Figure 1.2). Environmental policy in the EU has been the main driver for an absolute decrease in a number of pressures on the environment (e.g. from NOx and SO2 ). This reduced pressure is the result of much improved air, water and waste treatment. The costs of applying these techniques amount to some 1.5–2 % of GDP in Western European countries (OECD, 2003). Yet, on a macro level, these costs are more than compensated by benefits to human health and improvements in ecosystems due to investments in technology and employment. Figure 1.2: Economic Emissions and GPD trend, EU-25. growth expressed as Gross Domestic Product. Index (1950 = 100) 600. GDP. (GDP) and pressures on. Carbon dioxide Nitrogen oxides. the environment from emissions in the EU-25,. Sulphur dioxide. 400. 1900-2020. (Sources: EEA, 2003; EMEP, 2004; EC 2003a; Eurostat, 2004;. 200. IIASA, 2004; Klein Goldewijk, 2001; Olivier et al., 2001 and RIVM, 2004.). 0 1900. 1920. 1940. 1960. 1980. 2000. 2020. The ‘Europeanisation’ of environmental policy in the Member States European environmental policy goes back over 30 years. Today, around four fifths of environmental policies in Member States are derived from EU regulations and directives (Figure 1.3). Regulation has been the prime instrument of EU environmental policy, leading to cleaner production, cleaner cars, improved recycling and increasing use of renewable energy. The open borders within the EU make the European character of environmental policy both logical and cost-effective.. 10.
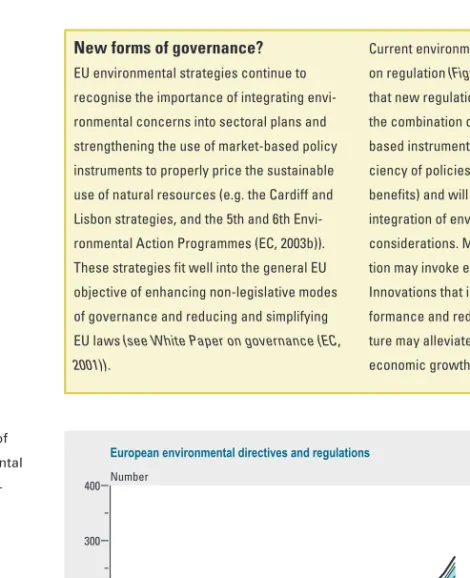
(13) 1 The quality of growth. New forms of governance?. Current environmental governance focuses. EU environmental strategies continue to. on regulation (Figure 1.3). Recommended is. recognise the importance of integrating envi-. that new regulations should focus more on. ronmental concerns into sectoral plans and. the combination of target-setting and market-. strengthening the use of market-based policy. based instruments. This will improve the effi-. instruments to properly price the sustainable. ciency of policies (lower costs and higher. use of natural resources (e.g. the Cardiff and. benefits) and will also further enhance the. Lisbon strategies, and the 5th and 6th Envi-. integration of environmental and economic. ronmental Action Programmes (EC, 2003b)).. considerations. Moreover, this type of regula-. These strategies fit well into the general EU. tion may invoke eco-efficient innovations.. objective of enhancing non-legislative modes. Innovations that improve environmental per-. of governance and reducing and simplifying. formance and reduce environmental expendi-. EU laws (see White Paper on governance (EC,. ture may alleviate current concerns about. 2001)).. economic growth and competitiveness.. Figure 1.3: Number of European environmental directives and regulations. European environmental directives and regula-. 400. Number Nature. tions, 1970-2002.. Agriculture Energy. 300. Noise Water Waste. 200. Toxic substances Clean air. 100. 0 1970. 1975. 1980. 1985. 1990. 1995. 2000. 2005. 11.
(14)
(15) 2 Climate change and energy. 2. Climate change and energy. Investments in low-CO2 technology require improved market prospects Europe’s climate is changing more rapidly than the global average. The number of extreme weather and climate-related disasters has increased in recent decades and it is projected to rise further. Greenhouse gas emissions in the EU25 are currently 6 % below 1990 levels. This is largely due to major economic reforms in the new Member States and improved CO2-efficiency in the industrial and energy sectors. Transport is a sector with particularly fast growing CO2 emissions. Environmental policies have so far focused on renewable energy, reduction of non-CO2 greenhouse gases and energy savings. Without these policies, emissions in the EU-15 would have been some 5 % above current levels. To slow down global warming, a further substantial reduction in emissions is needed over the next few decades. A growing economy will increase demand for energy and trigger substantial investments in the energy, industry and transport sectors. In order to restrict global warming to a rise of 2 °C (the EU target), these investments must contribute to reducing CO2 emissions. To achieve this, the prospects for of a large and stable market for low-CO2 technology needs to be improved. European and international agreements on longterm emission targets – or otherwise on specific parts of the energy system – offer such prospects.. 2.1 Trends and targets There is increasing evidence both that most of current global warming is human-induced and it is having widespread impacts (IPCC, 2001a; EEA, 2004a). Europe is warming up faster than the global average and the number of extreme weather events and climate-related disasters such as floods, storms, droughts and heat waves has increased. Economic losses from such events have more than doubled over the past two decades to around € 9 billion per year in Europe today (EEA, 2004a). Other impacts include a retreat of glaciers in eight out of nine glacial regions in Europe, a reduction in species richness and rising sea levels. However, some parts of Northern Europe might benefit from a limited temperature rise. Projections show an. 13.
(16) Outstanding Environmental Issues. Costs of greenhouse gas reduction no different from those of other environmental measures. reinforcing benefits through simultaneous. The costs of greenhouse gas emission reduc-. estimated at between 20 % and 50 % of total. tions for Europe are estimated to be in the. climate control costs (Criqui et al., 2003).. order of 0.2–0.5 % of GDP in 2025, mainly. Such reduction costs are comparable to, or. depending on assumed economic growth. even lower than, those made for the success-. inside and outside the EU, the international. ful abatement of air, water and waste pollu-. emissions trading regime and technological. tion.. reductions of air pollutants could be substantial; financial savings for the Kyoto period are. developments (Criqui et al., 2003). Mutually. ongoing increase in global warming and its related effects in the future (EEA, 2004a). The EU has set a long-term target to restrict global temperature increases to a maximum of 2 °C compared to pre-industrial levels. This will require major changes in greenhouse gas emissions worldwide. While global emission scenarios allow an initial increase in emissions, rapid growth in developing countries will require earlier – and immediate – action from industrialised countries, such that EU-25 emissions in 2025 are some 25–40 % below 1990 levels (Criqui et al., 2003). For the period up to 2025, domestic energy savings and emissions trading with non-EU-25 countries could contribute the lion's share of such reductions (Figure 2.1). Clearly, the current target for reducing emissions – under the Kyoto Protocol – represents only an initial limited step towards achieving the longer-term target. Figure 2.1: An emission baseline scenario for Europe (upper curve) and a mitigation scenario limiting global warming to 2°C by the end of the 21st. A CO2 mitigation scenario for Europe 6000. Mton CO2 emission Reduction due to:. century (lowest curve). An. Baseline scenario. Sinks. assumed burden-sharing scheme should lead to. Fuel switch Biomass. 4000. Solar/wind/nuclear. equal emissions per capi-. Options are modelled on. Carbon capture. Mitigation scenario. ta in 2050 worldwide.. Energy savings Emissions trading. 2000. the basis of reduction potentials and estimated developments in costs. (Based on Van Vuuren et al., 2003.). 14. 0 1990. 2000. 2010. 2020. 2030.
(17) 2 Climate change and energy. Policy and its impact The Kyoto protocol is a major driver of EU climate policy. A number of recent EU directives support climate policy, e.g. directives on CO2 emissions trading, energy taxation, promotion of renewable energy, biofuels and the energy efficiency of buildings and products. It is estimated that without environmental policies (both national and European), greenhouse gas emissions in the EU-15 would have increased to some 5 % above the 2001 level (Figure 2.2; Harmelink and Joosen, 2004). Policies that promote renewables, energy efficiency of buildings, and non-CO2 emissions, in particular, have reduced greenhouse gas emissions. Nonetheless, the dominant contributions to CO2 changes in the past decade were unrelated to environmental policy, such as the major economic reforms in the new EU Member States and progressive energy savings and shifts to lower carbon fuels in industrial and energy production (see section 2.2). Under the Kyoto protocol, the EU-15 has a target to reduce greenhouse gas emissions by 8 % in the period 2008–2012 compared to the base year1 (1990 in most cases); the ten new Member States have reduction targets between 6 and 8 %. In 2002 EU-15 greenhouse gas emissions were 2.9 % below the level in the base year, 1990 (EEA, 2004a). Towards 2010, emissions are projected to decrease by 1–7 % below 1990 levels, which is insufficient to meet the Kyoto target (see Figure 2.2). However, the flexible Kyoto Mechanism also allows the EU and its Member States to include reductions realised outside the EU. These additional reductions should provide sufficient potential for the EU to. Figure 2.2: Breakdown of. Emissions of greenhouse gases, EU-15. the effects of environmen-. Mton CO2-equivalent. 4400. Reduction due to:. tal policies on greenhouse gas emissions in the EU-15 (Harmelink and Joosen,. 4300. Without environmental policies. 4200. Projection based on existing measures. Common agricultural policy Combined heat & power NO2 reduction industry Landfill gas policies Energy savings buildings Use of renewable energy. Projection based on additonal measures. 2004). Projections are taken from Member States’ submissions (EEA, 2003).. 4100. Additional measures. 4000. Realisation. 3900 KYOTO target. 3800 1990. 1994. 1998. 2002. 2006. 2010. 1 When emissions generated by international aviation, marine shipping and effects of landuse change and forestry are included, greenhouse gas emissions can be said to have stabilized at the base-year level.. 15.
(18) Outstanding Environmental Issues. achieve its target. As CO2 is by far the most important greenhouse gas, the next paragraphs focus on CO2.. 2.2 Energy and industry Climate policies have not yet targeted energy savings in production processes, even though these offer considerable potential for CO2 reduction.. Some 55 % of total CO2 emissions in the EU-25 originate from energy use in the energy generation and industrial sectors. In these sectors, CO2 emissions have stabilised or decreased, while production increased (EC, 2003a; EEA, 2003). This decoupling was largely due to a shift to fuels that are lower in carbon such as gas and nuclear power, alongside energy savings (Figure 2.3). CO2 emissions from the energy generation and industry sectors combined are projected to stabilise in the years ahead and then increase (EC, 2003a). Yet, energy savings, in particular, have great potential for enhanced decoupling (see Figure 2.1).. CO 2 emissions. Figure 2.3: Breakdown of causes of CO2 emission changes in the electricity. 1700. Electricity production, EU-25. Industry, EU-15. Mton CO 2. Mton CO 2. Reduction due to:. 900. Reduction due to:. generation (EU-25) and industrial (EU-15) sectors.. Nuclear. 1500. Reference Fuel switch. 1300. Energy savings. 110 0. Renewables Combined heat & power. 800. Realisation. Fuel switch Energy savings + product mix changes Process emissions. 600 1990. 16. Structural change. 700. Realisation 900. Reference. 1994. 1998. 2002. 2006. 1990. 1994. 1998. 2002. 2006.
(19) 2 Climate change and energy. Policy and its impact In the past decade, environmental policy has led to an increase in renewable energy and combined heat and power generation. Nevertheless, other fuel switches and energy savings have had a greater effect and were only loosely related to environmental policies. Outside the environmental field, a policy of liberalising the energy markets has promoted a shift to lower carbon fuels by favouring the use of relatively competitive gas turbine technology. The recent European emissions trading scheme for the EU-15 is an appropriate instrument for steering growth in the direction of absolute decoupling of CO2 emissions from industrial and energy production – and at relatively low costs. Further low-cost reduction options may become available if the trading scheme is extended to other sectors in 2008, or linked to other instruments such as the Joint Implementation and Clean Development Mechanism, as recently proposed in the Linking Directive. Member States’ proposals for emission rights under the emission-trading scheme, scheduled to start in 2005, however, show a lack of ambition for the first trading period. The national allocation plans currently proposed, as well as country-specific protection of sectors, are likely to lead to only limited trading by 2008.. 17.
(20) Outstanding Environmental Issues. 2.3 Transport Environmental policy has had little effect on CO2 emissions from transport, which are increasing rapidly. In contrast, EU regulations have greatly reduced emissions of other air pollutants.. Transport contributes some 23 % to total CO2 emissions in the EU-25, even without taking into account those from international shipping and air transport (see text box). CO2 emissions from transport grew by 19 % between 1990 and 2001, while those from other sectors stabilised or declined. This rapid growth in transport in the EU-15, which is expected to continue in the near future, will be even greater in the new EU Member States (EC, 2003a).. Policy and its impact Despite regular rises in fuel tax, the average real fuel price is still 10–15 % lower than 20 years ago for road transport and has remained fairly stable in the EU-15 over the past 15 years. Shipping and aviation fuels are not taxed at all (EEA, 2002). For this reason, transport-pricing policy in the past decade has probably neither significantly affected transport volumes nor its CO2 efficiency. The EU does not regulate CO2 emissions from vehicles, although voluntary agreements for passenger cars are in place. Overall, the limited effect of policies on CO2 trends in transport (Figure 2.4) are in sharp contrast to other pollutants such as NOx and PM10, which were reduced for road transport – sometimes quite steeply – through emission standards (see Figure 5.3 and section 5.1).. CO2 emissions from road transport, EU-15. Figure 2.4: Breakdown of the impact of improved. 150. Reduction due to :. Index (1990=100). fuel efficiency and increasing numbers of. Reference. 140. Fuel efficiency passenger Fuel efficiency freight Dieselisation. diesel cars on CO2 emissions generated by road transport.. 130. 120 Realisation 110. 100 1992. 18. 1996. 2000. 2004.
(21) 2 Climate change and energy. 25 % of transport-generated CO2 disregarded in current policy. carriers is a clear example of this trend. Sig-. Some 25 % of CO2 emissions from transport in. ciency have been achieved and more are. the EU-25 are not targeted by current policies. expected in future in the order of 1–2 % per. (EEA-ETC/ACC, 2003). These emissions are. year for new aircraft (IPCC, 1999). However,. generated by international aviation and. demand for air travel is growing faster than. marine shipping, which have grown consider-. efficiency improvements, resulting in expect-. nificant improvements in aircraft-fuel effi-. ably in the period 1990-2001 (by 61% and 30 %,. ed growth in CO2 emission of approximately 4. respectively). Deregulation and ‘open skies’. % per year in the period up to 2015 (IPCC,. agreements have led to large airline alliances. 1999). Currently, no concrete policy measures. and significant reductions in airfares (U.S.. for reducing CO2 emissions from air transport. DOT, 2000). The rise of the so-called low-cost. and shipping are anticipated.. 2.4 Renewable energy Most renewable energy sources cannot yet compete in the newly liberalised energy market. Continued mandatory measures will be needed to increase the market share of renewables further.. With a current share at about 6 %, renewables are of increasing importance to Europe’s energy supply (Table 2.1). The use of renewables such as wind, solar energy and biofuels can in the long term alleviate the EU’s growing dependence on imported energy and improve security of supply. Currently, large-scale hydropower is by far the most important source of renewable electricity in the EU (about 85 %), particularly in Austria, Sweden and Latvia, but further growth is expected to be limited because of a lack of suitable sites (EEA, 2004c). Until 2010, most of the growth in renewable energy is expected to come from wind and biomass (ECN, 2003).. Policy and its impact Promotion of renewable energy is a major priority in EU energy policy (EC, 2000). Whereas large-scale hydropower is able to compete in a free energy market, other renewables still need policy support. To this end, Member States apply a blend of policy instruments. The main instruments used to support renewable energy are feed-in tariffs that guarantee a fixed favourable price for each kilowatt of renewable electricity produced (e.g. in Denmark and Germany) and regulation that guarantee a certain level of demand (e.g. in the UK and Italy). The latter instrument is both the most effective and the most efficient (ECN, 2003).. 19.
(22) Outstanding Environmental Issues. Table 2.1: Renewables in the EU-15 (Source: EC, 2004). Present* Projection 2010 Target 2010 a). Share of renewable energy. 6%. 10 %. b). Electricity consumption supplied by renewables. 15 %. 18 -19 %. 12 % 22 %. c). Biofuels in petrol and diesel-fuelled transport. 0.6 %. 0.7-1.4 %. 5.75 %. * 2001 for a) and b), 2002 for c). Biofuels for transport. ducing biofuels from crops is still an expen-. It is estimated that in order to meet the 2010. sive climate change mitigation measure. This. target of 5.75 % share of biofuels in transport,. is because production is not very energy-effi-. 4–13 % of the total agricultural area in the EU-. cient – a great deal of energy is lost during. 25 will need to be cultivated with biofuel. the conversion of biomass into fuel. Smart. crops (EC, 2003b). A new global market for. measures will be needed to steer the biofuel. crops such as oilseed rape, wheat and sugar. market in the most cost-effective, CO2-effi-. beet is expected to develop. However, intro-. cient direction.. The EU and Member States have set several indicative targets and employed various instruments to promote the use of renewable sources of energy. Despite an increase in the use of renewables, current policies – whether at the EU or national level – are insufficient to meet these targets (see Table 2.1).. 2.5 Policy challenges and opportunities Assuming that Member States meet their Kyoto targets, greenhouse gas emissions in the EU-25 in 2010 will still only be several percent below 1990 levels. To slow down global warming, a more substantial reduction is needed over the next few decades, yet – during this period – Europe’s energy demand is expected to grow further. Concurrent investments in the energy generation and industrial sectors are expected to be higher than in recent decades (Figure 2.5). Furthermore, the continued growth and replenishment of transport stock will also generate large investments. These trends offer the opportunity to guide future technology investments in a low-CO2 direction. The prospect of large and stable market perspective for low-CO2 technology will be needed to achieve this. European and international agreement on longterm emission targets, or alternatively, on targeted parts of the energy system, will offer this prospect.. 20.
(23) 2 Climate change and energy. Figure 2.5: Past and. Past and future energy investments, Europe. future investments in Europe’s energy genera-. Investments (billion euro, price level 2000) 8000. tors. Projections (2001-. Energy savings. A2. tion and industrial sec-. Production of electricity. A1. Production of biofuels. 6000. B1. 2030) are shown for four IPCC-SRES scenarios (A1,. B2. Production of fossil fuels. 4000. A2, B1 and B2) (source: IMAGE team, 2001). 2000. 0 1971-2000. 2001-2030. Time for a European adaptation strategy? Even if it is limited to less than 2 °C, global warming will have a major impact on societies around the world, felt even more in developing countries than in Europe. Key concerns for Europe are cited below (IPCC, 2001b): • Southern Europe will get drier, whereas precipitation in Northern Europe will increase. • The risk of flooding is likely to increase in most parts of Europe. • Agricultural production is expected to increase in Northern Europe, but decrease in Southern and Eastern Europe. • Half of Europe's alpine glaciers could disappear by the end of the 21st century. • Biotic zones will shift and the loss of wetlands, tundra and isolated habitats may threaten species. • Tourist destinations (both in summer and winter) may change substantially. Several Member States have started to develop adaptation strategies, such as flood and forest protection management, along with coastal zone management. Many impacts and adaptation measures have a trans-boundary character (e.g. storage capacity for river water) calling for international co-ordination. Development of a European adaptation strategy could facilitate this.. 21.
(24)
(25) 3 Materials and waste. 3. Materials and waste. Clarify the link between materials, waste and environmental impacts Improved waste treatment, recycling and more energy-efficient production of materials have improved the eco-efficiency of the material-waste chain in the EU. Nevertheless, the use of materials and waste generation remain linked with economic growth, together causing some 25 % of greenhouse gas emissions in the EU. To further enhance eco-efficient use of materials, we recommend highlighting the associated gains (environmental as well as economic) and increasing economic incentives.. Economic growth has always been linked to increased use of materials such as paper, cement, steel, aluminium and plastics. After all, our houses, offices, roads, cars and computers all consist of materials. In general, material use has increased more slowly than GDP in the order of: steel < paper < aluminium < GDP < plastics (CBP, 2000). The generation of waste likewise tends to increase with economic growth, although at a slower rate. Specific streams such as packaging materials and their waste are strongly linked with economic growth.. Policy and its impacts The EU and national waste directives have targeted individual waste streams or waste treatment, e.g. hazardous waste, waste oils, electronic equipment, waste incineration and landfilling. Now, the Commission recognises that a comprehensive framework to promote waste prevention and recycling has yet to be provided (EC, 2003). Strategies on prevention and recycling of waste, and sustainable use of natural resources (both to appear in 2005), as well as recent initiatives on integrated product policy (IPP), should deliver this framework. These strategies would clearly gain in impact if they were to include comprehensive indicators that clearly show the benefits from improved eco-efficiency in the material-waste chain, as well as the impact of policies. Landfilling A tax on landfilling, which has been applied widely in the EU, has effectively reduced landfilling and promoted incineration, composting and recycling of municipal waste. Nevertheless, landfilling is the predominant municipal. 23.
(26) Outstanding Environmental Issues. 25 % greenhouse gases in the EU from material production and waste handling The production of materials such as steel, paper and aluminium from raw materials (ore, wood) places a high demand on energy use. Due to increased recycling and energy savings in the process of material production, the energy used during production has – over time – increased less than physical production (in kg) (Figure 3.1). Overall, material production and waste handling contributes some 20–30 % to total greenhouse gas emissions in Western Europe (Gielen, 1999).. Energy use from paper aluminium, steel and plastic production, Western Europe 140. Index (1970=100). Reduction due to:. Projection with baseline scenario. Increase of recycled materials Reference. 120. Energy savings in material production process. 100 Realisation. 80. 60 1970. 1980. 1990. 2000. 2010. Figure 3.1 Energy use of the paper, aluminium, steel and plastic production sectors in Western Europe, 1970-1995 + baseline scenario. (Source: RIVM/CPB, 2001).. waste treatment option in most countries throughout Europe, averaging around 57 % in EU-15 countries and over 90 % in the new EU countries (EEA, 2004). Methane from landfilling contributes some 2 % to EU-25’s total greenhouse gas emissions. For this reason reduced landfilling would also contribute to greenhouse gas abatement, see Figure 2.2. Organic, biodegradable, and packaging wastes are dominant sources of waste for landfilling. The extent to which this waste is recycled is gradually increasing. Scattered data show that varying proportions of packaging waste – approximately 58 % (paper), 53 % (glass), 18 % (plastics) and 34 % (metals) – generated by households and retailers in the EU-15 are currently recycled. The targets, collection systems and the degree of manufacturers’ responsibility for recycling differ among Member States (EC, 2001). The ambition level and influence of EU policy in the field of packaging waste will increase through new targets that have recently been set for 2008.. 24.
(27) 3 Materials and waste. Integrated product policy Recently, EU directives on the return and recycling of electronic products and cars by manufacturers have been put in place. These systems clearly increase collection and recycling of these products. It is difficult though to estimate their effect, and the extent to which manufacturers’ sense of responsibility leads to improved eco-efficient design of products (design for recycling, or using fewer or lighter materials). Targeted policies, for example in relation to cars and car manufacturers, seem to provide an additional impetus for ecoefficient design of products (Tojo, 2003a and b).. International trade promotes recycling. in recovered and recyclable waste materials (saving energy. Through international trade, recovered waste materials can. and resources) often outweigh the environmental costs due to. also be used outside the country. Both recovery and interna-. transport and costs arising from use elsewhere. This holds true. tional trade in secondary (waste) materials have increased. even for use far away (requiring transport) and recycling in. considerably since 1970. Now, recovery of materials such as. less modern installations (Van Beukering, 2001). A crucial pre-. paper, iron and aluminium in the EU-15 is about 53 %, 57 % and. requisite, though, is the enforcement of national as well as. 39 %, respectively. International trade is an important driver for. international regulations (such as the European EVOA Direc-. the development of the recycling industry. There is a lack of. tive) so that truly recyclable materials are traded and haz-. high-quality recyclable materials, especially in countries with a. ardous waste dumps are avoided.. low but fast-growing GDP. The environmental benefits of trade. 25.
(28) Outstanding Environmental Issues. Towards more sustainable use of materials Current national and EU policies have been successful in reducing the proportion of landfilling, in improving environmental performance of waste treatment and in increasing recycling. A similar effect is to be expected in the growing economies of the new EU countries. Yet, these policies cover a limited proportion of all the waste generated (EC, 2003) and hardly affect the increasing flows of materials and waste. Thus, absolute decoupling of the environmental effects from growing material use and waste generation – a broad aim of the 6th Environmental Action Programme – remains an important challenge for the future. The European Commission views the use of economic and market-based instruments as the most promising way to implement this policy (EC, 2003).. 26.
(29) 4 Nature and biodiversity. 4. Nature and biodiversity. Halting the ongoing loss of biodiversity requires greater financial resources The ongoing exploitation of land and water is reducing biodiversity. However, adequate monitoring of such trends is still lacking. It seems unlikely that the EU target to halt further loss of biodiversity by 2010 will be met, as pressures such as the growth of infrastructure, intensive agriculture and serious overexploitation of fish stocks remain. On the positive side, modern forestry practices in the EU-25 create more scope for biodiversity, and restoration and protection programmes show tangible, though small, improvements with respect to target species and priority areas. The economics of forestry supports sustainable Figure 4.1 Pressures dri-. management, whereas the opposite is true for fishery. The recent CAP reforms. ving loss of mean abun-. have also improved the conditions for more ecological agricultural production.. dance of terrestrial species. Now Member States have to make a priority of seizing the opportunities creat-. in the EU-25. The baseline. ed by CAP reform. The EU biodiversity objectives already require further. (100 %) indicates biodiver-. change, in particular higher levels of funding and better targeting of financial. sity around 1850 (Alke-. resources for Europe’s large areas of farmland with high natural values.. made, in prep).. Loss of mean abundance of terrestrial species since industrialisation, EU-25. 4.1. Trends and targets. Biodiversity represents the abundance and richness of genes, species and habitats. Worldwide, biodiversity is deteriorating at an unprecedented rate. To date, the abundance of characteristic species in Europe has been reduced – on average – to about 45 % of its level some 150 years ago (Figure 4.1). These provisional estimates are based on model results and literature. This means that Enlarged and intensified agriculture. many characteristic species have become much. Forest exploitation. less abundant or even extinct, and a few other. Built-up area and infrastructure. species much more abundant and widespread.. Remaining biodiversity. This is a process that has been driven by increased and intensified land use through. 27.
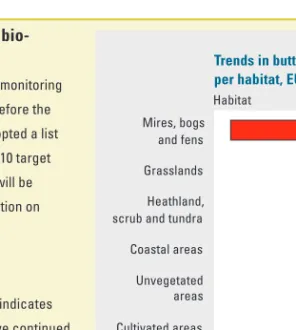
(30) Outstanding Environmental Issues. Core set of indicators crucial for effective biodiversity policy. Trends in butterfly population per habitat, EU-16. Adequate indicators of biodiversity and systematic monitoring. Habitat. are a prerequisite for effective policy support. Therefore the Convention on Biological Diversity has recently adopted a list. Mires, bogs and fens. of indicators for assessing progress towards the 2010 target (UNEP, 2004). First and foremost, substantial effort will be needed to mobilise what is so far scattered information on. Grasslands Heathland, scrub and tundra. trends in biodiversity. Coastal areas. Butterflies An initial analysis of available trend data in Europe indicates that various terrestrial biodiversity components have continued to decrease since 1970. For example, butterfly populations in 16 of the EU-25 countries have sharply declined since 1970 in most ecosystem types (Figure 4.3). The most important pressures on butterflies are land-use changes, habitat fragmentation, and. Unvegetated areas Cultivated areas Woodland and forest -100 -80. -60. -40. -20. 0. 20. 40. Average % change since 1970. lack of appropriate nature management, while for ‘mires, bogs and fens’ the lowering of groundwater tables is also an important pressure. Butterfly populations seem to be recovering in. Figure 4.2: Trends in population size of butterfly species. ‘woodland and forest’ ecosystems, where increased forest. since 1970 (provisional data). (Sources: UNEP-. area, integrated forest management and climate change are. WCMC/RIVM, in prep., based upon Van Swaay, 2004.). contributing factors.. urbanisation, agriculture, forestry and pollution. On the other hand, Europe’s traditional agricultural landscapes have made room for new biodiversity. Europe still has large areas of low-intensity agricultural land with a high nature value, especially in the Southern and Eastern parts of continental Europe and Northern UK (EEA/UNEP, 2004). At the same time, the high level of biodiversity in these parts is vulnerable; both intensification and land abandonment will result in a loss of biodiversity.. Policy and its impacts The EU has set an objective to significantly reduce or even halt the loss of biodiversity by 2010 (Convention on Biological Diversity, Gothenburg Council on the EU Sustainable Development Strategy and 6th Environmental Action Programme). To achieve this objective, the European Biodiversity Strategy focuses on three areas: 1 protection of natural habitats and species. The central pieces of legislation are the Birds Directive (1979) and the Habitats Directive (1992). These require the designation of protected areas as contributors to the EU’s Natura 2000 network of nature areas (this section);. 28.
(31) 4 Nature and biodiversity. 2 integration of the protection of biodiversity into environmental policy, e.g. the Water Framework Directive and the NEC directive (this section); 3 integration of biodiversity in sectoral policies, such as fishery, forestry and agriculture (see sections 4.2, 4.3 and 4.4, respectively).. Natura 2000 The Natura 2000 network is the EU’s prime initiative for preserving biodiversity by maintaining or restoring species and natural habitats. There are many examples of targeted restoration and protection programmes that show tangible improvements in target species and areas (EC, 2003a).. Nitrogen pollution slowly decreasing but many targets not met By aiming to ensure a high-quality chemical environment, EU environmental policy provides boundary conditions for protection of biodiversity. A large number of environmental directives are designed to reduce reactive nitrogen pollution in the air, groundwater and surface water in order to protect forest and water ecosystems from eutrophication. At least 30–40 % of rivers and lakes in the EU-15 show signs of eutrophication symptoms or bring high nitrogen fluxes to coastal waters and seas. Some 55 % of terrestrial ecosystems in EU-25 also receive nitrogen loads above the critical values (Posch et al., 2003). Although there is no indicator for the overall excess nitrogen load on the environment in EU countries, sectoral data indicate that EU regulations have caused a slow but steady decrease in the total nitrogen load to the environment in Europe (Figure 4.3). Nonetheless, Member States face a major task in meeting the targets set in several nitrogen directives, such as the ceilings for NOx and NH3 in the NEC directive, the limit values for NO3 concentrations in groundwater in the Nitrate Directive and emission reduction targets for nitrogen in the Urban Wastewater Treatment Directive. Trend in river nitrate concentrations Latvia Denmark Germany Austria Bulgaria Sweden Estonia France All countries UK Slovenia Hungary Slovakia Poland Lithuania Finland -100. Downward trend Upward trend. -75. -50. -25 0 25 50 % of monitoring stations, 1992-2001. Figure 4.3: Trends in river nitrate concentrations (1992-2001) in the EU (EEA, 2004b).. 29.
(32) Outstanding Environmental Issues. The incorporation of the Birds and Habitats directives in the national legislation of the EU-15 Member States is nearing completion, while this process is still under way in the ten new Member States. The designation of the Natura 2000 sites under the Habitats Directive is also approaching completion (EEA, 2004b). Habitats Directive sites are designated after consultation with the Commission, while sites under the Birds Directive are designated directly by Member States. Here, progress is lacking, with only Belgium, Denmark and the Netherlands having almost completed their designations. Natura 2000 now covers about 15 % of EU territory (EEA, 2004b). An initial review in the Natura 2000 database of 11 countries in the EU-15 indicates that 50–95 % of the mainly terrestrial sites were already protected under national designation systems. For these sites the Habitats directive offers an additional level of legal protection. The sites where Natura 2000 offers protection for the first time are mostly marine, tidal and coastal habitats. Here, enforcement might be difficult due to factors such as a lack of clear ownership and clearly defined responsibilities. Economic pressure on these areas can also be considerable (see also section 4.2).. 4.2 Fishery Overexploitation has severely diminished fish stocks in European marine waters. The main policy instrument of Total Allowable Catches has not effectively restricted exploitation rates.. A large proportion of the marine fish stocks in European waters are considered to be beyond safe biological limits, implying that stocks are near collapse or in danger (Figure 4.4). Although the total catch during the past 30 years has remained stable, the species composition of catch has changed substantially. Fish fleets are also catching species that had not been previously caught, such as industrial and deep-water species, many of which are used to support the growth of aquaculture (EEA, 2003) (see text box). The chronic over-exploitation of fish stocks by commercial fishing fleets is caused by the over-capacity of the existing fleets, which is estimated to be 40 % higher than the capacity required for sustainable exploitation of existing resources EC, 2001a and 2002a).. 30.
(33) 4 Nature and biodiversity. Status of fish stocks, North-East Atlantic 100. % Safe In danger. 80. Near collapse. 60. 40. 20. 0 1996. 1997. 1998. 1999. 2000. 2001. Figure 4.4: Status of fish stocks in the North-East Atlantic. The number of assessed stocks varies between 65 and 72. (Source: ICES, 2003.). Aquaculture: still fishing in the same pond Aquaculture is a rapidly growing sector worldwide. Europe’s aquaculture production has increased at an annual rate of 10 % over the past 20 years. Aquaculture contributed 27 % to global supplies of fish, crustaceans and molluscs in 2000 (FAO, 2002). Since important ingredients of fish feed are fishmeal and fish oil, current aquaculture is no solution for over-exploitation of fish stocks. Alternative protein sources (algae, plants) exist and can be developed further. However, it is not yet economically feasible to use these alternatives.. Policy and its impacts EU environmental policies are designed to integrate the protection of marine biodiversity into fishery practice. The main mechanisms are: the Biodiversity Action Plan for fisheries (EC, 2001b), the Action Plan for integration of environmental protection requirements into the Common Fishery Policy (EC, 2002a) and guidelines from the Convention for the Protection of the Marine Environment of the North-East Atlantic (known as the ‘OSPAR Convention’). The policy that most affects fisheries, however, is the EU’s Common Fishery Policy (CFP) in which the responsibility for management of stocks in the waters around EU countries has mostly been transferred to the European Commission. A mixture of quotas (Total Allowable Catches or TACs), fleet capacity control, marine protected areas, technical measures and subsidies has either been or is now being applied. The main policy instrument – Total Allowable Catches (TACs) – has largely failed to halt over-exploitation. One important reason is that even though the. 31.
(34) Outstanding Environmental Issues. More sustainable approaches to fisheries. Authorities in which all stakeholders in a. Some non-EU countries (e.g. New Zealand,. However, the systems were generally intro-. Australia) have introduced property rights for. duced when stocks had not yet been severely. individual fishermen in order to build up a. over-exploited and no drastic measures were. long-term perspective of resource use. Other. required (Daan and Van der Meenh, 2004).. healthy marine environment are represented.. countries have Regional Management. proposals of the EC have generally closely followed scientific advice, TACs have often been set higher by the Council of Ministers for socio-economic and political reasons. Furthermore, a fundamental drawback of the TAC system is that it creates an incentive for mis-reporting, since the landed catch reported is input for stock assessments and may lower TAC estimates for the following year. Past efforts to reduce the over-capacity of the EU fishing fleet have not yet led to an effective reduction of catches because of technological improvements in fishing gear. Furthermore, the trend to more powerful and larger vessels can be largely attributed to low-cost, tax-free fuel (Daan and van der Meenh, 2004).. Towards sustainable fishery A significant reduction in the over-exploitation of European marine waters is bound to have considerable socio-economic consequences for fishermen. Therefore it is questionable how effective several new initiatives in the recent CFP revision (2003) will be, where, for example, control on ‘days at sea’ can be applied by individual countries. Improved conditions for sustainable fishery may possibly arise from recent attempts to develop a regional stakeholders approach (see text box) and the increased focus of large multi-nationals on sustainable fishery.. 4.3 Forestry Forests in the EU are exploited in a much more sustainable way than those outside (e.g. in South America, Africa, Asia and Russia). The EU is a major market for timber from these regions.. Some 36 % of the EU-25 territory is covered with forest (MCPFE, 2003), which supplies about 80 % of the European demand for wood, mostly for timber and paper. Europe’s forests have a long history of human exploitation. Neverthe-. 32.
(35) 4 Nature and biodiversity. less, forests are a key feature in European nature. European forests have slowly expanded over the past few decades, both in area and stock, with net annual increments exceeding fellings in all member states (Figure 4.5). This expansion is caused by the ageing of the European forests (which are relatively young), afforestation, natural succession on abandoned agricultural land and improved forest management. Despite decreasing levels, air pollutants continue to have serious impacts on Europe’s forests. About one-fifth of all European trees are rated as damaged by defoliation (MCPFE, 2003).. 600. Change in forest stock *). Forest health. million m3. Damaged trees (%) 26. 24 400. 22. 20 200 18. 16 0 EU-15. New-10. 1990. 1994. Net annual increment available for wood supply. EU-18. Annual fellings. EU-22. 1998. 2002. *) Based on scattered data over the past 15 years. Figure 4.5: Forest stocks (left) and forest health (right). Forest health is measured by the degree of defoliation; damaged trees are moderately or severely defoliated or dead. EU22 excludes Cyprus, Estonia and Malta; EU-18 also excludes France, Italy, Sweden and the UK because of a lack of consistent data in these countries. (Sources: UNECE/FAO, 2000 and MCPFE, 2003.). Policy and its impact Unlike the Common Fishery and Agricultural policies, forest policy in Europe is largely developed at the national level. At the international level, the EU Forest Strategy (EC, 1998) and the Ministerial Conferences on the Protection of Forests in Europe have formulated and adopted guiding principles for forest management. NGOs (WWF, Greenpeace and others) have given a strong impetus to certification of forest management. Currently, 15 % of the total. 33.
(36) Outstanding Environmental Issues. Forests and soils in the EU-25 capture 2 % of annual CO2 emissions. prising about 2 % of the CO2 emissions of the. Forest stocks and carbon pools in European. EU-25. The Kyoto Protocol allows the use of. forests are increasing. It has been estimated. sinks from forestry as compensation for emis-. that European forests annually absorb about. sions, but only when the sink is created by. about 90 Mton CO2 (Image Team, 2001), com-. 250 - 600 Mton CO2 at present (Nabuurs et al.,. human intervention (i.e. it excludes natural. 2003; Janssens et al., 2003). This is offset,. sinks). Potentially, domestic sinks allowed. however, to a large extent by net carbon loss-. under the Kyoto Protocol amount to about 1 %. es from agricultural soils. In total, the terres-. of total EU-25 greenhouse gas emissions. trial biosphere in Europe annually absorbs. (EEA-ETC/ACC, 2004).. EU-25 forest area is certified under various schemes endorsed by the Forest Stewardship Council, mostly in Sweden and Poland (UNEP-WCMC, WWF, FSC & GTZ, 2004). Towards sustainable forestry In the decades ahead, Europe’s demand for wood products will continue to grow steadily. Nevertheless, Europe’s forests are expected to remain within the limits of sustainable wood production (UNECE/FAO, 2000). Increasing forest resources will provide foresters, policy makers and society challenges and opportunities for combining biodiversity conservation, sustainable timber supply, bio-energy and recreation. In contrast to European forest management, many forests outside the EU are subject to unsustainable and illegal logging practices, particularly in tropical South America, Central Africa, South-East Asia and Russia (FERN/WWF/Greenpeace, 2004). The EU is a major market for illegally logged timber, alongside Japan, China and the United States. However, there is no EU legislation to tackle trade in illegally logged timbers. Currently, the EU intends to focus on voluntary partnership agreements between producer and consumer countries, as indicated in the Action Plan on Forest Law Enforcement, Governance and Trade (EC, 2003b).. 34.
(37) 4 Nature and biodiversity. Towards a European soil strategy. – e.g. those linked to the CAP – can be used to protect the. Soils serve as a natural buffer against the impacts of acidifica-. physical quality of soils.. tion, eutrophication, and hydrological events (flooding and droughts). In many areas of Europe, they are being degraded. As soils are strongly affected by national and regional land use. due to crusting, erosion, structural depletion of groundwater,. policies, the Commission recognises that a comprehensive. continuing contamination from local and diffuse sources, salin-. European soil strategy – as currently being developed-. isation and compaction and – in some cases – productive land. requires careful examination of those aspects that are best. has been permanently lost (EC, 2002b).. solved by these policies and those requiring a cross-border approach (EC, 2002b). Using soils as a buffer against the. A number of EU directives affect the chemical quality of soils. impacts of climate change (e.g. flooding, drought, carbon sink). (e.g. those on air pollution, landfills, water framework, CAP,. could be a key component of policies relating to adaptation to. etc.). However, issues relating to the physical quality of the soil. and mitigation of climate change, requiring greater co-ordina-. (crusting, organic matter, compaction, erosion and salinisation). tion at the EU level (see also the textbox in section 2.5). have still to be addressed. A number of existing EU instruments. 35.
(38) Outstanding Environmental Issues. 4.4 Agriculture. The environmental pressure from agriculture is high but slowly decreasing. Reform of the CAP has improved conditions for agricultural production within ecological constraints. This can speed up the fairly slow progress towards the targets for a number of EU directives (e.g. the NEC, water framework directive and nitrate directive). To preserve the biodiversity of farmlands with a high nature value, levels and targeting of financing should be improved. The 2004 review of the Rural Development Regulation offers a good opportunity to address this issue.. As almost half the EU-25’s land area is in agricultural use, agriculture has shaped much of Europe’s landscapes and biodiversity. The Common Agricultural Policy (CAP), market pressures and technological developments have been important drivers for specialisation and concentration of agricultural production in certain EU regions, and the marginalisation – even abandonment – of other regions with less favourable conditions. Nutrient surplus (mainly nitrogen and phosphorus) from intensive agricultural production is the dominant source of eutrophication of European fresh waters and nitrogen deposition on forests. On the other hand, 15–25 % of the European countryside qualifies as farmland with a high nature value (mainly semi-natural grasslands, which are biodiversity hot spots (EEA, 2004c)).. Changes in agriculture in the new EU Member States. ture is likely to change. Stable and higher market returns, as. Farming systems in the new Member States in Central and. regions to expand and intensify their areas (by buying land. Eastern Europe currently use lower nutrient inputs, have lower. from adjacent small farmers) in order to increase their income. productivity and a richer variety of plant and animal species. (EC, 2003b; EEA, 2004d). Counterbalancing forces such as the. than those in the EU-15. Many of these countries have large. ageing population and new economic opportunities in cities. farmland areas of high natural value. Though developments in. may lead to land abandonment in regions with unfavourable. the new EU countries are difficult to predict, the sectoral struc-. production conditions.. well as CAP funding, may induce farmers in the better-off. Policy and its impacts The CAP has a big impact on the agricultural sector. The EU spends some €44 billion each year – 45 % of its budget – on the CAP. According to OECD estimates, the CAP supports a fairly constant 36 % of total gross farm receipts in the EU, either through direct financial support (income or production support) or indirectly through market protection (OECD, 2003) (Figure 4.6). Sub-. 36.
(39) 4 Nature and biodiversity. sequent reforms have integrated rural and environmental aspects into the CAP. From 2005 on, direct financial support of farmers will be largely decoupled from production. Support will be adapted to the EU’s environmental, nature and animal welfare directives through a system known as cross-compliance. Today, some 10 % of the CAP budget is spent on rural development, about half of which is directed to agri-environmental programmes and support to farmers in so-called less-favoured areas (LFAs, some 56 % of farmland in EU-15 and 25–60 % in the new EU countries). Farmers who participate in agrienvironment schemes apply measures that go beyond legal requirements, such as landscape management and nature conservation.. Figure 4.6: Direct and CAP support to farmers, EU-15. indirect (EU and national) contributions to gross. % of total gross farm receipts 50. Consumers supporting shielded market prices. farm receipts in the EU-15. (Based on: OECD, 2003.). 40. Payments for (agri-)environment, LFAs and forestry / afforestation. 30 Other payments based on area planted / animal numbers. 20. Other payments 10. 0 1986. 1990. 1994. 1998. 2002. Integration of environmental standards into agriculture The nitrogen surplus in the EU-15 is slowly but steadily being decoupled from production (Figure 4.7, left). Where numbers of animals are fairly constant (EEA, 2003), the gradual decline in excess nitrogen might be due to more efficient use of nitrogen by cattle and crops. Environmental regulation is likely to be an important driver here. Nonetheless, implementation of the Nitrate Directive has not been easy in a number of Member States. Decoupling is much less in evidence for pesticide use (Figure 4.7, right). Today, pesticide policy is still strongly influenced by national policies, which differ among Member States. Denmark is one of the countries with the most restrictive policy: it not only controls the supply side of the market through strict laws but also taxes pesticide use. Harmonised testing and market authorisation of pesticide components at the EU level is ongoing; a thematic strategy on the sustainable use of pesticides will be finished in 2004. This can, in the near future, strengthen the effect of EU policy on decoupling.. 37.
(40) Outstanding Environmental Issues. 120. Nitrogen surplus, EU-15. Pesticide use, EU-15. Index (1990 = 100). Index (1990 = 100). 120. 110. 100. 100. 100. 90. 90. 80. 80. 70. 70 1990. 1994. 1998. 2002. 1990. 1994. 1998. Agricultural products turnover at constant prices. Crops turnover at constant prices. Nitrogen surplus. Pesticide use. 2002. Figure 4.7: Economic production and environmental performance in EU-15 agriculture. Nitrogen surplus versus turnover of all agricultural products (left) and pesticide use versus crops turnover (right). Dotted lines indicate estimates.. Integration of nature and landscape management into agriculture Member States have considerable freedom in the programmes they establish under the rural development regulation of the CAP. Indeed, there are striking differences in the patterns of expenditure. Countries with a longer tradition of agri-environmental policies, such as the Nordic countries and Austria, tend to use the support as a tool for promoting environmental land management. Governments in southern regions, which are often poorer, use it to modernise their agriculture. The levels of support for less favoured areas are also much higher in Northern Europe than in Southern Europe (Dwyer et al., 2002; Brouwer and Godeschalk, 2004). This pattern of spending does not clearly relate to the distribution of high nature value farmland over Europe (EEA/UNEP, 2004). Thus from a biodiversity point of view, targeting of finan-. Natura 2000 can protect 30 % of high nature value farmland but lacks finance The pattern of proposed Natura 2000 sites is fairly consistent with the distribution of high naturevalue farmland. Overall about one-third of high nature-value farmland area in the EU-15 has been designated as Natura 2000 sites (EEA/UNEP, 2004). However, Natura 2000 offers little additional finance to manage these sites. Also, current EU funding covers only a small proportion of the costs for managing Nature 2000 sites, estimated at between e 3.4 and 5.7 billion per year (20032013) (Markland, 2002).. 38.
(41) 4 Nature and biodiversity. cial support for high nature-value farmland could be improved (EEA/UNEP, 2004) (see also text box). The effectiveness of the Rural Development Regulation (RDR) The RDR offers a wide choice of options to Member States but, once approved, these allow little flexibility. The goals and effectiveness of current rural development support, and agri-environment schemes, in particular, are also not very transparent (Dwyer et al., 2002; Kleijn and Sutherland, 2003). It is a major challenge for the EU and the Member States to develop relatively simple, transparent programmes with low transaction costs that deliver results that can be monitored. Such programmes could increase incentives for nature and landscape conservation by farmers as well as, or in co-operation with, other stakeholders such as nature conservation/tourist organisations or water suppliers (Brouwer and Godeschalk, 2004). The 2004 review of the Rural Development Regulation offers a good opportunity to address these issues.. Aspects of sustainable agriculture Ongoing CAP reform shows that the EU is able to create conditions for more sustainable agriculture. Nevertheless, current resource allocation strongly reflects past agricultural policies, which focused on production (Dwyer et al., 2002). The first step for the Member States is therefore to make a priority of seizing the opportunities created by CAP reform.. 4.5. Policy challenges and opportunities. Loss of biodiversity will remain a key issue in the years and decades ahead. If the preservation of biodiversity, nature and valuable landscapes is to be maintained and enhanced, the common but as yet non-marketable benefits of these to society should be given an explicit value. Typically though, only a small proportion of consumers are willing to pay a higher price for products or services that reflect environmental, nature or social values (e.g. organic farm and fair trade products). Thus, a major task for policy-makers is – in line with declared EU aims – to protect the common values of nature, biodiversity and landscapes. This can be done in various ways. On the one hand, regulative policies on e.g. excess nitrogen and the protection of nature areas will need to continue. But EU policies could also stimulate new products and services in the agricultural, fishery and forestry sectors. Opportunities may arise from the expected trend towards a somewhat smaller agricultural area in the EU and markets for energy crops (see section 2.4) as well as tourism (see text box).. 39.
(42) Outstanding Environmental Issues. Growth in tourism requires direction Tourism is one of the fastest growing sectors in Europe. Yet, growth in tourism also increases pressures on the environment. Tourism contributes significantly to air pollution and greenhouse gas emissions as some 9 % of total passenger travel in the EU is linked to tourism (OECD, 2000) and 70 % of air transport is for holiday travel (EEA, 2003). At the local level, high nature and landscape value areas require careful exploitation for tourism. There are many examples of local over-exploitation, with negative impacts on e.g. biodiversity, landscape value and water resources. Much more than in other sectors, a clean, attractive environment has economic value for tourism. Nevertheless, environmental quality has yet to become a serious issue in the tourism sector. One of the reasons is that the sector consists of many stakeholders, which makes it difficult to create a sense of common responsibility for environmental quality at the local, national or European level. Eco-labels and environmental certification can guide consumers in the tourism sector, but most labels fail to take transport into account and their implementation so far remains marginal (EEA, 2003). The huge turnover in the tourism sector suggests a significant potential for the use of economic instruments such as environmental taxation. This should be applied at the European level (e.g. on air fares) and could be further applied on the member state or local level.. 40.
(43) 5 Human health and environment. 5. Human health and environment. To make the environment healthier, pollution from traffic must be further reduced The EU’s environmental policy has resulted in a relatively clean and healthy environment in Western Europe. Unhealthy lifestyles are currently responsible for the bulk of the avoidable disease burden. Nevertheless, some 2–8 % of this total burden in the EU-25 can be attributed to environmental factors. Major factors contributing to these health risks are poor air quality and noise, mainly due to transport. Therefore, to achieve a cleaner and healthier environment for all Europeans, we recommend a further tightening of emission and noise standards in transport.. 5.1 Trends and targets Western Europe now has a relatively clean and healthy environment. This is the result of progressively bringing various threats under control, via sewage, waterworks, waste collection and emission controls. Adverse social and lifestyle factors have gradually become the most significant causes of avoidable loss of health (see text box). Nevertheless, an estimated 2–5 % of. Figure 5.1: Urban popula-. Urban population exposed to air pollution above limit values, Europe. tion in Europe exposed to. % of total population 50. Particulate matter (PM10). pollution levels above EU limit values for ozone (O3,. Nitrogen dioxide (NO2) 40. Ozone (O3). 2010), particulate matter (PM10, 2005) and nitrogen. 30. dioxide (NO2, 2010). (Source: EEA, 2003.). 20. 10. 0 1996. 1997. 1998. 1999. 2000. 2001. 41.
(44) Outstanding Environmental Issues. A healthy lifestyle can combat much of the disease burden. siderable health gains. Collaboration among those responsible. Lifestyle is responsible for the bulk of the current avoidable. tors, as well as public and private bodies, is essential. For. disease burden (25–30 %; see, for example, Murray & Lopez,. example, about 30 % of urban car trips in the EU-15 cover less. 1996). Especially worrying trends are found in the EU among. than 3 km (50 % less than 5 km), while 3 km of cycling or walk-. young people. Due to unhealthy consumption patterns (e.g.. ing provides 15–30 minutes of moderate physical activity (30. high-fat intake and failure to eat enough fruit and vegetables),. minutes of physical activity per day is the internationally re-. plus insufficient physical exercise, the percentage of over-. commended guideline) (EC, 2003a). Providing cyclist and. weight children is growing rapidly. A new approach to preven-. pedestrians with safe, attractive surroundings can therefore. tion can turn the tide. Promotion of a healthy lifestyle, along. help promote physical health, while reducing environmental. with improvements in the built environment can result in con-. pollution and human exposure to it.. for health, environment, spatial planning and the transport sec-. the total disease burden in the EU-15 countries can be attributed to factors like air pollution, noise and (to a lesser extent) the indoor environment, foodborne diseases and chemicals. In the new EU Member States, these risks are likely to be higher, contributing some 5–8 % of the total disease burden (EC, 2003a). Here, outdoor and indoor air pollution, housing, water and foodborne infectious diseases are the main problems.. Policy and its impact From the very start, protection of human health has been a guiding principle in EU environmental policy, resulting in numerous regulations for single pollutants, environmental compartments and/or sectors (Figure 1.3). These have, in general, led to a cleaner and healthier environment (see text box). If all existing EU policies are properly implemented and enforced by all Member States, a number of pressures will be further reduced. Nevertheless, several EU-wide issues that require action via EU policy remain. Exposure of citizens to air pollution and noise in urban areas is one example. Some one third of urban citizens in the EU-15 are exposed to noise levels that cause annoyance and sleep disturbance (EEA, 1999). All citizens in the EU are exposed to air pollution that is likely to pose health risks and some one third of urban citizens in the EU-25 are exposed to air pollution above current EU limit values (Figure 5.1). Provisional estimates reveal that the extent of the effects of ozone. 42.
(45) 5 Human health and environment. Examples of clean air and water benefiting human health Clean air and water improves human health. Improved access to clean potable water and education measures in Hungary resulted in a sharp decline in blue baby syndrome (methemoglobinaemia in babies, see Figure 5.2, left). In the Netherlands, controls on dioxin emissions from waste treatment installations caused a reduction in intake of dioxins via food, which lowered dioxin concentrations in breast milk (Figure 5.2, right).. Dioxin emission, The Netherlands. Health and potable water, Hungary 350. No. of cases. % 100. 100. 80. 80. 60. 60. 40. 40. 20. 20. Index (1988=100). 300 250 200 150 100 50 0 1978. 1982. 1986. 1990. 1994. 1998. 0 2002. 0 1988. 1992. 1996. Incidence of blue baby syndrome. Intake via food. Percentage of the population with access to central water supply. Concentration in human milk. 2000. Emission waste incinerators. Figure 5.2: Examples of heath benefits from intervention measures: cleaner drinking water in. Hungary (source: WHO, 2004) and cleaner air in the Netherlands (source: RIVM, 2002a).. and fine particle pollutants on life expectancy is in the order of several tens to hundreds of thousands of premature deaths per year in Europe (WHO, 2000). Although emissions of air pollutants are generally declining, many countries are not yet on track towards EU targets such as the NEC emission ceilings (2010) and air quality limit values for PM10 (2005) and NO2 (2010). Even if these targets set for 2005 and 2010 are met, considerable health impacts are still likely (WHO, 2003). The following sections focus on transport (section 5.2) and the chemical industry (section 5.3). The transport sector is a major source of air pollution (ozone precursors and fine particles) and noise in urban areas. Hazardous chemicals are a matter of concern, as the risks associated with the use of many of these substances are still to a large extent unknown. The chemical sector can play a key role in improving knowledge and communication about these risks.. 43.
Afbeelding


+7


GERELATEERDE DOCUMENTEN
The third hypothesis, formed through the theory about why Member States act on an international level the way they do, is that the Polish national government would
establishment under Article 49 TFEU, the free movement of capital under Article 63(1) TFEU and the free movement of services under Article 56 of the TFEU, an investment is
In some Member States there are considerable gaps in victim protection legislation, for example, because there is no (pre- trial or post-trial) protection in criminal proceedings
Firstly, Member States want to keep their fiscal sovereignty, and secondly, the Union seeks a greater autonomy from the direct contributions of the Member States.. The paper
This study explored the possibility to blend online therapy with face-to-face therapy in the treatment of depression in secondary mental health care, taking into account atti-
To start off the survey we will deal with the question whether the European Constitution is a true constitution (section II.), subsequently examine whether and how the
interconnected game has a unique full cooperative strategy profile and a strictly dominant Nash equilibrium and in case the gains of both players are strictly Pareto superior. Note
The Agenda Dynamics Approach centers on the different political attributes and information-processing capacities of the European Council and the Commission. The two features
