002295
This is a publication of:
National Institute for Public Health and the Environment
P.O. Box 1 | 3720 BA Bilthoven The Netherlands
www.rivm.nl Augustus 2011
Emissions of transboundary air pollutants in the Netherlands 1990-2009
Informative Inventory Report 2011
Report 680355003 / 2011
Emissions of transboundary air pollutants in the Netherlands, 1990-2009. Explanation on the yearly set of emission data. Between 1990 and 2009 emissions of air pollutants in the Netherlands have decreased. This concerns sulfur dioxide, nitrogen oxides, non-methane volatile organic compounds (NMVOC), carbon monoxide, ammonia, heavy metals and persistent organic pollutants (POP’s). The downward trend is in particular attributable to cleaner fuels, cleaner cars and to emission reductions in the industrial sectors.
This was found in the explanation from the RIVM on the emission data submission, the Informative Inventory Report (IIR) 2011. Every year the Emission Inventory team – under direction of the RIVM - submits emission data for the government following obligations to the United Nations (UNECE) and the European Commission. The emission data set is a succession of years, from 1990 till the most recent submitted data.
B.A. Jimmink | P.W.H.G. Coenen | R. Dröge|
G.P. Geilenkirchen | A.J. Leekstra | C.W.M. van der Maas | C.J. Peek | J. Vonk | D. Wever
Emissions
of air
pollutants
Informative Inventory Report 2011
Emissions of transboundary air pollutants in the Netherlands
1990-2009
Netherlands
Informative Inventory
Report 2011
B.A. Jimmink, P.W.H.G. Coenen1, R. Dröge1, G.P. Geilenkirchen2, A.J. Leekstra, C.W.M. van der Maas, C.J. Peek2,
J. Vonk, D. Wever
1 Netherlands Organisation for Applied Scientific Research (TNO) 2 Netherlands Environmental Assessment Agency (PBL)
Emissions of transboundary air pollutants in the Netherlands 1990-2009 Informative Inventory Report 2011
Contacts:
Benno Jimmink (PBL) (benno.jimmink@pbl.nl) Wim van der Maas (RIVM) (wim.van.der.maas@rivm.nl)
This report has been compilated by order and for the account of the Directorate-General for the Environment, of the Dutch Ministry of Infrastructure and the Environment, within the framework of the project Emissieregistratie M680355, ‘Netherlands Pollutant Release & Transfer Register’. Report prepared for submission in accordance with the UNECE Convention on Long-range Transboundary Air Pollution (CLRTAP) and the European Commision.
RIVM report 680355003 / 2011 ©RIVM 2011
National Institute for Public Health and the Environment (RIVM), PO Box 1, 3720 BA Bilthoven, the Netherlands; Tel: +31-30-2749111; Fax: +31-30-2742971; www.rivm.nl/en
Acknowledgements
Many colleagues from a number of organisations (CBS, EC-LNV, LEI, Alterra, NL Agency, PBL, RIVM and TNO) have been involved in the annual update of the Netherlands Pollutant Release & Transfer Register (PRTR), also called the Emission Registration (ER) system, which contains emissions data on about 350 pollutants. The emission calculations are performed by members of the ER ‘Task Forces’. This is a major exercise, since the Dutch emissions inventory contains information on many detailed emission sources.
Subsequently, the emissions and activity data of the Inventory are translated into the NFR source categories and contained in the excel files. The description of the various sources, the analysis of trends and uncer-tainty estimates (see Chapters 2 to 9) were made in cooperation with the following emission experts: Gerben Geilenkirchen (transport), Peter Coenen and Rianne Dröge (energy), Kees Peek (fugitive emissions, industrial processes), Jan Vonk and Sietske van der Sluis (agriculture). We are particularly grateful to Marian Abels, Bert Leekstra and Dirk Wever, for their contributions to data processing, chart production and quality control. For their continued support we acknowledge Jan Wijmenga and Johan Sliggers in particular, from the Directorate for Climate Change and Air Quality of the Dutch Ministry of Infrastructure and the Environment. For the design and lay-out of this report we thank the RIVM’s graphics department, in particular Martin Middelburg. We greatly appreciate all the contribu-tions to this Informative Inventory Report, as well as the external reviewers that provided comments on its draft.
Rapport in het kort
Emissies van luchtverontreinigende stoffen in Nederland, 1990-2009. Toelichting op jaarlijkse reeks emissiecijfers.
Tussen 1990 en 2009 is in Nederland de uitstoot van luchtverontreinigende stoffen gedaald. Het betreft zwaveldioxide, stikstofoxiden, niet-methaan vluchtige organische stoffen (NMVOS), koolmonoxide, ammoniak, zware metalen en persistente organische vervuilende stoffen (POP’s). Deze neerwaartse trend is vooral toe te schrijven aan schonere brandstoffen en auto’s, en aan emissiebeperkende maatregelen voor industriële sectoren. Dit blijkt uit de toelichting van het RIVM op de
Nederlandse emissiecijfers van grootschalige luchtveront-reinigende stoffen, het Informative Inventory Report (IIR) 2011. Deze cijfers worden jaarlijks – onder regie van het RIVM – door het Emissieregistratieteam aan de overheid geleverd vanwege verplichtingen voor de Verenigde Naties (UNECE) en de Europese Commissie. De emissiecijfers zijn data van een reeks jaren, vanaf 1990 tot de meest recent aangeleverde gegevens.
Dit keer is de ammoniakemissiereeks met een nieuw model berekend, waarmee beter in kaart is gebracht wat maatregelen om deze emissie te verminderen opleveren. Hieruit blijkt dat in 1990 meer ammoniak is uitgestoten ten opzichte van de vorige reeks en na 1991 minder. Voor 2008 scheelt dat 7,6 kiloton ammoniak. Deze daling komt vooral doordat het vanaf 1991 verplicht is de mest niet over het land te verspreiden, maar in de bodem te injecteren (onderwerken). Hierdoor komt minder ammo-niak in de lucht terecht.
Verder zijn nieuwe bronnen van stikstofoxiden onder-scheiden en zijn methoden ontwikkeld om deze emissies te berekenen. Het gaat om emissies uit mest van land-bouwbodems en uit mest in opslagsilo’s. Uit de berekenin-gen blijkt dat voor het jaar 2009 zo’n 25,5 kiloton stikstof-oxiden afkomstig is van landbouwbodems. Dit is circa tien procent van de maximaal toegestane hoeveelheid uitgestoten stikstof-oxiden in Nederland, het zogenoemde NEC-plafond (National Emission Ceiling). Deze hoeveel-heid telt echter niet mee in de berekening voor dit plafond (en staan vermeld onder memo-item ‘natuurlijke emissies’ 11C in de rapportage). De methoden waren namelijk niet bekend toen de plafonds werden bepaald.
Trefwoorden: emissies/emissiecijfers, IIR, grootschalige luchtverontreiniging, emissieregistratie
Abstract
Emissions of transboundary air pollutants in the Netherlands, between 1990 and 2009. Explanation on the annual set of emission data.
Emissions of air pollutants in the Netherlands decreased between 1990 and 2009. This concerns
sulfur dioxide, nitrogen oxides, non-methane volatile organic compounds (NMVOC), carbon monoxide, ammonia, heavy metals and persistent organic pollutants (POP’s). The downward trend may be attributed in particular to cleaner fuels, cleaner car engines and to emission reductions in the industrial sectors.
This has become apparent in the RIVM’s explanation of the emission data submission, the Informative Inventory Report (IIR) 2011. Every year the Emission Inventory team – under direction of the RIVM - submits emission data to the government, for it to meet its obligations to the United Nations Economic Commission for Europe (UNECE) and the European Commission. The emission data set consists of data on a series of years, from 1990 up to the most recently submitted data.
For this submission, the ammonia emission data series was calculated using a new model, which includes improved emission reduction measures, more in line with actual measurements. Results of the new model give rise to considerably higher NH3 emissions in the base year
1990. After 1991 they turned out to be lower. For the year 2008 the difference was 7.6 Gg. The reduction is mostly due to the change in manure application method (i.e. incorporation in the soil instead of surface spreading). Consequently less ammonia is volatilized.
Furthermore, new sources of nitrogen oxides were distinguished and methods were developed to calculate their emissions. These emissions come from manure on agricultural soils and from manure storage. Emissions from agricultural soils for the year 2009 are calculated to amount to 25.5 Gg NOx. This is about 10% of the maximum
allowed emissions of NOx in the Netherlands, the
‘NEC-ceiling’ (National Emission Ceiling). The amount is, however, not included for compliance to this ceiling (they are reported under memo-item 11C ‘Natural emissions’ in the submission). This is because, the methods were not known, when the ceilings were determined.
Key words: emissions, emission data, IIR, transboundary air pollution, emissions inventory
Contents
Acknowledgements 3
Rapport in het kort 5
Abstract 5
1 Introduction 9
1.1 National inventory background 9
1.2 Institutional arrangements for inventory preparation 10
1.3 The process of inventory preparation 10
1.4 Methods and data sources 12
1.5 Key source analysis 13
1.6 Reporting, QA/QC and archiving 13
1.7 Uncertainties 15
1.8 Explanation on the use of notation keys 16
1.9 Missing sources 18
2 Trends in emissions 19
2.1 Trends in national emissions 19
2.2 Trends in sulphur dioxide (SO2) 21
2.3 Trends in nitrogen oxides (NOx) 22
2.4 Trends in ammonia (NH3) 22
2.5 Trends in non-methane volatile organic compounds (NMVOC) 23
2.6 Trends in PM10 23
2.7 Trends in PM2.5 24
3 Energy 25
3.1 Overview of sector 25
3.2 Public Electricity and heat (1A1a) 26
3.3 Industrial Combustion (1A1b, 1A1c and 1A2) 28
3.4 Small Combustion (1A4ai, 1A4bi, 1A4ci and 1A5a) 30
3.5 Fugitives (1B) 33
4 Transport 35
4.1 Overview of the sector 35
4.2 Civil Aviation 36
4.3 Road Transport 38
4.4 Railways 44
4.5 Waterborne navigation 45
4.6 Non-road mobile machinery 48
5 Industry 53
5.1 Overview of the sector 53
5.2 Mineral production (2A) 55
5.3 Chemical industry (2B) 56
5.4 Metal production (2C) 56
5.5 Other Production Industry (2D) 57
6 Solvents and product use 59
6.1 Overview of the sector 59
6.2 Paint Application (3A) 60
6.3 Other (3D) 61
7 Agriculture 63
7.1 Overview of the sector 63
7.2 Manure management 64
7.3 Agricultural soils 66
8 Waste 69
8.1 Overview of the sector 69
8.2 Waste incineration 71
9 Other 73
10 Recalculations and other changes 75
10.1 Recalculations of the 2010 submission 75
10.2 Improvements 76
10.3 Effect of recalculations and improvements on 1990 and 2008 emission levels 76
11 Projections 79
11.1 Energy 80
11.2 Transport 84
11.3 Industry 86
11.4 Solvent and Product use 86
11.5 Agriculture 87
References 89
The United Nations Economic Commission for Europe’s Geneva 1979 Convention on Longe-range Transboundary Air Pollution (CLRTAP) was accepted by the Netherlands in 1982. Under the Convention, parties are obligated to report emission data to the Conventions’ Executive Body in compliance with the implementation of the Protocols to the Convention (also accepted by the Netherlands). The annual Informative Inventory Report (IIR) on national emissions of SO2, NOx, NMVOC, PM, CO, NH3 and various
heavy metals and POP is prepared using the Guidelines for Estimating and Reporting Emission Data under the CLRTAP (UNECE, 2009).
The Netherlands’ IIR 2011 is based on data from the national Pollutant Release and Transfer Register (PRTR). The IIR contains information on the Dutch
emission inventories for the years from 1990 to 2009, including descriptions of methods, data sources, QA/QC activities and a trend analysis. The inventory covers all anthropogenic emissions to be reported in the Nomenclature for Reporting (NFR), including individual polycyclic aromatic hydrocarbons (PAHs), which are to be reported under persistent organic pollutants (POPs) in Annex IV.
1.1 National inventory background
Emission estimates in the Netherlands are registered in the national Pollutant Release and Transfer Register (PRTR). This PRTR database is the national database for sectorial monitoring of emissions to air, water and soil. The database was set up to monitor pollutants to support national environmental policy as well as to report to the framework of National Emission Ceilings (EU), the CLRTAP, and to monitor the greenhouse gas emissions in conformance with United Nations Framework Convention on Climate Change (UNFCCC) and the Kyoto
Protocol (National System). The PRTR encompasses the process of data collection, processing and registration, and reporting on emission data for some 350 compounds. Emission data (for the most important pollutants) and documentation can be found at www.prtr.nl.
Instead of using the default values from the EMEP/EEA air pollutant emission inventory guidebook (EEA, 2009), the Netherlands often applies country-specific methods to obtain monitoring data and emission factors. The emission estimates are based on official statistics for the Netherlands (e.g. on energy, industry and agriculture) and environmental reports by companies in the industrial sectors. Both nationally developed and internationally recommended emission factors have been used.
1
1.2 Institutional arrangements for
inventory preparation
The Dutch Ministry of Infrastructure and the Environment (IenM) has the overall responsibility for the emission inventory and submissions to CLRTAP. A Pollutant Release and Transfer Register (PRTR) has been in operation in the Netherlands since 1974. Since 2010, the Ministry of IenM has outsourced the full coordination of the PRTR to the Emission Registration team (ER team) at the National Institute for Public Health and the Environment (RIVM). The main objective of the PRTR is to produce an annual set of unequivocal emission data that is up to date, complete, transparent, comparable, consistent and accurate. Emission data are produced in an annual (project) cycle (PBL, 2009; RIVM, 2010). Various external agencies contribute to the PRTR by performing calculations or submitting activity data (see next section). In addition to the RIVM, the following institutes contribute to the PRTR:
• PBL Netherlands Environmental Assesment Agency; • Statistics Netherlands (CBS);
• Netherlands Organisation for Applied Scientific Research (TNO);
• RWS Centre for Water Management (RWS-WD); • RWS Centre for Transport and Navigation (RWS-DVS); • Deltares;
• Alterra WUR;
• Wageningen UR Livestock Research;
• NL Agency (Waste management department); • Agricultural Economics Research Institute (LEI); • Fugro-Ecoplan, which coordinates annual
environmental reporting (AER) by companies. Each of the contributing institutes has its own responsibi-lity and role in the data collection, emission calculations and quality control. These are laid down in general agreements with RIVM and in annual project plans.
1.3 The process of inventory
preparation
Data collection
For the collection and processing of data (according to pre-determined methods), the PRTR is organised according to task forces. The task forces consist of sector experts of the participating institutes. Methods are compiled on the basis of the best available scientific views. Changes in scientific views lead to changes in methods, and to recalculations of historical emissions. The following task forces are recognised (see Figure 1.1):
• Task Force on Agriculture and Land Use;
• Task Force on Energy, Industry and Waste Management - ENINA;
• Task Force on Traffic and Transportation; • Task Force on Water - MEWAT;
• Task Force on Service Sector and Product Use - WESP. Every year, after collection of the emission data, several quality control checks are performed by the task forces during a ‘trend analysis’ workshop. After approval by participating institutes, emission data are released for publication (www.prtr.nl). Subsequently, these data are disaggregated to regional emission data for national use (e.g. 5x5 km grid, municipality scale, provincial scale and water authority scale).
1.3.1 Point-source emissions
As result of the Netherlands’ implementation of the EU Directive on the European Pollutant Release and Transfer Register (EPRTR), about 400 companies, representing even more facilities, are legally obligated to annually submit their emissions of pollutants when they exceed a certain threshold. For some pollutants, lower thresholds have been set in the Dutch implementation of the EPRTR directive (VROM, 2008). This has been done to assure that the total reported amount of the main pollutants for each subsector meets approximately 80% of the subsector total. This criterion has been set as safeguard for the quality of the supplementary estimate for Small and Medium-sized Enterprices (SMEs).
About 400 companies, representing even more facilities, are legally obligated to submit an Annual Emission Report (AER) as part of an Annual Environmental Report. As from 1 January 2010, AERs can only be submitted, electronically. All these companies have emission monitoring and registration systems with specifications in agreement with the competent authority. Usually, the licensing authorities (e.g. provinces, central government) validate and verify the reported emissions. Information from the AERs is stored in a separate database at the RIVM and formally remains the property of the companies involved.
Data on point-source emissions in the AER database are checked for consistency by the task forces. The result is a selection of validated data on individual point-source emissions and activities, which are then stored in the PRTR database (ER-I). The ER-I data is combined with supple-mentary estimates for Small and Medium-sized Enterprises (SMEs). Several methods are applied for calculating these emissions. TNO has derived emission factors for NOx
emissions from small installations, for instance (Van Soest-Vercammen et al., 2002), while, for other substan-ces, the Implied Emission Factors (IEFs) derived from the AERs are applied to calculate sector emissions.
Figure 1.1 PRTR Organisational arrangementThe organisational arrangement of the Netherlands Pollutant Release and Transfer Register (PRTR).
Ministry of IenM: • Directorate Climate and Air • DG for Public
Works and Water Management (RWS): – Centre for Transport and Navigation (DVS) – Centre for Water Management (WD) Ministry of EL&I: • Directorate Agriculture PRTR Steering body • Ministry of IenM • Ministry of EL&I • IPO • PBL • RIVM Expertise personnel through general agreements and contracts with: • CBS
• Centre for Water Management (WD) • Centre for Transport and Navigation (DVS) • NL Agency • PBL • TNO • LEI • Alterra WUR • Deltares • Fugro-Ecoplan • Livestock Research WUR Project leader PRTR at RIVM PRTR Executive body (WEM) • Project leader PRTR • Representatives of the contributing institutes • Taskforce chairmen
Task force on agriculture
Task force Energy, Industry and Waste
Management - ENINA Task force on Traffic
and Transportation Task force on Water - MEWAT
(Emissions to Water) Task force on Service Sector and
Product Use - WESP Seminar on Uniforming
Manure Data (WUM)
Seminar on Land Use, Land Use Change and Forrestry (LULUCF) Interaction with directorates of the involved ministries Strategic decicion-making Strategic decicion-making PRTR project group • Directorate Climate and Air • DG for Public
Works and Water • Statistics Netherlands • RIVM
1.3.2 Data storage
In cooperation with the contributing research institutes, emission data are collected and stored in a database managed by the RIVM.
Emission data from the ER-I database and from collectively estimated industrial and non-industrial sources are stored in the PRTR database (see Figure 1.2). The PRTR database, consisting of a large number of geographically spread emission sources (about 700), contains complete annual records of emissions in the Netherlands. Each emission source includes information on the Standard Industrial Classification code (SBI code) and industrial subsector, separate information on process and combustion emissions, and the relevant
environmental compartment and location. These emission sources can be selectively aggregated, per NFR category.
1.4 Methods and data sources
Methods used in the Netherlands are documented in several reports and protocols, and in meta-data files, available from www.prtr.nl. However, some reports are only available in Dutch. For greenhouse gases (www.greenhousegases.nl), particulate matter (PM) and all emissions related to mobile sources, the documentation has been translated in English. In general, two emission models are used in the
Netherlands:
• A model for emissions from large point sources (e.g. large industrial and power plants), which are registered separately and supplemented with emission estimates for the remainder of companies within a subsector (based mainly on IEFs from the individually registered companies). This is the so-called bottom up method. • A model for emissions from diffuse sources (e.g. road
transport, agriculture), which are calculated from activity data and emission factors from sectoral emission inventory studies in the Netherlands (e.g. SPIN documents produced by the ‘Cooperation project on industrial emissions’).
Figure 1.2
Data flow in the Netherlands Pollutant Release and Transfer Register (PRTR)
The data flow in the Netherlands Pollutant Release and Transfer Register.(Electronic)
Annual
Environmental
Reports (AER)
(Individual facilities)AER database
ER-I database
Collective
industrial
sources
Area/diffuse
sources
Activity data
Emission factors
(Literature, measurements) (Task forces PRTR)Geographical
distribution
data
PRTR-database
CBS (Task forces PRTR) (Task forces PRTR) (Task forces PRTR)1.5 Key source analysis
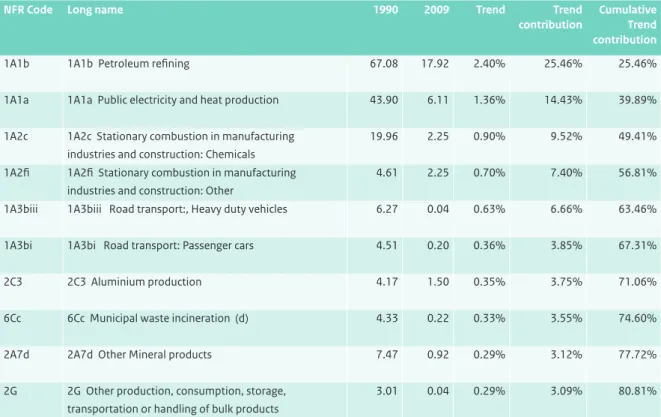
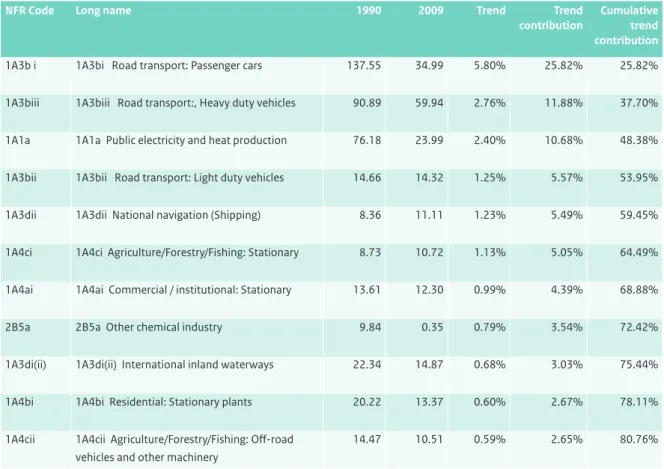
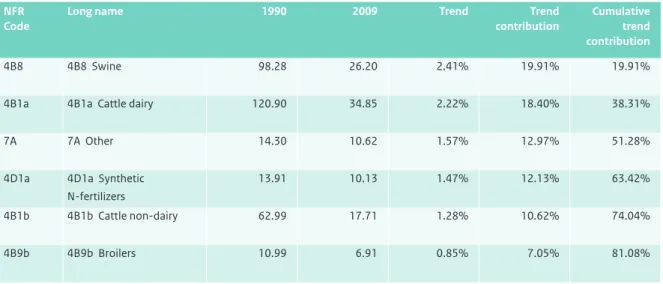
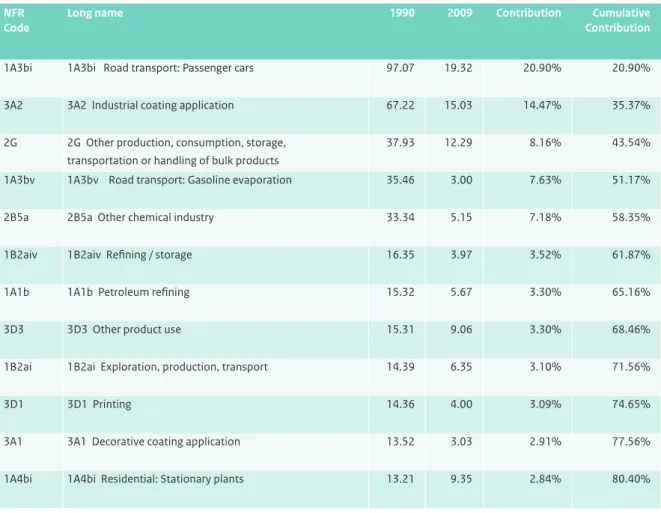
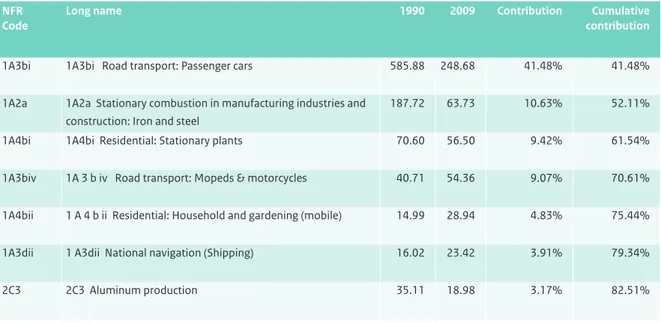
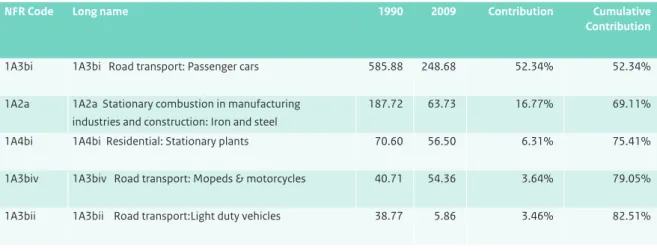
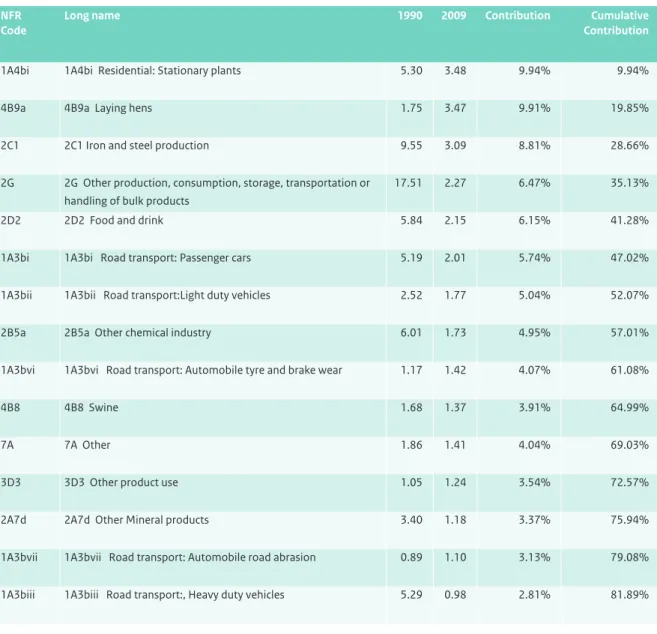
Following recommendations 9 and 10 from the Stage 3 in-depth review report for the Netherlands (UNECE, 2010), a trend assessment was carried out for the emission inventory of all components, in addition to a level assessment, to identify key source categories. In both approaches key source categories were identified using a cumulative threshold of 80%. Key categories are those which, when summed together in descending order of magnitude, add up to more than 80% of the total level (EEA, 2009). The level assessments were performed for both the latest inventory year 2009, as well as for the base year of the inventory, 1990. The trend assessments aim to identify categories for which the trend is significantly different from that of the overall inventory. See Appendix 1 for the actual analysis.
1.6 Reporting, QA/QC and archiving
1.6.1 Reporting
The Informative Inventory Report is prepared by the RIVM, with contributions by experts from the PRTR task forces.
1.6.2 QA/QC
As of 1 January 2010, PRTR project and management are transferred from the PBL to the RIVM Centre for Environmental Monitoring (CMM). The RIVM has an ISO 9001:2000 based QA/QC system in place. Additionally, CMM has a NEN-EN-ISO/IEC 17025:2005 based quality system in place, and with regard to the centre’s task of the accredited to perform tests with a limited scope. The quality systems combined serve the complete scope of the CMM, and documentation and archiving are done according to procedures in the quality manual. Arrangements and procedures for the contributing institutes are described in an annual project plan (RIVM, 2010).
In 2010, the adaptation of the PRTR project to the quality system of CMM was initiated, as the CMM had to conclude that it was necessary to change the combined quality system primarily to the ISO 9001:2000 system. In May 2011 the centre is planned to undergo its initial audit in the certification process. As a result of this change, the transition of the PRTR project to the CMM quality system has yet to be completed.
There are no sector-specific QA/QC procedures in place within the PRTR. In general, the following QA/QC activities are performed:
Quality assurance (QA)
QA activities can be summarised as follows:
• For the energy, industry and waste sectors, emission calculation in the PRTR is based mainly on AERs by companies (facilities). The companies themselves are responsible for the data quality; the competent authorities (in the Netherlands, mainly provinces and local authorities) are responsible for checking and approving the reported data, as part of the annual quality assurance;
• As part of the CMM quality system, internal audits are performed at the CMM, as part of the ISO certification; • Furthermore, there are annual external QA checks in
selected areas of the PRTR system.
Quality Control (QC
A number of general QC checks have been introduced as part of the annual work plan of the PRTR (for results see Table 1.2). The QC checks built into the work plan focus on issues such as consistency, completeness and accuracy of the emission data. The general QC for the inventory is largely performed within the PRTR as an integrated part of the working processes. For the 2010 inventory, the PRTR task forces filled in a standard format database containing emission data from 1990 to 2009. After an automated first check of the emission files by the data exchange module (DEX) for internal and external consistency, the data becomes available to the specific task force for checking consistency and trend (error checking, comparability, accuracy). The task forces have access to information on all emissions in the database, by means of a web-based emission reporting system, and are facilitated by the ER team with comparable information on trends and time series. Several weeks before a final data set is fixed, a trend verification workshop is organised by the RIVM (see Text box 1.1).
Table 1.1 Main items of the verification actions related to data processing 2010 and for the NRF/IIR.
Item Date Who Result Documentation *
Automated initial check on internal en external data consistency
Up to 29-11-2010 Data Exchange Module (DEX)
Acceptation or rejection of uploaded sector data
Upload event and result logging in the ER-database
Error and outlier checking uploaded and processed data
Up to 1-12-2010 Task Forces and ER team
Action list historische reeksen vergeleken LUCHT versie 30 nov 2010.xls,
Verschiltabel definitieve emissiecijfers 30 nov 2010 LUCHT actueel.xls,
Actiepunten trendanalyse T-1 2010 definitief v 1 dec 2010.xls and e-mail communications
Checking result from error correction
Up to 7-12-2010 Sector specialists and ER team
Updated action list historische reeksen vergeleken LUCHT versie 6 dec 2010.xls,
Verschiltabel definitieve emissiecijfers 6 dec 2010 LUCHT actueel.xls,
Actiepunten trendanalyse T-1 2010 definitief v 7 dec 2010.xls and e-mail communications
Trend analysis 08-12-2010 Task Forces
and ER team
Updated Action list Explanation of trends and differences with previous inventories
Actiepunten trendanalyse T-1 2010 definitief v 10 dec 2010.xls and email communications
Documentation sheets (text and tables) on relevant sub sectors.
Checking result of resolved issues
Up to 22-12-2010 Sector specialists and ER team
Updated action list Actiepunten trendanalyse T-1 2010 definitief v 22 dec 2010.xls and e-mail communications
Check allocations in Draft NRF (v5)
16-12-2010 NIC/IIR team Allocation table with couplings emission sources to NFR sub sectors
NFR-koppellijst-Kees.xls
* All documentation (e-mails, data sheets and checklists) are electronically stored on a data server at the RIVM.
Text box 1.1 Trend verification workshops
About a week in advance of a trend analysis meeting, a snapshot from the database is made available by the RIVM in a web-based application (Emission Explorer, EmEx) for checks by the institutes involved, sector and other experts (PRTR task forces), and the RIVM ER team. In this way, task forces can check for level errors and consistency in the algorithm/method used for calculations throughout the time series. The task forces perform checks for relevant gases and sectors. The totals for the sectors are then compared against the previous year’s data set. Where significant differences are found, the task forces evaluate the emission data in more detail. The results from these checks form the subject of discussion at the trend analysis workshop and are subsequently documented.
Furthermore, the ER team provides the task forces with time series of emissions per substance, for the individual subsectors. The task forces examine these time series. During the trend analysis for this inventory report, the emission data were checked in two ways: 1) emissions from between 1990 and 2008 from the new time series were compared against the time series of previous year’s inventory, and 2) the data for 2009 were compared with the trend development per compound since 1990. Checks of outliers are performed on the more detailed level of subsources in all sector background tables, and relate to:
• annual changes in emissions; • annual changes in activity data;
• annual changes in implied emission factors; • level values of implied emission factors.
Exceptional trend changes and observed outliers are noted and discussed at the trend analysis workshops, resulting in action list. Items on such a list have to be processed within 2 weeks or be dealt with in the following year’s inventory.
1.6.3 Archiving and documentation
Internal procedures are agreed on (e.g., in the PRTR work plan) for general data collection and the storage of fixed data sets in the PRTR database at the PBL, including the documentation/archiving of QC checks. As of 2010, sector experts can store relating documents (e.g. interim results, model runs) on a central server at the RIVM. These documents then become available through a limited-access website. Moreover, updating of monitoring protocols for substances under the CLRTAP is one of the priorities within the PRTR system. Emphasis is put on documentation of methodologies for calculating SOx,
NOx, NMVOC, NH3 and PM10 and PM2.5. Methodologies,
protocols and emission data (including emissions from large point sources on the basis of Annual Environmental Reports), as well as such emission reports as the National Inventory Report (UNFCCC) and the Informative Inventory Report (CLRTAP), are made available on the website of the PRTR: www.prtr. nl. Each institution involved in the PRTR is responsible for QA/ QC aspects related to reports based on the annually fixed database.
1.7 Uncertainties
Uncertainty assessments constitute a means to either provide the inventory users with a quantitative assessment of the inventory quality or to direct the inventory preparation team to priority areas, where improvements are warranted and can be made cost-effective. For these purposes, quantitative uncertainty assessments have been carried out since 1999. However, awareness of uncertainties in emission figures was expressed earlier in the PRTR in so-called quality indices and in several studies on industrial emissions and generic emission factors for industrial processes and diffuse sources. To date, the Dutch PRTR gives only one value per type of emission (calculation result, rounded off to three significant digits).
The information on the uncertainty about emission figures presented here is based on the TNO report ‘Uncertainty assessment of NOx, SO2 and NH3 emissions
in the Netherlands’ (Van Gijlswijk et al., 2004), which
presents the results from a Tier-2 ‘Monte Carlo’ uncertainty assessment. This uncertainty assessment is based on emissions in the year 2000. Since then, several improvements in activity data and methods (e.g. total N to TAN; see Chapter 6) have been implemented. Therefore, it is necessary to update the uncertainty assessment. This will be done during 2011, so that the results may be presented in de IIR of 2012. At that time, also more detailed uncertainty analyses, as suggested by the ERT in their Stage 3 in-depth review, will be provided (UNECE, 2010)
1.7.1 Quantitative uncertainty
Uncertainty estimates on national total emissions have been reported in the Dutch Environmental Balances since 2000 (PBL, 2009a). These estimates were based on uncertainties per source category, using simple error propagation calculations (Tier 1). Most uncertainty estimates were based on the judgement of RIVM/PBL emission experts. A preliminary analysis of NMVOC emissions showed an uncertainty range of about 25%. Van Gijlswijk et al. (2004) assessed the uncertainty in the contribution from the various emission sources to total acidification (in acidification equivalents) according to the Tier-2 methodology (estimation of uncertainties per source category, using Monte Carlo analysis). See Table 1.2 for results. A comparison was also made between the Tier-1 and Tier-2 methodologies. This was not straightforward, as the two studies used a different knowledge collection. The 2000 Tier-1 analysis used CLRTAP default uncertainties for several NOx processes,
which explains the difference with the 1999 Tier-1 results. For NH3, the difference between the 2000 Tier 1 and Tier
2 can be explained by taking non-normal distributions and dependencies between individual emission sources for each animal type into account (both are violations of the Tier-1 assumptions: effects encapsulated in the 1999 Tier-1 analysis). The differences for SO2 and total acidifying
equivalents are small. The conclusion drawn from this comparison is that focusing on the order of magnitude of the individual uncertainty estimates, as in the RIVM (2001) study, provides a reasonable first assessment of the uncertainty of source categories.
Table 1.2 Uncertainty (95% confidence ranges) in acidifying compounds and for total acidifying equivalents for emissions in 1999
(RIVM, 2001) and 2000 (Van Gijlswijk et al., 2004).
Component Tier 1 for 1999 Tier 1 for 2000 Tier 2 for 2000
NH3 ± 17% ± 12% ± 17%
NOx ± 11% ± 14% ± 15%
SO2 ± 8% ± 6% ± 6%
The RIVM (2001) study draws on the results from an earlier study on the quality of nitrogen oxide (NOx) and
sulphur dioxide (SO2) emissions, as reported by individual
companies for point sources under their national reporting requirements. In addition to providing quantitative uncertainty estimates, the study yielded important conclusions. For example, it was concluded that a limited number of facilities showed high uncertainties (e.g. 50% or more for NOx) that could be reduced with little extra effort,
and that companies generally have a lack of knowledge on the uncertainty about the emissions they report.
In the study by Van Gijlswijk et al. (2004), emission experts were systematically interviewed on quantitative uncertainties, which provided simultaneous information on the reliability and quality of the underlying knowledge base. For processes not covered by interviews, standard default uncertainties, derived from the Good Practice Guidance for CLRTAP emission inventories, were used (Pulles and Van Aardenne, 2001). The qualitative knowledge (on data validation, methodological aspects, empirical basis and proximity of data used) was combined into a score for data strength, based on the so-called NUSAP approach (Van der Sluijs et al., 2003; Van der Sluijs et al., 2005). The qualitative and quantitative uncertainties were combined in so-called diagnostic diagrams that may be used to identify areas for improvement, since the diagrams indicate strong and weak parts of the available knowledge (see Figure 1.3). Sources with a relatively high quantitative uncertainty and weak data strength are thus candidates for improvement. To effectively reduce uncertainties, their nature must be known (e.g. random, systematic or knowledge uncertainty). A general classification scheme on uncertainty typology is provided by Van Asselt (2000).
1.8 Explanation on the use of notation
keys
The Dutch emission inventory covers all relevant sources specified in the CLRTAP that determine the emissions to air in the Netherlands. Because of the long history of the inventory it is not always possible to specify all subsectors in detail. This is the reason why notation keys are used in the emission tables (NFR). These notation keys will be explained in Tables 1.3 to 1.5.
Figure 1.3 NUSAP diagnostic diagram indicating strong and weak elements in the available knowledge on acidifying substances in
the 2004 emission inventory.
0.0 0.5 1.0 1.5 2.0 2.5 3.0
Strength (average pedigree score) 0.00
0.05 0.10 0.15
0.20 Rank correlation squared 1 NH
3 from dairy cows, manure application
2 NOx from mobile sources agriculture
3 NOx from agricultural soils
4 NH3 from pigs farmed for meat, manure application
5 NOx along freeways, caused by gasoline passenger vehicles
6 NH3 dairy cows, animal housing and storage
7 NOx along freeways, caused by articulated trucks
8 NH3 from breeding stock pigs, manure application
9 NH3 from calves and yearlings, manure application
10 NH3 from synthetic fertilizer application
Diagnostic diagram acidifying equivalents
1 2 3 4 5 6 7 8 9 10 Safe zone Danger zone
Table 1.3 The Not Estimated (NE) notation key explained.
NFR code Substance(s) Reason for reporting NE
1A3ai(ii) All Not in PRTR
1A3aii(i) NH3 Not in PRTR 1A3 NH3, Cd - PCBs Not in PRTR 2B2 NOx Not in PRTR 4B2 NOx, NH3 Not in PRTR 4B7 DIOX Not in PRTR 6A NOx, SO2, NH3 Not in PRTR 6B NOx, NMVOC, SO2, NH3 Not in PRTR 6B NOx, NMVOC, SO2, NH3 Not in PRTR
Table 1.4 The Included Elsewhere (IE) notation key explained.
NFR09 code Substance(s) Included in NFR code
1A3aii(ii) All 1A3a ii(i)
1B2c All 1B2b, 1B2aiv
4B1b NOx 4B1a
1A3e All 1A2fi, 1A4cii,
1B2 b
2A2 All 2A7d
2A5 NMVOC 2A7d
2A6 All 2A7d
2B1 NMVOC, NH3 2B5a 2B2 NH3 2B5a 2B4 NMVOC 2B5a 2C2 All 1A2a 2C5f All 1A2b 4B3 NOx 4B1b 4B4 NOx 4B1b 4B6 NOx 4B1b 4B8 NOx 4B1b 4B9a NOx 4B1b 4B9b NOx 4B1b 4B9b TSP, PM10, PM2.5 4B9a 4B9c NOx 4B1b 4B9c NH3 4B9b 4B9c TSP, PM10, PM2.5 4B9a 4B9d NOx 4B1b 4B9d NH3 4B9b 4B9d TSP, PM10, PM2.5 4B9a 4B13 NOx 4B9a 4D1a NOx 4B9a 4D2 c NH3 4B 1B1a TSP, PM10, PM2.5 2G 3C NMVOC 2B5a
1.9 Missing sources
The Netherlands emission inventory covers all important sources.
Table 1.5 Sub-sources accounted for in reported ‘other’ codes, with ‘NO/NA’ meaning ‘not occurring or not applicable’.
NFR09 code Substance(s) reported Sub-source description
1A2f Combustion in industries not reported elsewhere, machineries, services, product making activities.
1A5a Combustion gas from landfills
1A5b NO/NA
1B1c NO/NA
1B3 NO/NA
2A7d Processes, excl. combustion, in building activties, production of building materials 2B5a Production of chemicals, paints, pharmaceutics, soaps, detergents, glues and other
chemical products.
2B5b NO/NA
2C5e Production of non-ferrous metals
2C5f Production of non-ferrous metals
2G Manufacturing of wooden, plastic, rubber, metal, textile and paper products.
3A3 NO/NA
4B13 NH3 Pets
4G NH3, TSP, PM10, PM2.5 Handling agricultural base materials and products
6D Handling waste
7A Smoking tobacco products (all substances, excl. NMVOC); transpiration, breathing, manure application to private domains and nature (NH3)
7B NO/NA
2.1 Trends in national emissions
The emissions of all substances showed a downward trend over the 1990-2009 period (see Table 2.1). The major overall drivers for this trend were:
• emission reductions in the industrial sectors; • cleaner fuels;
• cleaner vehicle engines.
Road transport emissions have decreased by 80% since 1990 for NMVOC, 51% for PM, 55% for NOx and 98% for
SO2, despite a growth in traffic of 35%. The decrease is
mainly attributable to European emission regulations for new road vehicles. For PM and NOx, standards have
been set for installations by tightening up the Dutch implementation of the ‘EU Large Combustion Plants Directive’(LCP), related to the extent of emissions from stocks of heating installations. In meeting these requirements, Dutch industrial plants have realised a reduction of 87% in PM emissions and 59% in NOx
emissions, since 1990. The drivers for the downward emission trend for specific substances are elaborated in more detail in the next section. For heavy metals and dioxins, information on division of sectors and trends has not been included, as information from the IIR2010 is still current.
2
Trends in
emissions
Table 2.1 Total national emissions, 1990-2009.
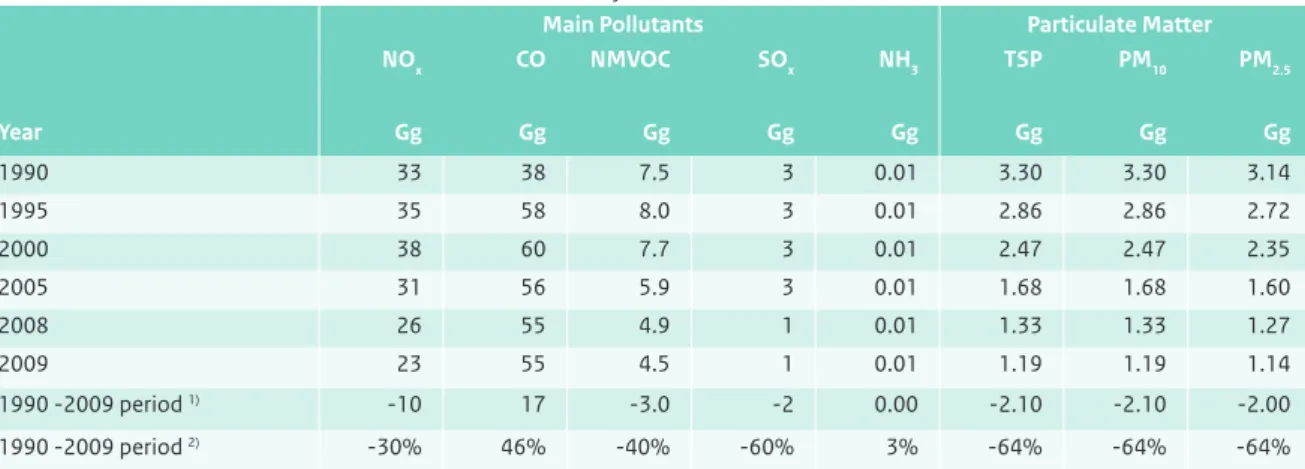
Main Pollutants Particulate Matter Priority Heavy Metals NOx CO NMVOC SOx NH3 TSP PM10 PM2.5 Pb Cd Hg Year Gg Gg Gg Gg Gg Gg Gg Gg Mg Mg Mg 1990 566 1119 464 192 355 90 67 44 336 2.1 3.5 1995 472 911 328 130 208 67 50 33 160 1.1 1.2 2000 398 755 232 73 161 45 39 24 34 0.9 0.9 2005 344 669 176 65 140 40 33 19 36 1.7 0.8 2008 303 649 164 51 126 38 32 17 37 1.9 0.8 2009 279 599 154 38 125 35 30 16 38 1.7 0.8 1990–2009 period 1) -287 -520 -310 -154 -230 -55 -38 -28 -298 -0.3 -2.7 1990 -2009 period 2) -51% -46% -67% -80% -65% -61% -56% -64% -89% -17% -77% 1) Absolute difference in Gg 2) Relative difference to 1990 in %
POPs Other Heavy Metals
DIOX PAH As Cr Cu Ni Se Zn Year g I-Teq Mg Mg Mg Mg Mg Mg Mg 1990 743 20.0 1.5 9.9 67.7 75.3 0.4 220.6 1995 69 9.7 1.0 6.6 70.4 86.6 0.3 141.8 2000 30 3.8 1.1 3.1 74.9 18.8 0.5 90.9 2005 38 3.8 1.5 2.2 79.3 10.7 2.4 84.0 2008 28 4.5 0.8 2.1 82.7 9.0 2.5 87.4 2009 29 4.1 0.8 1.5 84.0 2.9 0.9 89.4 1990–2009 period 1) -714 -15.9 -0.7 -8.4 16.3 -72.3 0.5 -131.2 1990–2009 period 2) -96% -79% -46% -85% 24% -96% 134% -59% 1) Absolute difference in Gg 2) Relative difference to 1990 in %
2.2 Trends in sulphur dioxide (SO
2)
The Dutch SOx emissions (reported as SO2) decreased by
154 Gg, in the 1990-2009 period, corresponding to 80% of the national total of 1990 (Figure 2.1). Main contributions to this decrease came from the energy, industry and transport sectors. The use of coal declined and major coal-fired electricity producers installed fluegas desulphurisation plants. The sulphur content in fuels used in the (chemical) industry and in transport was also reduced. At present, the industry, energy and refining sector (IER) are responsible for 90% of national SO2 emissions.
2.3 Trends in nitrogen oxides (NO
x)
The Dutch NOx emissions (NO and NO2, expressed as
NO2) decreased by 287 Gg, in the 1990–2009 period,
corresponding to 51% of the national total of 1990 (Figure 2.2). Main contributors to this decrease were the road-transport and energy sectors. The emissions per vehicle decreased significantly during this period, but the effect on total emissions was partially counterbalanced by an increase in number and mileages of vehicles. The share of the different NFR categories in the national total did not change significantly.
Figure 2.1. SO2 emission trend, 1990-2009.
1990 1995 2000 2005 2010 0 50 100 150 200 Gg 6 Waste 1A3 Transport 2 Industrial processes 1A2 Industrial & Small Combustion 1A1a Energy 1A1b Refining
SO
2emissions
Figure 2.2 NOx emission trend, 1990–2009.
1990 1995 2000 2005 2010 0 100 200 300 400 500 600 Gg Other 1A2 Industry 1A1 Energy 1A3 Transport
NO
xemissions
Figure 2.3 NH3 emission trend, 1990–2009. 1990 1995 2000 2005 2010 0 100 200 300 400 Gg Other 4 Other agricultural 4B9 Poultry 4B8 Swine 4B1 Cattle
NH
3emissions
2.4 Trends in ammonia (NH
3)
The Dutch NH3 emissions decreased by 230 Gg, in the
1990–2009 period, corresponding to 65% of the national total of 1990 (Figure 2.3). This decrease was due to emission reductions from agricultural sources. The direct emissions from animal husbandry decreased slightly, as a result of decreasing animal populations and measures to reduce emissions from animal houses. Application emissions decreased because of measures taken to reduce the emissions from applying manure to soil and to reduce the total amount of N applied to soil. At present, over 90% of Dutch NH3 emissions come from agricultural sources.
2.5 Trends in non-methane volatile
organic compounds (NMVOC)
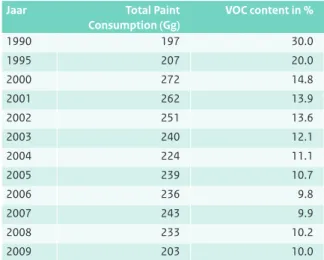
The Dutch NMVOC emissions decreased by 310 Gg, in the 1990–2009 period, corresponding to 67% of the national total of 1990 (Figure 2.4). All major source categories contributed to this decrease, for example, transport (introduction of catalysts and cleaner engines), product use (intensive programme to reduce NMVOC content in consumer products and paints) and industry (introducing emission abatement specifically for NMVOC).
Figure 2.4 NMVOC emission trend, 1990–2009.
1990 1995 2000 2005 2010 0 100 200 300 400 500 Gg Other 2 Industrial processes 3 Solvents 1A3 Transport
NMVOC emissions
2.6 Trends in PM
10Dutch PM10 emissions decreased by 38 Gg, in the 1990–
2009 period, corresponding with 56% of the national total of 1990 (Figure 2.5). The major source categories contributing to this decrease were:
• industry (combustion and process emissions), due to cleaner fuels in refineries and the side effect of emission abatement for SO2 and NOx , and • traffic and transport.
The emissions from animal husbandry in agriculture did not change significantly; neither did the emissions from consumers (1A4bi).
2.7 Trends in PM
2.5PM2.5 emissions are also included in the 2011 submission
to UNECE. These emissions are calculated as a specific fraction of PM10 per sector (based on Visschedijk et al.,
2007). PM2.5 emissions in the Netherlands decreased by
28 Gg, in the 1990–2009 period, corresponding with 64% of the national total of 1990 (Figure 2.6). The two major source categories contributing to this decrease were the industrial sector (combustion and process emissions), due to cleaner fuels in refineries and the side effect of emission abatement for SO2 and NOx , and the transport sector. Figure 2.5 PM10, emission trend, 1990–2009.
1990 1995 2000 2005 2010 0 20 40 60 80 Gg Other 4 Agriculture 1A3 Transport 1A1, 2, 3 Energy & Industry
PM
10emissions
Figure 2.6 PM2.5 emission trend, 1990–2009.
1990 1995 2000 2005 2010 0 10 20 30 40 50 Gg Other 1A3 Transport 2 Industrial processes 1A Energy
PM
2.5emissions
3.1 Overview of sector emissions
Emissions from this sector include all energy-related emissions from industrial activities and transport. Furthermore, they include fugitive emissions from the energy sector.
About 80% to 100% of the NOx, SO2, PM10 and NH3
emissions from stationary combustion (categories 1A1, 1A2, 1A4 and 1A5) are based on environmental by large industrial companies. The emission data in the Annual Environmental Reports (AERs) are from direct emission measurements or calculations based on fuel input and emission factors.
As for most developed countries, the energy system in the Netherlands is largely driven by the combustion of fossil fuels. In 2009, natural gas supplied about 45% of the total primary fuels used in the Netherlands, followed by liquid fuels (38%) and solid fossil fuels (9.6%). The contribution of non-fossil fuels, including renewables and waste streams, is rather limited. Figure 3.1 shows the energy supply and energy demand in the Netherlands.
3
3.2 Public Electricity and heat
production (1A1a)
3.2.1 Source category description
In this sector, one source category is included: Public Electricity and Heat Production [1A1a]. This sector consists mainly of coal-fired power stations and gas-fired cogeneration plants, with many of the latter being operated as joint ventures with industries. Compared to other countries in the EU, nuclear energy and renewable energy (biomass and wind) provide a small amount of the total primary energy supply in the Netherlands.
3.2.2 Key sources
Key sources in this sector are presented in Table 3.1.
3.2.3 Overview of shares and trends in
emissions
An overview of the trends in emissions is shown in Table 3.2. For almost all pollutants, emissions decreased between 1990 and 2009, while fuel consumption increased by 50% over the same period. The emissions from the main pollutants decreased by 45% to 86%, while emissions from other pollutants decreased by 67% to 99%. The only pollutant for which the emissions have increased is mercury. The decrease in emissions has partly
Figure 3.1 Energy supply and demand in the Netherlands, between1990 and 2009, only total fuel use is shown.
1990 1994 1998 2002 2006 2010 0 1000 2000 3000 4000 PJ NCV/year Nuclear energy Electricity Biomass and waste Solid fuels Liquid fuels Gaseous fuels Energy supply
Energy supply and demand
1990 1994 1998 2002 2006 2010 0 1000 2000 3000 4000 PJ NCV/year
Fuel use (total) Fuel use Energy Sector Fuel use Transport Fuel use Industry Sector
Fuel use Residential, Institutional and Commercial Transformation losses
Non-energy consumption Energy demand
Table 3.1 Key sources in the Public Electricity and heat (NFR 1A1a) sector. Category / Sub-category Pollutant Contribution to total of 2009 (%) 1A1a Public electricity and heat production SOx NOx Hg 16.1 8.6 15.1
been caused by a shift from coal to gas consumption.
3.2.4 Activity data and (implied) emission
factors
Emission data are based on Annual Environmental Reports and collectively estimated industrial sources. For this source category, 80% to 100% of the emissions are based on Annual Environmental Reports. For estimation of emissions from collectively estimated industrial sources, National Energy Statistics (from Statistics Netherlands) are combined with implied emission factors from the Environmental Reports.
3.2.5 Methodological issues
Emissions are based on data in Annual Environmental Reports (AERs) from individual facilities (Tier-3
methodology). The emissions and fuel consumption data in the AERs are systematically examined for inaccuracies by checking the resulting implied emission factors. If environmental reports provides data of high enough
quality, the information is used for calculating an ‘implied emission factor’ for a cluster of reporting companies (aggregated by SBI code) and the emission factor ER-I. These emission factors are fuel and sector dependent. EF ER-I (SBI category, fuel type) = Emissions ER-I (SBI category, fuel type)
Energy use ER-I (SBI category, fuel type)
where:
EF = emission factor
ER-I = Emission Registration database for individual companies
Next, total combustion emissions in this SBI category are calculated from the energy use according to the NEH (Netherlands Energy Statistics), multiplied by the implied emission factor.
Table 3.2 Overview of trends in emissions of 1A1a Public Electricity and Heat Production.
Main Pollutants Particulate Matter Priority Heavy Metals NOx CO NMVOC SOx NH3 TSP PM10 PM2.5 Pb Cd Hg Year Gg Gg Gg Gg Gg Gg Gg Gg Mg Mg Mg 1990 76 5 0.5 44 0.00 1.70 1.45 1.18 3.38 0.11 0.01 1995 59 7 0.6 16 0.00 0.89 0.56 0.34 0.28 0.00 0.00 2000 50 15 2.1 15 0.01 0.30 0.30 0.25 0.00 0.00 0.08 2005 41 7 0.5 10 0.21 0.78 0.50 0.42 0.07 0.00 0.18 2008 25 4 0.3 6 0.07 0.61 0.30 0.22 0.05 0.01 0.17 2009 24 3 0.3 6 0.03 0.56 0.33 0.24 0.04 0.03 0.12 1990 -2009 period 1) -52 -2 -0.2 -38 0.03 -1.14 -1.13 -0.94 -3.34 -0.08 0.11 1990 -2009 period 2) -69% -45% -47% -86% -67% -78% -80% -99% -70% 929%
1) Absolute difference in Gg 2) Relative difference to 1990 in %
POPs Other Heavy Metals
DIOX PAH As Cr Cu Ni Se Zn Year g I-Teq Mg Mg Mg Mg Mg Mg Mg 1990 1.01 0.17 0.43 0.24 0.74 1.48 0.00 7.04 1995 0.00 0.05 0.12 0.08 0.16 0.71 0.00 0.79 2000 0.00 0.00 0.00 0.02 0.05 0.00 0.37 0.14 2005 0.00 0.01 0.12 0.20 0.17 1.86 1.40 0.42 2008 0.02 0.00 0.05 0.12 0.20 1.18 0.77 2.24 2009 0.19 0.01 0.04 0.06 0.08 0.10 0.83 1.07 1990 -2009 period 1) -0.82 -0.16 -0.39 -0.18 -0.66 -1.38 0.83 -5.96 1990 -2009 period 2) -81% -92% -90% -76% -90% -93% -85%
ER-I_SBI_emission (SBI category, fuel type) = EF ER-I (SBI category, fuel type)
* Energy NEH (SBI category, fuel type)
3.2.6 Uncertainties and time-series consistency
Uncertainties are explained in Section 1.7.3.2.7 Source-specific QA/QC and verification
The emissions and fuel consumption data in the AERs are systematically examined for inaccuracies by checking the resulting implied emission factors. If environmental reports provide data of high enough quality (see Section 1.3 on QA/QC), the information is used.3.2.8 Source-specific recalculations
There were no source-specific recalculations in this submission.3.2.9 Source-specific planned improvements
There are no source-specific planned improvements.3.3 Industrial Combustion (1A1b, 1A1c
and 1A2)
3.3.1 Source category description
This source category consists of the following categories: • 1A1b ‘Petroleum refining’
• 1A1c ‘Manufacture of solid fuels and other energy industries’
• 1A2a ‘Iron and Steel’ • 1A2b ‘Non-ferrous Metals’ • 1A2c ‘Chemicals’
• 1A2d ‘Pulp, Paper and Print’
• 1A2e ‘Food Processing, Beverages and Tobacco’ • 1A2fi ‘Other’
The sector 1A2fi includes industries for mineral products (cement, bricks, other building materials, glass), textiles, wood and wood products, machinery.
3.3.2 Key sources
Key sources in this sector are presented in Table 3.3.
3.3.3 Overview of shares and trends in
emissions
An overview of the trends in emissions is shown in Table 3.4. Emissions have reduced since 1990 for most pollutants, except for some heavy metals and for dioxins. Reduction in emissions of main pollutants has been
Table 3.3 Key sources in the Industrial Combustion (NFR 1A1b,
1A1c and 1A2) sector.
Category / Sub-category Pollutant Contribution to total in 2009 (%) 1A1b Petroleum refining SOx NMVOC 47.1 3.7 1A1c Manufacture of
solid fuels and other energy industries
-
-1A2a Stationary combustion in
manufacturing industries and construction: Iron and steel SOx CO 6.2 10.6 1A2b Stationary Combustion in manufacturing industries and construction: Non-ferrous metals Dioxins 5.7 1A2c Stationary combustion in manufacturing industries and construction: Chemicals SOx NOx Cd Dioxins 5.9 4.0 37.9 4.7 1A2d Stationary combustion in manufacturing industries and construction: Pulp, Paper and Print
-
-1A2e Stationary combustion in
manufacturing industries and construction: Food processing, beverages and tobacco
-
-1A2fi Stationary combustion in
manufacturing industries and construction: Other
caused by improvement in used techniques. Increases in some other pollutants have been caused by increases in fuel use.
3.3.4 Activity data and (implied) emission
factors
Petroleum refining (1A1b)
All emission data have been based on Annual Environmental Reports.
Manufacture of solid fuels and other energy industries (1A1c)
Emission data have been based on Annual Environmental Reports and collectively estimated industrial sources.
Iron and steel (1A2a)
All emission data have been based on Annual Environmental Reports and registered in the ER-I database.
Non-ferrous metals (1A2b)
Emission data have been based on Annual Environmental Reports and collectively estimated industrial sources. For this source category, the percentage of SO2 emissions,
based on annual reports, is 100%.
Chemicals (1A2c)
Emission data have been based on Annual Environmental Reports and collectively estimated industrial sources. For this source category, the percentages of emissions based on annual reports are about 100% for SO2, 90% for NOx,
75% for CO and 100% for Pb, Cd and dioxins.
Pulp, paper and print (1A2d)
All emission data have been based on Annual Environmental Reports and registered in the ER-I database.
Food processing, beverages and tobacco (1A2e)
Emission data have been based on Annual Environmental Reports and collectively estimated industrial sources.
Table 3.4 Overview of trends in emissions in Industrial Combustion.
Main Pollutants Particulate Matter Priority Heavy Metals NOx CO NMVOC SOx NH3 TSP PM10 PM2.5 Pb Cd Hg Year Gg Gg Gg Gg Gg Gg Gg Gg Mg Mg Mg 1990 94 230 22.0 105 0.58 8.95 8.12 5.01 1.89 0.14 0.18 1995 74 182 17.4 87 0.32 7.00 6.67 4.32 4.27 0.20 0.08 2000 46 116 9.1 43 0.05 6.37 6.26 4.26 0.04 0.01 0.20 2005 49 106 12.2 45 0.06 2.09 1.88 1.44 0.01 0.00 0.00 2008 45 144 10.1 38 0.76 2.14 1.63 1.21 1.27 0.78 0.02 2009 38 96 8.6 26 0.57 1.19 0.91 0.65 1.69 0.67 0.02 1990 -2009 period 1) -56 -133 -13.5 -79 0.00 -7.75 -7.21 -4.36 -0.20 0.53 -0.16 1990 -2009 period 2) -59% -58% -61% -76% -1% -87% -89% -87% -11% 386% -90%
1) Absolute difference in Gg 2) Relative difference to 1990 in %
POPs Other Heavy Metals
DIOX PAH As Cr Cu Ni Se Zn Year g I-Teq Mg Mg Mg Mg Mg Mg Mg 1990 0.01 1.06 0.17 2.49 1.39 64.63 0.04 2.95 1995 1.02 0.42 0.23 3.14 2.82 79.44 0.05 58.96 2000 1.75 0.04 0.00 0.51 0.15 17.42 0.00 24.28 2005 7.87 0.13 0.78 0.08 0.09 6.51 0.08 0.49 2008 2.39 0.20 0.02 0.31 1.07 5.76 0.00 4.84 2009 5.16 0.21 0.01 0.10 1.07 1.40 0.01 9.11 1990 -2009 period 1) 3.11 -0.85 -0.16 -2.39 -0.32 -63.23 -0.04 6.17 1990 -2009 period 2) -80% -94% -96% -23% -98% -87% 209%
Other (1A2f)
This sector includes all combustion emissions from the industrial sectors not belonging to the categories 1A2a to 1A2e. Emission data have been based on Annual Environmental Reports and collectively estimated industrial sources.
For some of the above mentioned categories, emissions were not entirely available from the AERs. For these sectors, emissions were calculated using National Energy Statistics (NEH) and implied emission factors from the environmental reports.
3.3.5 Methodological issues
For all sectors, emissions have been based on data in AERs from individual facilities (Tier-3 methodology). The emissions and fuel consumption data in AERs were systematically examined for inaccuracies by checking the resulting implied emission factors. If environmental reports provided data of high enough quality, the information was used for calculating an ‘implied emission factor’ for a cluster of reporting companies (aggregated by SBI code) and the emission factor ER-I. These emission factors are fuel and sector dependent.
EF ER-I (SBI category, fuel type) = Emissions ER-I (SBI category, fuel type) Energy use ER-I (SBI category, fuel type)
where:
EF = emission factor
ER-I = Emission Registration database for individual companies
Total combustion emissions in this SBI category have been calculated from the energy use in the NEH (Netherlands Energy Statistics), multiplied by the implied emission factor.
ER-I_SBI_emission (SBI category, fuel type) = EF ER-I (SBI category, fuel type)
* Energy NEH (SBI category, fuel type)
3.3.6 Uncertainties and time-series consistency
Uncertainties are explained in Section 1.7.3.3.7 Source-specific QA/QC and verification
The emissions and fuel consumption data in the AERs were systematically examined for inaccuracies by checking the resulting implied emission factors. If the environmentalreports provided data of high enough quality (see Section 1.3 on QA/QC), the information was used.
3.3.8 Source-specific recalculations
There were no source-specific recalculations in this submission.3.3.9 Source-specific planned improvements
There are no source-specific planned improvements.3.4 Small Combustion (1A4ai, 1A4bi,
1A4ci and 1A5a)
3.4.1 Source-category description
Source category 1A4 ‘Other sectors’ comprises the following subcategories:• 1A4ai ‘Commercial and Institutional Services’. This sector comprises commercial and public services, such as banks, schools and hospitals, trade, retail and communication.It also includes the production of drinking water and miscellaneous combustion emis-sions from waste handling activities and from waste-water treatment plants.
• 1A4bi ‘Residential’. This sector refers to domestic fuel consumption for space heating, water heating and cooking. About three-quarters of the sector’s consump-tion of natural gas is used by space heating.
• 1A4ci ‘Agriculture, Forestry and Fisheries’. This sector comprises stationary combustion emissions from agriculture, horticulture, greenhouse horticulture, cattle breeding and forestry.
• 1A5a ‘Other stationary’. This sector includes stationary combustion of waste gas from dumping sites.
3.4.2 Key sources
3.4.3 Overview of shares and trends in
emissions
An overview of the trends in emissions is shown in Table 3.6. Emissions of all pollutants have decreased since 1990, while fuel use increased only slightly (4%).
Table 3.5 Key sources in the Small Combustion (NFR 1A4 and 1A5) sector.
Category / Subcategory Pollutant Contribution to total of 2009 (%)
1A4ai Commercial/institutional, stationary NOx 4.4
1A4bi Residential, stationary NOx
NMVOC CO TSP PM10 PM2.5 Dioxins PAH 4.8 6.1 9.4 9.9 5.5 9.7 19.5 69.9
1A4ci Agriculture/forestry/fishing, stationary NOx 3.9
-3.4.4 Activity data and (implied) emission
factors
Commercial/institutional (1A4ai)
Combustion emissions from the commercial and institutional sector have been based on fuel consumption data (Statistics Netherlands) and emission factors (see Table 3.7).
Residential (1A4bi)
Combustion emissions from central heating, hot water and cooking have been based on fuel consumption data (Statistics Netherlands) and emission factors (see Table 3.8). The fuel mostly used in this category is natural gas. The use of wood in stoves and fireplaces for heating is almost negligible.
Table 3.6 Overview of trends in emissions in Small Combustion.
Main Pollutants Particulate Matter Priority Heavy Metals NOx CO NMVOC SOx NH3 TSP PM10 PM2.5 Pb Cd Hg Year Gg Gg Gg Gg Gg Gg Gg Gg Mg Mg Mg 1990 14 3 1.1 2 0.37 0.34 0.30 0.63 0.03 0.09 0.09 1995 14 3 1.1 1 0.08 0.07 0.06 0.03 0.00 0.00 0.00 2000 13 2 0.9 1 0.03 0.03 0.03 0.00 0.00 0.00 0.00 2005 12 3 1.1 0 0.10 0.09 0.07 0.01 0.00 0.00 0.00 2008 12 3 1.3 0 0.08 0.06 0.05 0.00 0.00 0.00 0.00 2009 12 3 1.3 0 0.06 0.06 0.05 0.00 0.00 0.00 0.00 1990–2009 period 1) -1 0 0.1 -2 -0.31 -0.29 -0.25 -0.63 -0.03 -0.09 -0.09 1990–2009 period 2) -10% 12% 9% -92% -83% -83% -82% -100% -99% -99% -99%
POPs Other Heavy Metals
DIOX PAH As Cr Cu Ni Se Zn Year g I-Teq Mg Mg Mg Mg Mg Mg Mg 1990 100.02 0.47 0.01 3.53 0.39 2.94 1.14 1.14 1995 0.20 0.06 0.01 0.05 0.03 0.83 0.04 0.04 2000 0.00 0.00 0.00 0.00 0.00 0.00 0.00 0.00 2005 0.01 0.01 0.00 0.01 0.01 0.31 0.02 0.02 2008 0.01 0.01 0.00 0.00 0.00 0.06 0.01 0.01 2009 0.01 0.01 0.00 0.00 0.00 0.12 0.01 0.01 1990–2009 period 1) -100.01 -0.46 -0.01 -3.52 -0.39 -2.82 -1.13 -1.13 1990–2009 period 2) -100% -98% -92% -100% -99% -96% -99% -99%
1) Absolute difference in Gg 2) Relative difference to 1990 in %
Table 3.7 Emission factors for stationary combustion emissions from the services sector and agriculture (g/GJ).
Natural gas Domestic fuel oil LPG Paraffin oil Coal Oil fuel
VOC 30 10 2 10 35 10 SO2 0.22 87 0.22 4.6 460 450 NOx 1) 50 40 50 300 125 CO 10 10 10 10 100 10 Carbon black 5 10 2 50 Fly ash 100 PM10 0.15 4.5 2 1.8 2 45 PM coarse 0.5 0.2 80 5 1) see table on NO