A NEW ADOPTION MODEL FOR MOBILE
BANKING IN FLANDERS
EXPANDING UTAUT2 WITH A MULTI-FACETED RISK FACTOR
Word count: 14316
Stanny Deweer
Student number: 01403903Supervisor: Prof. Dr. Mirjam Knockaert
Master’s Dissertation submitted to obtain the degree of:
Master in Business Engineering: Finance
II
I
Permission
I declare that the content of this Master’s Dissertation may be consulted and/or reproduced, provided that the source is referenced. Student’s name: Stanny DeweerII
Preface
I would like to use this section to thank all the people that made this master’s thesis possible. This master’s thesis was made in the context of getting my master’s degree in Business Engineering (Finance). First of all, I would like to thank my promotor, Prof. Dr. Knockaert for the opportunity to do my master’s thesis with her guidance and expertise there to support me. Secondly, I want to thank my mother for the opportunity to attend Ghent University and pursue higher education. Thirdly, I want to thank all the people behind De Warmste Week and Kom Op Tegen Kanker, not only for providing me with a framework to gather my data, but most of all for their inspiring devotion to help other people and make the world a better place. This gratitude also extends to everyone at the event that agreed to participate in this study. Last (but not least) I want to thank the following people for their support: Gilles Deleersnyder, Joris Van Dorpe, Steve Van Herreweghe and Annelies Vansintjan. Stanny Deweer, June 2020III
Table of contents
Permission ... I Preface ... II Table of contents ... III List of used abbreviations ... V List of tables ... VI List of figures ... VII Introduction ... 1 Literature review Mobile banking ... 4 Social relevance ... 5 Adoption models ... 6 Overview of comparative studies ... 17 Academic relevance ... 19 Conceptual model and hypothesis development ... 20 Main research question ... 20 Sub-question 1 ... 21 Sub-question 2 ... 24 Sub-question 3 ... 25 Methodology ... 28 Instrument ... 28 Procedure ... 29 Data analysis technique ... 29 Results ... 30 Participants’ profile ... 30 Common method bias ... 31 Multicollinearity ... 32 Second-order factor Perceived Risk ... 32 Content validity ... 33 Internal validity ... 33 External validity ... 33 Measurement model ... 34 Convergent validity ... 34 Internal consistency ... 35 Reliability (CR & AVE) ... 35 Discriminant validity ... 35 Structural model and hypothesis testing ... 36 Discussion ... 37 Factors affecting Behavioral Intention ... 38 Factors affecting Usage ... 40IV Perceived Risk ... 41 Practical implications ... 42 Conclusion ... 44 Limitations and future research ... 45 Reference list ... I Attachements ... IX Appendix 1: Qualtrics ... IX Appendix 2: Item list ... XXII Appendix 3: Demographics SPSS ... XXV Appendix 4: Harman’s single factor test ... XXVIII Appendix 5: VIF ... XXX Appendix 6: Correlation matrix for first-order risk factors ... XXXI Appendix 7: Factor Loadings ... XXXII Appendix 8: R Square ... XXXIII Appendix 9: R Square of UTAUT2 only ... XXXIII
V
List of used abbreviations
ATM Automated Teller Machine AVE Average Variance Extracted BI Behavioral Intention CR Composite Reliability DTPB Decomposed Theory of Planned Behavior EE Effort Expectancy FC Facilitating Conditions FR Financial Risk HM Hedonic Motivation HT Habit IDT Innovation Diffusion Theory IS Information Systems IT Information Technology MM Motivational Model MPCU Model of PC Utilization OR Overall Risk PC Personal Computer PE Performance Expectancy PERR Performance Risk PLS Partial Least Squares PR Perceived Risk PRR Privacy Risk PV Price Value SCT Social Cognitive Theory SEM Structural Equation Modeling SI Social Influence SMS Short Message Service TAM Technology Acceptance Model TPB Theory of Planned Behavior TR Time Risk TRA Theory of Reasoned Action US Usage UTAUT Universal Theory of Acceptance and Use of Technology UTAUT2 Universal Theory of Acceptance and Use of Technology 2 VIF Variance Inflation FactorVI
List of tables
Table 1: Comparative studies ... 18 Table 2: Demographics ... 30 Table 3: Path coefficients for Risk factors. ... 33 Table 4: Cronbach’s alpha, CR and AVE ... 34 Table 5: Correlation matrix ... 35 Table 6: Path coefficients ... 36VII
List of figures
Figure 1: Theory of reasoned action. Source: Ajzen & Fishbein (1980) ... 7 Figure 2: Theory of planned behavior. Source: Ajzen (1991) ... 9 Figure 3: Social cognitive theory. Source: Compeau & Higgins (1995b) ... 11 Figure 4: Innovation diffusion model. Source: Moore & Benbasat (1996) ... 13 Figure 5: Unified Theory of Acceptance and Use of Technology. Source: Venkatesh et al. (2003) ... 14 Figure 6: Unified Theory of Acceptance and Use of Technology 2. Source: Venkatesh et al. (2012) ... 16 Figure 7: Proposed research model. UTAUT2 + multi-faceted risk ... 20 Figure 8: Results of PLS ... 371
Introduction
Banks are carrying out a digital transformation to reach their clients, which allows them to both gain a competitive advantage and reduce costs in a very competitive market. (Alalwan, Dwivedi, Rana, & Algharabat, 2018). The banks hope to increase customer loyalty and satisfaction by implementing superior IT services, with mobile banking being the most important category to try so (Baabdullah, Alalwan, Rana, Kizgin, & Patil, 2019). On the other hand, banks are heavily reducing the number of traditional branches in an attempt to reduce the high costs associated with human encounter. For example, Febelfin calculated that in the last 10 years the number of branches in Belgium has halved (“Facts & Figures”, 2014, 2018), yet the network of branches is still oversized compared to the rest of Europe (“Disappearance of bank branches in Belgium”, 2018). Therefore, this trend is expected to continue even further. In addition, financial institutions also continue to raise prizes for these traditional services to further push consumers to use their digital alternatives (Tam & Oliveira, 2016). The most important alternative that banks now provide is mobile banking, which is significantly different to its predecessors, even online banking. While online banking is limited to providing financial services on desktop PC’s and laptops, mobile banking provides the same features in a more convenient and flexible experience through smartphone or tablet. Features like bill payments, fund transfers, balance enquiry and checking on investment portfolios can be accessed at any place and any time (Shaikh & Karjaluoto, 2015). When compared to traditional financial services, the advantages of mobile banking become even more apparent. Not only does it provide customers with a better view of their bank status (“Mobiele apps doen Belgen bewuster bankieren”, 2019), it also enhances the operational efficiency of the bank as a whole (Shaikh, 2013). As a result, mobile banking provides opportunities that go far beyond an increase in mobility. Even though a key aspect for the successful implementation of mobile banking, enabling technologies, seems to be largely in place, the adoption of this application seems to be subpar as of yet. Indeed, smartphones and tablets have become widely available and used in everyday life. According to a report from Deloitte (“Mobile Consumer Survey”,2018), 84% of people in Belgium owns a smartphone, even surpassing the penetration rate of laptops, which stand at2 82%. It is clear that the vast majority of consumers are becoming tech savvy enough to use mobile banking successfully. Even in developing countries, where access to technology often is a challenge, more and more people possess a smartphone as their sole type of electronic device. Nevertheless, the actual adoption of mobile banking seems to be subpar when comparing it to the push of the mobile technologies it uses (Dineshwar & Steven, 2013; Baabdullah et al., 2019). A lot of research has since investigated the key factors that encourage or even halt the adoption of mobile banking. Despite this field of adoption modeling being rich and mature, there is a clear lack of insight that is applicable to the mobile banking context in Flanders. Firstly, most studies focus on developing countries, which have different characteristics compared to European countries (Alalwan et al., 2018). As mentioned before, people in developing countries have less access to online banking than mobile banking. Besides, these countries often completely lack a dense network of traditional bank branches which could mean mobile banking is their only real option. Secondly, the majority of these studies has been conducted in settings where only pioneers like students, or IT engineers were surveyed. This could hinder the ability to come to conclusions about the whole population. Thirdly, when considering the parsimony of the adoption model, studies often disregard the different types of risk. This means the importance of security, data protection and privacy is overlooked, despite multiple studies finding their relevant importance in the adoption process (Luo, Li, Zhang, & Shim, 2010; Dwivedi, Rana, Janssen, Lal, Williams, & Clement, 2017). Altogether there is a clear need for a broad study that examines the mobile banking adoption characteristics in Flanders. With this in mind, this study aims at developing a new adoption model for mobile banking, based on UTAUT2 with a multi-faceted risk factor. This model is then used in a survey in Flanders. It is not in the scope of this study to conduct a similar experiment in Wallonia because subtle differences in the different languages would make it needlessly complex to guarantee consistency between multiple surveys. The model that will be used is based on the UTAUT2 model, which is specifically developed for the consumer context (Venkatesh, Thong, & Xu, 2012). Venkatesh et al. (2012) also suggest expanding the model with additional factors. Hence, this model adds a multi-faceted risk factor, derived from Luo et al. (2010). With all these characteristics, the model adds to the literature by testing a novel model in the uncharted context of mobile banking adoption in Flanders. Furthermore, since mobile banking in Flanders is not in its infancy stage anymore, this model can better map the
3 relationship between the actual behavior regarding mobile banking and its determining factors. The remainder of this study is structured as follows: Firstly, a literature review depicts both mobile banking and the evolution of adoption theory modeling. It is important to show how each preceding model in adoption theory is a base for the type that is used in this research and how they are all connected. Secondly, all factors used in this model are explained and suggested relationships between them are clarified to justify how this new model is built. Thirdly, the methodology describes in detail how data was collected through surveys and processed via structural equation modeling. Next, the results of the data analysis are discussed, and practical implications are given for decision makers. Afterwards the conclusions from this study are drawn. Finally, limitations and suggestions for future research are taken into account.
4
Literature review
Mobile banking
Mobile banking is not the first alternative channel banks offer their clients in addition to their network of traditional branches. One of the first additional channels offered by the banks, Automated Teller Machines, dates back as early as the 1960s. This enables customers to access most of their financial services on a device that is not restricted by business hours. This local-centric focus then changed to a more place-centric vision with the emergence of online banking (Hoehle, Scornavacca, & Huff, 2012). Wherever a customer has access to a desktop PC would allow him or her to do their financial transactions. The most recent shift in focus comes through the arrival of mobile banking. This leads to an equipment-centric focus that can offer the bank its service through every portable device the customer has (Hoehle et al., 2012). As a result of all of this, financial institutions now have the ability to offer multi-channel services, which will only benefit the relationship between them and their clients (Laukkanen, 2007). The history and development of mobile banking dates back to the late 1990s, when one of the first systems that can be classified as mobile banking, Paybox, is launched (Shaikh & Karjaluoto, 2015). This is an SMS-based service that could be accessed via cell phones. Later, this type of technology became very popular in Africa too, where customers often lack an accessible network of branches. For instance, the emergence of M-Pesa, an SMS-based system in Kenya, gave more than 7 million people access to financial services within its first five years alone (Shaikh & Karjaluoto, 2015). It is only through the emergence of smartphones and tablets that mobile banking could evolve in a more elaborate service channel that was much more capable than simple SMS-based systems. Now, mobile banking applications offer a vast array of features to customers that incorporate financial services as well as non-financial services. The former includes automatic bill payment, m-commerce payment possibility, fund transfers, payments between friends and families, standing orders and many more. The latter entails checking balances, managing card settings, checking business hours for closest branches, locating ATMs, calling your agent and managing investment portfolios. However, notwithstanding the fact that these applications have become a very capable service channel, there is still a tendency from customers to prefer traditional branches when it comes to complex product categories (Hoehle et al., 2012). As a5 result, traditional bank branches are becoming hubs where specialists offer their expertise for the most complex cases regarding loans, insurances and investments. Consequently, banks are systematically raising the fees for simple transactions performed at those branches, to encourage switching over to their online or mobile alternative (Tam & Oliveira, 2016). This trend should be seen in the bigger picture of the total impact mobile banking has on the banking sector. Mobile banking is not only an alternative delivery channel, it is an innovative communication channel, that lets customers and banks interact in a deeper, more meaningful way (Akturan & Azcan, 2012). Financial institutions now have the ability to collect data and finetune their services accordingly. They hope these new insights will increase customer satisfaction and thereby increase customer retention (Baabdullah et al., 2018). From an internal perspective on the other hand, mobile banking reduces costs, increases operational efficiency, creates new employment opportunities and gives an opportunity for cross-selling (Hoehle et al., 2012; Shaikh & Karjaluoto, 2015; Tam & Oliveira, 2016). For instance, a simple bill payment would no longer require a bank clerk to be available in a costly building in every city. This network of branches could then be reduced to a smaller group of specialized hubs, while part of the now redundant staff could be relocated into app development and support.
Social relevance
In this part, the study would like to stress the importance of mobile banking. It is not just a vital segment for a strong business model in theory anymore. Mobile baking is gaining momentum and a shift towards mobile technology acceptance by consumers is already well under way. For example, in Belgium 84% of people own a smartphone. This is even slightly more than the penetration rate of laptops, which sits at 82% (“Mobile Consumer Survey”,2018). More specificly, in the context of mobile banking another survey led by Deloitte (“EMEA Digital Banking Maturity”, 2018) shows that Belgians already have a mobile first preference for 45% of financial and non-financial activities that are provided by the financial sector. This suggests that consumers are looking beyond simple transactions or fund transfers when looking at mobile banking capabilities. As a consequence of this digital transformation, the banking sector not only gains new progressive banks that are mobile only, it also gains new competitors from the tech sector itself. Tech firms like Apple, Google and Samsung now offer their own card and mobile payment possibilities and people are giving them a fair chance. An American report by6 Deloitte (“Consumer banking survey”,2020) shows that 49% of respondents would use financial services offered by Amazon. These companies also have a far better understanding of how data can give them the edge in understanding consumer behavior. Consequently, a bank could have a superior application compared to other banks but could still lose out in the long turn because of these new competitors if it does not map its customers’ behavior properly. Moreover, the impact of the Covid-19 could truly accelerate the adoption and importance of mobile banking. However, some nuance needs to be added here. One could think that during the lockdown there would already be a rise in traffic and engagement. Yet, a report by D-Rating (“Evolution of the use of mobile banking”, 2020), a digital performance agency, shows a general downwards trend for these aspects in Spain, France, Italy and the UK during the first 8 weeks of the lockdown. A possible explanation for this could be that the lockdown not only paralyzed social life, but activity in general. Therefore, it would be logical that mobile banking activity slowed down as well. In short, while the pandemic has a negative influence now because of the lockdown, expect the use of remote services to be accelerated in the long run. All things considered, mobile banking is considered as one of the most important strategic transformations in the sector, as it is changing the face of retail banking for good (Ensor & Wannemacher, 2012; Tam & Oliveira, 2016). It is not just online banking on a smartphone anymore. In fact, it is evolving into an innovative communication channel that will sit at the heart of the relationship between bank and client (Akturan & Azcan, 2012; Ensor & Wannemacher, 2012). A deep understanding of what factors shape consumers their intentions and actual behavior towards this technology is thus a vital insight for decision makers in the banking sector. In spite of this, there is a lack of academic research that is suitable for the Flemish banking sector. Even in other comparable countries, like other Member States of the European Union, the amount of research regarding adoption models applied to mobile banking is sparse. Therefore, this study aims at filling this gap.
Adoption models
Models can not only use different factors to map out adoption but can also choose which dependent variables best translate to the adoption rate. When making the adoption of new technological services more attractive, it is essential to carefully select those factors that7 significantly impact the relevant dependent variables (Kuisma, Laukkanen, & Hiltunen, 2007; Baabdullah, Alalwan, & Al Qadi, 2018). A multitude of models have successfully mapped out these factors within the Information Systems context. For instance, the task technology fit model looks at how the characteristics of a task fit with the characteristics of a technology service that can help with that task, to plot how heavily this impacts the intention to use the technology (Goodhue & Thompson, 1995). In the same way, the initial trust model looks at all the factors that influence the initial trust of a consumer in an IS context to predict the intention to adopt the technology (Kim & Prabhakar, 2004). However, this literature review focuses on the vast majority of models where intention and usage are the main dependent variables, since these are present in this study as well. This chapter shows the evolution of how a general model from the field of psychology developed into an elaborate build for purpose model in the consumer context of IT. TRA
Figure 1: Theory of reasoned action. Source: Ajzen & Fishbein (1980)
One of the first ever theories to explain individual acceptance of technology through intention and usage is the theory of reasoned action (Fishbein & Ajzen, 1975; Ajzen & Fishbein, 1980). Based in social psychology, this study explains human behavior as a consequence of behavioral intention (see Figure 1). This intention is based upon the combination of the attitude towards the behavior and the subjective norm surrounding the individual (Venkatesh et al., 2003). While the construct of attitude refers to the feeling the individual has about performing the behavior, social norm is a construct that defines whether the individual believes his or her environment approves of this behavior. Accordingly, this model shows how
8 salient beliefs and information can affect not only intentions, but also the actual behavior through attitudes and social norms (Dwivedi et al., 2017). Sheppard et al. (1988) find that the theory possesses a strong predictive utility across multiple contexts. These contexts range from politics (Jaccard, Knox, & Brinberg, 1979) and healthcare (Davidson & Morrisson, 1983) to marketing (Ryan, 1982). In spite of the broad and successful application, it is important to note the theory is often criticized for not being falsifiable, which would render it a bad theory (Greve, 2001; Ogden, 2003; Smedslund, 2000). However, this issue has been overturned by Trafimow (2009), who points out it is indeed falsifiable under reasonable assumptions. TAM Later, Davis (1989) expands the TRA to specifically fit IS contexts (Mathieson, Peacock, & Chin, 2001). The main goal of this new theory, the technology acceptance model, is to predict information technology acceptance and usage of a variety of end-user computing technologies (Dwivedi et al., 2017). This model extends the construct of attitude by using two new constructs, perceived usefulness and perceived ease of use. Perceived usefulness is defined as “the degree to which a person believes that using a particular system would enhance his or her job performance” (Davis, 1989, p. 320). Perceived ease of use, on the other hand, refers to “the degree to which a person believes that using a particular system would be free of effort” (Davis, 1989, p. 320). In addition, this theory also posits that perceived ease of use predicts perceived usefulness as well. Due to the parsimony of this model, it has been very popular in IS contexts and empirical support for the constructs has been found in multiple studies since (Agarwal & Prasad, 1999). However, this parsimony has also been one of its biggest limitations (Davis, Bagozzi, & Warshaw, 1989). Moon & Kim (2001) suggest that these 2 constructs are not able to fully explain the acceptance of technology. Likewise, Venkatesh & Davis (2000) point out that the model lacks essential economic and demographic factors, as well as external variables that could prevent the use of IS (Mathieson et al., 2001). This is why the most recent studies that use TAM also incorporate additional constructs. For example, Luarn & Lin (2005) extend the technology acceptance model with perceived credibility, perceived self-efficacy and perceived financial cost to predict the adoption of mobile banking in Taiwan. Similarly, Koufaris (2002)
9 adds product involvement and perceived enjoyment to understand online consumer behavior. In short, the TAM proves to be a better fit in the IS context than the general TRA, but its parsimony means additional factors are still necessary. TPB
Figure 2: Theory of planned behavior. Source: Ajzen (1991)
Meanwhile, Ajzen (1991) extends the original TRA to include a new construct called perceived behavioral control. This new construct measures how easy or difficult the targeted job would seem to be for the individual to perform (Ajzen, 1991), or in the IS context it resembles “perceptions of internal and external constraints on behavior” (Taylor & Todd, 1995a, p. 149). In combination with the initial constructs, attitude and subjective norm, the newly formed model is named the theory of planned behavior (see Figure 2). Armitage & Conner (2001) find evidence for this model its predictive power across numerous fields, especially for the newly introduced construct of perceived behavioral control. Even though the TPB is still not designed specifically for IS context, it has been relatively successful in understanding individual intention and behavior towards accepting a wide variety of technologies
10 (Mathieson, 1991; Taylor & Todd, 1995a; Harrison, Mykytyn, & Riemenschneider, 1997). Nevertheless, multiple studies show that the TPB is still inferior in this context compared to the technology acceptance model due to the TAM its parsimony and more optimal fit to the specific context (Luarn & Li, 2005). In addition, each new situation would require a new implementation of the TPB (Mathieson et al., 2001), making the model less user-friendly to implement. DTPB Instead of comparing these two competing models of TAM and TPB, Taylor & Todd (1995b) suggest combining the two to gain a deeper understanding of all the possible factors influencing technology adoption in IS contexts. In this case, the TPB beliefs of attitude, subjective norms and perceived behavioral control are decomposed into several multi-dimensional belief constructs, including perceived ease of use and perceived usefulness, which originated from the TAM (Rana, Dwivedi, Lal, & Williams, 2015). 13 constructs in total are combined to make up a rather complex model, tailored to the IS context. As a result, numerous studies find evidence for the model its predictive power, including in the contexts of e-commerce (Lim & Dubinsky, 2005; Lin, 2007), online banking (Shih & Fang, 2004) and internet usage (Choudrie & Dwivedi, 2006). Despite being more elaborate than the parsimonious TAM, Chau & Hu (2001) still find that the DTPB is not significantly better at explaining behavioral intention, as having more constructs does not automatically translate into a better predictive power.
11
SCT
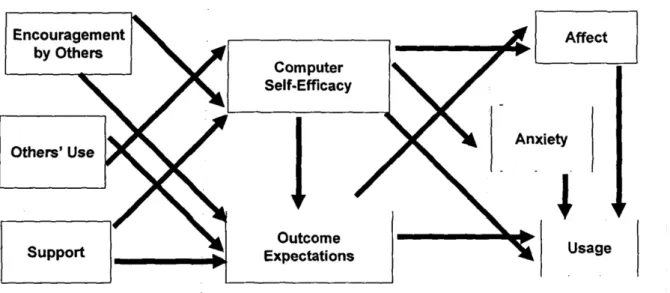
Figure 3: Social cognitive theory. Source: Compeau & Higgins (1995b)
Another model that is used to explain usage stems from the social cognitive theory, one of the strongest general theories to study human behavior (Bandura, 1986). To better fit the computer context, Compeau & Higgins (1995a) adapted the theory to first predict performance of computers. Next, they used the theory to understand computer utilization too (Compeau & Higgins, 1995b). Even though they focus on the context of computers, the theory behind it allows the model to be used for the acceptance and use of IT in general (Venkatesh et al., 2003). Their version of the SCT uses the following factors to predict IT usage: computer self-efficacy, outcome expectations (which later is split up into personal and performance expectations), affect and anxiety (see Figure 3). Firstly, computer self-efficacy is determined as the judgement of the individual as to whether he or she is capable to successfully use a computer to perform the task (Compeau & Higgins, 1995b). Secondly, outcome expectations (performance) reflects whether computers could add efficiency and effectiveness to the job performance. Similarly, outcome expectations (personal) considers the possible gains in esteem, image and sense of accomplishment. Next, affect tells how much the individual likes performing the behavior. And finally, anxiety looks at emotional reactions that might coincide with performing the behavior (Compeau & Higgins, 1995b; Venkatesh et al., 2003). This model has been notably used in a number of IS contexts: online communication (Bandura, 2001), internet usage (LaRose & Eastin, 2004) and more recently for mobile banking in Australia (Ratten, 2011).
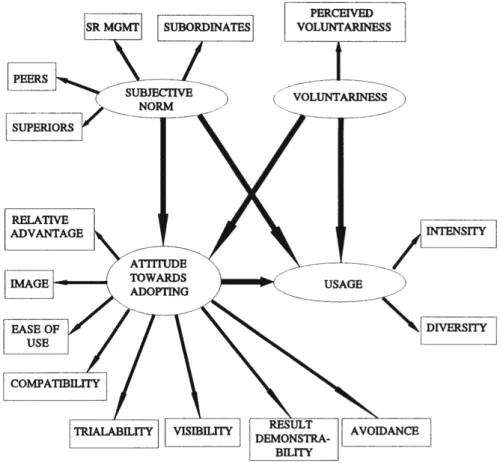
12 IDT At the same time as Compeau & Higgins (1995b) developed the SCT, Moore & Benbasat (1991, 1996) adapt the innovation diffusion theory, originally composed by Rogers in 1962. This general theory has been a great influence on the understanding of innovation and its adoption. Major components of this theory are the s-shaped curve for cumulative frequency of adoption over time, the distinct classification of adopters into categories ranging from pioneers to laggards and the individual adoption process (Rogers, 1962, 1983; Brancheau & Wetherbe, 1990). The latter, also known as the innovation-decision process (Rogers 1983), makes a distinction between 5 stages of adoption: knowledge, persuasion, decision, implementation and confirmation (Rogers, 1962). This distinction is made based on the core idea that an individual adopter his or her main goal is to implement a certain behavior to reduce uncertainty regarding the innovation (Rogers, 1983). In addition to this, the leading way this behavior is diffused among societies is by communication through certain channels over time (Rogers, 1983). The theory explains a wide variety of innovation diffusions, ranging from agriculture to innovation on an organizational level (Tornatzky & Klein, 1982). Later, Moore & Benbasat (1991, 1996) adjust the innovation diffusion theory model to explain technology acceptance, altering the existing constructs and adding new constructs too. Even though this is a very elaborate model (see Figure 4), this study focuses only on the core constructs, similarly to Venkatesh et al. (2003). Firstly, relative advantage, ease of use, compatibility and results demonstrability accommodate existing insights from the IDT (Moore & Benbasat, 1991). Then, image, visibility and voluntariness of use are added as new constructs to map the social influence regarding technology acceptance (Moore & Benbasat, 1991). Afterwards, Moore & Benbasat (1996) found evidence for both types of constructs within their model.
13
Figure 4: Innovation diffusion model. Source: Moore & Benbasat (1996)
It has been used in several fields of study since, mostly in combination with another model. This includes the field of e-commerce (Chen, Gillenson, & Sherrell, 2002), where the model is combined with the TAM. Another example can be found in the field of mobile payments, where the IDT is combined with the previously mentioned TRA (Chen & Nath, 2008). Brown, Cajee, Davies & Stroebel (2003) apply the model in the field of mobile banking of South Africa, where IDT is mixed with the already explained DTPB. Likewise, Suoranta & Mattila (2004) combine IDT with the bass diffusion model to explain mobile banking in Finland. These examples, along with the previously mentioned studies, show the tendency of researches to expand and/ or combine the existing models to better fit technology acceptance behavior. The next model is one of the most popular approaches at unifying the available knowledge about adoption theory.
14 UTAUT The UTAUT model, created by Venkatesh et al. (2003), is a combination of eight existing models, namely the previously elaborated TRA, TAM, TPB, DTPB, SCT, IDT, but also the lesser utilized Motivational Model (MM) and the Model of PC Utilization (MPCU) (Venkatesh et al., 2003). While this study already mentioned that combining models is not new, it seems to be the first to be done at such a large scale and with such impressive results. Originally designed to describe employee technology acceptance with an emphasis on utilitarian value, the model has been used in a wide variety of contexts, both organizational and non-organizational (Venkatesh et al., 2012). It uses four core determinants to study the influence on intention and actual usage (see Figure 5). First of all, three factors called performance expectancy, effort expectancy and social influence have a direct impact on behavioral intention. Next, facilitating conditions and this behavioral intention itself have an impact on the actual usage. These relationships are moderated by age, gender, experience and voluntariness of use (Venkatesh et al., 2003). It is important to note that Venkatesh et al. (2012) suggest that the latter, voluntariness of use, should be omitted when studying the context of consumer intentions, since using a new technology as a consumer is mostly voluntary anyway.
15 The model, which is fairly parsimonious with its few constructs, has been proven superior compared to its predecessors by Park et al. (2007) and Venkatesh & Zhang (2010). For instance, Venkatesh & Zhang (2010) are able to explain as much as 70% of variance in behavioral intention and up to 50% for usage. It has been used in various forms and in various contexts of technology acceptance behavior, including mobile devices adoption (Carlsson, Carlsson, Hyvonen, Puhakainen, & Walden, 2006), Chinese consumerism of mobile technologies (Park, Yang, & Lehto, 2007), mobile commerce acceptance (Min, Ji, & Qu, 2008) and more recently mobile banking (Bhatiasevi, 2016) and electronic government adoption (Dwivedi et al., 2017). Like every other model, it is essential to consider critique that arises from the research field. Notwithstanding the fact that the UTAUT model is one of the few models that implements moderating factors to explain intention and usage, it is still criticized for lack of cultural factors (Im, Hong, & Kang, 2011). Because of that, Baptista & Oliveira (2015) implement cultural moderators based on Hofstede (2003) and find that cultural factors such as collectivism, uncertainty avoidance, short term and power distance are all significant. Other critique on the use and adjustments made to the model comes from Venkatesh et al. (2012) themselves. They claim that extended versions of their UTAUT model lack careful theoretical consideration when adding new constructs, and that the mechanisms, that come with these new constructs, are not complementary with the original UTAUT. As a consequence, they extended their original theory themselves and describe a new unified model.
16
UTAUT2
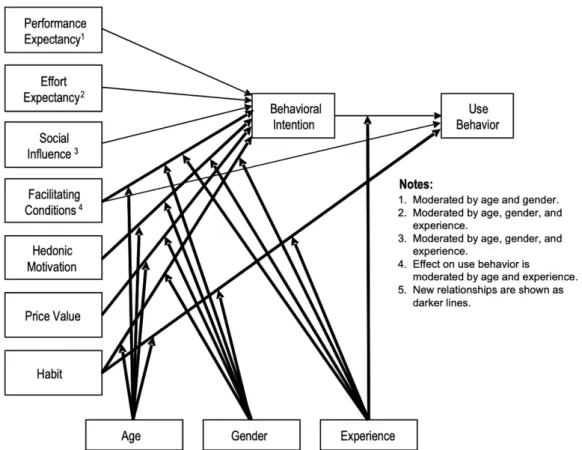
Figure 6: Unified Theory of Acceptance and Use of Technology 2. Source: Venkatesh et al. (2012)
In this case, the UTAUT is extended by adding 3 new constructs and implementing new relationships between existing ones to better fit the consumer use context (see Figure 6). Firstly, hedonic motivation is introduced as an extension of performance expectancy (Venkatesh et al., 2012). Secondly, price/value perception is added as an extra dimension to effort expectancy, since consumer have to pay for a new technology in most cases (Venkatesh et al., 2012), contrary to the employee context where UTAUT is designed for. Finally, the construct of habit is added to give a new influence on the actual usage. When comparing this model with its predecessor in a consumer context, the Venkatesh et al. (2012) show an improvement in intention variance explained from 56 percent to 74 percent. Likewise, variance explained concerning the use improved from 40 to 52 percent. Although this model is a more elaborate theory than the UTAUT, researchers still are successful in extending the model even further. Baabdullah et al. (2018) combine UTAUT2 with the D&M IS Succes Model to explain consumer use of mobile banking in Saudi Arabia.
17 Alalwan et al. (2017) investigate why mobile banking adoption lags in Jordan by effectively extending UTAUT2 with a trust factor. Similarly, Alalwan et al. (2018) add a single risk construct to UTAUT2 in the context of internet banking adoption in Jordan. This latest version closely resembles the model in this research, with the key differences being that here the risk factor is investigated more in depth and is applied to the mobile banking context, instead of online banking.
Overview of comparative studies
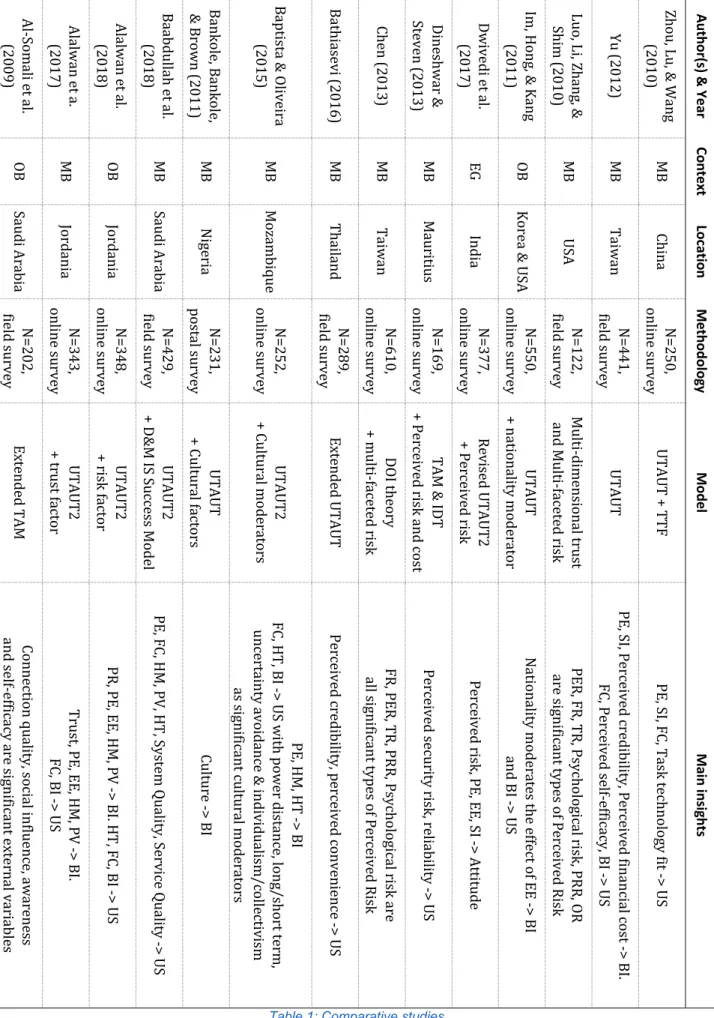
The table below gives an overview of research that is similar to this study and serves as a summary of the main findings that are relevant to the context of mobile banking adoption through an extended UTAUT2 model. It is a list of recent studies that are similar because of their context, their model or both. The aspects included in this list are their publication year, author(s), context, location, methodology, model and pertinent findings. Some conclusions can be drawn from the trends in this overview (see Table 1). Firstly, most research is conducted in the Middle East, Africa and East Asia. This is similar to a literature review conducted by Shaikh & Karjaluoto (2015), who find that more than 90% of mobile banking adoption studies conducted between 2005 and 2014 were conducted in those regions. As a consequence, this creates a gap of insights in the context of adoption behavior in Western countries. Additionally, it creates a gap for adoption model research in more mature context, where mobile banking is not just in its infancy stage. Secondly, it is common practice to combine existing models or expand models with new constructs or moderator effects. This comes to no surprise, since Venkatesh et al. (2003), the authors of the UTAUT model, themselves suggest extending the model and trying to find new significant constructs to describe adoption behavior. Consequently, this results in a very heterogenous group of models to map adoption. Finally, insights gained from these studies suggest that conclusions can vary wildly. For instance, evidence for Effort Expectancy and Social Influence as significant variables is not systematically found. Contrary to this, most studies that include Perceived Risk, find it to be a significant factor and find evidence for its multiple facets.18 Al -So m al i et al . (2 00 9) Al alw an e t a . (2 01 7) Al alw an e t a l. (2 01 8) Ba ab dul la h et a l. (2 01 8) Ba nk ol e, Ba nk ol e, & B ro wn (2 01 1) Ba pt ist a & Ol ivei ra (2 01 5) Ba thi as evi (2016) Che n ( 2013) Di ne sh wa r & St even (2 01 3) Dwi ve di et al. (2 01 7) Im , H on g, & K an g (2 01 1) Lu o, Li , Zha ng , & Sh im (2 01 0) Yu (2 01 2) Zhou , Lu , & W ang (2 01 0) Aut ho r( s) & Y ea r OB MB OB MB MB MB MB MB MB EG OB MB MB MB Co ntex t Saud i A rabi a Jo rd an ia Jo rd an ia Saud i A rabi a Ni ge ria Mo za m biq ue Tha ila nd Ta iw an Ma ur itiu s In dia Kor ea & U SA US A Ta iw an Chi na Lo ca tio n N= 20 2, fie ld su rv ey N= 34 3, onl ine sur vey N= 34 8, onl ine sur vey N= 42 9, fie ld su rv ey N= 231 , pos ta l s ur vey N= 25 2, onl ine sur vey N= 28 9, fie ld su rv ey N= 61 0, onl ine sur vey N= 16 9, onl ine sur vey N= 37 7, onl ine sur vey N= 55 0, onl ine sur vey N= 12 2, fie ld su rv ey N= 44 1, fie ld su rv ey N= 25 0, onl ine sur vey Me th od olo gy Ex tended T A M UTAUT2 + tru st fa ctor UTAUT2 + ris k f ac tor UTAUT2 + D & M IS S uc ce ss M ode l UTAUT + Cu ltu ra l fa ctor s UTAUT2 + Cu ltu ra l m ode ra tor s Ex tended U T A U T DO I t he or y + m ult i-fa ce te d r is k TAM & ID T + Pe rc eiv ed ris k a nd cos t Re vis ed UTAUT2 + Pe rc eiv ed ris k UTAUT + na tiona lit y m ode ra tor Mu lti-di m ens iona l tr us t an d M ul ti-fa ce te d r is k UTAUT UTAUT + TTF Mo de l Co nn ec tio n q ua lit y, s oc ia l in flu en ce , a w ar en es s an d sel f-ef ficacy are si gni ficant ex ternal vari abl es Tr us t, PE , E E, H M , PV -> BI . FC, BI -> U S PR, PE, EE, H M , PV -> BI . HT , F C, B I -> U S PE, FC, H M , PV , H T, S ys te m Qu ali ty , S er vic e Qu ali ty -> U S Cu ltu re -> BI PE, H M , H T -> BI FC, H T, BI -> U S w ith pow er di sta nc e, l ong /s hor t t er m , uncert ai nt y avoi dance & in div id ua lis m /c oll ec tiv is m as si gn ifican t cul tural m od erat ors Pe rc eiv ed cr edi bil ity , pe rc eiv ed conv eni enc e -> U S FR, PER, TR, PRR, Ps yc hol og ica l r isk a re al l si gn ifican t t yp es of Percei ved R isk Pe rc eiv ed se cu rit y r isk , r eli ab ilit y -> U S Pe rc eiv ed ris k, PE, EE, S I -> At tit ude Na tio na lit y m od er ate s t he e ffe ct of EE -> BI an d B I -> U S PER, FR, TR, Ps yc hol og ica l r isk , PRR, OR are si gn ifican t t yp es of Percei ved R isk PE, S I, Pe rc eiv ed cr edi bil ity , Pe rc eiv ed fina nc ia l c os t -> BI . FC, Pe rc eiv ed se lf-ef ficacy, BI -> US PE, S I, FC, Ta sk te chnol og y f it -> U S Ma in in sig hts
Table 1: Comparative studies
19
Academic relevance
In this part, the gaps that this study tries to fill compared to existing literature is again emphasized. Even though the overview in the previous section shows how common it is to use adoption modeling in the context of mobile banking, its trends still expose some gaps that can be filled. This is why this study targets the following three gaps: No prior research, to the best of knowledge, has combined the UTAUT2 model with a multi-faceted risk construct. It is true that UTAUT2 has already been successfully expanded with risk (Alalwan et al., 2018), or that multiple risk facets were found in the mobile banking context (Luo et al., 2010). Still, no study united the two together. Next, since the research will be conducted in Flanders, it tackles the more general lack of research in Western countries. As the vast majority of research in mobile banking adoption focusses on developing countries and Asian regions, insight into Europe and North America remains largely limited. Especially considering that findings in the former region cannot simply be generalized to the latter (Alalwan et al., 2018). Finally, given the fact that mobile banking is not in its infancy stage anymore in Flanders, this study can analyze behavioral intention and usage from people with much more experience. This nuance was already implied by Zhou et al. (2010), who suggested that further research needed to be done in a setting where mobile commerce is much more mature. The key difference being that a real novel technology will only attract pioneers in the beginning. Because their characteristics are not similar to the whole population, difficulties with external validity will occur. In addition to this problem, there will be a substantive issue with the habit construct of the UTAUT2 model. A novel technology can be so new, that there has not been time enough yet to form meaningful habits around it. This is why for example Alalwan et al. (2017) omitted this construct from their research.20
Conceptual model and hypothesis development
Figure 7: Proposed research model. UTAUT2 + multi-faceted risk
Main research question
The societal importance and academic literature show that despite the importance of mobile banking and its understanding, there is a lack of academic research that could support Flemish decision makers. In addition, no prior research applied the combination of UTAUT2 and a risk construct with multiple facets. As a result, this study aims at answering the following question: Is the UTAUT2 + multi-faceted risk model applicable to mobile banking in Flanders? In this chapter the model is elaborated in detail. Since UTAUT2 is an updated version of the very popular UTAUT model that better fits the consumer context, this will serve as the basis for this study (see Figure 7). However, another construct will be added, which is permitted by Venkatesh et al. (2012), to describe the influence of different kinds of risks too. This addition follows the theoretical principles by Alvesson & Kärreman (2007) and checks the requirement of being substantially different from the constructs of UTAUT2 itself (Alalwan et al. 2018). The course of this chapter goes as follows: Alongside the sub-questions, each construct is21 discussed alongside evidence from other studies and hypotheses are formulated regarding the relationships between these factors.
Sub-question 1
What factors have a significant impact on Behavioral Intention regarding mobile banking in Flanders? Performance Expectancy (PE) Originally formulated in UTAUT, performance expectancy refers to “the degree to which an individual believes that using the system will help attain gains in job performance” (Venkatesh et al., 2003, p. 447). In the context of mobile banking, this job performance increase can be due to the service effectiveness, more convenient payment possibility, faster response and more flexibility in time and place (Alalwan et al., 2018; Karjaluoto, Riquelme, & Rios, 2010; Luarn & Lin, 2005; Zhou, Lu, & Wang, 2010). Theoretically, it stems from perceived usefulness (TAM), the relative advantage (IDT), the extrinsic motivates (MM), the job-fit (MPCU) and outcome expectations (SCT) (Venkatesh et al., 2003). A study by Riffai, Grant & Edgar (2012) concludes that this construct is a key factor for mobile banking acceptance, which can easily be motivated by the fact that customers are enticed to use and accept a new technology service if that technology offers more usefulness and advantages (Alalwan et al., 2018; Davis et al., 1989; Venkatesh et al., 2003). This is why this study proposes the following hypothesis: H1: Performance Expectancy has a significant impact on Behavioral Intention to use mobile banking in Flanders. Effort Expectancy (EE) Venkatesh et al. (2003) described effort expectancy as “the degree of ease associated with the use of the system” (Venkatesh et al., 2003, p. 450). This construct is formulated in the UTAUT model but has its origins in the constructs of ease of use (TAM), complexity (MPCU) and ease-of-use (IDT) (Venkatesh et al., 2003). Proof for the significant impact of this factor on mobile banking adoption is for example evident when the technology is updated, with Shaikh and22 Karjaluoto (2015) concluding that if an update has a different level of ease in using the service, usage is significantly affected as a consequence. Therefore, this study proposes the following hypothesis: H2: Effort Expectancy has a significant impact on Behavioral Intention to use mobile banking in Flanders. In addition, when consumers perceive a new technology to be easy to use, their expectations about the job performance will be high (Zhou et al., 2010). Further evidence of this relationship is found in the context of mobile banking in Jordan (Alalwan, Dwivedi, & Rana, 2017). As a consequence, this study proposes the following hypothesis: H3: Effort Expectancy has a significant impact on Performance Expectancy of mobile banking in Flanders. Social Influence (SI) Next, social influence of the UTAUT defines “The degree to which an individual perceives that important others believe he or she should use the new system” (Venkatesh et al., 2003, p. 451). It resembles subjective norm (TRA, TPB and DTPB), social factors (MPCU) and image (IDT) (Venkatesh et al., 2003). In other words, social influence is about the idea that individual behavior is affected by social relationships between family, friends or peers. As a consequence, in times of social media these social relationships can be a key factor to maintain or increase acceptance and usage of mobile technologies (Al-Somali, Gholami & Clegg, 2009; Williams, Rana & Dwivedi, 2015). In fact, Jahya (2004) confirms that in order to increase social interaction and integration, people are willing to switch to more socially accepted technologies. However, there seems to be little evidence for this factor in the context of online or mobile banking in recent times (Oliveira, Faria, & Thomas, 2014; Alalwan et al., 2017; Alalwan et al., 2018). Still, this study proposes the following hypothesis: H4: Social Influence has a significant impact on Behavioral Intention to use mobile banking in Flanders.
23 Hedonic Motivation (HM) As the first construct that comes from UTAUT2, hedonic motivation is about “the fun or pleasure derived from using a technology” (Venkatesh et al., 2012, p. 164). It reflects the intrinsic utility that a new technology can offer, in contrast to the extrinsic utility that is already captured by performance expectancy (Venkatesh et al., 2012). For instance, consumers who appreciate novelty and modernism could gain value by using a new technology that is associated with a modern lifestyle (Celik, 2008; Gan Clemes, Limsombunchai, & Weng, 2006). Van der Heijden (2004) suggests that hedonic motivation could be a key factor in accelerating user intention and adoption of emerging systems. Further confirmation for this factor in the specific context of mobile banking is already available (Alalwan et al., 2017; Dwivedi et al., 2017; Yu, 2012; Zhou et al., 2010). So, this study proposes the following hypothesis: H5: Hedonic Motivation has a significant impact on Behavioral Intention to use mobile banking in Flanders. Price Value (PV) The next construct from UTAUT2 is price value, which defines “consumers’ cognitive tradeoff between the perceived benefits of the applications and the monetary cost for using them” (Venkatesh et al., 2012, p. 165). This construct is very important, since it is a key aspect of the consumer context, as opposed to the employee context where the UTAUT was developed for (Venkatesh et al., 2012). In an organization, an employee only has to invest effort into a new technology. However, in the consumer context, people usually have to buy the new technology in order to use it or pay for continuing using it. As a result, using a new technology needs to be perceived as more advantageous and useful than the price it costs (Venkatesh et al., 2012). Thus, if a consumer has a high level of price value, he or she is more willing to adopt the new technology (Venkatesh et al., 2012). Several aspects of price sensitivity have been discovered already in the context of mobile banking. Yang (2009) concludes that the lower costs of handling financial transactions through mobile banking encourage consumers to adopt this new technology. However, if banks raise the fees for mobile banking, consumers instantly become reluctant to use their service (Njenga & Ndlovu, 2012). Consequently, they tend to switch to a competing service
24 and are sensitive to the ones that offer discounts (Laukkanen, 2007; Laukkanen & Lauronen, 2005; Raleting & Nel, 2011). All things considered, this study proposes the following hypothesis: H6: Price Value has a significant impact on Behavioral Intention to use mobile banking in Flanders.
Sub-question 2
What factors have a significant impact on Usage regarding mobile banking in Flanders? Facilitating Conditions (FC) Facilitating conditions is a construct that originates from the UTAUT and defines “the degree to which an individual believes that an organizational and technical infrastructure exists to support use of the system” (Venkatesh et al., 2003, p. 453). Not only does this mean that people should be given the best conditions to use a new technology, it also means that people themselves should possess the necessary knowledge, ability and resources (Venkatesh et al., 2003). This construct bears resemblance to perceived behavioral control (TPB and DTPB), facilitating conditions (MPCU) and compatibility (IDT) (Venkatesh et al., 2003). In the case of online banking, it has already been illustrated by Joshua and Koshy (2011) that convenience regarding the access to a computer and internet has a significant impact on the level of adoption and usage. Further evidence in the case of mobile banking has also been found (Alalwan et al., 2017; Alalwan et al., 2018; Yu, 2012; Zhou et al., 2010). Consequently, this study proposes the following hypothesis: H7: Facilitating Conditions have a significant impact on Usage of mobile banking in Flanders. Habit (HT) The last construct in this study that is introduced by the UTAUT2 is habit, which refers to “the extent to which an individual believes the behavior to be automatic” (Venkatesh et al., 2012, p. 165). Since this construct requires the consumers to have at least some experience with the technology, it is more convenient for the technology to have some maturity in the specific context it is being studied in. In contrast to Alalwan et al. (2017), who for this reason don’t25 cover this factor to examine mobile banking adoption in Jordan, this study does include habit as a key predictor of usage. Evidence for this predictor has already been found by Huili & Zhong (2011), when they compared mobile banking with online banking and concluded that repeated use of mobile banking does increase its additivity. This is why this study proposes the following hypothesis: H8: Habit has a significant impact on Usage of mobile banking in Flanders. Behavioral intention (BI) Drawn from psychology, behavioral intention is regarded as the most powerful predictor of actual usage (Ajzen, 1991; Venkatesh et al., 2003, 2012). In the model, it sits between the main antecedents discussed above and the actual usage of mobile banking. Since it is more important to determine what drives the actual behavior towards a new technology, as opposed the intention surrounding the behavior, this relationship between intention and usage has been studied extensively (Yu, 2012). As a result, this study proposes the following hypothesis: H16: Behavioral Intention has a significant impact on the actual Usage of mobile banking in Flanders.
Sub-question 3
What facets of risk are significant in the context of mobile banking in Flanders? Perceived Risk (PR) This study adds the notion of perceived risk to the UTAUT2 model since consumers still have a sense of insecurity regarding IT services (Dwivedi et al., 2017). An early definition of perceived risk defines it as uncertainty combined with the seriousness of the consequent outcome (Bauer, 1960). In the context of online and mobile banking, this could be due to the treacherous and unstable nature of the internet and thus its online services (Zhang & Maruping, 2008). Multiple studies have confirmed the significant impact of perceived risk26 (Chen, 2013; Dwivedi et al., 2017; Laforet & Li, 2005). This is why this study proposes the following hypothesis: H9: Perceived Risk has a significant negative impact on Behavioral Intention to use mobile banking in Flanders. However, there is reason to believe a more elaborate risk construct is suited for the mobile banking context. As early as 2003, Lee, Kozar & Larsen suggest that a multi-faceted risk construct, based on Jacoby & Kaplan (1972), would provide a deeper insight in the adoption of IS systems. The same year, Featherman & Pavlou (2003) find evidence for performance risk, financial risk, psychological risk, privacy risk and time risk in the general e-services context. Later, Luo et al. (2010) also find evidence for multiple facets of perceived risk in the mobile banking context. Before incorporating these factors into the model, a brief description of these facets is given. Firstly, performance risk is defined as “the possibility of the product malfunctioning and not performing as it was designed and advertised and therefore failing to deliver the desired benefits” (Featherman & Pavlou, 2003, p. 455). In other words, this could be seen as the risk that performance expectancy isn’t met. Secondly, financial risk is described as “the potential monetary outlay associated with the initial purchase price as well as the subsequent maintenance cost of the product. The current financial services research expands this facet to include the recurring potential for financial loss due to fraud” (Featherman & Pavlou, 2003, p. 455). This is a risk that would not have been an issue in the employee context of UTAUT, since they only paid with their effort. Next, time risk could happen because “consumers may lose time when making a bad purchasing decision by wasting time researching and making the purchase, learning how to use a product or service only to have to replace it if it does not perform to expectations (Featherman & Pavlou, 2003, p. 455). Finally, privacy risk is formulated as the “potential loss of control over personal information, such as when information about you is used without your knowledge or permission” (Featherman & Pavlou, 2003, p. 455). Despite there being other facets of risk available, like psychological risk or social risk from Featherman & Pavlou (2003) or physical risk based on Luo et al. (2010), this model choses to limit itself to four facets because these others don’t seem relevant enough in
27 the mobile banking context and to keep the model somewhat parsimonious. All things considered, this study proposes the following hypotheses: H10: Performance Risk has a significant positive impact on Perceived Risk. H11: Financial Risk has a significant positive impact on Perceived Risk. H12: Time Risk has a significant positive impact on Perceived Risk. H13: Privacy Risk has a significant positive impact on Perceived Risk. H14: Overall Risk has a significant positive impact on Perceived Risk. Furthermore, this model would like to study the relationship between performance risk and performance expectancy, which is supported by Featherman & Pavlou (2003). To put things differently, performance risk is high when there is a lot of behavioral and environmental uncertainty about the new technology (Zhang & Maruping, 2008). This in turn will influence a consumer his or her perception of the usefulness of that new technology (Featherman & Pavlou, 2003). Therefore, this study proposes the following hypothesis: H15: Performance risk has a significant negative impact on Performance Expectancy of mobile banking in Flanders.
28
Methodology
To investigate the mobile banking acceptance this study applied the UTAUT2 model and extends it with a multi-faceted risk construct. This quantitative study collected cross-sectional data via an online survey to then process via Structural Equation Modeling. The remainder of this chapter gives more detail about the instrument, the procedure, and the data analysis technique of this research.Instrument
The resulting model has 15 constructs in total, of which 14 are based on items used in prior studies, except adoption, to ensure content validity (see Appendix 2). The factors that find their origin in the UTAUT model, the original items of Venkatesh et al. (2003) are used. Next, hedonic motivation, price value and habit use the items from Venkatesh et al. (2012). Similarly, the risk constructs use items based on Featherman et al. (2003) and Luo et al. (2010). On the other hand, adoption uses newly developed measures. The study believes that the items that are used in prior studies do not reflect the most common features of mobile banking applications anymore. Therefore, new items were used based upon two interviews with bank directors at a leading Belgian bank. All constructs were measured using a seven-point Likert scale, except adoption, which applied a scale to measure frequency with five anchors including ‘never or less than once a month’ up to ‘multiple times per day’. Risk constructs used scales with answer choices of ‘highly improbable’ up to ‘highly probable’. Other constructs applied a scale of ‘highly disagree’ up to ‘highly agree’. Afterwards, the back-translation method was used to translate the survey in Dutch, in accordance with Brislin (1976). A test run with eight students was done to make sure the questionnaire used clear language and was not too long. Their feedback was integrated, and the result is a coherent survey with 53 items.29
Procedure
To collect the data, the study participated in a charity event in Belgium called “De Warmste Week”. Over the course of a week, people were approached at random on the main event location. They were kindly asked to participate in the study, and they were given a short link on a flyer to fill in a survey on Qualtrics at their earliest convenience (see Appendix 1). As a reward for their time, this study would support a main cancer research foundation on their behalf. Of the close to 3000 people approached, 439 completed the survey. Next, a further filtration took place. As an arbitrary measure to filter out unengaged respondents, the study inspected each case where the completion time was suspiciously low, and their answers did not have any variance in them. For example, people that answered every question with “strongly agree” were omitted from the data. As a result, this research ended up with 424 viable responses. Consequently, this sample is big enough for structural equation modeling.Data analysis technique
Given the characteristics of this model, Partial Least Squares was chosen as the ideal method within the different options of Structural Equation Modeling. First of all, PLS was selected because of the construct Perceived Risk. More specifically, since it has no items itself, a technique was required that could handle second order formative constructs. Covariance-based SEM techniques like AMOS or LISREL would likely struggle with the statistical identification when such a construct is present (Chin, 1998; Petter, Straub, & Rai, 2007). Secondly, PLS is best equipped to handle a model of such size and complexity (Wold, 1985). The high number of variables and the combination of reflective factors with a second order formative factor make this model large and complex. Finally, compared to AMOS and LISREL, PLS is less restrictive on residual distributions due to the fact that while the former is covariance-based, the latter is component-based (Chin, Marcolin, & Newsted, 2003). SmartPLS 3 was used to implement the technique accordingly, while preliminary steps were conducted with SPSS 26.30
Results
In this part, the data is processed to test the hypotheses. Beforehand, demographics are discussed (see Table 2; Appendix 3). Afterwards, all necessary tests are done to ensure the quality of the data. The study also has special attention for the second-order construct Perceived Risk, which made the model more complex. The approach that is applied to incorporate it in the model correctly is explained in more detail. In the end, all path coefficients are calculated between the constructs to test the hypotheses. Participants’ profile Frequency % Frequency %Gender
Age
Male 176 41.5 18 through 24 190 44.8 Female 248 58.5 25 through 30 48 11.3 31 through 40 50 11.8Education
41 through 50 56 13.2 No education 1 0.2 51 through 60 67 15.8 Lager onderwijs 1 0.2 61 or older 13 3.1 Middelbaar onderwijs 96 22.6 Hogeschool 135 31.8Experience
Univesitaire bachelor 66 15.6 No experience 19 4.5 Universitaire master 121 28.5 Less than 1 year 32 7.5 PhD 3 0.7 1 year to < 2 years 68 16.0 Other 1 0.2 2 years to < 3 years 82 19.3 More than 3 years 223 52.6 Table 2: Demographics Of the 424 viable respondents, 248 respondents are female, compared to 176 male respondents. This means there is a slight female majority of 58.5%, while male respondents represent the remaining 41.5%. As far as age is concerned, the most common age group is 18-24 years, with 44.8% of the total sample. Representation of the remaining age groups mostly similar. The groups with ages ranging from 25-30, 31-40, 41-50 and 51-60 represent 11.3%, 11.8%, 13.2% and 15.8%31 respectively. The last category is the smallest, as the group of 61 years and older only account for 3.1% of the total sample. In relation to education, this study enquired about the highest degree that respondents had earned. Here, 4 categories dominate the sample. The most common degree obtained by participants is a college degree, at 31.8%. The next type of degree, a university master, follows closely with 28.5%. Next, 22.6% of respondents have a high school diploma. The last big category, a university bachelor, represents 15.6% of the sample. The remaining categories of no education, PhD and an alternative degree have no noteworthy representation. The characteristics also reveal that the vast majority of respondents has experience with mobile banking. For instance, the data indicates that 52.6% of the total sample has 3 or more years of experience with mobile banking. The numbers also suggest how widespread mobile banking already is, since only 4.5% has never used the application. This is in line with the intention of this study, since the model can now be tested in a setting where mobile banking is clearly a mature technology. Common method bias Because this study used a single survey that was distributed at one point in time, the danger of common method variance could occur. This bias could manipulate the correlation between factors and hamper the validity. To ensure this is not a problem, Harman’s single-factor test was applied (Podsakoff, MacKenzie, Lee, & Podsakoff, 2003). This test investigates whether one factor accounts for more than 50% of the covariance, as this would indicate common method bias. Since for the data of this study, the first factor only possesses 29.9% of the variance, the Harman’s single-factor test shows that CMV is present in this study (see Appendix 4). During the calculations for this section, an early confirmatory factor analysis was done in SPSS (See Appendix 5). This analysis concluded that 13 out of 13 constructs were found with an eigen value higher than 1 (FR, PER, PRR, TR, OR, PE, EE, SI, HM, PV, HT and FC). However, the deletion of items is done through the loadings that are acquired via SmartPLS in the related section later in this chapter.
32 Multicollinearity If the correlations between two or more variables become too high, the problem of multicollinearity might emerge, which is bad for the validity of the model. To test for this, variance inflation factors (VIF) are calculated. If these values are higher than 10, this would suggest excessive multicollinearity in the data (Diamantopoulos & Winklhofer, 2001). For this study, all VIF values remain under the threshold value of 10 (see Appendix 5). As a result, the data should not be troubled by multicollinearity. Second-order factor Perceived Risk Before looking at factor analysis and validities, this study gives a justification for incorporating Perceived Risk in the way it does, parallel to Luo et al. (2010). This section shows preliminary calculations as a way to illustrate the characteristics of Perceived Risk. Afterwards, all the required tests will be explained. Since Perceived Risk does not have any items on its own in this research, this construct needs to become a second-order factor. In other words, the following factors and their items will be used to represent Perceived Risk: Performance Risk (PER), Financial Risk (FR), Time Risk (TR), Privacy Risk (PR) and Overall Risk (OR). There are two options to do this, employing the repeated indicator approach or drawing the paths between the first-order and second-order factors (Chin et al. 2003; Edwards, 2001; Lohmoller, 2013). However, the first approach requires that all first order factor have the same number of items, which is not the case in this study. The second approach, on the other hand, has no such limitations. This approach draws the paths between the factors and uses the scores of the first-order factors to measure the second-order one (Luo et al., 2010). To ensure the quality of the measurement of Perceived Risk and to be able to classify it as a formative construct, suggestions by Chin (2003), Diamantopoulos et al. (2001) and Luo et al. (2010) are followed. First of all, this study does not find too high values for correlations between the first-order factors. More specifically, this study finds an average correlation between the five first-order constructs of 0,71. Since this sits below the threshold value of 0,8, it is suggested that Perceived Risk is better represented by a formative factor than a reflective one (Luo et al., 2010; Pavlou & Sawy, 2006). Secondly, the occurrence of multicollinearity
33 would put the quality of the formulative measurement into question (Diamantopoulos et al., 2001). Since the previous section already concluded that no VIF is above 10, multicollinearity is not a problem for this data. Finally, to further indicate that Perceived Risk should be classified as a formulative factor that is defined by its multiple facets of risk, path coefficients show significant relationships between all first order risks and Perceived Risk (See Table 3). In summary, it is correct to use Perceived Risk as a second-order formulative construct.
Factors Perceived Risk (PR)
FR 0.181***
OR 0.347***
PER 0.233***
PRR 0.176***
TR 0.190***
Table 3: Path coefficients for Risk factors.
Content validity This kind of validity measures the degree to which the items from the survey match the content it is used in. Due to the fact that the items are based on prior research (Featherman et al., 20O3; Luo et al., 2010; Venkatesh et al., 2012), the study complies with this condition perfectly. Internal validity Before distributing the survey, a pre-test was done to guarantee understandability and clear language used. This pilot study was done through 8 students. Based on their feedback, the survey was altered to better the readability. This way, a good level of internal validity was reached. External validity In order to be representative of the population of Flanders, this sample needs to have a minimum of 385 participants when an error margin of 5% and a 95% confidence level is selected (Checkmate, n.d.). Since this study has access to 424 complete surveys, this condition is met. As a result, this study can draw conclusions for the whole population of Flanders, given
34 it keeps in mind a 4,76% error margin (Checkmate, n.d.). In other words, an answer to one of the items with a 7-point Likert scale would mean that the average value for the population would have a value within ± 0.3332 of the average sample value (Bartlett, Kotrlik, & Higgins, 2001).