LIFE CYCLE PATTERNS IN THE
LABOUR MARKET RETURNS TO
VOCATIONAL EDUCATION
Evidence from the LFS and PIAAC
LIFE CYCLE PATTERNS IN THE
LABOUR MARKET RETURNS TO
VOCATIONAL EDUCATION
Evidence from the LFS and PIAAC
Jeroen Lavrijsen & Ides Nicaise
Promotor: Ides Nicaise
Research paper SSL/2014.05/1.1.1
Leuven, oktober 2014
Het Steunpunt Studie- en Schoolloopbanen is een samenwerkingsverband van KU Leuven, UGent, VUB, Lessius Hogeschool en HUB.
Gelieve naar deze publicatie te verwijzen als volgt:
Lavrijsen J. & Nicaise I. (2014), Life cycle patterns in the labour market returns to vocational
education. Evidence from the LFS and PIAAC, Steunpunt Studie- en Schoolloopbanen, Leuven. Voor meer informatie over deze publicatie jeroen.lavrijsen@kuleuven.be
Deze publicatie kwam tot stand met de steun van de Vlaamse Gemeenschap, Programma Steunpunten voor Beleidsrelevant Onderzoek.
In deze publicatie wordt de mening van de auteur weergegeven en niet die van de Vlaamse overheid. De Vlaamse overheid is niet aansprakelijk voor het gebruik dat kan worden gemaakt van de opgenomen gegevens.
D/2014/4718/typ het depotnummer – ISBN typ het ISBN nummer © 2014 STEUNPUNT STUDIE- EN SCHOOLLOOPBANEN
p.a. Secretariaat Steunpunt Studie- en Schoolloopbanen HIVA - Onderzoeksinstituut voor Arbeid en Samenleving Parkstraat 47 bus 5300, BE 3000 Leuven
Content
Beleidssamenvatting vii
Chapter 1 - Introduction 1
Chapter 2 - Labour market returns to education 2
2.1 Measuring returns to education 2
2.1.1 Labour market outcomes 2
2.1.2Individual characteristics 2
2.1.3Educational variables 3
2.2 Problems with estimating returns to education 4
2.2.1 Ability selectivity bias 4
2.2.2Heterogeneity of schooling 4
2.3 Research questions 6
2.3.1Returns to vocational education 6
2.3.2The effect of general skill control 7
2.3.3Effects over time 8
2.3.4Educational system design 9
2.4 Summary 12
Chapter 3 - Sample 13
3.1 General description of the data 13
3.2 Delimitation of the sample 14
3.3 Countries and sample sizes 14
3.4 Data definition and comparison 16
3.4.1Educational background 16
3.4.2Labour market outcomes 20
3.4.3Other individual characteristics 22
Chapter 4 - Returns in terms of employment probability 23
4.1 The PIAAC-sample compared with LFS 23
4.2 Bringing skills into the picture 27
4.3 A full picture 30
4.4 Interactions with age 31
4.5 Polarization? 36
Chapter 5 - Returns in terms of earnings 37
5.1 The PIAAC-sample compared with LFS 37
5.2 Absolute earnings 39
5.3 A full picture 41
5.4 Interactions with age 43
Chapter 6 - Educational systems and vocational education 47
6.1 Country-specific returns to education 47
6.1.1 Employment probability 47
6.1.2Earnings 49
6.2 Social background effects on labour market outcomes 50
6.2.1Educational background of disadvantaged respondents 50
6.2.2General skills proficiency by social background 53
6.2.3Employment probability by social background 54
6.2.4Earnings mobility 56
Chapter 7 - Conclusion 58
Annex 1 - Details of the qualifications reported for the Flemish Region 59
Beleidssamenvatting
Het is bekend dat in Vlaanderen de link tussen de sociale achtergrond van leerlingen en hun leerresultaten (bv. gemeten in de PISA-tests) vrij sterk is (cf. Tabel 17). Wetenschappelijk onderzoek heeft eerder al gesuggereerd dat in het bijzonder de vormgeving van het Vlaams onderwijssysteem, met zijn relatief vroege opsplitsing (tracking) van leerlingen in verschillende onderwijsvormen (aso/tso/bso/kso), daaraan bijdraagt (Lavrijsen & Nicaise (2013a); Lavrijsen, Nicaise & Wouters (2013); Nicaise, Spruyt, Van Houtte & Kavadias (2014)). Een kanttekening bij deze vaststelling is echter dat tests zoals PISA enkel algemene cognitieve vaardigheden meten (wiskunde, leesvaardigheid, wetenschappelijke geletterdheid), terwijl leerlingen in beroepsvoorbereidende richtingen daarnaast ook waardevolle beroepsspecifieke vaardigheden ontwikkelen. Deze laatste soort vaardigheden kunnen bij de intrede op de arbeidsmarkt heel belangrijk zijn omdat ze afgestudeerde leerlingen snel aan een job kunnen helpen. In deze paper bestuderen we, op basis van internationale gegevens uit LFS en PIAAC, in welke mate een goed ontwikkeld beroepsgericht onderwijssysteem als een ‘vangnet’ kan functioneren.
Onze eerste vaststelling is dat beroepsgericht onderwijs inderdaad een relatief veilige overgang naar werk garandeert (cf. Tabel 7-8, ‘main effects’). Omdat sociaal zwakkere jongeren vaak in beroepsgerichte richtingen terechtkomen (cf. Tabel 15-16), kan een goed uitgebouwd beroepsonderwijs dan ook de eerder vermelde negatieve effecten van tracking nuanceren: de link tussen sociale afkomst en vaardigheden mag dan wel relatief sterk zijn, maar ons onderwijssysteem (en dat van andere vroeg trackende landen) slaagt er wel redelijk goed in om leerlingen voor te bereiden op een job, en dat ongeacht hun sociale afkomst (cf. Tabel 18, 25-35 cohort). Ter vergelijking kan bijvoorbeeld worden opgemerkt dat in de voornamelijk op algemeen onderwijs gerichte landen zoals de VS en Ierland de link tussen sociale afkomst en leerresultaten dan wel wat kleiner is (cf. Tabel 17), maar dat kansarme leerlingen het er vaak veel moeilijker hebben om werk te vinden (cf. Tabel 18, 25-35 cohort), net omdat er geen alternatief voor het algemeen vormend onderwijs wordt geboden wanneer ze daar uit de boot dreigen te vallen. Met andere woorden, zoals de Nederlandse socioloog Dronkers (2010) het omschreef:
“One of the unavoidable functions of education in contemporary society is the selection and allocation of students according to the type of education that best suits their developed abilities. Since the 1960s, most OECD countries have debated about and experimented with delaying this selection in secondary education. Because many abhor such selection functions, the delay within secondary education can be seen as an attempt to eradicate it from the educational system. Leaving this socially inevitable selection to the labour market instead of the educational system, however, creates the chance that social inequality between students from different strata will become even greater than the inequality that exists within education. After all, selection is even less universalistic (meaning the same criteria apply to everyone) on the labour market than it is in education. (…) Because the more favourable cost– benefit balance makes vocational education more attractive to students from the lower strata, well-organised vocational education can be an attractive path for upward mobility, and it can contribute to greater inter-generational mobility.”
Deze aanvankelijke voordelen van beroepsgerichte opleidingen worden echter snel kleiner met de leeftijd (cf. Tabel 7-8, ‘interaction effects’). Dat de positieve arbeidsmarktvooruitzichten voor mensen met een beroepsdiploma relatief snel verslechteren met de leeftijd kan in verband gebracht worden met veranderende eisen op de arbeidsmarkt. Als gevolg van de introductie van nieuwe technologieën moeten werknemers zich steeds vaker bijscholen, en dat is eenvoudiger wanneer men kan vertrekken van een voldoende brede basisopleiding.
Uit landenvergelijkingen blijkt dan ook dat landen met een sterkere nadruk op algemene vaardigheden in de beroepsgerichte tracks er beter in slagen om mensen met een beroepsgerichte achtergrond op langere termijn aan het werk te houden. Met name in de Scandinavische landen, met hun langere gemeenschappelijke stam, hun sterkere verwevenheid tussen algemene en beroepsgerichte opleidingen, en hun sterkere gerichtheid op een universele participatie aan levenslang leren, blijft het effect van de eigen sociale afkomst op de werkzaamheid op oudere leeftijd beperkt (Tabel 18, 40-50 cohort). In onderwijssystemen met een snellere en meer uitgesproken opdeling in onderwijsvormen, zoals het Vlaamse, wordt dit effect echter weer sterker. Om opnieuw met Dronkers (2010) te spreken:
“The double-edged character of education creates a dilemma in the organisation of vocational education. The key for vocational education is to achieve a good balance between occupation-specific and more general training. Only when this balance has been found and maintained, well-organised vocational education can contribute to reducing the existence of unequal educational opportunities.”
Specifiek voor het Vlaamse beroepsonderwijs zijn er een aantal tekenen dat op dit moment de algemene vaardigheden van onze beroepsleerlingen nog suboptimaal ontwikkeld worden. Dit kan zowel worden afgeleid uit een internationale vergelijking van de PIAAC-testscores voor beroepsleerlingen (cf. Figuur 2) als uit de resultaten1 van de peiling Project Algemene Vakken in het
zesde jaar BSO. Hier op ingrijpen, bijvoorbeeld door het versterken van de basisvorming in het secundair onderwijs, zal zeker één van de uitdagingen worden bij het verder uitwerken van het Masterplan voor de hervorming van het secundair onderwijs.
1
http://www.ond.vlaanderen.be/curriculum/peilingen/secundair-onderwijs/peilingen/files/Peiling-Project-Algemene-Vakken-derde-graad-bso.pdf.
Chapter 1 - Introduction
In our previous reports, we reviewed evidence suggesting that the design of the educational system influences the link between parental background and academic achievement (Lavrijsen & Nicaise (2013a)) and between parental background and the probability of high school graduation (Lavrijsen & Nicaise (2013b)). In particular, it has been demonstrated that the stratification (e.g. tracking age) and the specificity (e.g. vocational orientation) of an educational system are crucial characteristics in understanding its performance. For example, the dominant message from the literature was that early tracking reinforces the effect of social background on academic achievement (measured through international student assessments such as PISA), while it does not have a clear effect on average performance (see also Lavrijsen, Nicaise & Wouters (2013)).
However, as we already anticipated in Lavrijsen & Nicaise (2013a), such student assessments “focus
solely on the level of general skills – mathematics, reading, science. Of course, these are very important competencies, of which a decent basis is a necessity to function in modern society. However, they maybe do not tell the whole picture”. In particular, we noted that international
student assessments do not take into account the more specific skills that educational systems produce as well, e.g. through vocational education. These vocational skills may be very valuable when entering the labour market. Hence, the extent to which educational systems succeed in delivering them may also be important in understanding their quality and equity.
Our present paper will focus precisely on the effect of vocational education on labour market outcomes in different countries. To what extent does vocational educational indeed succeed in offering secure pathways into employment for the academically less-inclined? Can the specific skills delivered in vocational tracks compensate for a lower proficiency in general skills? And do the advantages offered by vocational education persist over time – or do they lose relevance when the demands by the labour market change?
Chapter 2 - Labour market returns to education
2.1 Measuring returns to education
The fact that education determines labour market outcomes to a large extent has been widely documented in the literature: better educated individuals usually enjoy higher employment probabilities, a higher occupational status, and higher earnings. In general, estimates of such “returns to education” are derived from models of the form
Yi = a + b*EDUCi + c*INDi + ei (1)
in which Y is a labour market outcome, EDUCi a measure of educational attainment, and INDi a
selection of other relevant characteristics. Hence, the higher b, the more education is rewarded in the labour market, and the higher the returns to education. This general model then can be applied in diverse forms, depending on the variables that are chosen to operationalise Y, EDUC and IND.
2.1.1 Labour market outcomes
Starting with the labour market outcome Y, the most popular options are to estimate returns in terms of (log) earnings or in terms of employment probability. Earnings have the advantage that they capture rewards in a relatively detailed way, while a dichotomous variable such as employment probability loses a lot of information. Moreover, as the share of unemployed is often rather small (about 10%), reliable estimates can only be drawn from large enough samples.
However, there are reasons to expect that estimated returns may depend on the choice of the labour market outcome. For example, while vocational education is rather successful in establishing safe routes into employment, these jobs are often of lower status than those obtained through general education (Müller and Shavit (1998)). Hence, in this paper, we will estimate returns both in terms of employment probability and in terms of earnings.
2.1.2 Individual characteristics
Regarding the individual characteristics that have to be kept under control (IND), a first important choice is whether to consider the entire population or only the male part of it. The overall labour market position of females has been changing dramatically over the past decades, and the reasons behind these changes were often related to exogenous explanations which may have worked differently in different countries (e.g. differences in family structures, in childcare policies, …). This makes the patterns of female labour positions over time difficult to interpret. In this paper, we will perform some general analyses on the full sample, but we will focus our attention to the male part of the sample, in particular when estimating time patterns.
Secondly, age is an obvious determinant of labour market position. Many analyses have shown that age has a curvilinear effect: e.g. earnings are often highest in the cohort aged around 50 years (this is a cross-sectional effect: it does not mean that individual wages decrease as persons grow older than 50). One of the reasons behind the general increase of earnings with age is that wages are complementary with training opportunities: young people are willing to accept lower earnings in exchange for better training opportunities, but these training investments have to be rewarded towards the end of the career. Age dependency can be operationalised using any of the following variables: age, real work experience, or potential work experience (i.e. age minus years of schooling). In this paper, we will use age and its square.
2.1.3 Educational variables
The most important choice in operationalising Model (1) is to choose an adequate measure of education (EDUC). In probably the best known application of Model (1), Mincer (1974) estimated the returns to education in terms of the respondents’ completed years of schooling (defined on the basis of the median age of those graduating with the same qualification as the respondent)2. Mincer then
estimated that one additional year of schooling led to around 10% higher earnings each year (in the US). This “Mincer specification” has been extensively reproduced, leading to returns typically between 5 and 10% for each additional school year, dependent on the country under study (often higher in Anglo-Saxon countries; see e.g. Trostel, Walker & Woolley (2002)); for an elaborate overview, see Harmon, Oosterbeek & Walker (2003).
However, it has been argued that the number of schooling years is only an imperfect reflection of someone’s “human capital”, i.e. the productive skills that are rewarded on the labour market. The argument is that there can be large differences between graduates from the same educational level (e.g. secondary education) and hence with the same number of schooling years. The proposed alternative to estimating returns to years of schooling would be to estimate returns to measured skills directly. For example Hanushek and Zhang (2006) (on IALS) and Hanushek, Schwerdt, Wiederhold, and Woessmann (2013) (on PIAAC) calculated the returns to “skills” directly, which were defined as the respondents’ literacy or numeracy test score. For example, in the latter paper the return to an increase by one standard-deviation in numeracy skills was estimated to be about 18%, but again with important cross-national differences).
2
Regarding the other variables in the Model, Mincer used annual earnings in Y, potential experience and its square in IND, and restricted the sample to males.
2.2 Problems with estimating returns to education
2.2.1 Ability selectivity bias
Undoubtedly the biggest and most widely discussed problem with the above setup is the possibility of unobserved ability selectivity bias (Griliches (1977); Card (1999)). The issue is that access to educational levels and tracks is not random: different educational programmes cater for different parts of the ability distribution. For example, those who enrol in tertiary education are usually of higher ability than those that do not. Hence, do the observed differences in labour market outcomes between e.g. secondary and tertiary qualified individuals really reflect the effect of going through a tertiary programme, or do they rather reflect the differences in intake?
The ideal solution to this problem would come from including some indicator of “pre-enrolment” or “innate” ability. However, this would require longitudinal datasets combining ability scores measured at a young age with labour market outcomes observed later in life; in practice, these are only sparsely available on the national level (see Meer (2007) for an example with a UK dataset).
Hence, in this paper we will follow the approach adopted by Hanushek (2011), Hanushek and Zhang (2006) and Denny, Harmon, and O'Sullivan (2004). Here, what is controlled for is not pre-enrolment ability, but rather currently observed skills, such as those measured in IALS and PIAAC. It is important to note that including currently observed skills affects the estimated return to education in two ways: it removes (part of) the selectivity due to differences in intake, but it also removes (part of) the general-cognitive effect of education itself (see the previous paragraph). Indeed, the fact that the currently observed skills of tertiary graduates are higher than those of individuals with only secondary education is both due to the selectivity of tertiary programmes and to the effect of the education itself. As we can not a priori tell which of these two effects dominates, interpreting the returns to education after current skills control should always be done with caution. We will merely use current skill control as a way to establish lower and upper bounds of the returns to education. When we do not include current skills, our estimates of these returns are probably upward biased due to selectivity, as we explained above. By contrast, when we do include them, the bias is probably the other way round, as we control out part of the advantage attributable to participating in an educational program3.
2.2.2 Heterogeneity of schooling
A second problem with the approaches outlined above is that both are “linear” in nature: they view education as a merely one-dimensional asset which can be “higher” or “lower”. For Anglo-Saxon countries, this representation may makes some sense, as their education systems are rather
3
Interestingly, Harmon, Oosterbeek & Walker (2000) have compared estimates of the returns to years of schooling (in the UK) controlled for “innate” ability (i.e. ability measured at age 7) and estimates controlled for “current” skills (observed in IALS). They found that controlling for ability at a young age only slightly reduced the estimated returns to education, while controlling for current skills led to much larger reductions. This suggests that the (upward) selectivity bias caused by unobserved (pre-schooling) ability is smaller than the (downward) bias when current skills are controlled out.
restrictively oriented towards increasing general skills (see Lavrijsen & Nicaise (2013a)). However, the educational systems in continental Europe are more diversified, with a large sector of vocational education offering different contents and skills than the general tracks do. In these countries, general and vocational secondary programmes deliver different types of skills, and these different skills may be differently rewarded in the labour market. In particular, the occupation-specific skills that vocational education delivers (e.g. the know-how and the practical skills necessary to become a car-mechanic) are not well represented in the two linear measures of schooling outlined above: both vocational and general secondary school graduates have about the same number of schooling years, while in the returns to ‘skills’ literature, these skills have been mostly restricted to general cognitive skills such as numeracy and literacy.
There may be reason to assume that this (often neglected) identification of ‘education’ with ‘increasing general skills’ may help to understand why education is often found to be differently rewarded in different nations. For example, most cross-national research (e.g. Denny, Harmon, and O'Sullivan (2004)) has found that the effect of measured skills (i.e. literacy and numeracy) on wages was higher in the US than in continental Europe. While differences in labour market regulation (e.g. centralized wage bargaining) surely can help to understand differences in monetary returns, an additional explanation may as well be that what is measured with ‘general skills’ covers better what education delivers in the American education system than in the vocationally-oriented systems of continental Europe. Note that Hanushek (2013) himself attributed the observed cross-national variation in returns to skills to differences in employment protection legislation (among others): a high EPL seemed to correlate with a low return to measured skills. However, as we argued in Lavrijsen & Nicaise (2013a), a high EPL also correlates with a strong vocational orientation of the education system. Hence, the explanation for the cross-national variation in the estimated return to (general) skills might just as well relate to such differences in orientation of the education system. In this paper, we will acknowledge that schooling may be more heterogeneous than the linear proxies suggest, by explicitly taking into account the orientation of the education of the respondent (see below).
2.3 Research questions
2.3.1 Returns to vocational education
As stated above, the perspective of this paper is to focus on the heterogeneity in the return to schooling, and in particular to the way vocational education is rewarded on the labour market. International comparative studies on the return to vocational education have been relative sparse to date due to a lack of adequate data (for studies on the national level, see e.g. Nicaise (2001) or Groenez, Heylen, and Nicaise (2010) for Belgium or Dearden, McIntosh, Myck & Vignoles (2002) for the UK). As CEDEFOP (2011) argues, most datasets containing information about labour market positions summarize the educational backgrounds of respondents in terms of the (ISCED-)level of their highest qualification, i.e. without taking into account the orientation (vocational or general) of this qualification. The major exception that CEDEFOP (2011) puts forward is the Labour Force Survey ad-hoc module 2009, which does contain information on the orientation of the qualification (but only for a subsample aged 20-35). These LFS-data were analysed in CEDEFOP (2013), in which labour market returns to secondary vocational qualifications, secondary general qualifications, tertiary technical qualifications (ISCED 5B) and tertiary academic qualifications (ISCED 5A) were estimated compared to having no secondary qualification. The main result, which we already discussed in our previous report, was that those with a secondary vocational qualification had considerably better labour market outcomes than both those with no secondary qualification and those with a secondary general qualification. However, they were less successful then those with a tertiary qualification. Moreover, the advantage seemed particularly large for those who took a workplace-based form of VET, at least at the start of the career.
In this paper, we will quantify the advantages of vocational education (both in terms of employment probability and log earnings) in two ways, first as absolute advantages and second as relative ones. The first approach is identical to that of CEDEFOP (2013): returns are determined by using the specific qualification achieved by the respondent as the measure of education, in which qualifications of the same level but with a different orientation (e.g. vocational and general secondary education) are distinguished. This means that the reference category consists of those having “no” qualification (at least none above ISCED-level 2): the “absolute” return to vocational education is the return compared to having no qualification at all. The drawback of this approach is that it generates a return to education for every single qualification separately; this makes the results less straightforwardly interpretable, and less comparable with the existing literature. Secondly, the unqualified reference category merges respondents from very different educational backgrounds. Hence, we will add another model in which we specify returns to years of schooling, but enrich it with a dummy variable indicating whether the qualification achieved was vocational in nature, and further exclude the unqualified group from this estimation (this is equivalent to Hanushek (2011)). This approach allows us to focus on the “relative” differences in the return to vocational and general programmes, controlling differences in required years of schooling.
2.3.2 The effect of general skill control
Note that CEDEFOP (2013) did not address the selectivity issue in any way; in fact, it was only argued that selectivity usually works against vocational qualifications, as their intake usually is of lower ability than that of general or tertiary programmes, and thus it can be assumed that the estimates represent only a “lower bound” of the real value of vocational programmes. However, note that this assumption is clearly violated when vocational graduates are compared with individuals without a secondary qualification; in that case, the selectivity bias probably works the other way round. Furthermore, not addressing selectivity issues may also blur cross country comparisons, as the selectivity bias may vary across countries; even when the estimates would just be lower bounds, this does not say anything about the extent to which the “real” value of vocational education approaches this lower bound across different countries.
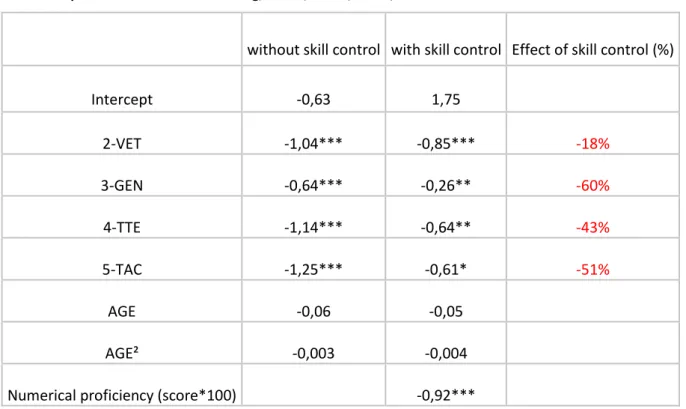
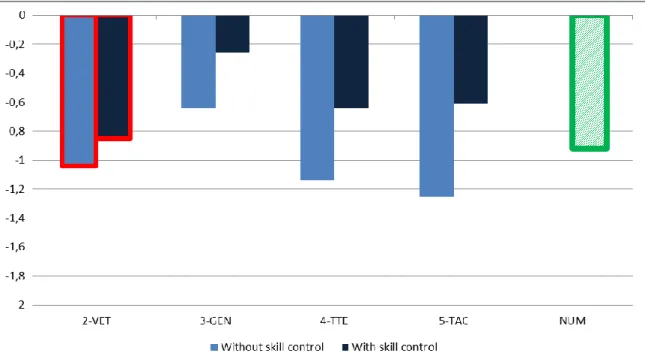
Hence, in this paper we will determine how adding skill control affects the estimated returns to different types of education, and in particular to vocational education. Due to a lack of data yet little attention has been spent on how controlling out current skills might influence the estimated returns to different types of education. As explained above, controlling out current skills probably removes selectivity bias at the cost of removing part of the education effect itself. These two effects may occur with different strengths depending on the type of education considered. While in uncontrolled models the upward selectivity bias will be strongest for academic qualifications, in models with general skills control the downward bias may be strongest for academic qualifications as well, as such programmes usually heavily invest in developing high-level cognitive skills.
There are some indirect indications that general skill control indeed may affect estimates of returns to education differently across qualifications types; e.g. Boissiere, Knight & Sabot (1985) found that cognitive skill control reduced the estimated return to education less for manual workers than for high-skill jobs. It is also relevant to consider how differential effects of skill control depending on education type might learn us something about the mechanisms that explain why education is rewarded in the labour market. Above, we have implicitly adhered to a Human Capital perspective: education is rewarded in the labour market because it learns individuals something valuable (productive skills). However, other perspectives have claimed that education is rewarded for other reasons (Van de Werfhorst (2011)). For example, one of the major alternative perspectives has put forward that education would shape “personality” traits, such as discipline or work ethic, rather than raising directly productive skills.4. In fact, this claim was grounded on the observation that controlling
out skills only slightly influenced (about -20%) the estimated return to education (measured in terms of schooling years; e.g. Bowles, Gintis & Osborne (2001)). However, note that this rationale again assumes that “productive skills” equals cognitive skills – hence, occupation-specific skills are neglected again. This may well be one of the reasons for the low effect of general skill control. In fact, this argument was already developed by Barone & Van de Werfhorst (2011). On IALS-data, they demonstrated that while controlling out general skills indeed reduced the return to years of schooling by only 25-35%, additionally including specific skills (e.g. the ability to interpret a technical
4
Another alternative explanation has been that educational qualifications are just indications of “signals” of innate ability: those with highest ability enrol in the programmes at the highest level, and it is this innate ability that gets rewarded in the labour market, e.g. because more able individuals can be more easily trained by the firm (Wolf (2004)). Hence, in this perspective education would not deliver productive skills itself, but only signal someone’s previous position in the innate ability distribution. However, such “signalling” theories seem to have only limited empirical validity (Van de Werfhorst (2011); Kroch & Sjoblom (1994); Carneiro, Dearden & Vignoles (2010); Borjas (2005)).
manual) reduced it with over 50%. Moreover, they observed that the effect of general skill control was smaller in vocational-oriented Germany than in the US, while the effect of the specific skill control was larger in Germany. Hence, directly examining the effect of cognitive skill control on the return to different types of qualifications can add to this observation.
2.3.3 Effects over time
As we discussed above, a typical Mincer specification is curvilinear: wages first increase with age (by cohort) and then flatten and eventually decrease. In terms of earnings, this can be explained by a trade-off between wage and training opportunities: at the start of the career, individuals are more eager to invest in training as they still can benefit from this investment for a longer period of time. Moreover, this curvilinear age pattern is expected to be steeper for the highest educated, who are usually more likely to participate in training.
Secondly, it has been observed that particularly vocational qualifications lose some of their value over time. Using IALS-data, Hanushek (2011) demonstrated that the employment probabilities of vocational graduates decreased with age, relative to those of general graduates. This has been attributed to changing labour market demands: when job requirements change, the occupation-specific skills delivered by vocational education become obsolete. Hence, occupation-occupation-specific skills may be primarily important at the start of the career, but they risk losing some of their relevance as (e.g. technological) developments alter the requirements of the occupation. This would call for a genuine investment in the general skills, also within vocational tracks, as this would enable workers to adapt to changing labour market needs (versatility), in particular through participation in life-long-learning.
Thirdly, it has been argued that returns to skills (controlled for educational attainment) increase with age. This could be explained as follows: at initial hiring, the employer is mostly unaware of the real skills of the applicant and hence has to rely on directly observable measures of school attainment.
However, over time employers gain better knowledge of the real skills of individuals and hence real skills are rewarded, irrespectively of formal educational attainment (Altonji & Pierret (2001). Indeed, Hanushek and Zhang (2006) observed in the IALS that, when both qualifications and measured skills were added to the model, the effect of measured skills increased over time. Similarly, Hanushek, Schwerdt, Wiederhold, and Woessmann (2013) concluded that returns to skills (as measured in PIAAC) indeed seemed to increase with age.
Hence, our major research question is: how does the return to different types of qualifications and skills change over time?
2.3.4 Educational system design
There is a long tradition of research into cross-national differences in the design and outcomes of vocational education (Shavit & Muller (2000); Müller and Shavit (1998); Iannelli & Raffe (2007)). In short, an important distinction has been made between countries that have developed large vocational tracks, closely tied to the labour market (e.g. Germany), and countries that have not or only weakly developed such tracks within the formal educational system, at least not at the secondary level (e.g. the US). Within the “vocational-oriented” category, further distinctions have been made regarding the age at which students are directed towards this vocational track (ranging between age 10 as in Germany, and 16 as in Scandinavia) or depending on where the delivery of vocational skills takes place (in a dual arrangement with a firm as in Germany, or primarily in a school-based setting as in Flanders or the Netherlands). In Lavrijsen, Nicaise & Poesen-Vandeputte (2014) we used such characteristics to propose a typology of educational systems:
1. The dual systems (Germany, Austria) have a well-developed VET, closely tied to the labour market, which delivers occupation-specific skills mostly through workplace-training.
2. The school-based vocational systems (the Netherlands, Belgium) also have a sizeable VET sector, but apprenticeships are less common.
3. Comprehensive-vocational systems (Sweden, Finland, Norway and Denmark) share with the previous groups a highly developed VET in upper secondary, but pupils are tracked at a later age and vocational and general programmes are more interrelated.
4. The general-oriented countries (US, and to a lesser extent Ireland and the UK) have low VET enrolment rates, with VET often being organised outside the regular educational system. Ties between the educational system and the labour market are relatively weak (many students will lead to a medium-level general qualification which lacks direct relevance for the labour-market); instead, there is a strong focus on tertiary education. This leads to a polarised skill structure.
5. The Mediterranean countries (Spain, probably Italy and maybe France) show an overall low congruence between educational attainment and labour market needs and a less developed VET sector. Many students drop out of school without a secondary qualification.
Cross-national studies have indeed demonstrated that vocational-oriented systems, and in particular the dual systems, provide safe pathways into work for their vocational graduates, and hence low unemployment rates among them (Iannelli & Raffe (2007); Bol & Van de Werfhorst (2013); Shavit & Muller (2000); Allmendinger (1989); Breen (2005); Gangl (2001); Gangl (2003)). On the other hand, the jobs of vocational graduates tend to be of lower status (Shavit & Muller (2000)). CEDEFOP (2013) as well observed that vocational qualifications had the most positive effect on employment probability of young graduates in Germany and Austria.
However, note that there are a number of obstacles when comparing returns to qualifications across countries. A first major difficulty is the categorisation of national qualifications into international
comparable categories. For example, medium-level qualifications have often been divided into two categories: vocational programs preparing pupils for immediate entry in the labour market, and general programs preparing pupils for tertiary education. While this may correspond well to the qualification structure in some countries, other countries have qualifications that do not fit that well into the dichotomy (e.g. the “technical” tracks in Flanders that have mixed aims of preparing for direct labour market entry but partly for tertiary education as well). Another complication is that usually we have information on the highest qualification achieved only. However, countries differ in the possibilities offered to vocational secondary graduates to transfer into some form of post-secondary or tertiary education. This may also obscure the analysis of returns e.g. to vocational secondary education, as those who continued may not report vocational secondary education as their highest qualification achieved. A third, more general problem is that selectivity in the intake of different programmes differs across countries. For example, in countries with small numbers of tertiary graduates, the (innate) ability of this elite can be expected to be higher than in countries were tertiary education is more accessible. Controlling out current skills in order to avoid selectivity will not be a good solution here, as this control takes away part of the effect of education itself, while countries may differ in the degree to which education produced these skills.
The remarks made above (e.g. cross-national differences in selectivity) apply to all qualification categories. This makes the estimation of returns to qualifications compared to a specific reference group (e.g. vocational qualifications compared to the unqualified) particularly difficult, as also this reference group is differently composed across countries (and, in addition, this group is very small in some countries). Hence, we will limit our analysis of cross-country differences to a merely descriptive one. However, we will additionally consider how the educational system as a whole influences the fate of different social groups on the labour market, and in particular for students from the lower social classes. This is inspired by the repeated observation that vocational education is a gateway to a safe entry into the workforce primarily for the socially disadvantaged (Teese (2011); Shavit & Muller (2000)).5
Hence, given the expected value of vocational education and given the fact that the socially disadvantaged seem to make disproportionate use of this pathway, how do we expect the design of the educational system to mediate the effect of social background on labour market outcomes? Using data from several datasets (IALS, ISSP, EHCP), Brunello & Checchi (2007) showed that the social background effect was mediated by the stratification of the educational system in terms of tracking age and vocational specificity. In particular, social background was shown to influence educational attainment (years of schooling, high school graduation, enrolment in tertiary education) more strongly in early-tracking countries. However, a strong vocational specificity decreased the effect of social background on employment probability. Bol & Van de Werfhorst (2013) and d'Addio (2007) also found that stratified systems at the same time reduce youth unemployment and reinforce social background effects on educational attainment (years of schooling, reading proficiency). Kogan & Muller (2003) additionally showed that although stratification may succeed in securing safe pathways into the workforce, it also limits the options of the disadvantaged in accessing high-status jobs, leading to larger correlations between social background and occupational status. In the same vein,
5
A related explanation is that the socially disadvantaged have less powerful social networks at their disposal (Pistaferri (1999), Pellizzari (2010)), while vocational education offers them other reliable pathways in the labour force; e.g. CEDEFOP (2012) showed that vocational graduates make more use of formal channels and previous experience when looking for a job than do general graduates, who have a higher inclination towards informal networks.
many studies (see Jerrim (2014) for a review) found that parental-income elasticity (the extent to which a son’s earnings are unrelated to those of the father) is particularly large in the Scandinavian systems, and smaller in continental Europe but also in countries with weaker VET systems (e.g. US, UK).
In sum, the existing evidence seems to point at two different tendencies: for the socially disadvantaged, a strong vocational sector proves a major safety-net, securing pathways into safe employment, but - especially in the early-tracking countries in continental Europe - this may come at the price of blocking attractive routes into tertiary education, and subsequently, high-status and well-paid jobs. On the other hand, the absence of early vocational options, as in the general-oriented countries, keeps opportunities open for everybody as long as possible, but provides less options for those not making it (cf. Allmendinger (1989)). Note that these rationales seem to align with our description of the ideological foundations of both welfare states and educational regimes (Lavrijsen, Nicaise & Poesen-Vandeputte (2014)): in conservative welfare states (and their tracked educational systems), the primary objective is to provide employment security, even when this comes at the expense of limited mobility; in the liberal welfare states (general oriented countries), mobility is the highest objective, even if this leads to dualisation with those who do not make it having limited support or alternatives; in the social-democratic welfare states (Scandinavian countries), the universalistic principle aims to combine social mobility with security.
2.4 Summary
In this section, we will summarise the main indications from the literature review above to develop the empirical models we will construct in this paper.
As stated above, we will estimate returns to education on three labour market outcomes: employment probability, occupational status, and earnings. For all three outcomes, we will start estimating returns to education with models of the form
Yi = a + b*Qi + c*INDi + ei (2)
in which Qi is the highest qualification achieved. Note that we will take the unqualified respondents
as the reference category. However, the estimates for vocational education should not only be compared with this unqualified category, but also with the other qualifications.
Then, we will add general skills to see how this influences the estimates: Yi = a + bq*Qi + bs*SKILLSi+ c*INDi + ei (3)
Remember that including current skills removes (part of) the selectivity bias but also (part of) the general cognitive effect of education itself; we expect for both reasons that vocational qualifications prove most resistant against skill control, as these cover also occupation-specific skills.
Finally, we will model interactions between age, qualification groups and skills:
Yi = a + bq*Qi + bq*a*Qi*age + bs*SKILLSi + bs*a*SKILLSi *age + c*INDi + ei (4)
We expect skill levels to become more important with age, as these skills are not completely transparent to the employer in the beginning of the career. We particularly expect vocational qualifications to lose some of their value with age, as their specific skills component may become obsolete over time.
We will also consider the relative value of a vocational orientation more closely by merging several qualifications into two categories (general or vocational) which than are compared by estimating
Yi = a + by*YOSi + bv*VOCi+ bv*a*VOCi*age + bs*SKILLSi + bs*a*SKILLSi *age + c*INDi + ei (5)
in which YOSi is the number of completed years of schooling and VOCi a dummy variable reflecting
the vocational nature of a qualification.
Finally, we will look at some cross-country differences in the returns to education. However, note that this is a rather difficult task as countries may differ in the definitions of programmes or in the selectivity at intake. Hence, we will consider the education system as a whole and examine how labour market outcomes are distributed across different social groups.
Chapter 3 - Sample
3.1 General description of the data
As CEDEFOP (2011) concluded, it is difficult to find adequate large-scale comparative data concerning labour market outcomes of vocationally educated individuals. We will use the two datasets which have the richest content in this regard, i.e. the 2009 ad-hoc module of the Labour Force Survey (LFS) and the first wave of the Programme for the International Assessment of Adult Competencies (PIAAC). Data for LFS were collected between January and December 2009 (Austria, Belgium, Denmark: April - June 2009), while PIAAC was conducted in August 2011 - March 2012 (France: September-December 2012).
Both datasets contain information on all three variables in the models outlined above: - Y - labour market outcomes, i.e.
o whether the respondent is employed o earnings
- Q - the ISCED-level of the highest qualification of the respondent, and whether this was
general or vocational in nature
- IND - other relevant individual characteristics, such as age, sex, country of birth, and
educational level of the parents
However, there are two main differences between LFS and PIAAC. First, the LFS ad-hoc module was focussed on youngsters aged 15-35, while PIAAC contains information on 15-65 year olds. Secondly, the LFS does not contain information on the general skills level of the respondents, while PIAAC does. Hence, PIAAC is our natural first choice when we want to study the returns to education over a larger time frame and the way they are influenced by the general skill levels of graduates. However, note that for the overlapping age cohort (15-35), the LFS contains data on a much larger sample. Hence, we will use LFS here to check the validity of inferences based on the (smaller) PIAAC-sample by comparing them with estimates for the overlapping cohort on LFS.
3.2 Delimitation of the sample
In both datasets, we excluded persons aged under 20 since a large majority of these respondents is still in (compulsory) school. All respondents who are still in formal education were excluded as labour market outcomes for this group are mostly inexistent. We will exclude respondents aged over 55 for two reasons: first, to cancel out any biases due to differences in early retirement policies across countries, and second, because persons above this age (i.e. born before 1957) often have backgrounds in quite different education systems than today; for example, many European countries have deeply reformed their education systems during the ‘60s and early ‘70s.
Foreign-born respondents and respondents with foreign qualifications were excluded as well, as we are primarily interested in the effect of the education system of the current country of residence. We also excluded persons in compulsory military service.
As explained above, we will present analyses both on the full sample and on the sample restricted to males.
3.3 Countries and sample sizes
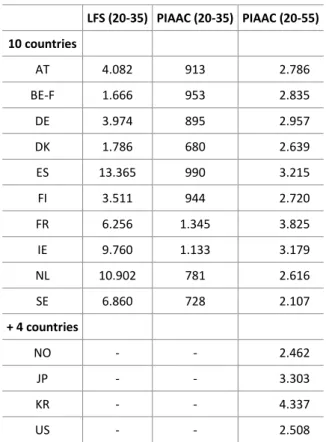
PIAAC contains information on 23 countries. We will not examine the 5 Central and Eastern European countries (Poland, Estonia, Slovakia, Czech Republic, Russia), because their educational and labour market systems have been under tremendous change in the past decades, which makes comparisons with other educational and labour markets difficult (see Lavrijsen, Nicaise & Poesen-Vandeputte (2014)). We also had to exclude 4 other countries because of data difficulties: Australia did not make its microdata publicly available, data for Canada lacked detail on the qualification level, and data for the UK and Italy did not adequately distinguish between general and vocational graduates, grouping several types of vocational graduates into a single category with graduates from general programmes. This leaves the following 14 countries to study: Austria, Belgium (Flanders), Denmark, Finland, France, Germany, the Netherlands, Sweden, Spain, Ireland, Norway, the US, Japan and Korea. For the first 10 countries in this list, we also have the corresponding LFS-data6. Table 1
contains the resulting sample sizes.
6
The US, Japan and Korea do not take part in the LFS-survey, while LFS-data for Norway do not distinguish between vocational and general education. As PIAAC only contains data on the Flemish part of Belgium, we will in what follows always restrict the Belgian LFS-sample to Flanders.
Table 1: Sample sizes LFS (20-35) PIAAC (20-35) PIAAC (20-55) 10 countries AT 4.082 913 2.786 BE-F 1.666 953 2.835 DE 3.974 895 2.957 DK 1.786 680 2.639 ES 13.365 990 3.215 FI 3.511 944 2.720 FR 6.256 1.345 3.825 IE 9.760 1.133 3.179 NL 10.902 781 2.616 SE 6.860 728 2.107 + 4 countries NO - - 2.462 JP - - 3.303 KR - - 4.337 US - - 2.508
3.4 Data definition and comparison
In this Chapter, we will define the different dependent and independent variables and consider the similarity between LFS and PIAAC in these definitions.
3.4.1 Educational background
3.4.1.1 Qualifications
Both LFS and PIAAC contain information on the level of the highest qualification of the respondent. Centrally provided classification schemes have allowed the conversion of national qualifications into international categories in an standardised way, in which both the ISCED-level and the content of the programme was taken into account (with programmes considered as “vocational” when more than 25% of their content was oriented towards a specific class of occupations or trades). This allows us to establish five broad groups of respondents:7
- “1-ESL”: persons with no secondary qualification, i.e. no qualification higher than ISCED-level 3c-short (this corresponds to the group of “early school leavers” as defined by the European Commission);
- “2-VOC”: vocational medium degrees, consisting of both
o respondents with an ISCED 3-qualification explicitly marked as a vocational degree (note that technical tracks were usually not regarded as vocational)
o respondents with an ISCED 4-qualification, regardless of whether this was explicitly marked as a vocational degree or not. The reason for this unambiguous choice is that countries were not very consistent in describing the orientation of their ISCED4-courses, often merging several types of courses in one broad unlabelled category8.
However, most ISCED4-courses are meant either as a specialisation course for students from vocational secondary tracks or as preparation course for vocational graduates wishing to continue to a tertiary programme (see also CEDEFOP (2011), p. 24).
- “3-GEN”: general medium degrees, consisting of respondents from ISCED 3-programmes that were not marked as vocational. Importantly, in many countries with three tracks the
intermediate tracks were classified as general courses as well (e.g. the Flemish ‘technical’ TSO, the Dutch havo);
7
In Annex 1, we explain how this classification summarises the more detailed national-specific patterns reported for the Flemish Region.
8
For example, for PIAAC all Flemish ISCED4-courses were merged in a single unlabelled category, although we know from national data that these courses mostly consist of vocational specialisation courses (7th year or 4th grade of BSO) (see Annex).
- “4-TTE”: technical tertiary degrees, i.e. respondents with a ISCED 5B (tertiary non-university) qualification;
- “5-TAC”: tertiary academic degree, i.e. respondents with a ISCED 5A (university) or ISCED 6 (doctoral) degree.
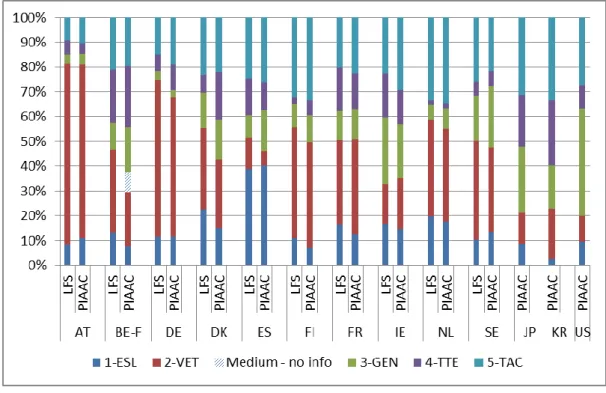
In line with the literature, we will consider categories 2 and 4 as being vocational in nature, while categories 3 and 5 are considered as general qualifications (Hanushek (2011); CEDEFOP (2013)). Figure 1 summarises the qualification structures of the 20-35 cohorts in the countries under study9.
The qualification structures reveal the different logics behind various educational systems. For example, Austria and Germany clearly stand out because of their strong emphasis on medium-level vocational qualifications. By contrast, the US and Ireland have relatively few vocational graduates but many medium-general and tertiary qualifications. The Nordic countries (Finland, Sweden, Denmark) and France, the Netherlands, and Flanders are characterised by a rather high share of university graduates and a medium share of vocational qualifications. Finally, Spain stands out because of the high number of unqualified school-leavers (and a low number of medium-level vocational qualifications).
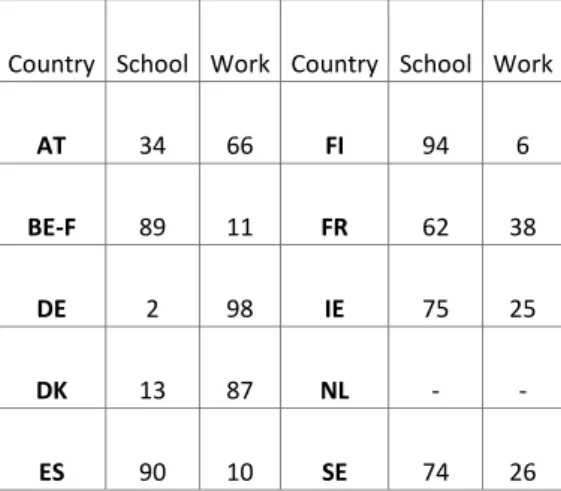
For the vocational qualifications, the LFS-data further indicated whether or not the vocational training was mainly school-based (at least 75% of vocational training hours spent in school) or rather workplace-based. Table 2 conforms the dual structure (high emphasis on apprenticeships) in Austria, Germany and Denmark, while such arrangements are rather marginal in Flanders, Finland, and Spain. Unfortunately, we cannot use similar information in the PIAAC-data.
9
Note that respondents with a qualification ‘ISCED 3C-short’ are usually included in the group “no secondary qualification”. This level of qualification is rare (<1%) in all countries except Denmark, where more than 5% of the sample holds it; this might explain the seemingly high share of unqualified respondents in Denmark.
Table 2: Share of vocational qualifications obtained through school- versus workplace-based training
Country School Work Country School Work
AT 34 66 FI 94 6 BE-F 89 11 FR 62 38 DE 2 98 IE 75 25 DK 13 87 NL - - ES 90 10 SE 74 26
3.4.1.2 Selectivity
Moreover, when analysing cohort effects in the returns to education, in addition to the information on the educational background of the respondent himself, we will also include information on the background of his age cohort. This is done because the selectivity of different programmes has changed over time as a result of educational expansion, and hence the bias in the estimated returns to these programmes may have changed too. For example, consider the expansion of university education. Whereas previously less than 10% of a cohort obtained a university certificate, this share has now increased to over 30% in some countries (Figure 1). If we assume that universities cater only for the most able – and/or socially privileged – youngsters, and if the market power of educational degrees is correlated with their relative scarcity10
, the average value of the intake in terms of human, economic and social capital must be lower today and we can expect lower “returns” to tertiary education, even if the intrinsic quality of tertiary education itself has remained constant.
To accommodate for this, we construct a selectivity index SELQUAL for each
country*cohort*educational level combination. This index is constructed by assuming that tertiary education (ISCED 5-6) caters for the most able and privileged individuals, followed by medium (ISCED 3-4) and then low qualifications (ISCED 0-2). Then, we will consider the share of the cohort that acquired a given qualification. For example, in a country*cohort where 10% of the respondents acquired a high qualification, we assume that these 10% came from the top end of the (pre-enrolment) ‘capability’ distribution11
(i.e. between the 90th and 100th percentile): all respondents from this country and cohort with a tertiary qualification receive a selectivity index equal to (90+100)/2 = 95. For a younger cohort in this country, e.g. in which tertiary education expanded up to 30% of the cohort, the selectivity index drops to (70+100)/2 = 85, which indeed reflects that
10
Access to education is socially biased, in the sense that youngsters from socially disadvantaged backgrounds are often less eager to continue to tertiary education than equally able peers from advantaged backgrounds. In this sense, the link between selectivity and average ability of participants in a given education programme is not an exclusive one. However, note that this bias has been shown to be a long-lasting tendency (Shavit & Blossfeld (1993)), and hence our assumption that the average intake ability has gone down during the recent educational expansion does not seem to be compromised. Secondly, note that highly selective educational institutions may also produce shortages in the supply of these qualifications on the labour market, which may also lead to increased returns to selective educational programs.
11
The term ‘capability’ - rather than ‘ability’ - is used here to represent the joint effect of individual ability, socio-economic background and ‘market power’ of students.
tertiary education has become less selective. This approach is identical to the one adopted by Hanushek and Zhang (2006) and Hanushek (2011).
Note that the inclusion of a selectivity index may lead to underestimation of the returns to education as such, as the index captures part of main effects of continuing education (as the most valued programmes are usually also the most selective, e.g. tertiary academic education). However, in the following analysis we are interested in the age patterns rather than the level of the returns to education.
3.4.1.3 Measured skills
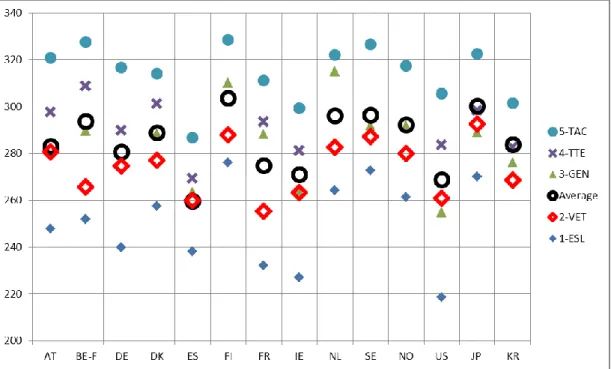
PIAAC contains information on the skill proficiency of the respondents in two main domains, i.e. numeracy and literacy (besides these, problem solving skills in a digital environment were tested, but only for those able to work with a computer. Figure 2 shows the distribution of skill scores (the average of numeracy and literacy in the 20-35 sample). There is a clear difference between the overall low skill level in Spain and the overall high skill level in the Scandinavian countries (Finland, Sweden) and the Dutch speaking countries (Flanders, the Netherlands). Secondly, the general proficiency of vocational graduates does not completely follow this picture: it is still high in Finland, the Netherlands and Sweden, but relatively low in Flanders.
As the different domains are quite strongly correlated, we will further only use the numeracy skill scores as the independent variable, as this skill type has the highest predictive power in labour market outcomes. For practical reasons, we will always use 100 numeracy points on the PIAAC-test as the unit of numeracy. This corresponds to a change of about two standard deviations in numeracy.
3.4.2 Labour market outcomes
3.4.2.1 Employment
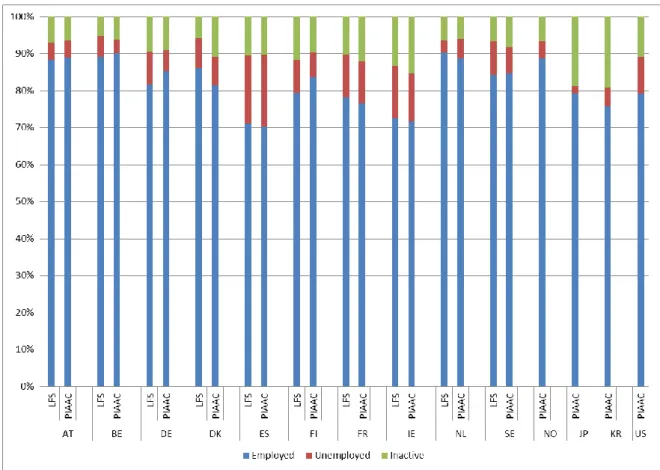
Both LFS (variable ILOSTAT) and PIAAC (variable C_D05) contain information on the employment status of respondents in three categories (employment, unemployment, inactivity). Note that as the surveys were collected at different time frames (LFS: 2009 vs. PIAAC: 2011/2012), we may expect a shift in unemployment figures. Further remember that respondents still in education were excluded from our sample, rather than being counted as inactive as is usually done when calculating unemployment and inactivity figures.
Figure 3 compares the employment figures in the 20-35 cohort in both datasets. Obviously, a distinction can be made between the countries with high youth employment (> 85%: Austria, Flemish Region, the Netherlands) versus those with low youth employment (< 75%: Ireland, Spain).
However, note that the categories “inactive” and “unemployed” host rather small numbers of respondents in PIAAC (each between 30 and 200 respondents in every country). This makes their analysis as separate categories difficult. Moreover, it has been argued that the distinction is not always very clear; e.g. the inactivity category also contains many long-term (involuntary) unemployed
persons who have lost their entitlement to unemployment benefits. In the remainder we will merge both categories into a single “non-working” category.
3.4.2.2 Earnings
Both datasets contain information on the earnings reported by the respondent. LFS reports only the respondents’ relative position (decile) in the national income distribution (variable INCDECIL), which is defined as “the monthly (take-home) pay after deduction of income tax and National Insurance Contributions. It includes regular overtime, extra compensation for shift work, seniority bonuses, regular travel allowances and per diem allowances, tips and commission, compensation for meals.” This variable is only recorded for employees (thus not for the self-employed) and is missing for the Netherlands and Sweden.
In PIAAC the information on earnings is more genuine. First, all 14 countries report information on the earnings decile (variable EARNMTHALLDCL), defined as the ‘Monthly earnings including bonuses for wage and salary earners and self-employed, in deciles’ (note the inclusion of the self-employed). Moreover, PIAAC contains information on absolute earnings for 10 countries (missing for Austria, Germany, the US and Sweden; variable EARNMTHALL= ‘Monthly earnings including bonuses for wage and salary earners and self-employed’). In line with Hanushek, Schwerdt, Wiederhold, and Woessmann (2013), we excluded the top and bottom 1% from the earnings distribution of every country, which usually include many coding errors.
In this report, we will use both types of earnings data. First, using relative figures (deciles) has the advantage that we can compare results with LFS and that we have information for all countries; using absolute income figures has the advantage that it better suits with usual return to education estimates from the literature.
3.4.2.3 Life-long learning
Both datasets contain information on participation in learning activities. As in this paper we are primarily interested in determining the influence of lifelong learning on labour market outcomes, we will only consider participation with a job-related purpose. Note that LFS only considers participation in the previous 4 weeks (COURATT: “Attended any courses, seminars, conferences or receive private lessons or instructions outside the regular education system within the last four weeks”,) with an indication whether the “most recent” learning activity (only) was job-related. This leaves only very limited information on LLL-participation (see the recent publication by Steunpunt WSE for Belgium,
http://www.steunpuntwse.be/system/files/arbeidsmarktflits_2014-06-23.pdf).
By contrast, PIAAC considers participation in LLL within the entire previous year, and does not limit itself to the most recent activity only. Moreover, PIAAC contains information on the number of hours that respondents participated in education, but unfortunately only for non-formal learning activities. Participation in job-related LLL equalled about 46% for the entire PIAAC-population, with higher values in the Scandinavian countries and lower values in Southern countries (France, Italy) and to a lesser extent Belgium (42.4%).
However, while the information from PIAAC is more extensive than that from the LFS, it still does not really allow to test whether differences in participation in LLL is indeed the main driver of the expected differences in the life cycle patterns across educational programmes (see 2.3.3). Indeed, while it seems obvious that participation in LLL raises employment probability in the long term (because of a more up-to-date skill profile), there are numerous methodological pitfalls. For example, any correlation between participation in LLL during the previous year and having a job at the moment of the interview may be biased by the fact that most LLL activities take place at the workplace (one of the questions used to determine participation in job-related LLL (B_Q013) indeed explicitly refers to participation in work-place-based LLL activities). Hence, a positive relationship between participation in LLL and employment is to be expected indeed, but the causality might go both ways.
Hence, in this document we will not consider into detail the mediating role of LLL in explaining our results. We just suggest that LLL might indeed be one of the underlying factors explaining differences in labour market success; vocational respondents indeed take less part in LLL (42% of the employed respondents) than those with a tertiary technical (55%) or academic degree (67%), though their participation rate still equals that of their general secondary peers (40%) and exceeds that of unqualified respondents (28%). Moreover, there seems to be a strong cross-country variation in participation to LLL: in the Scandinavian countries, up to 50-60% of the vocational respondents participated in at least one LLL activity during the previous year, while in Belgium (Flanders) and France this amounts to no more than 25%.
However, a further investigation of these and other patterns is referred to the next SSL-report in this research line, in which we will also make use of the recent wave of the Adult Education Survey which contains much more detailed information about LLL participation.
3.4.3 Other individual characteristics
Both the LFS and PIAAC-data contain information on the parental background of the respondents (highest educational level of mother or father). Here “low educated parents” refer to parents with qualifications at ISCED-level 0, 1, 2 or 3c short, “medium educated parents” to qualifications at ISCED-level 3-4 (without 3c short) and “high educated parents” to ISCED-levels 5 or 6. As parental background is missing in a significant number of the PIAAC-cases for France (+20% missings), we will exclude that country from our analyses on the effect of social background.
PIAAC indicates the experience with working-life of the respondent (variable C_Q09_C, “Current status/work history - Years of paid work during lifetime”). LFS does not contain this variable.
Finally, both datasets contain information on the gender of the respondents (0 = male, 1 = female) and their age (reported in 5-year bands).
Chapter 4 - Returns in terms of employment
probability
4.1 The PIAAC-sample compared with LFS
We start by estimating the following multinomial model on both the LFS- and the PIAAC-sample (restricted to 20-35 year olds) to examine the validity of the latter. The model estimates the effect of having a specific qualification on the odds of being unemployed or inactive (relative to having a job), with unqualified respondents as the reference category:
Yi = a + b*Qi + c*INDi + ei (2)
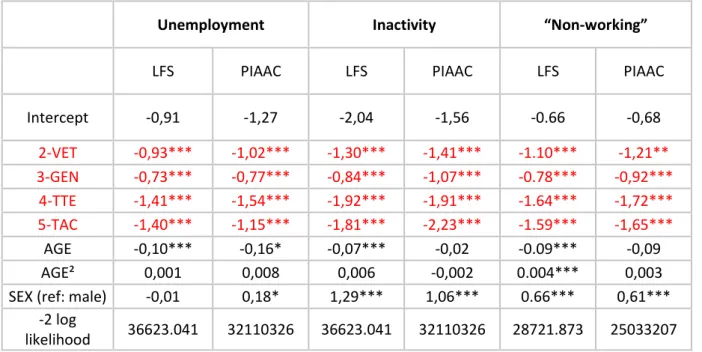
IND contains age, age squared and gender; we also included country fixed effects and cluster standard errors by country. We also estimated the same model with “not having a job” as the outcome category, i.e. merging the inactive with the unemployed category. The results are presented in Table 3 (in this and all following tables in this report, we indicate statistical significance with *** (p < 0.01), ** (p < 0.05), * (p < 0.10)).
Table 3: Estimates of returns to education, LFS and PIAAC (males + females, 10 countries)
Unemployment Inactivity “Non-working”
LFS PIAAC LFS PIAAC LFS PIAAC
Intercept -0,91 -1,27 -2,04 -1,56 -0.66 -0,68 2-VET -0,93*** -1,02*** -1,30*** -1,41*** -1.10*** -1,21** 3-GEN -0,73*** -0,77*** -0,84*** -1,07*** -0.78*** -0,92*** 4-TTE -1,41*** -1,54*** -1,92*** -1,91*** -1.64*** -1,72*** 5-TAC -1,40*** -1,15*** -1,81*** -2,23*** -1.59*** -1,65*** AGE -0,10*** -0,16* -0,07*** -0,02 -0.09*** -0,09 AGE² 0,001 0,008 0,006 -0,002 0.004*** 0,003
SEX (ref: male) -0,01 0,18* 1,29*** 1,06*** 0.66*** 0,61*** -2 log