Evaluation
of the
representati
of the Dutch
air quality
Evaluation of the representativeness of the
Dutch air quality monitoring stations
The National, Amsterdam, Noord-Holland, Rijnmond-area,
Limburg and Noord-Brabant networks
Evaluation of the representativeness of
the Dutch air quality monitoring
stations
The National, Amsterdam, Noord-Holland, Rijnmond-area, Limburg and Noord-Brabant networks
Colophon
© RIVM 2012
Parts of this publication may be reproduced, provided acknowledgement is given to the 'National Institute for Public Health and the Environment', along with the title and year of publication.
P.L. Nguyen, RIVM
G. Stefess, RIVM
D. de Jonge, GGD Amsterdam
A. Snijder, DCMR
P.M.J.A. Hermans, Province of Limburg
S. van Loon, Province of Noord-Brabant
R. Hoogerbrugge, RIVM
Contact:
R. Hoogerbrugge
Centre for Environmental Monitoring
Ronald.Hoogerbrugge@rivm.nl
This investigation has been performed by order and for the account of Directorate-General for Environmental Protection, within the framework of 680704 Reporting Air Quality
Abstract
Evaluation of the representativeness of the Dutch air quality measurement stations
In the Netherlands, stations measuring air quality for various measurement networks are sub-categorised as follows: rural, urban and street stations. This distinction is necessary for the interpretation of measurements and is based on where the station is located. A study by the National Institute for Public Health and the Environment (RIVM) has shown that for most stations, this classification is correct. In some cases, however, due to local activities, the classification does not hold for all components. For example, if a farm is located nearby a rural station, then the concentration of most components may correspond to the background concentrations but the concentration of ammoniac may be high. This information is necessary when modelled concentrations are compared with measurements . This study has also investigated which stations from other networks can be used on a national scale, for example, for the production of the Dutch concentration map.
The difference in measurements between the various types of station was particularly prominent for nitrogen dioxide (NO2). At the same time, stations in the same category showed comparable concentrations of nitrogen dioxide. For particulate matter (PM10) the distinction between the background and traffic stations was less clear. At some stations, the influence of industrial sources was clearly observed by the concentrations of particulate matter that were
measured.
For this study, data from all the measurement stations of the Dutch National Quality Monitoring Network were used. In addition, data provided by the networks of the Municipal Health Service (GGD) Amsterdam, the Environmental Protection Agency Rijnmond (DCMR), the provinces of Noord-Brabant and Limburg, were used. The vicinity of measurement stations was assessed by using photographs and maps of these stations.
Keywords:
Rapport in het kort
Evaluatie representativiteit Nederlandse luchtkwaliteitmeetstations Nederlandse meetstations voor de luchtkwaliteit van diverse Meetnetten Luchtkwaliteit worden onderverdeeld in bepaalde categorieën: regionale, stadsachtergrond- en straatstation. Dit onderscheid is nodig om de
meetresultaten te kunnen interpreteren en wordt gemaakt op basis van de omgeving van de stations. Deze ‘classificatie’ klopt bij de overgrote meerderheid van de meetstations, zo blijkt uit onderzoek van het RIVM. In sommige gevallen gaat de classificatie door lokale omstandigheden niet op voor alle gemeten stoffen. Als er bijvoorbeeld een boerderij in de buurt van een achtergrondstation is komen te staan, kunnen de meeste stoffen overeenkomen met de
achtergrondwaarden maar kan de ammoniakconcentratie hoog zijn. Deze informatie is nodig bij het vergelijken van luchtkwaliteitsmodellen met de meetresultaten. In het onderzoek is ook vastgesteld welke stations van andere meetnetten dan het Landelijk Meetnet Luchtkwaliteit (LML) voor landelijke doeleinden zijn te gebruiken, zoals voor de grootschalige concentratiekaart Nederland (GCN).
Vooral bij stikstofdioxide (NO2) was het verschil tussen de stationstypen duidelijk terug te zien in de gemeten waarden. Tegelijkertijd gaven
gelijksoortige stations door heel Nederland vergelijkbare concentraties stikstof aan. Bij PM10 (fijn stof) was het onderscheid tussen de achtergrond- en verkeerstations minder duidelijk. De invloed van verkeer op de hoeveelheid fijn stof is minder groot. Bij sommige stations was wel de invloed van
industriebronnen duidelijk terug te zien in de gemeten PM10-waarden. Voor dit onderzoek zijn data gebruikt van alle LML-stations, die in beheer zijn van het RIVM. Daarnaast zijn gegevens gebruikt die de meetnetten van de GGD Amsterdam, de Milieudienst Rijnmond (DCMR), de provincie Noord-Brabant en de provincie Limburg beschikbaar hebben gesteld. De omgeving van de stations is beoordeeld op basis van foto’s en landkaarten van deze locaties
Trefwoorden:
Contents
Summary—9
1
Introduction—12
2
Documentation of studied Air Quality Monitoring networks—13
3
Study of the micro and macro status of the stations—17
4
Study of the representativeness by means of principal component
analysis—19
4.1
Method—19
4.2
Data sets—19
5
Screening results of NO2 and PM10 measured in five monitoring
networks—21
5.1
NO2—21
5.2
PM10—29
6
Screenings results obtained with measurements in monitoring networks
of RIVM, GGD Amsterdam and DCMR—35
6.1
NO2—35
6.2
NO—36
6.3
PM10—38
6.4
CO—38
6.5
O3—39
6.6
SO2—42
6.7
Pollutants from traffic—45
6.8
Agriculture-related pollutant (NH3)—48
7
Results of the PCA analysis—51
8
Discussion—55
8.1
How consistent is this evaluation—55
8.2
Classifications—55
8.3
Representativeness—56
9
Conclusions and recommendations—57
References—65
Appendix 1 Criteria on micro and macro scale—67
Appendix 2 Calculation of average concentration rose—69
Appendix 3 NO2 wind rose at station Ossendrecht in Noord-Brabant and the
location of this station—70
Appendix 4 Locations of measurement stations in the industrial area IJmond
(Noord-Holland)—71
Appendix 6 Locations and wind roses of measurement stations in Rijnmond—74
Appendix 7 Diurnal variation of PM10 at station 230 (Biest) and some other stations
in Noord-Brabant—75
Summary
The RIVM (National Institute for Public Health and the Environment) has evaluated the representativeness of five monitoring networks: the Dutch national Air Quality Monitoring Network (LML) and four monitoring networks of local authorities. These are monitoring networks of the Municipal Health Service Amsterdam (GGD Amsterdam), the Environmental Protection Agency Rijnmond (DCMR), the province of Limburg and the province of Noord-Brabant.
The study was performed by means of principal components analysis (PCA) in combination with other techniques such as wind roses, diurnal analyses and Google Map application (photographs of the direct vicinity). Information about the micro/macro scale of local monitoring networks was supplied by local authorities. In an earlier study (Nguyen et al., 2009), the same techniques were used to study the representativeness of the LML, using measurement data of 2007. In this study measurement data of 2010 were used.
Two analyses were performed in this study. In an extensive analysis hourly data of nitrogen dioxide (NO2 ) and particulate matter (PM10) measured in five monitoring networks were used. The second analysis was performed with a smaller selection of monitoring stations; however, data of more components were used: nitrogen oxide (NO), nitrogen dioxide (NO2 ), carbon monoxide (CO), particulate matter (PM10), ozone (O3 ), ammoniac (NH3 ) and sulphur dioxide (SO2).
The evaluation reveals that, in general, all monitoring networks fulfil the criteria of the EU Directive 2008/50/EC very well. Beside the stations which are
currently used in the production of the GCN map, four stations, 488 (DCMR, Rotterdam-Zwartewaalstraat), 556 (PNH, de Rijp), 246
(Fijnaart-Zwingelspaansedijk) and 549 (Laren-Jagerspad), seem suitable too.
The evaluation also identifies a number of issues that require attention, leading to the following recommendations:
- The location of station 137 (Heerlen-Deken Nicolayestraat) may not be optimal for the measurement of Urban Background
concentrations because this station is located very close to a building, and a representative sampling of air from a large area cannot be guaranteed. Because the data analysis has not proven that the current location affects the representativeness of this station, it is not necessary to replace this station immediately. However, when this station is renewed, the new monitoring station should preferably be placed at a more suitable site in this area. - The location of station 17 (GGD Amsterdam, Stadhouderskade) is
not optimal (too close to a junction). If this station has to be
renewed the new monitoring station should preferably be placed at a more suitable location on this street.
- Measurements of DCMR, GGD and RIVM give comparable yearly average PM10 concentration at Berghaven and Overtoom, the difference between diurnal variation at station 496 (DCMR, Berghaven) and station 432 (Hoek van Holland-Berghaven), and between station 14 (GGD Amsterdam, Vondelpark) and 543 (Amsterdam-Overtoom) is very likely due to the measurement method. The difference is not relevant for limit values that are based on yearly or daily averages but might influence other analysis.
- Classification:
In addition to the AIRBASE classification in the Netherlands a simple classification is used. The PCA analysis shows that in general stations cluster nicely also in the simple classification; however, in some cases the more detailed AIRBASE classification is more representative. This aspect is relevant and should be taken into account when the data of measurements are interpreted.
A table is include with particular remarks on individual stations including:
o Station 938 (Groningen-Nijensteinheerd), which is located in the suburb of Groningen, is classified as an Urban Background station (suburb for ozone). The measurement results at this station resemble rural stations but are presumably
representative for the urban population in the northern part of the country. Stations 441(Dordrecht-Frisostraat) and 520 (Amsterdam-Florapark) are currently classified as suburb stations for O3 . In AIRBASE, these stations are classified as Urban Background, also for O3. The evaluation shows that this classification is more representative (station 441 has been replaced in November 2010). Based on the PCA analysis, station 404 (Den Haag-Rebecquestraat) and station 3 (GGD Amsterdam, Nieuwendammerdijk) seem to be appropriate stations to monitor suburban concentrations in these areas. o The classification Industry or Urban is more suitable for
station 486 (DCMR, Pernis-Soetermanweg) than the classification Street.
o For stations along a highway in remote areas (for example station 641) the classification Rural Traffic is more
representative than the classification Street. Generally, measurements at stations along a highway should not be compared to a regular Street station.
- Completion of documentation:
o RIVM: update of the Google maps application of LML stations is recommended. DCMR: addition to the current map with locations of measurement stations with photographs of the surrounding areas is recommended.
1
Introduction
In accordance with EU legislation, the air quality in the Netherlands is monitored by measurements. A major part of these measurements are part of the Dutch national Air Quality Monitoring Network (LML) of the National Institute for Public Health and the Environment (RIVM). In addition to the national Air Quality Monitoring Network, the Municipal Health Service Amsterdam (GGD Amsterdam) and the Environmental Protection Agency Rijnmond (DCMR) have their own monitoring networks to monitor the air quality in these densely populated areas. In other areas local authorities have smaller networks.
In the LML the stations are classified basically as rural, Urban Background and Street stations respectively. Apart from the above classification, local monitoring networks also have stations which are classified as industrial stations because they are located in industrial areas. Some monitoring stations are located in a complex area and don’t have a classification (‘not defined’-station).
Earlier study using data in 2007 (Nguyen et al.,2009) showed that the LML fulfilled criteria of the EU Directive 2008/50/EC. Some remarks were made to inform air quality modellers on special features for some stations.
These conclusions need to be updated. On top of that, within the frame of the cooperation between RIVM, GGD Amsterdam and DCMR, measurement data of these three institutes are frequently used mutually. For correct interpretations of air quality measurement data from different stations, the representativeness of the monitoring sites must be documented.
In this study measurement data in 2010 of RIVM, GGD Amsterdam, DCMR, the province of Limburg and the province of Noord-Brabant were combined and analysed, using the same technique. Measurement data of the province of Gelderland were not included because this network does not have hourly data in 2010.
The objective of this study is as follows:
to investigate if the current classification of the Dutch measurement stations corresponds to the character of these stations;
to identify relevant issues while using measurement data; to check if there are issues that required more attention;
to identify background stations that are suitable for the production of the GCN map.
2
Documentation of studied Air Quality Monitoring networks
The directive 2008/50/EC on ambient air quality and cleaner air for Europe (subsequently referred to as ‘the Directive’) includes criteria relevant to the documentation and review of site selection. The following statement is found in Annex IIID of the Directive:
‘The site-selection procedures shall be fully documented at the classification stage by such means as compass-point photographs of the surrounding area and a detailed map. Sites shall be reviewed at regular intervals with
repeated documentation to ensure that selection criteria remain valid over time.’
The documentation of the national Air Quality Monitoring Network has been described in Nguyen et al. (2010). This network utilizes a Google Maps application for an update of the documentation and a review of the site selection. This application shows compass point and panoramic views of the direct vicinity of each station and is being renewed. The current link (10/1/2013) to this application is:
http://www.onsite360.nl/projecten/rivm/startpagina/
The network of the GGD Amsterdam is described by de Jonge (2012). On the website of the GGD Amsterdam (http://www.luchtmetingen.amsterdam.nl) a map with locations of monitoring stations can be found. Each station is shown with photos of the location. The stations of the Province of Noord-Holland are also controlled by the GGD Amsterdam and similarly presented
(www.luchtmetingen.noord-holland.nl) and included in this report. The website of DCMR (http://www.dcmr.nl/luchtkwaliteit/index.htm) and the website of the province of Limburg (http://luchtkwaliteit.limburg.nl/) also show maps with locations of monitoring stations. Measurements at these stations are shown but there are no photos of the location.
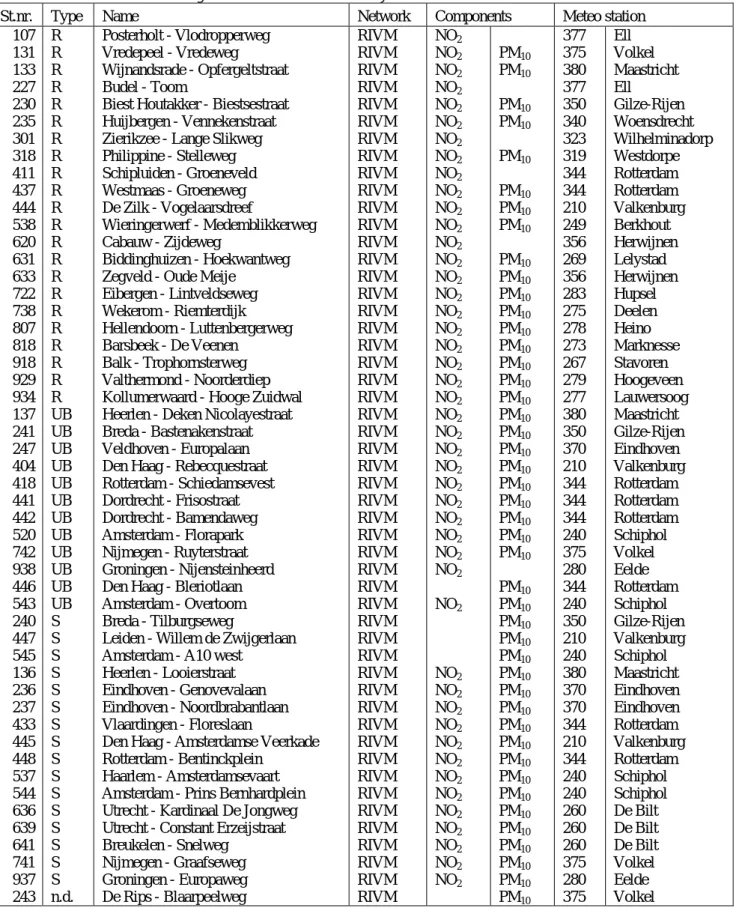
Table 1 shows a list of all stations used in this study. The first column shows the station number of monitoring stations. The structure of these numbers is as follows:
- LML: the starting number depends on the locations of the station: o Stations in the provinces of Friesland, Groningen and Drenthe
have number 9xx
o Stations in the province of Overijssel have number 8xx o Stations in the province of Gelderland have number 7xx o Stations in the province of Utrecht have number 6xx o Stations in the province of Noord-Holland have number 5xx o Stations in the province of Zuid-Holland have number 4xx o Stations in the province of Zeeland have number 3xx o Stations in the province of Noord-Brabant have number 2xx o Stations in the province of Limburg have number 1xx
- GGD: stations in Amsterdam have numbers up to 022. Stations outside Amsterdam have numbers 5xx (Noord-Holland) or 7xx.
- DCMR: all stations of DCMR have starting number 4
- One station of the province of Noord-Brabant is used in this study. This station does not have a number. For convenience in this analysis a number (999) is assigned to this station.
- Stations of the province of Limburg have the numbers 1, 2 and 3. To prevent mixing up with another station 002 (station Haarlemmerweg in
Amsterdam), in this study the numbers 1001,1002 and 1003 were assigned to these stations.
The last two columns of Table 1 show the corresponding meteorological stations from the KNMI. These meteorological stations are used in the calculation of concentration roses and details of the stations are described on
Table 1: Monitoring stations used in this study
St.nr. Type Name
Network Components
Meteo
station
107
131
133
227
230
235
301
318
411
437
444
538
620
631
633
722
738
807
818
918
929
934
137
241
247
404
418
441
442
520
742
938
446
543
240
447
545
136
236
237
433
445
448
537
544
636
639
641
741
937
243
R
R
R
R
R
R
R
R
R
R
R
R
R
R
R
R
R
R
R
R
R
R
UB
UB
UB
UB
UB
UB
UB
UB
UB
UB
UB
UB
S
S
S
S
S
S
S
S
S
S
S
S
S
S
S
S
n.d.
Posterholt - Vlodropperweg
Vredepeel - Vredeweg
Wijnandsrade - Opfergeltstraat
Budel - Toom
Biest Houtakker - Biestsestraat
Huijbergen - Vennekenstraat
Zierikzee - Lange Slikweg
Philippine - Stelleweg
Schipluiden - Groeneveld
Westmaas - Groeneweg
De Zilk - Vogelaarsdreef
Wieringerwerf - Medemblikkerweg
Cabauw - Zijdeweg
Biddinghuizen - Hoekwantweg
Zegveld - Oude Meije
Eibergen - Lintveldseweg
Wekerom - Riemterdijk
Hellendoorn - Luttenbergerweg
Barsbeek - De Veenen
Balk - Trophornsterweg
Valthermond - Noorderdiep
Kollumerwaard - Hooge Zuidwal
Heerlen - Deken Nicolayestraat
Breda - Bastenakenstraat
Veldhoven - Europalaan
Den Haag - Rebecquestraat
Rotterdam - Schiedamsevest
Dordrecht - Frisostraat
Dordrecht - Bamendaweg
Amsterdam - Florapark
Nijmegen - Ruyterstraat
Groningen - Nijensteinheerd
Den Haag - Bleriotlaan
Amsterdam - Overtoom
Breda - Tilburgseweg
Leiden - Willem de Zwijgerlaan
Amsterdam - A10 west
Heerlen - Looierstraat
Eindhoven - Genovevalaan
Eindhoven - Noordbrabantlaan
Vlaardingen - Floreslaan
Den Haag - Amsterdamse Veerkade
Rotterdam - Bentinckplein
Haarlem - Amsterdamsevaart
Amsterdam - Prins Bernhardplein
Utrecht - Kardinaal De Jongweg
Utrecht - Constant Erzeijstraat
Breukelen - Snelweg
Nijmegen - Graafseweg
Groningen - Europaweg
De Rips - Blaarpeelweg
RIVM
RIVM
RIVM
RIVM
RIVM
RIVM
RIVM
RIVM
RIVM
RIVM
RIVM
RIVM
RIVM
RIVM
RIVM
RIVM
RIVM
RIVM
RIVM
RIVM
RIVM
RIVM
RIVM
RIVM
RIVM
RIVM
RIVM
RIVM
RIVM
RIVM
RIVM
RIVM
RIVM
RIVM
RIVM
RIVM
RIVM
RIVM
RIVM
RIVM
RIVM
RIVM
RIVM
RIVM
RIVM
RIVM
RIVM
RIVM
RIVM
RIVM
RIVM
NO
2NO
2NO
2NO
2NO
2NO
2NO
2NO
2NO
2NO
2NO
2NO
2NO
2NO
2NO
2NO
2NO
2NO
2NO
2NO
2NO
2NO
2NO
2NO
2NO
2NO
2NO
2NO
2NO
2NO
2NO
2NO
2NO
2NO
2NO
2NO
2NO
2NO
2NO
2NO
2NO
2NO
2NO
2NO
2NO
2NO
2PM
10PM
10PM
10PM
10PM
10PM
10PM
10PM
10PM
10PM
10PM
10PM
10PM
10PM
10PM
10PM
10PM
10PM
10PM
10PM
10PM
10PM
10PM
10PM
10PM
10PM
10PM
10PM
10PM
10PM
10PM
10PM
10PM
10PM
10PM
10PM
10PM
10PM
10PM
10PM
10PM
10PM
10PM
10PM
10PM
10377
375
380
377
350
340
323
319
344
344
210
249
356
269
356
283
275
278
273
267
279
277
380
350
370
210
344
344
344
240
375
280
344
240
350
210
240
380
370
370
344
210
344
240
240
260
260
260
375
280
375
Ell
Volkel
Maastricht
Ell
Gilze-Rijen
Woensdrecht
Wilhelminadorp
Westdorpe
Rotterdam
Rotterdam
Valkenburg
Berkhout
Herwijnen
Lelystad
Herwijnen
Hupsel
Deelen
Heino
Marknesse
Stavoren
Hoogeveen
Lauwersoog
Maastricht
Gilze-Rijen
Eindhoven
Valkenburg
Rotterdam
Rotterdam
Rotterdam
Schiphol
Volkel
Eelde
Rotterdam
Schiphol
Gilze-Rijen
Valkenburg
Schiphol
Maastricht
Eindhoven
Eindhoven
Rotterdam
Valkenburg
Rotterdam
Schiphol
Schiphol
De Bilt
De Bilt
De Bilt
Volkel
Eelde
Volkel
St.nr. Type Name
Network
Components
Meteo
station
244
245
246
312
319
432
547
548
549
728
743
744
556
565
703
3
14
16
19
21
22
701
2
7
12
17
20
704
551
553
546
572
573
570
564
561
494
485
495
488
491
489
493
483
487
490
486
496
482
999
1004
1005
1001
1002
1003
n.d.
n.d.
n.d.
n.d.
n.d.
n.d.
n.d.
n.d.
n.d.
n.d.
n.d.
n.d.
R
R
R
UB
UB
UB
UB
UB
UB
UB
S
S
S
S
S
I
I
I
I
I
I
n.d.
n.d.
n.d.
UB
UB
UB
UB
S
S
S
S
S
S
S
I
I
R
S
S
I
I
I
De Rips-Klotterpeellaan
Moerdijk-Julianastraat
Fijnaart-Zwingelspaansedijk
Axel - Zaaidijk
Nieuwdorp-Coudorp
Hoek van Holland-Berghaven
Hilversum - J. Gerardtsweg
Bussum - Ceintuurbaan
Laren - Jagerspad
Apeldoorn - Stationstraat
Kootwijkerbroek - Drieenhuizerweg
Barneveld - Scherpenzeelseweg
PNH, De Rijp
PNH, Oude Meer
HAMS, Amsterdam-Spaarnwoude
GGD A'dam, Nieuwendammerdijk
Vondelpark
GGD Amsterdam,Westerpark
GGD Amsterdam, Oude Schans
GGD Amsterdam, Kantershof
GGD A’dam, Sportpark Ook Meer
ZNSTD, Zaandam
GGD Amsterdam,Haarlemmerweg
GGD Amsterdam,Einsteinweg
GGD Amsterdam,Van Diemenstraat
GGD Amsterdam,Stadhouderskade
GGD Amsterdam,Jan van Galenstraat
HAMS Hoogtij
PNH, IJmuiden
PNH, Wijk aan Zee
Zaanstad-Hemkade
PNH, Staalstraat
PNH, Reijndersweg
PNH, Beverwijk-West
PNH, Hoofddorp
PNH, Badhoevedorp
DCMR,Schiedam-Alphons Ariensstr
DCMR, Hoogvliet-Leemkuil
DCMR, Maassluis-Kwartellaan
DCMR, Zwartewaalstraat
DCMR, Overschie-Oostsidelinge
DCMR, Ridderkerk-Hogeweg
DCMR, Statenweg-Statenweg
DCMR, Botlek (A15)-Botlektunnel
DCMR, Pleinweg-Pleinweg
DCMR, Maasboulevard
DCMR, Pernis-Soetemanweg
DCMR, Berghaven
DCMR, Markweg
Ossendrecht
Maastricht A2
Roermond
Buggenum
Geleen Vouershof
Geleen Asterstraat
RIVM
RIVM
RIVM
RIVM
RIVM
RIVM
RIVM
RIVM
RIVM
RIVM
RIVM
RIVM
GGD
GGD
GGD
GGD
GGD
GGD
GGD
GGD
GGD
GGD
GGD
GGD
GGD
GGD
GGD
GGD
GGD
GGD
GGD
GGD
GGD
GGD
GGD
GGD
DCMR
DCMR
DCMR
DCMR
DCMR
DCMR
DCMR
DCMR
DCMR
DCMR
DCMR
DCMR
DCMR
N Brabant
Limburg
Limburg
Limburg
Limburg
Limburg
NO
2NO
2NO
2NO
2NO
2NO
2NO
2NO
2NO
2NO
2NO
2NO
2NO
2NO
2NO
2NO
2NO
2NO
2NO
2NO
2NO
2NO
2NO
2NO
2NO
2NO
2NO
2NO
2NO
2NO
2NO
2NO
2NO
2NO
2NO
2NO
2NO
2NO
2NO
2NO
2NO
2NO
2PM
10PM
10PM
10PM
10PM
10PM
10PM
10PM
10PM
10PM
10PM
10PM
10PM
10PM
10PM
10PM
10PM
10PM
10PM
10PM
10PM
10PM
10PM
10PM
10PM
10PM
10PM
10PM
10PM
10PM
10PM
10PM
10PM
10PM
10PM
10PM
10PM
10PM
10PM
10PM
10PM
10PM
10PM
10375
350
340
319
319
330
260
260
260
275
275
275
249
240
240
240
240
240
240
240
240
240
240
240
240
240
240
240
240
240
240
240
240
240
240
240
344
344
330
344
344
344
344
344
344
344
344
330
330
999
380
377
377
380
380
Volkel
Gilze-Rijen
Woensdrecht
Westdorpe
Westdorpe
H v Holland
De Bilt
De Bilt
De Bilt
Deelen
Deelen
Deelen
Berkhout
Schiphol
Schiphol
Schiphol
Schiphol
Schiphol
Schiphol
Schiphol
Schiphol
Schiphol
Schiphol
Schiphol
Schiphol
Schiphol
Schiphol
Schiphol
Schiphol
Schiphol
Schiphol
Schiphol
Schiphol
Schiphol
Schiphol
Schiphol
Rotterdam
Rotterdam
H v Holland
Rotterdam
Rotterdam
Rotterdam
Rotterdam
Rotterdam
Rotterdam
Rotterdam
Rotterdam
H v Holland
H v Holland
Ossendrecht
Maastricht
Ell
Ell
Maastricht
Maastricht
3
Study of the micro and macro status of the stations
The Directive provides a distinct description of the criteria to be satisfied in terms of the positions of sampling points used for the evaluation of ambient air quality. These criteria are stated in Annex III of the Directive.
The Directive distinguishes between micro and macro scale siting requirements for sampling points, with different criteria for each scale. These criteria are given in Appendix 1 of this report. In short, the criteria include:
- unrestricted airflow
- no sources in the immediate vicinity of the site - inlet height between 1.5 and 4 m
- for all pollutants, traffic-oriented sampling probes shall be at least 25 m from the edge of major junctions and no more than 10 m from the kerbside
The criteria to be applied depend both on the compounds of interest (for example, ozone and particulate matter) and the scope of the measurement strategy, such as:
- traffic related - urban located
- protection of vegetation
- point sources or diffuse sources
The micro and macro status of the LML stations have been studied earlier (Nguyen et al., 2009). Since this study the following changes have taken place at some LML monitoring stations or their surrounding:
- The highway A2 (monitoring station 641 in Breukelen) was broadened from two times three to two times five lanes. The broadening was performed in the direction away from the station. The work took place in 2009 till mid-2010.
- Monitoring station 445 (Den Haag-Amsterdamse Veerkade) has been replaced. The new station (started up in June 2009) is located at a small distance from the old location, between the road and the bike lane. Compared to the old location (in the middle of the road) the new location is more suitable for modelling with the CAR model.
- Mid November 2010 measurements at the monitoring station 441 (Dordrecht-Frisostraat, an Urban Background station) were stopped. The new monitoring station (station 442) which has data from 8 December 2010, is located a few kilometres away from the old station.
The micro and macro status of the monitoring stations of GGD Amsterdam and DCMR are investigated by these institutes. Relevant observations are given briefly in the overview Table 2 in chapter 7. A more detailed description of monitoring network of the GGD Amsterdam can be found in de Jonge (2012).
4
Study of the representativeness by means of principal
component analysis
4.1 Method
In this study the representativeness of the monitoring stations is studied by means of Principal component analysis (PCA). This method was also used in earlier study and is a well-known data visualization/data reduction tool that is often applied in analyses of large data sets. For example the data set of hourly data of 40 stations consists of a matrix of 40 stations × 8760 hourly values. The information can therefore be described in a mathematical space with at least 40 dimensions. Such a space in itself cannot be visualized; to this end, multivariate data visualization tools have been developed. The first principal component (PC-1) is defined as the linear combination of the original variables that describes the maximum amount of variation present in the data set. The second principal component (PC-2) is similarly defined as the linear combination of the original variables that describes the maximum amount of the remainder of the information found in the data set.
This process continues in this fashion for the higher order of components. The samples in this study, i.e. the measurement locations, can be projected on the principal components (PCs). These projections, usually called scores, can be shown as two-dimensional plots; for example, the plot of the scores of PC-2 vs. PC-1, which is the linear two-dimensional projection of the data set with a maximum amount of variation.
In addition, the relation between the original variables and the PCs, usually called loadings, facilitates the interpretation of the phenomena observed. The results of the first three principle components were studied. In general the third component was not very informative and only the first two are shown in this report.
The analysis tool used in this study is the PLS Toolbox of Eigenvector Research Incorporated for use with MATLAB® (Wise et al., 2006).
4.2 Data sets
4.2.1 Measurement data used in this study
Two analyses were performed in this study:
In an extensive analysis, data of all stations in five monitoring networks
(monitoring network of RIVM, GGD Amsterdam, DCMR, province of Limburg and province of Noord-Brabant), including stations without classification, were used. The analysis was performed with nitrogen dioxide (NO2) and particulate matter (PM10) hourly concentrations. The results of this analysis are shown in chapter 5. A second analysis was performed with hourly concentrations of nitrogen
monoxide (NO), nitrogen dioxide (NO2 ), carbon monoxide (CO), particulate matter (PM10), ozone (O3), ammonia (NH3) and sulphur dioxide (SO2) using a smaller data set. Only data of RIVM, GGD Amsterdam and DCMR were used and stations without classifications were not included. The results of this analysis are shown in chapter 6.
4.2.2 Types of data used in PCA analysis
In earlier study several data sets were used in the screening to find out the best strategy for the PCA analysis. Based on these results the PCA analysis in this
study was performed with diurnal variation data without autoscaling1 . For each hour of the day, an average concentration over the whole year was calculated. For each component the data set of N stations is an N-by-24 matrix. To ensure that all relevant information is shown, both score plots of the PC-2 and PC-3 are shown.
Because SO2 is a pollutant with a typical concentration pattern (comprising many peaks), this component has been studied using both diurnal variation and average concentration roses.
The average concentration roses were calculated as follows:
- First, for each monitoring station the closest weather station of the Royal Netherlands Meteorological Institute (KNMI) was selected.
- For each of 12 wind roses the average concentration over the whole year was calculated, taking into account the number of hours with wind from that wind rose. In Appendix 2 the calculation of average concentration roses is shown.
The data set of concentration roses is an N-by-12 matrix.
In addition to the analyses performed with individual components, we also analysed pollutants from traffic (concatenated matrix of NO and NO2 and concatenated matrix of NO, NO2 and CO concentrations). Because the concentration of CO is not at the same magnitude as that of the other
substances, CO concentration was divided by 10 before it was combined with the NO and NO2 concentrations.
1 When autoscaling is applied the data of each variable will be subtracted with the mean and divided by its standard deviation
5
Screening results of NO2 and PM10 measured in five
monitoring networks
In this chapter the results of the analyses performed with NO2 and PM10
concentrations measured in the monitoring networks of RIVM, GGD Amsterdam, DCMR, province of Limburg and province of Noord-Brabant are shown.
5.1 NO2
Figures 1 and 2 show the results of the analysis performed with diurnal variation of NO2 concentration. At some stations measurements were only performed in part of 2010:
- Due to reconstruction in Dordrecht station 441 (Dordrecht-Frisostraat) had to be removed. This station was operational until 15 November 2010. The new station (442, Dordrecht-Bamendaweg), which is located a few kilometres meters away from the old location, has obtained data since 8 December 2010. Due to limited data of station 442 the result is not representative for this station.
- Station 490 (DCMR, Maasboulevard) has data from 22 July 2010 and station 565 (province of Noord-Holland (PNH), Oude Meer) has data from 13 September 2010.
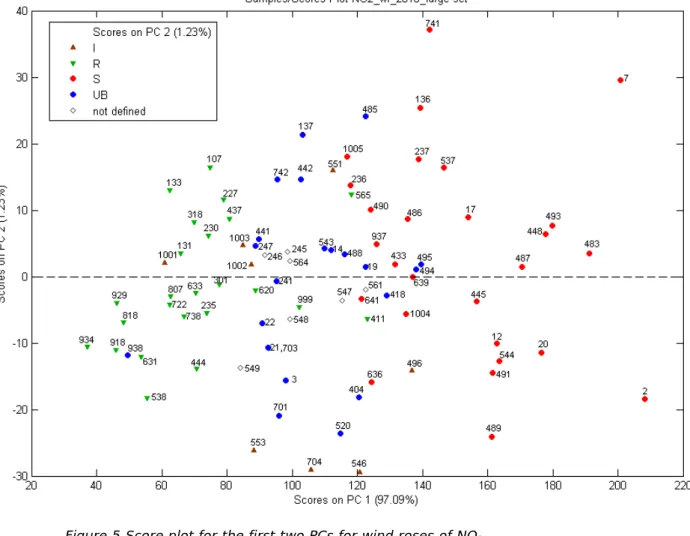
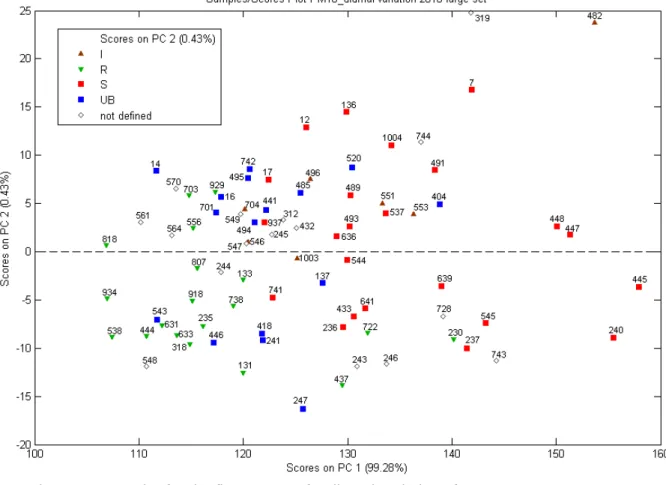
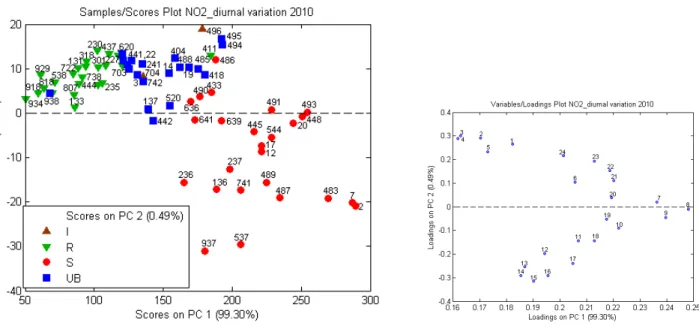
In Figure 1 the plots for the first two PCs for diurnal variation of NO2 are shown. Stations with a high annual concentration have a higher PC-1 score while the PC-2 represents the pattern of diurnal variation.
Figure 1 Score plot for the first two PCs for diurnal variation of NO2
The plot shows distinct clusters of stations. The arrows show the shift from a background station to a traffic station.
The shift from a background station to a Street station in the same area depends on the contribution from traffic The shift shown in Figure 1 is as follows:
Measured NO2 shift Calculated NO2 shift
in 2010, μg/m3 in 2010, μg/m3 (data NSL2011)
937 versus 938 36-14=22 32.9-14.7=18.2
136 versus 137 38-28=10 38.9-25.5=13.4
741 versus 742 42-28=14 68.8-27.6=41.2 (see note 1)
2 versus 14 59-31=28 43.0-31.6=11.4
547 versus 549 32-23=9 n.d. (see note 2)
Notes:
1. The calculated NO2 concentration at station 741 is much higher than the measured concentration. The reported traffic number at this location (NSL-monitoring data for 2010) seems not accurate (more than 12% of heavy traffic).
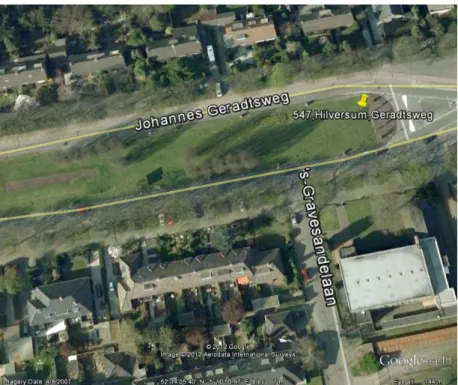
2. There is no calculation performed for station 547 because the location of this monitoring station (between two driving lanes, see Figure 2) is not suitable to be calculated by the ‘standaard rekenmethode’ (SRM).
Figure 2 Monitoring station 547 (Hilversum, Geradtsweg)
Figure 3 Loadings plots for diurnal variations of NO2
Results:
- There is a good correspondence between measurements of GGD Amsterdam and RIVM at Overtoom/Vondelpark (station 14 versus station 543).
- There is a good correspondence between measurements of DCMR and RIVM at Bentinckplein/Statenweg (station 448 versus station 493). - Two LML stations are outside the cluster of their classification type: o Urban background station 938 (Groningen–Nijensteinheerd)
resembles a rural station. This is very likely due to its location in a suburban of a city, Groningen, in a clean environment.
o Rural station 411 (Schipluiden-Groeneveld) resembles an urban environment. This is very much due to the density of green houses and other influences of the Rijnmond area.
These differences were also found in earlier analysis using data in 2007 (Nguyen et al., 2009).
- Station 999 (Ossendrecht-Noord-Brabant) is classified as rural but the NO2 concentration at this station is higher than at other rural stations (Figure 1). The wind rose at this station (Figure 3.1 in Appendix 3) shows high NO2 concentration when the wind is south-easterly (160-200 degrees) suggesting contribution from Antwerp (Figure 3.2 in
Appendix 3).
- Station 565 (PNH, Oude Meer) is a rural station but this station has higher concentrations than other rural stations (Figure 1), probably due to contribution from the highways A4 and A5 which are about 2 km away from this station. However, the result might be not representative because this station only has data from September and generally, NO2 concentration in the winter is higher than in the summer.
- In this study the station 486 (DCMR,Pernis-Soetermanweg) is classified as a Street station. However, there is nearly no local traffic near this location. The traffic emission at this location comes from the highway A4 which is about 600 m west of this station. In Airbase this station is classified as ‘Urban Industry’. According to the amount of traffic and the results, also in the Dutch classification system, the classification
‘Industry’ or ‘Urban’ might be more suitable for this station.
- Earlier study using data in 2007 showed clearly difference between the diurnal pattern of station 641 (Breukelen-Highway) and other Street stations. Data of 2010 do not show difference of station 641. Figure 4 shows that the diurnal variation at this station changed after the highway was broadened. Before the broadening traffic was limited by the capacity of this highway, even outside the rush hours. Consequently typical concentration peaks in the morning and in the afternoon at a Street station was less evident at station 641. After broadening of this highway the diurnal variation at this station shows the normal profile of a Street station. Measured concentrations at this station are decreased because the highway was broadened in the direction away from the station.
- The score plot in Figure 1 shows that stations 7 (GGD Amsterdam, Einsteinweg), 2 (GGD Amsterdam, Haarlemmerweg) and 483 (DCMR, Botlek(A15)-Botlektunnel) have higher concentrations than other Street stations. Combining with the loadings plot suggests that these three stations have comparable diurnal variation (comparable PC-2 score). This is confirmed by Figure 4.
- A few Street stations are located near a highway. These stations are: 641 (Breukelen-Highway), 7 (GGD Amsterdam, Einsteinweg (A10)), 483 (DCMR, Botlek(A15)-Botlektunnel), 491 (DCMR, Overschie-Oost
Sidelinge, A13), 489 (DCMR, Ridderkerk-Hogeweg (A15)), 1004 (Prov Limburg, Maastricht A2). This analysis does not show a separate cluster of Highway stations.
Figure 4: Diurnal variation at some typical stations
First two plots from above: Diurnal variation of NO2 in 2007 and 2010 respectively at 448
(Rotterdam-Bentinckplein), 639 (Utrecht-Erzeijstraat) and 641 (Breukelen-Highway)
In 2007 there weres almost no concentration peaks at station 641 because this highway(A2) was always congested.
Bottom: Comparable diurnal variation at stations 2 (GGD Amsterdam, Haarlemmerweg), 7 (GGD Amsterdam, Einsteinweg) and 483 (DCMR, Botlek(A15)-Botlektunnel)
The loadings plot in Figure 3 shows that the NO2 concentration in the morning is higher than the concentration during the night (morning hours have higher loadings on PC-1).
With respect to Industry-stations the following observations were found: - Stations 1001 (Buggenum), 1002 (Geleen-Vouershof) and 1003
(Geleen-Asterstraat) are Industry-stations located in rural areas. Figure 1 does not show distinction between these stations and other rural stations indicating negligible influence of industry on the NO2 concentration measured at these stations.
- Station 553 (PNH, Wijk aan Zee) is an Industry-station which is set up to measure the concentration in the industrial area of IJmond. Figure 1 does not show distinct diurnal differences between this station and rural stations. However the PCA analysis performed with wind roses (Figures 5 and 6) show indeed the contribution from south-south easterly direction on this station as can be expected from the location of this station (see also Appendix 4 for the location of Industry stations in the IJmond). - Station 551 (PNH, IJmuiden) is located in an urban area. The PCA
analysis (Figures 1 and 4) does not show distinction between this station and Urban Background stations. The effect of industry on the NO2
concentration measured at this station seems not significant.
- Stations 546 (PNH, Hemkade) and (704 (PNH, Hoogtij) are located in an unpopulated area. Due to contribution from the ships on the North Sea
Diurnal variation of NO
2in 2010
20
30
40
50
60
70
80
0
2
4
6
8
10
12
14
16
18
20
22
24
hr
μ
g/
m
3 7 2 483canal these stations have higher NO2 concentration than rural stations (Figure 1). The PCA performed with wind roses (Figures 5 and 6) show the contribution from the south direction as expected from the location of these stations (northerly of the canal).
- Station 496 (DCMR, Berghaven) is an Industry station located near the harbour in Rotterdam. The PCA analysis does not show distinction between this station and other background stations in Rotterdam. This is due to the fact that background stations in Rotterdam are also
influenced by port industrial area and the harbour as can be shown by the wind roses in Appendix 6.
The results of ‘not defined’ stations are:
- Station 549 (Laren-Jagerspad) resembles a rural station (Figure 1). This result is in agreement with the location of this station (Figure 5.1 in Appendix 5).
- Stations 547 (Hilversum-Gerardtsweg) and 548 (Bussum-Ceintuurbaan) both have contributions from traffic. According to the municipal data more than 10.000 vehicles drive over these streets per day. Figure 1 shows a small shift from the background station 549 to these two stations (shift toward the right bottom corner of the plot); the contribution of traffic at these stations is not very large. The PCA performed with wind roses does not show contribution from a specific direction. Station 547 (Hilversum-Geradtsweg) is located in an urban area; due to the contribution from traffic this station can be classified as ‘street’. Station 548 (Bussum-Ceintuurbaan) is located in a more remote area (Figure 5.2, Appendix 5); despite the contribution from traffic, this station differs from normal Street stations. The classification ‘Rural Traffic’ in Air Base might be more suitable for this station.
- Stations 245 (Moerdijk-Julianastraat) and 246
(Fijnaart-Zwingelspaansedijk) are located in remote areas, but these stations have higher concentrations than other rural stations, probably due to the contribution from various highways at distances of 1-3 km and to the industrial area of Moerdijk (Figure 5.3 in Appendix 5).
- Stations 564 (PNH, Hoofddorp) and 561 (PNH, Badhoevedorp) are located in unpopulated areas but have higher NO2 concentrations than rural stations (Figure 1). Station 564 has contributions from airplanes from the airport Schiphol and the highway A5 (at 1 km distance); station 561 has contributions from the highways A4 (at 1 km distance) and A9 (0.5 km).
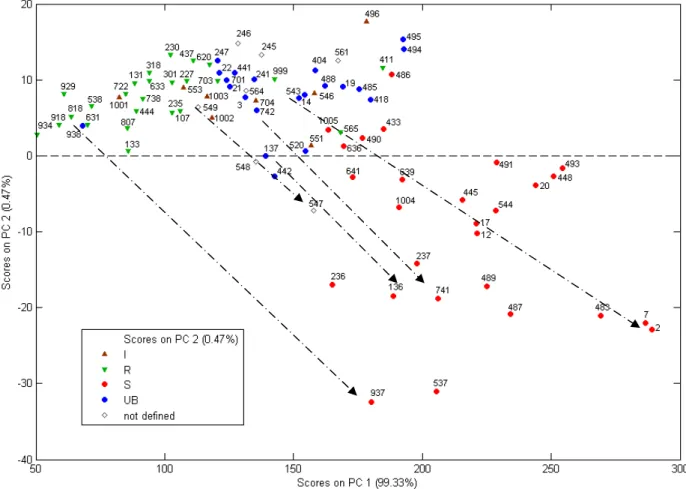
Figure 5 Score plot for the first two PCs for wind roses of NO2.
5.2 PM10
In Figures 8 and 9 the results of the PCA analysis performed with PM10 data are shown. At a few stations the PM10 measurements in 2010 were performed in fewer than six months: 442 (Dordrecht-Bamendaweg ), 487 (DCMR, Pleinweg-Pleinweg), 488 (DCMR, Rotterdam-Zwartewaalstraat), 490 (DCMR,
Maasboulevard-Maasboulevard), 565 (PNH, Oude Meer), 572 (PNH, Staalstraat) and 573 (PNH, Reijndersweg); these stations were left out in this analysis. The analysis using PM10 data does not show distinct clusters of street and Urban Background stations (Figure 7). This is in line with the fact that traffic has only a very limited effect on PM10 concentration. Stations with a high annual
concentration have a higher PC-1 score. Results:
- There is a good correspondence between the yearly average concentration of PM10 measured at Berghaven by the RIVM and the yearly average concentration measured by DCMR (station 432 versus station 496): both stations have comparable PC-1 scores in Figure 7. However this figure shows a discrepancy between the diurnal variations (different PC-2 scores) as can be confirmed by Figure 11a. The
difference is highest in the morning. The same phenomenon (same yearly average, different diurnal variations) was observed at
Overtoom/Vondelpark (station 14 versus station 543). These differences might be caused by differences in the measurement methods. The LML– method is susceptible to relative humidity.
- The score plots show that PM10 concentration measured at station 230 (Biest Houtakker-Biestsestraat) is comparable to PM10 concentration measured at other stations in this area (236 and 237). In earlier analysis when data of 2007 were used, a distinction was found for station 230 (Nguyen et al., 2009). However in 2010 the difference between 230 (Biest Houtakker-Biestsestraat) and other stations in this area became much smaller (Appendix 7).
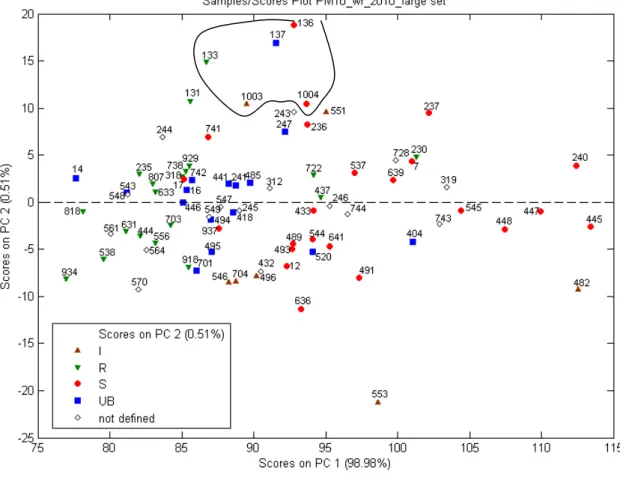
- The score plot of diurnal variation (Figures 7) shows high PC-2 scores of stations 319 (Nieudorp-Coudorp) en 482 (Markweg,Botlek). Combining with the loadings plot (Figure 8) suggests that the PM10 concentration at these stations is high at midday; this is indeed confirmed by the diurnal variation at these stations (Figure 9b). The PCA analysis of wind roses (Figures 10 and 11) does not show an extreme effect of the wind rose at these stations.
- The analysis of wind roses (Figure 10 and 11) shows that PM10 the concentration at station 553 (PNH, Wijk aan Zee) and at station 551 (PNH, IJmuiden) is attributed to the activity in IJmond (the PM10
concentration at station 553 is high when the wind is from the South and the concentration at station 551 is high when the wind is from the North).
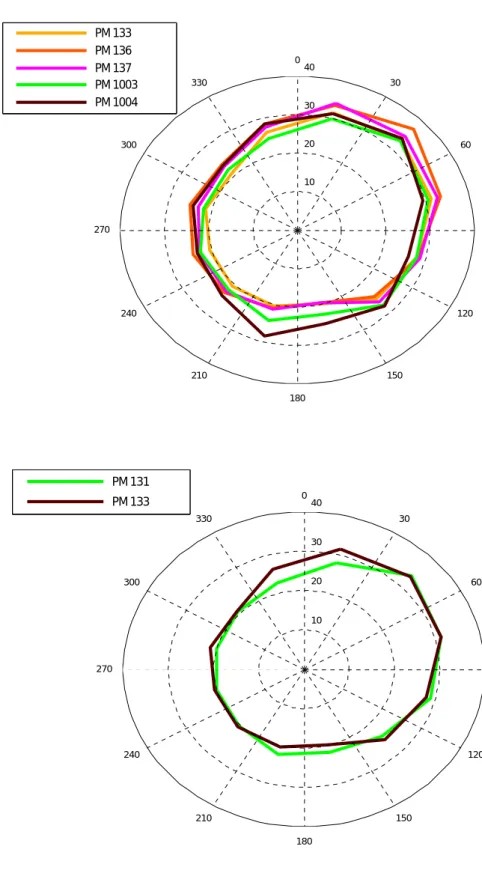
- Figure 10 shows a cluster of five LML stations in Heerlen/Maastricht with high PC-2 scores. Combining with the loadings plot (Figure 11) suggests that the PM10 concentrations at these stations are high when the wind is north- easterly. This is indeed shown by the wind roses in Figure 12. Because these stations are located south-westerly of the Ruhr area, the contribution might come from the Ruhr area. Stations in the North Limburg and eastern part of Noord-Brabant are also project positive on
PC-2 although less pronounced. This might be due to another orientation to major sources for example in the Ruhr area. Note that such PCA observations are primarily suited to formulate hypotheses on sources. To prove the influence of sources one needs more deterministic models like OPS or LOTUS EUROS which is beyond the scope of this study.
Figure 7 Score plot for the first two PCs for diurnal variation of PM10
Note that 14 and 543 are different measurements at the same location (Overtoom/Vondelpark); 432 and 496 are different measurements at Berghaven. 448 and 493 are also measurements at the same location
(Bentinckplein in Rotterdam), but the data are not comparable because of low data coverage in 2010 (75-80%) by both measurements.
Figure 8 Loadings plots for diurnal variation of PM10
Diurnal variation of PM10 at Berghaven in 2010
20 22 24 26 28 30 0 2 4 6 8 10 12 14 16 18 20 22 24 26 hr μ g/ m 3 432 496
Diurnal variation of PM10at Overtoom/Vondelpark in 2010 16 18 20 22 24 26 28 0 2 4 6 8 10 12 14 16 18 20 22 24 26 hr μg/ m 3 543 14
Diurnal variation of PM10 at stations 319 and 482
20 22 24 26 28 30 32 34 36 38 40 0 2 4 6 8 10 12 14 16 18 20 22 24 26 hr μ g/ m 3 319 482
Figure 9 : Diurnal variation at some typical stations
Figure 9a (Top and middle) Differences in diurnal variation of PM10
measured at Berghaven and Overtoom
Figure 9b (Bottom) diurnal variation at 319 and 482 shows high PM10
Figure 10 Score plot for the first two PCs for wind roses of PM10
10 20 30 40 0 30 60 90 120 150 180 210 240 270 300 330 PM 133 PM 136 PM 137 PM 1003 PM 1004 10 20 30 40 0 30 60 90 120 150 180 210 240 270 300 330 PM 131 PM 133
Figure 12 (Top) Wind roses of PM10 at five LML stations in and near Heerlen
(Bottom) Wind rose at Vredepeel versus wind rose at station 133 (Wijnadsrade,Opfergelstraat), a rural station near Heerlen
6
Screenings results obtained with measurements in
monitoring networks of RIVM, GGD Amsterdam and DCMR
These PCA analyses were performed with a smaller data set. Only stations of RIVM, GGD Amsterdam and DCMR were used and stations without classification (‘not defined’-stations) were not included.
Apart from NO2 and PM10 we also performed analyses with NO, CO, NH3, SO2 and with two combinations of traffic related components (NO&NO2 and NO&NO2&CO).
6.1 NO2
Figure 13 shows the results of the analysis performed with diurnal variations of NO2. These plots show distinct clusters stations and have the same pattern as the plots obtained with the large data set.
Figure 13 (Left) Score plot for the first two PCs for diurnal variation of
NO2(Right) Loadings plot
6.2 NO
Also for NO there are clear distinct clusters of stations (Figure 14). The
distinction between street and background stations is more pronounced for NO than for NO2.
Figure 14 (Top) Score plot for the first two PCs for diurnal variation of NO (Bottom) Loadings plot
The score plot shows distinct clusters of stations. Note that station 442 (Dordrecht-Bamendaweg) has only data from December.
- Like in the analysis with NO2, distinctions of stations 938 (Groningen– Nijensteinheerd) and 411 (Schipluiden-Groeneveld) are also shown by the analysis of NO.
- The score plot (Figure 14) shows good correspondence between station 493 (DCMR, Statenweg) and station 448 (Rotterdam-Bentinckplein), but the correspondence in the NO2 measurement (Figure 13) is slightly better as can be shown in Figure 15a). - The score plot (Figure 14) shows that, compared to other Street
stations, NO concentration at stations 2 (GGD Amsterdam,
Haarlemmerweg), 7 (GGD Amsterdam, Einsteinweg (A10)) and 483 (DCMR, Botlek(A15), Botlektunnel) is substantially higher.
- Combining the score plot and the loadings plot in Figure 14 suggests that NO concentration at station 483 (DCMR, Botlek(A15), Botlektunnel) and station 7 (GGD Amsterdam, Einsteinweg (A10)) is relatively high in the morning (these stations have positive PC-2 score) while the
concentration at station-2 (GGD Amsterdam, Haarlemmerweg) is relatively high in the evening and during the night (negative PC-2 score). Figure 15 indeed shows this pattern.
Diurnal variation of NO in 2010 0 20 40 60 80 100 120 0 2 4 6 8 10 12 14 16 18 20 22 24 hr μ g/ m 3 7 483 2 Diurnal variation of NO in 2010 0 10 20 30 40 50 60 70 0 2 4 6 8 10 12 14 16 18 20 22 24 hr μ g/m 3 448_NO 493_NO 493_NO2 448_NO2 Figure 15
Figure 15a (Left) NO and NO2 measurements at 448 (Rotterdam-Bentinckplein)
and 493 (DCMR, Statenweg)
Figure 15b (Right) Diurnal variation of NO at station 7 (GGD Amsterdam, Einsteinweg (A10)), 483 (DCMR, Botlek(A15), Botlektunnel) and at station 2 (GGD Amsterdam, Haarlemmerweg)
6.3 PM10
Figure 16 shows results of the analysis performed with diurnal variations of PM10. Like in the analysis with a large data set there are no distinct clusters of street and Urban Background stations. The analysis with a small data set gives the same results as the analysis performed with the large data set
Figure 16 (Left) Score plot for the first two PCs for diurnal variation of PM10
(Right) Loadings plot
The score plot does not show distinct clusters of stations. Note that station 442 (Dordrecht-Bamendaweg) only has data from December 2010. Stations 487 (DCMR,Pleinweg-Pleinweg) and 488 (DCMR,Rotterdam-Zwartewaalstraat) have data from 1 September 2010; station 490
(DCMR,Maasboulevard-Maasboulevard) has data from 28 September 2010.
6.4 CO
The analysis with CO shows clear distinct clusters of rural, Urban Background and Street stations (Figure 17), however with some distinctions. Most
remarkable observations are:
- This analysis also shows distinction of the Urban Background station 938 (Groningen-Nijensteinheerd), as already observed with NO and NO2. - The distinction of station 411 (Schipluiden-Groeneveld) is not observed
with CO.
- Figure 17 shows distinction of station 641 (Breukelen-Highway (A2)) and 491 (DCMR, Overschie-Oost Sidelinge (A13)). Both these stations are located in remote area nearby a highway. Station 490 (DCMR,
Maasboulevard-Maasboulevard) differs too but the results might be not representative because this station has only data from 20 July 2010. - Combining the score plot and the loadings plot in Figure 17 suggests
that average CO concentrations at stations 7 (GGD Amsterdam,
Einsteinweg (A10)) and 236 (Eindhoven-Genovevalaan) are comparable but these stations have different diurnal variations. CO concentration at station 7 is high during the night while CO concentration at station 236 is high in the afternoon. Figure 18 confirms this pattern.
Figure 17 (Left) Score plot for the first two PCs for diurnal variation of CO (Right) Loadings plot
The score plot shows distinct clusters of stations. Note that station 442 (Dordrecht-Bamendaweg) has only data from December 2010 and station 490 (DCMR,Maasboulevard-Maasboulevard) has only data from 20 July 2010.
Diurnal variation of CO in 2010 200 250 300 350 400 450 500 550 600 650 700 0 2 4 6 8 10 12 14 16 18 20 22 24 hr μg/ m 3 236 7
Figure 18 Diurnal variation of CO at some typical stations
6.5 O3
The analysis of O3 shows distinct clusters of rural and Street stations while Urban Background stations are mixed (Figure 19).
For O3 measurements, stations 133 (Wijnandsrade-Opfergeltstraat), 411 (Schipluiden-Groeneveld), 441 (Dordrecht-Frisostraat), 520 (Amsterdam-Florapark) and 938 (Groningen–Nijensteinheerd) are classified as Suburban station. Suburban stations are located in the suburbs of major cities. These stations are important because many inhabitants can be exposed to O3 concentrations that are higher than those found in city centres. Unfortunately
three of these stations (411, 441 and 520) had quite low data coverage in 2010, ranging from 58 to 81%.
Figure 19 (Top) Score plot for the first two PCs for diurnal variation of O3
(Bottom) Loadings plot
Note that station 247(Veldhoven-Europalaan) has data from 11 June 2010, station 631 (Biddinghuizen-Hoekwantweg) has data up to 2 October 2010
Results:
- There are clear clusters of rural and Street stations. Urban background stations are mixed.
- Urban Background station 938 (Groningen–Nijensteinheerd) resembles a rural station.
- Stations 441 (Dordrecht-Frisostraat) and 520 (Amsterdam-Florapark) are classified as Suburban station for O3. The PCA analysis (Figure 19) shows that these stations do not resemble suburban stations. Despite of low data coverage in 2010, the conclusions are the same as in earlier
analyses (Nguyen et al.,2009). Based on the PCA analysis, station 404 (Den Haag-Rebecquestraat) and station 3 (GGD Amsterdam,
Nieuwendammerdijk) seem to be appropriate stations to monitor suburban concentrations in these areas.
- The loadings plot in Figure 19 shows that stations with a negative PC-2 score have an O3 peak in the afternoon (12:00-18:00). Stations with the most negative PC-2 score are all located in the south-eastern part of the Netherlands. Compared to stations 131 and 133 (south-eastern
Netherlands), station 934 (located in the northern part of the
Netherlands) has a higher annual concentration of O3, but stations 131 and 230 have more peak concentrations (Figure 20)
- An earlier analysis performed with data in 2007(Nguyen et al.,2009) shows differences between station 137 (Heerlen-Deken Nicolayestraat) and other Urban Background stations (the concentration at 137 was substantially higher). This station is located close to a building. It was not clear whether the difference at station 137 was caused by its
locations. Data in 2010 do not show any difference between stations 137 and other Urban Background stations (Figure 19). Figure 21 shows that the concentration at this station has decreased substantially between 2006 and 2009 while such a decrease did not occur at other stations in that area. The reason is not clear.
Diurnal variation of O
3in 2010
0 10 20 30 40 50 60 70 0 2 4 6 8 10 12 14 16 18 20 22 24 hr μ g/ m 3 131 934 938 230Figure 20 Diurnal variation of O3 at 934 (Kollumerwaard,Rural), 938 (Groningen,
Urban Background)in the north of the Nethelands and at 131 (Vredepeel,Rural) and 230 (Biest Houtakker,Rural) in the south-eastern part of the Netherlands
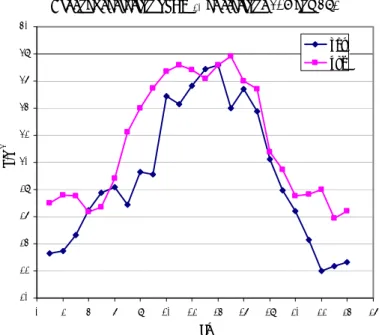
Annual concentration of O3 is lower in the south- eastern part of the Netherlands
Figure 21 Annual concentration of O3 at some typical stations in the
south-eastern part of the Netherlands
6.6 SO2
6.6.1 Diurnal variation
The PCA analysis of SO2 does not show a distinct cluster of Street stations (Figure 22), which is in line with the fact that SO2 is not a traffic-related pollutant. Stations with higher annual concentrations have a higher PC-1 score. These stations are all located in Rijnmond. Combining of the loadings plot and the score plot in Figure 22 suggests that stations with negative PC-2 have high concentrations of SO2 during the day (10:00-19:00), while stations with a positive PC-2 score have high concentrations of SO2 in the early morning and at night. This pattern of diurnal variation is indeed confirmed by Figure 23.
Figure 22( Top) Score plot for the first two PCs for diurnal variation of SO2
Diurnal variation of SO2 in 2010 0 2 4 6 8 10 12 14 0 2 4 6 8 10 12 14 16 18 20 22 24 hr μ g/ m 3 485 496 484
Figure 23 Diurnal variation of SO2 at 485 (DCMR,Hoogvliet-Leemkuil), 496
(DCMR,Berghaven-Berghaven) and 484 (DCMR,Botlek-Oude Maasweg)
SO2 concentration at 485 is relatively high between 10:00 and 19:00.
6.6.2 Wind roses analyses
Figure 24 shows the PCA analysis of SO2 wind roses. Combining of the loadings plot and the score plot in Figure 33 suggests that a station with positive PC-2 score, for example station 485 (DCMR,Hoogvliet-Leemkuil), has high SO2 concentrations when the wind is northerly. Stations with negative PC-2 score, for example station 416 (Vlaardingen-Lyceumlaan) or station 496
(DCMR,Berghaven-Berghaven), have high SO2 concentrations when the wind is southerly. Figure 25 indeed confirms these patterns which are in agreement with the location of these stations relatively to the harbour (Appendix 6).
Figure 24 (Left) Score plot for the first two PCs for SO2 windroses
5 10 15 0 30 60 90 120 150 180 210 240 270 300 330 SO2w r,Vlaardingen-Lyceumlaan SO2w r,Hoogvliet-Leemkuil SO2w r,Berghaven-Berghaven
Figure 25 SO2 wind rose of 416 (Vlaardingen-Lyceumlaan),485 (DCMR,
Hoogvliet-Leemkuil) and 496 (DCMR,Berghaven-Berghaven)
SO2 concentration at Hoogvliet is high when the wind is north westerly. At
Vlaardingen-Lyceumlaan and Berghaven the SO2 concentration is high when the
wind is southerly.
6.7 Pollutants from traffic
6.7.1 Combination of NO2 and NO
The combination of NO2 and NO shows distinct clusters of stations with differences of stations 411 and 938 as already being observed in individual analyses of NO2 and NO (Figure 26). The loadings plot shows NO2 concentrations are higher than NO concentration (NO2 has higher loadings on the PC-1 score). The score plot (Figure 26) shows clear difference between stations 2 (GGD Amsterdam, Haarlemmerweg), 7 (GGD Amsterdam, Einsteinweg) and 483 (DCMR, Botlek(A15), Botlektunnel) and other Street stations. These stations have much higher PC-2 scores. Because NO has a positive loading on the PC-2 score (Figure 26) we can conclude that the distinctions of stations 2, 7, and 483 are due to differences of the NO concentrations.
Figure 26 (Left) Score plot for the first two PCs for the combined diurnal
variation of NO2 and NO
(Right) Loadings plot
Note that station 442 (Dordrecht-Bamendaweg) only has data from December 2010; station 490 (DCMR, Maasboulevard-Maasboulevard) has data from 20 July 2010.
6.7.2 Combination of NO, NO2 and CO
This analysis shows clear clusters of stations. Apart from the distinction of stations 411 and 938, this analysis shows obvious difference of station 7 (GGD Amsterdam, Einsteinweg). This station has much higher PC-2 score than other Street stations. Because the plot is very dominated by station 7, analysis was also performed without this station (Figure 28). From the loading plots in Figure 28 we can conclude that the NOx emission at station 7 is relatively high
and the CO emission is relatively low. This is indeed shown by Figure 29. Figure 28 shows Street stations in Brabant have negative PC-2 score, indicating relatively more CO in this area. As an example, in Figure 29 the diurnal
variations of CO and NO concentration measured at a Street station in Noord-Brabant, in Amsterdam and in Rijnmond are shown.
Figure 27 (Left) Score plot for the first two PCs for the combined diurnal
variation of NO2 , NO and CO
(Right) Loadings plot
Figure 28 (Left) Score plot for the first two PCs for the combined diurnal
Diurnal variation in 2010 of NO and CO/10 at 7, 236 and 491
0 20 40 60 80 100 120 0 2 4 6 8 10 12 14 16 18 20 22 24 hr μ g/ m 3 236_CO/10 236_NO 491_CO/10 491_NO 7_CO/10 7_NOFigure 29 Diurnal variation of NO and CO/10 at stations 7 (GGD Amsterdam, Einsteinweg), 491(DCMR, Overschie-Oost Sidelinge) and 236 (Eindhoven-Genovevalaan)
At station 236 the CO concentration is relatively higher than at a station in Amsterdam and in Rijnmond.
6.8 Agriculture-related pollutant (NH3)
Stations with NH3 measurements are all Rural stations. Stations with high annual concentrations of NH3 have high PC-1 score (Figure 30). Combining the score plot and the loadings plot in Figure 30 suggests that the NH3 concentration at 131 (Vredepeel-Vredeweg) and 738 (Wekerom-Riemterdijk) is relatively high during the night (these stations have negative PC-2 score) while the
concentration at other stations is relatively high during the day (positive PC-2 score). This pattern is indeed confirmed by Figure 31. The concentration profile of stations 131 and 738 are typical for locations with hot spots. The more stable atmosphere during the night results in a reduced dispersion of pollutants and, consequently, a higher NH3 concentration.
Figure 30 (Left) Score plot for the first two PCs for diurnal variation of
NH3(Right) Loadings plot