Environmental risk assessment for veterinary medicinal products
Part 1. Non-immunological drug substances Second update
M.H.M.M. Montforts
This report replaces RIVM report 601300001/1999 (first update).
This project was carried out on the account of the Agency for the Registration of Veterinary Medicinal Products in the framework of the project Evaluation of Veterinary Medicinal Products, project number 320202.
National Institute of Public Health and the Environment, Expert Centre for Substances.
Preface
This report was originally published in 1997 with report number 613310001. In 1999 the first update was released under report number 601300001. In the last four years, science and regulations have developed. The scientific base for the risk assessment in general, and veterinary medicinal products in particular, has been strengthened in the EU Energy,
Environment and Sustainable Development programme of the Fifth Framework Programme, within the project Environmental Risk Assessment of Veterinary Medicines in Slurry, ERAVMIS, contract number EVK1-CT-1999-00003. A further harmonisation of risk assessment has been attempted by the European Commission through the development of a new Technical Guidance Document for new and existing substances and biocides, and the activities of the DG SANCO Task Force or Harmonisation of Risk Assessment.
Following changes in the Netherlands legislation on the spreading of manure and recent developments in European regulations, especially the guidance document development by the CVMP, this second update is released under report number 320202001. The guidance
provided by CVMP/VICH on Phase I has been incorporated.
In case C-322/00 ECJ (October 2nd, 2003) the Netherlands have been convicted for the implementation of the Nitrate Directive 91/671/EEC. The conviction is based on –amongst others– the use of nitrate loss standards instead of nitrate immission standards, the neglect of some sources of nitrogen in the measures taken, and the derogation for nitrogen loads on grassland (250 kg N/ha/y). As a result, the nutrient accounting system (MINAS) and
fertilising standards will be revised before January 1st, 2006. In response to these revisions, as well as the future adoption of the upcoming VICH/CVMP guidance on Phase II, a third update of this report is to be expected in 2005.
This is a guidance document in support of the environmental risk assessment for the Netherlands registration procedure of veterinary medicinal products.
The author welcomes all comments: mark.montforts@rivm.nl
The environmental risk assessment for veterinary medicinal products RIVM report
Part 1 Non-immunological drug substances. Second update 320202001
Part 2 The phase 1 assessment for immunological products. Report on the workshop 23-9-1998 601300002
Part 3 Validation of environmental exposure models 601450016
Part 4 Exposure assessment scenarios 601450017
Part 5 ERAVMIS: A guide to risk assessment of veterinary medicinal products used in animal husbandry
Abstract
The environmental risk associated with the use of veterinary medicinal products is assessed at registration in the Netherlands. This report guides the applicants and the national registration authority through the evaluation scheme. It contains transparent exposure models that predict exposure concentrations, as well as uniform guidance to assess the potential effects of the product to exposed organisms in dung, soil and water.
Contents
Summary 9
1. Introduction 11
1.1. Scope and objectives of the report 11
1.2. Framework of the environmental assessment of veterinary medicinal products 11
1.3. The subject of the environmental risk assessment 13
2. Model description 15
2.1. Structure of the environmental assessment 15
2.2. Release estimation 15 2.3. Environmental distribution 17 2.4. Exposure module 18 2.5. Effect assessment 18 2.6. Risk characterisation 19 3. Release estimation 21 3.1. Animal husbandry 22 3.2 Cattle 23 3.3 Pigs 25
3.4 Horses and ponies 26
3.5 Chickens 27
3.6 Sheep 28
3.7 Fish 29
3.8 Agricultural manuring practice in the Netherlands 31
4. Emission and distribution models 33
4.1. Concentrations in dung 33
4.2. Concentrations in soil 34
4.3. The concentration in groundwater 41
4.4. The concentration in surface water 41
4.5. The concentration in air 45
4.6. The concentration in sediment 46
5. Exposure module 47
5.1. The concentration in sheep dips and footbaths 47
5.2. Exposure of birds and mammals by contaminated feed 48
6. Effect assessment 53
6.1. Deriving PNEC 53
6.2. Insecticidal properties 58
6.3. Bodyweight of birds and mammals 59
6.4. Daily food intake for birds and mammals 60
6.5. Daily water intake of birds and mammals 60
6.6. Derivation of the NOEC from NOAEL 61
7. Risk assessment 63
7.1. RCR for birds and mammals exposed through grass and insects 63
7.2. RCR for birds and mammals exposed through uptake of water or dipping fluid 64
7.3. RCR for terrestrial organisms 65
7.4. RCR for birds and mammals exposed through earthworms 65
7.5. RCR for aquatic organisms 66
7.6. RCR for sediment-dwelling organisms 66
7.7. RCR for birds and mammals exposed through fish 67
7.8. RCR for groundwater organisms 67
7.9. RCR for micro-organisms in STP 68
7.10. RCR for beneficial arthropods 68
8. Evaluation 69
8.1. Phase I 69
8.2. Phase II-a 69
8.3. Phase II-b 74
References 79
Appendix I Dung production 83
I.1 Dung production in relation to animals and habitat 83
I.2 Partitioning of dung 84
Summary
The European Commission has issued in Directive 2001/82/EC, that with a request for registration of a veterinary medicinal product, information is to be provided to enable an assessment of the safety for the environment. The environmental risk associated with the use of veterinary medicinal products is assessed at registration in the Netherlands. This report guides the applicants and the national registration authority through the evaluation scheme. According to the Netherlands law a veterinary medicinal product is a substance, whether or not after preparation or processing, with the intention:
a. to cure, relieve or prevent any affection, illness, morbid symptom, pain, injury, or defect of an animal;
b. to remedy, improve, or change the functioning of organs of an animal; c. to diagnose a disease or defect in animals at application in an animal.
This definition includes pure substances (organic and inorganic) and preparations (including homeopathic products, vaccines, and flee-belts), and excludes disinfectants (e.g. for udders and for cleaning stables).
It contains transparent exposure models that predict exposure concentrations, as well as uniform guidance to assess the potential effects of the product to exposed organisms in dung, soil and water. If reliable actual exposure data are available, these may replace the predicted values.
Directive 2001/82/EC describes the assessment process in two phases. The first phase (Phase I) shall assess the potential of exposure of the environment to the product. The first phase is thus limited to product identification and exposure assessment. Several exemptions for further testing are given, such as trigger values for predicted environmental concentrations (PECs). When these exemptions do not apply and trigger values are exceeded, one enters Phase II.
In the second phase (Phase II) the reviewer shall consider whether further specific
investigation of the effects of the product on particular ecosystems is necessary. Phase II is also divided in two parts, Tier A and Tier B. Tier A begins with an elaborate evaluation of the possible fate and effects. If the applicant is unable to demonstrate that exposure is minimised to a level of no concern to the environment, then the effects in the relevant compartments must be adequately investigated in Tier B. The Tier B evaluation is subject to expert judgement and is beyond the scope of this document.
1. Introduction
1.1. Scope and objectives of the report
The fate and behaviour of pharmaceuticals in the environment has been studied since several decades [1-3], and the presence and effects of residues in the environment is a concern that has been identified not long after that [4-8]. More recently several reviews on use, emission, fate, occurrence and effects of pharmaceuticals have been published and at national and international regulatory levels the environmental risks of pharmaceuticals are on the agenda [9-15].
The EC has issued in Directive 2001/82/EC that with a request for registration of a veterinary medicinal product information is to be provided to enable an assessment of the safety for the environment. The methodology has not been finalised yet [16-18] and suggestions for risk assessment methodology are given in literature [9,19-23]. The proposed risk assessment procedure at registration of human medicines and veterinary medicines is discussed by several authors [24-27]. Considerations on the assessment of pharmaceutical feed additives are given by Jorgensen et al. and the Scientific Committee on Animal Nutrition in [28] and [29].
In this document a risk assessment methodology is presented. The different livestock
categories have different characteristics in housing and manure production, but the emission and distribution routes are identical. To ensure an equal assessment of all products a uniform risk assessment methodology is required.
The goals of this document are threefold:
- to provide a tool for a uniform risk assessment of veterinary medicinal products; - to provide a basis for the incorporation of the risk assessment into the Netherlands
Uniform System for the Evaluation of Substances (USES);
- to inform interested parties and outsiders on the assumptions, default parameters, and model dimensions that are used to assess the risk for the Dutch environment.
1.2. Framework of the environmental assessment of
veterinary medicinal products
According to the EU Directive 2001/82/EC on veterinary medicinal products an assessment of ecotoxicity shall be compulsory for any application for marketing authorisation for a veterinary medicinal product other than applications submitted in accordance with Articles 12(3)(j) and 13(1). This assessment shall normally be conducted in two phases.
In the first phase, the investigator shall assess the potential extent of exposure to the environment of the product, its active substances or relevant metabolites, taking into account: - the target species, and the proposed pattern of use (for example, mass-medication or
individual animal medication),
- the method of administration, in particular the likely extent to which the product will enter directly into environmental systems,
- the possible excretion of the product, its active substances or relevant metabolites into the environment by treated animals; persistence in such excreta,
- the disposal of unused or waste product.
In a second phase, having regard to the extent of exposure of the product to the environment, and the available information about the physical/chemical, pharmacological and/or toxicological properties of the compound which has been obtained during the conduct of the other tests and trials required by this Directive, the investigator shall then consider whether further specific investigation of the effects of the product on particular ecosystems is necessary. As appropriate, further investigation may be required of:
- fate and behaviour in soil,
- fate and behaviour in water and air, - effects on aquatic organisms,
- effects on other non-target organisms.
These further investigations shall be carried out in accordance with the test protocols laid down in Annex V of Council Directive 67/548/EEC of 27 June 1967 on the approximation of laws, regulations and administrative provisions relating to the classification, packaging and labelling of dangerous substances, or where an end point is not adequately covered by these protocols, in accordance with other internationally recognised protocols on the veterinary medicinal product and/or the active substance(s) and/or the excreted metabolites as appropriate. The number and types of tests and the criteria for their evaluation shall depend upon the state of scientific knowledge at the time the application is submitted.
The European Agency for the Evaluation of Medicinal Products (EMEA)1 has published
guidance on the environmental risk assessment (ERA) of VMPs, and this assessment was implemented in 1997 [16]. The assessment scheme takes the use of the product and the properties of the products into account in the assessment (phase I or II), the emission routes (slurry-soil; water; pasture) and the data requirements. After the final draft of the EMEA (1997) guidance, an international harmonisation between the EU, USA and Japan was started by the International Co-operation on Harmonisation of Technical Requirements for Registration of Veterinary Medicinal Products (VICH)2 to which both the European
Commission and the EMEA are committed [30]. The guidance document on Phase I was completed and finalised (15 June 2000) for implementation by July 2001 in the European Union and United States [18] and replaces the EMEA 1997 guidance on Phase I. This guidance document is at this moment leading for the registration procedure.
Within the VICH guidance document a limited assessment is foreseen for substances with a generally accepted low hazard (vitamins, electrolytes), and with a presumed negligible emission and exposure level. The exposure level that is considered irrelevant for the total environment is quantified both for water (effluent) and soil for some groups of compounds and several routes of emission: 1 µg/L and 100 µg/kg, respectively (Phase I). These triggers are derived from a dataset of toxicity values of several antibiotics, although the determination of a safe level is criticised from an ecotoxicological point of view [24]. Not only these exposure trigger values define the desired level of quality for soil and effluent. Should these triggers be exceeded, a risk assessment based on the PEC/PNEC approach is warranted for soil, surface water, sediment and groundwater (Phase II), according to the EMEA guidance [31].
The EU Directive is included in the Dutch law on veterinary medicines (Diergeneesmiddelen-wet 27 June 1985, Stb. 410, last amendment 10 July 1995). By the direction of the
Directorate of Public Health (GZB) of the Ministry of Public Health, Welfare, and Sports (VWS), the Expert Centre for Substances (SEC) of the National Institute for Public Health and the Environment (RIVM) performs the environmental assessments under the charge of the Agency for the Registration of Veterinary Medicinal Products (BRD). The registration procedure of veterinary medicinal products in the Netherlands is as a whole divided in two rounds. After the first round the applicant has a limited period to respond to questions or calls for more information from the BRD. After the second round the application and evaluation reports are submitted to the Board for the Registration of Veterinary Medicinal Products (CRD). The CRD advises the responsible minister on the admittance of a veterinary product, based on assessment reports on the various fields of interest (e.g. ecotoxicology, residues, consumer exposure, and animal health). The minister decides then on registration.
1.3. The subject of the environmental risk assessment
According to the Dutch law a veterinary medicinal product is a substance, whether or not after preparation or processing, with the intention:
a. to cure, relieve or prevent any affection, illness, morbid symptom, pain, injury, or defect of an animal;
b. to remedy, improve, or change the functioning of organs of an animal; c. to diagnose a disease or defect in animals at application in an animal.
This definition includes pure substances (organic and inorganic) and preparations (including homeopathic products, vaccines, and flee-belts), and excludes disinfectants not used on animals (e.g. for cleaning stables).
It is not clear whether or not the Dutch law includes all ingredients in a preparation to be taken into account in the environmental risk assessment. The words ‘substance’ and ‘product’
are used more or less arbitrarily, or at least interchangeable. However, the EMEA documents state explicitly: ‘... shall assess the potential of exposure of the environment to the product, its ingredients or relevant metabolites. Metabolites which represent less than 20% of the applied dose are not considered relevant...’[31]. ‘This assessment must address the risks arising from each of the components of the product, not just the risk from live organisms in vaccines’ [32]. All ingredients in a product are therefore taken into account,
Metabolites are not assessed in Phase I [33]. In Phase II metabolites formed in amounts ≥20% of the administered dose are separately assessed [31].
Insecticides intended for use on animals are dealt with as veterinary medicinal products, e.g. pour-on anthelmintics and anti-parasitic agents. Because of the division between the Pesticide act and the Veterinary Medicine act, the following uses of disinfectants and insecticides are
not dealt with as veterinary medicinal products, but as biocides: disinfection (including
fumigation), fish nurseries, footwear, milk extraction systems, means of transport, hatcheries [34,35]. Nevertheless, the models presented here may be applied equally for biocides.
2. Model description
2.1. Structure of the environmental assessment
The risk assessment is an evaluation of the possible fate and effects of the product. As a whole, the risk assessment is structured around the hazard quotient approach [37]. Predicted environmental concentrations are compared with effect values established in toxicity studies. If reliable exposure data are available, these may replace the predicted values. This
comparison is done using the hazard quotient approach. Hazard quotients indicate the likelihood of occurring of adverse effects.
The first phase (Phase I) shall assess the potential of exposure of the environment to the product and its ingredients. The first phase is thus limited to product identification and exposure assessment of the total residue [33]. Several exemptions for further testing are given, such as trigger values for predicted environmental concentrations (PECs). When these exemptions do not apply and trigger values are exceeded, one enters Phase II.
In the second phase (Phase II) the reviewer shall consider whether further specific
investigation of the effects of the product on particular ecosystems is necessary. Phase II is also divided in two parts, Tier A and Tier B. Tier A begins with an elaborate evaluation of the possible fate and effects. If the applicant is unable to demonstrate that exposure is minimised to a level of no concern to the environment, then the effects in the relevant compartments must be adequately investigated in Tier B. The Tier B evaluation is subject to expert judgement and is beyond the scope of this document.
As told, in Phase I several exemptions from further testing are incorporated, but if adverse environmental effects are still anticipated from the use of such products, the further assessment of possible exposure to the environment can be performed.
2.2. Release estimation
Emission can take place at any step in the life cycle of the product. Dosage, route of application, type of target animals, excretion, route of entry into the environment, and agricultural practice determine the point of emission:
- at production;
- at application (external application);
- at removal of waste material containing the product (manure, dirty water, fish water); - by excretion via faeces and urine (grazing animals);
- or at disposal of the containers (empty bottles and flee-belts).
The environmental assessment for veterinary non-immunological medicinal products is only concerned with emission at or after use of the product.
The Phase I assessment is based on a release of the ‘total residue’ into the environment (manure, dung, soil, water). See the VICH guidance on Phase I for detail [33].
Product type, target animal, route of administration, dosage, and excretion are critical for the selection of the emission scenario. The main categories are:
- removal of waste material containing the product (manure, dirty water, fish water); - excretion via faeces and urine (grazing animals);
- spillage at external application or direct exposure outdoors. The major routes for internal application of the product are: - oral;
- intra-ruminal;
- by injection (intra-muscular, sub-cutane).
External applications are dermal: pour-on, sheep dips, fumigation, etcetera. Use of products with external application may result in the product being found in washings from dairy parlours and pig and poultry stables due to cleaning of the pens3. If there is no direct route to
the manure (spilling, washing), but there is appreciable adsorption through the skin leading to systemic effects, the pathways for internal application should be followed. This applies especially for insecticides and anthelmintics.
Functions and uses not specified here are dealt with on a case by case basis. Based on the husbandry conditions described in Chapter 3.1, the following possible emission routes are identified (Table 1).
Table 1 Possible emission routes of veterinary medicines.
Livestock category slurry application grazing animals spillage at application and exposure outdoors emission of waste water or direct entry into water cattle X X X pigs X X
horses and ponies X X X
sheep X X X X
chickens X X
2.3. Environmental distribution
The emitted product will be distributed in the environment. The route of distribution and the fate in the environment are important for the final predicted environmental concentration (PEC) and the severity of the effect.
For veterinary medicinal products, the routes of exposure for the terrestrial and aquatic environment are through the application of contaminated manure, dung and urine. Distribution occurs within exposed compartments and through different compartments. The terrestrial environment is reached via:
1. Direct excretion of dung and urine; 2. Direct spillage on the field;
3. Spreading of slurry and sludge. The aquatic environment is reached via: 1. Leaching and drainage from manured land; 2. Direct defecating into water;
3. Direct application in water (fish);
4. Direct discharge of waste water into surface water (fish); 5. Release from Sewage Treatment Plant (fish).
Products used for external application (e.g. sheep dips): 1. Are directly accessible to birds;
2. Reach the soil (and surface-dwelling invertebrates) after disposal, and 3. Also insects in treated fleece are exposed directly.
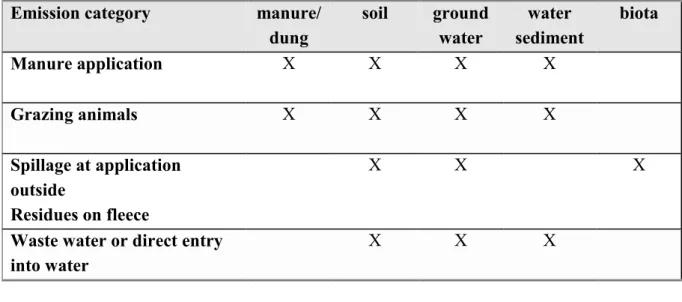
Table 2 Primary and secondary exposed compartments after emission and distribution.
Emission category manure/
dung soil ground water water sediment biota Manure application X X X X Grazing animals X X X X Spillage at application outside Residues on fleece X X X
Waste water or direct entry into water
X X X
3 These washings, called ‘dirty water’ generally contain <3% dry matter, and are made up of water contamintaed by manure, urine, crop
2.4. Exposure module
In the exposure module the calculated concentrations in the relevant environmental compartments are gathered. These depend on the type of application and the type of target animals selected. See Table 2 for the exposed compartments.
Exposure of birds and mammals through application of veterinary medicinal product residues is possible. Because these non-target species are exposed to the products via their feed and water, calculations are performed to translate concentrations in compartments to
concentrations in the feed. Five exemplary food chains will be regarded:
- Birds and/or mammals with a diet consisting entirely of worms caught in polluted land or dung;
- Birds and/or mammals with a diet consisting entirely of fish caught in polluted water; - Birds and/or mammals exposed through surface water;
- Birds and/or mammals exposed through feed (insects in grass and fleece); - Birds exposed through feeding on exposed product (sheep dips and footbaths).
2.5. Effect assessment
In Phase I no effect studies are required. In Phase II the actual hazard quotient approach is carried out and here effect studies are compulsory. All delivered information shall be summarised and evaluated in order to establish the reliability and usefulness for the
assessment. As pointed out in the EMEA (1997) document [31], studies should be performed according to international accepted guidelines for testing, and Good Laboratory Practices should apply whenever possible.
In the effect assessment a no-effect concentration is derived from experimental toxicity data (PNEC: predicted no-effect concentration) by dividing the experimental concentration (or dose) that causes 50% mortality or effect (LD50, LC50, or EC50) and/or the no-observed-effect-concentration (NOEC) by an extrapolation factor. This results in PNEC values for a compartment (e.g. soil or water) or ecosystem.
For (dung)-insects, the experimental toxicity result (% effect) is used, as is done in the risk assessment for the registration of pesticides. For birds exposed through sheep dips, the risk is assessed using acute LD50 data, as chronic exposure is not likely.
2.6. Risk characterisation
For veterinary medicines several risk and hazard quotients (RCR: risk characterisation ratio) are constructed to account for different types of dispersion. Most frequently the short-term time-scale is observed, and for secondary poisoning the long-term scale is taken into account. The species for which a risk evaluation is carried out are birds, mammals, (ground)water organisms, earthworms, beneficial arthropods, plants and micro-organisms.
For each compartment/ecosystem or species evaluated a separate RCR is calculated, based on the PEC/PNEC concept.
RCR PEC PNEC comp comp comp = input
PECcomp predicted environmental concentration in compartment [mgc.kg-1] or [mgc.l-1] O
PNECcomp predicted no effect concentration for compartment [mgc.kg-1] or [mgc.l-1] O
output
RCRcomp risk characterisation ratio for compartment [-] O
For some species non-extrapolated effect data are used. This yields e.g. ‘PEC/%effect’-ratios. These ratios are denoted as RCR as well.
3. Release estimation
In the next chapter the emission and distribution models are presented. In this chapter the routes of emission are introduced, as well as many parameter values. This means that a lot of modelling language will be used. Firstly we introduce conventions on the use of parameters and units. Parameters and variables are divided into four types :
S data Set a value for this parameter must be present in the data entry set. D Default a fixed value. The user can change most default values.
O Output the value is the result of a previous calculation.
P Pick-list Parameter value can be chosen from a pick-list with values.
c closed Default or output parameter is closed and cannot be changed by the
user.
For the parameter symbols, as far as possible, the following conventions are applied: - Parameters are mainly denoted in capitals;
- Specification of the parameter is in lower case;
- Specification of the compartment for which the parameter is specified is shown as a subscript.
Example: the weight fraction of organic carbon in dung: Focdung.
Most values are expressed in units of the SI system (Système International d’Unités). As a consequence, some parameters have an uncommon unit. Kilograms of chemical are indicated by [kgc]. Other masses will usually be indicated as wet weight or dry weight ([kgwwt] and
[kgdwt] respectively), or by compartment (bodyweight or feed: [kgbw] and [kgfd], respectively)
It should be noted that for the dimension ‘time’ the non-SI units ‘day’ [d] and ‘year’ [yr] are used, instead of second [s], since these are more relevant units in the framework of this assessment.
In contrast with industrial chemicals, the emission module for veterinary medicines does not usually result in emissions to waste water and air from point sources. Instead, emissions take place to a specific area directly (direct immission into surface water, spillage to soil) or indirectly (spreading with manure or dung).
The emission module that characterises the releases to the environment via manure requires parameters from the distribution module (degradation rates and application intervals), and is therefore incorporated in the distribution chapter (Chapter 5).
3.1. Animal husbandry
The emission routes vary with the target animal to be treated. The animals in the Netherlands can be divided into two major groups: pets and livestock, poultry and fish. Pets are kept on a small-scale basis, with a limited number of animals at one place. Because with pets no mass medication can be expected, products intended for this group are exempted from further assessment. Horses are part of the animal husbandry group (stock-breeding and -raising industry), but are considered to be individually treated.
The category livestock discerned, with their excreta production and the related phosphate production in the Netherlands, are based on the index in [38].
The faeces of grazing animals in the field are referred to as dung. As the dung is not collected and stored over time, for the hazard assessment the peak concentrations and the drug
excretion pattern in time are important. In the field faeces and urine are dispersed separately, whereas in the stable they are mixed. The excreta obtained indoors, referred to as manure, are collected and stored for some time. Slurry is the mixture of faeces, urine, and materials from the housing of animals (e.g. spilled feed, straw, litter, sand, water, down).
The modelling starts with a pick-list of animal categories. Each animal category has its own list of animal-specific parameter values, which will be presented in the chapters below.
Table 3 Pick-list of main animal categories and emission routes.
Livestock main category Animal category and defaults Emission route E
see pick list in chapter spreading of slurry Eslurry grazing animals Edung spillage at application pasture Edirectpasture emission of waste water Elocalwater cattle 3.2 X X pigs 3.3 X
horses and ponies 3.4 X X
chickens 3.5 X
sheep 3.6 X X
fish 3.7 X X
input
- livestock main category [-] P
output
E emission routes [-] O
Goats, fur-bearing animals, and rabbits are not assessed because of the modest scale of these branches. Also the numbers of turkey, duck, ostriche, emoe, nandoe, guinea-fowl, quail, and geese are relatively small compared to chickens, and they are not dealt with separately in this document.
The possible inputs and outputs for the environmental assessment of veterinary medicinal products are limited. The general parameters are given in Table 4.
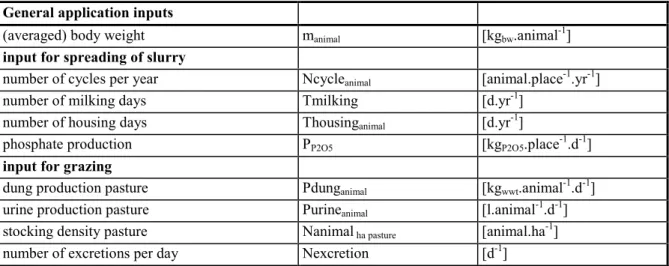
Table 4 General parameters for animal categories.
General application inputs
(averaged) body weight manimal [kgbw.animal-1]
input for spreading of slurry
number of cycles per year Ncycleanimal [animal.place-1.yr-1]
number of milking days Tmilking [d.yr-1]
number of housing days Thousinganimal [d.yr-1]
phosphate production PP2O5 [kgP2O5.place-1.d-1]
input for grazing
dung production pasture Pdunganimal [kgwwt.animal-1.d-1]
urine production pasture Purineanimal [l.animal-1.d-1]
stocking density pasture Nanimal ha pasture [animal.ha-1]
number of excretions per day Nexcretion [d-1]
Some animals are kept at their mature bodyweight, other are reared from a starting weight onwards. For animals in the latter situation the mean bodyweight is the most convenient value. For animals in the former group, the maximum body weight is used. The number of cycles per year is based on the production periods including the days the pens stand empty. For background information on dung production and partitioning see Appendix I. Notice the use of the word dung for the faeces in the field and the words manure and slurry for the mixture of excreta collected in the stable. The specific values for the different animal categories are given below.
3.2 Cattle
Dairy cows are housed in winter time (175 days) and graze during the rest of the year. During grazing they return to the stable for milking. In spring and autumn they also may return to the stable for the night. Dairy cows are kept on the farm together with yearlings (1-2 years old) and calves (0-1 year old) for replacement in the ratio 100:33:37.
A suckler cow is kept together with her calf (up to 6 months old) in the same way as dairy cows. Young bulls and heifers are kept for meat production. These animals also are grazed in summer time. These cattle are not used for milk production.
Veal calves are kept indoors: white veal calves live during 0-6 months and are fed milk powder; rose veal calves live during 0-7 months and are fed roughage and concentrate.
Breeding bulls are not assessed separately. There are a few artificial insemination farms, and as it concerns healthy full-grown animals, the combination of small-scale husbandry and low medicine use implies a relative low risk on environmental contamination.
The following categories of cattle are used in the risk evaluation: - dairy and suckler cows;
- beef cattle; - veal calves.
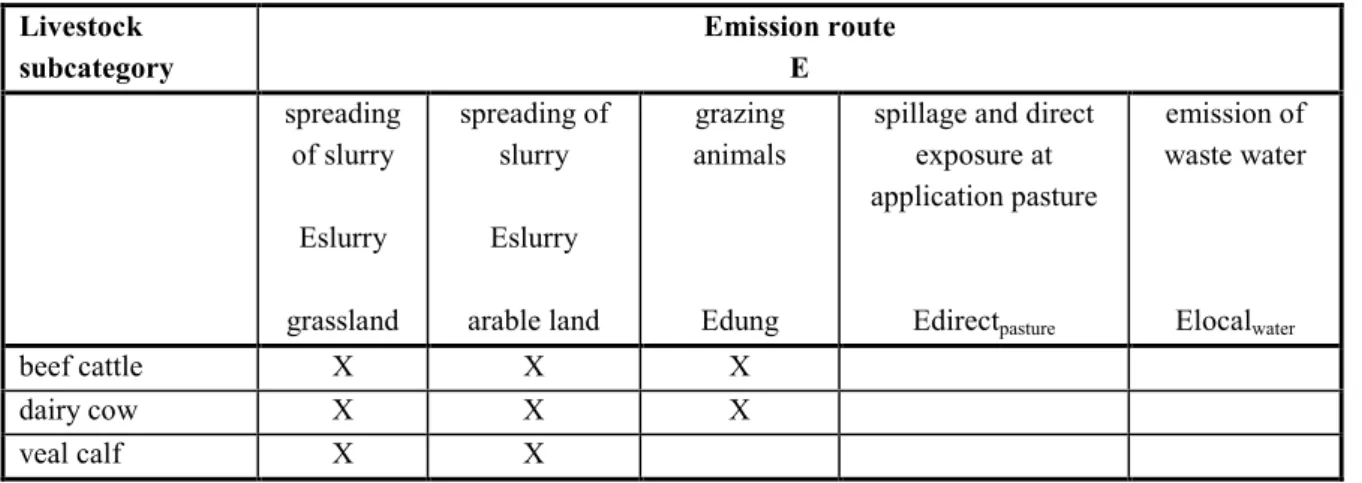
Table 5 Pick-list of animal subcategories and emission routes for cattle.
Livestock subcategory Emission route E spreading of slurry Eslurry grassland spreading of slurry Eslurry arable land grazing animals Edung
spillage and direct exposure at application pasture Edirectpasture emission of waste water Elocalwater beef cattle X X X dairy cow X X X veal calf X X
Table 6 Default settings for cattle.
parameter symbol unit value
(averaged) body weight mdairy cow [kgbw.animal-1] 600
mveal calf [kgbw.animal-1] 140
mbeef cattle [kgbw.animal-1] 330
number of cycles per year Ncycledairy cow [animal.place-1.yr-1] 1
Ncycleveal calf [animal.place-1.yr-1] 1.8 Ncyclebeef cattle [animal.place-1.yr-1] 1
number of housing days cattle excluding veal Thousingnon-veal [d.yr-1] 175
number of housing days veal Thousingveal calf [d.yr-1] 365
phosphate production during housing PP2O5 dairy cow [kgP2O5.place-1.d-1] 0.11
PP2O5 veal calf [kgP2O5.place-1.d-1] 0.011 PP2O5 beef cattle [kgP2O5.place-1.d-1] 0.028
dung production pasture during grazing period Pdungdairy cow [kgwwt.animal-1.d-1] 52
Pdungbeef cattle [kgwwt.animal-1.d-1] 11
stocking density pasture Ndairyha pasture [animal.ha-1] 3.5
Nbeefha pasture [animal.ha-1] 9.5
3.3 Pigs
Three types of pig-farming are present in the Netherlands: exclusively sows or exclusively fattening-pigs, or a combination of both. On a sow-farm one finds sows with and without piglets. An average 78% of the sows has suckling piglets and 22% has none. According to [39] the average number of young (with 9 kgbw per piglet ) is 20 per place per year. If
suckling piglets are treated instead of the sow, a treated body weight of 180 kg can be used instead. Manure excretion figures remain unaltered.
Breeding-boars live approx. 18 months on the farm, but as they perform 130 services a year, they are a minority on the farm. There are a few artificial insemination farms, and as it concerns healthy full-grown animals, the combination of small-scale husbandry and low medicine use implies a relative low risk on environmental contamination.
Pigs may be kept outside, but in the Netherlands the British outdoor-system is not used. Currently there are few farms that breed pigs on pasture land, but on most farms for ‘free-ranging pigs’ the pigs have the possibility to go outside on a concrete paved floor. Inside straw is present, and both areas are cleaned regularly. This category is not assessed separately in this report.
The Netherlands authorities encourage the development of mixed farms to reduce transport of animals. As a sow drops approx. 20 young and there are 2.8 cycles of fattening pigs a year, one needs one sow on every seven fattening pigs. For the moment we take only the
segregated farming into consideration. The following categories of pigs are used in the risk evaluation:
- fattening pigs;
- breeding sows including piglets up to 25 kg.
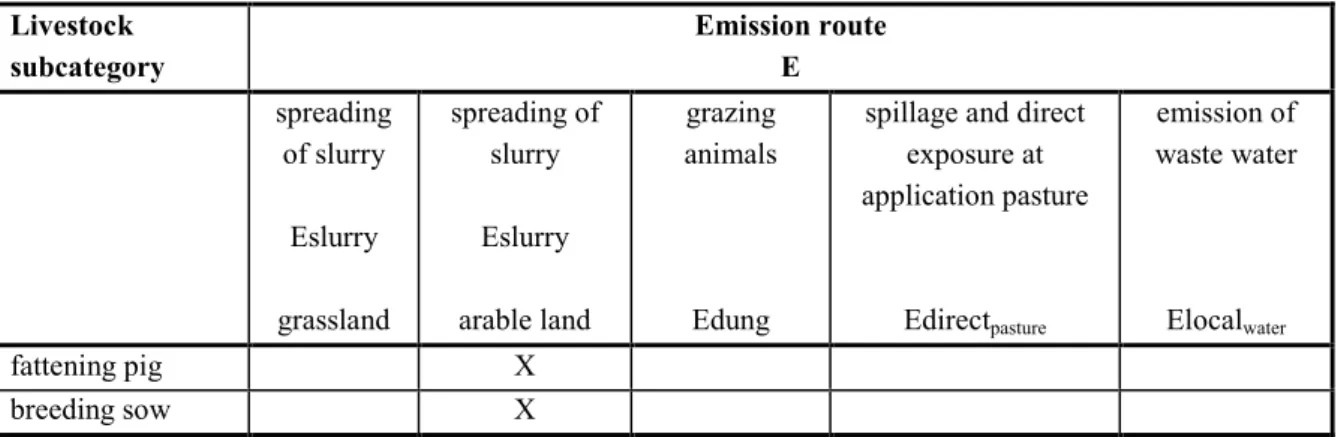
Table 7 Pick-list of animal subcategories and emission routes for pigs.
Livestock subcategory Emission route E spreading of slurry Eslurry grassland spreading of slurry Eslurry arable land grazing animals Edung
spillage and direct exposure at application pasture Edirectpasture emission of waste water Elocalwater fattening pig X breeding sow X
Table 8 Default settings for pigs.
parameter symbol unit value
(averaged) body weight msow [kgbw.animal-1] 240
mfattening pig [kgbw.animal-1] 70
number of cycles per year Ncyclesow [animal.place-1.yr-1] 1
Ncyclefattening pig [animal.place-1.yr-1] 2.8
number of housing days Thousingpigs [d.yr-1] 365
phosphate production during housing PP2O5 sow [kgP2O5.place-1.d-1] 0.030
PP2O5 fattening pig [kgP2O5.place-1.d-1] 0.012
3.4 Horses and ponies
Approximately half of the horses in the Netherlands are privately owned. Private persons and farmers keep some horses for hobby. Terrain-managing institutes keep ponies for grazing. Especially these private animals graze in fields. Donkeys are also kept in the Netherlands, but their number is relatively small compared to horses and ponies. The commercial sector is divers and consists of riding schools, dairy farming, racing centres and stud-farms. Horses for meat production are mainly imported. The commercial animals are stabled most of the time. The manure (slurry) from riding-schools is mostly collected and used for
mushroom-cultivation and compost for allotments. The major emission routes are grazing animals, and spreading of manure on allotments and spreading of mushroom-substrate after cultivation. Given the small scale of the latter emission routes, they are not further considered.
Ponies have a shoulder height <148 cm, horses >148 cm. Horses and ponies come in different sizes and body weights: a full-grown horse weighs approx. 600 kg; a Haflinger pony 400 kg; and a Shetland approx. 250 kg. Shetlands are kept outside most of the year. As there were no data available for grazing horses these were manufactured using the data for beef cattle, see Appendix I.
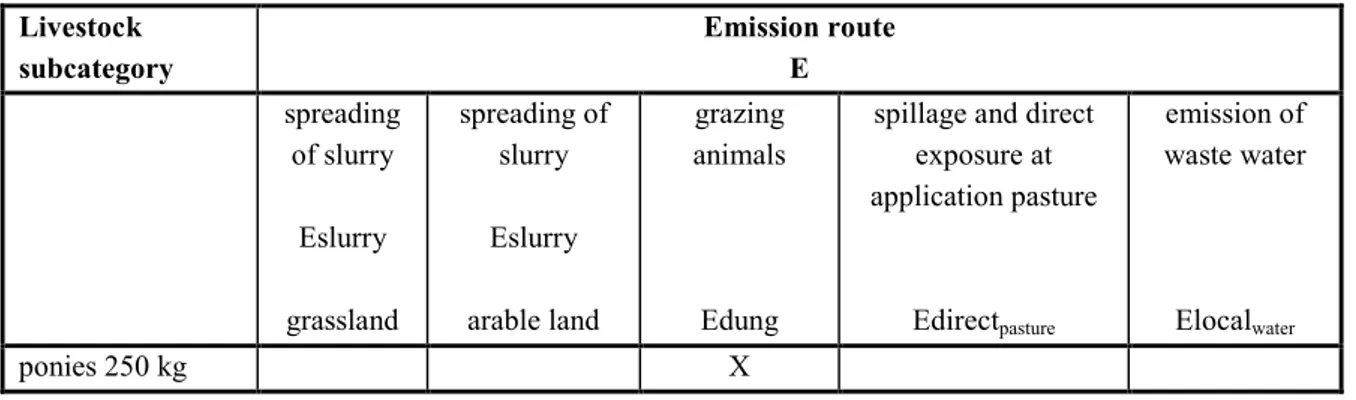
Table 9 Pick-list of animal subcategories and emission routes for horses and ponies.
Livestock subcategory Emission route E spreading of slurry Eslurry grassland spreading of slurry Eslurry arable land grazing animals Edung
spillage and direct exposure at application pasture Edirectpasture emission of waste water Elocalwater ponies 250 kg X
Table 10 Default settings for horses and ponies.
parameter symbol unit value
body weight mpony [kgbw.animal-1] 250
dung production pasture during grazing period Pdungpony [kgwwt.animal-1.d-1] 4.0
stocking density pasture Nponyha pasture [animal.ha-1] 5
number of excretions per day Nexcretion [d-1] 10.5
3.5 Chickens
Most chickens are kept indoors in cages or on floors. The manure from laying hens in cages is collected on a conveyor-belt. In the broiler industry, after every cycle the manure and litter from the floor is cleaned from the poultry house. Over eighty percent of the manure collected from layers is dried, and this percentage will increase rapidly to 100% in the next few years. Dry chicken manure cannot be injected and is hence applied to arable land. The number of chickens kept outdoors is insignificant compared to the other methods of housing. The
different stages in the life-cycle (chick, in rearing, parent animal) have different body weights and manure production figures. The following categories of chickens are used in the risk evaluation:
- Laying hens and other adults;
- Broilers and other categories in rearing.
Animals in rearing and broilers are non-oviparous. Laying hens and free hens are oviparous.
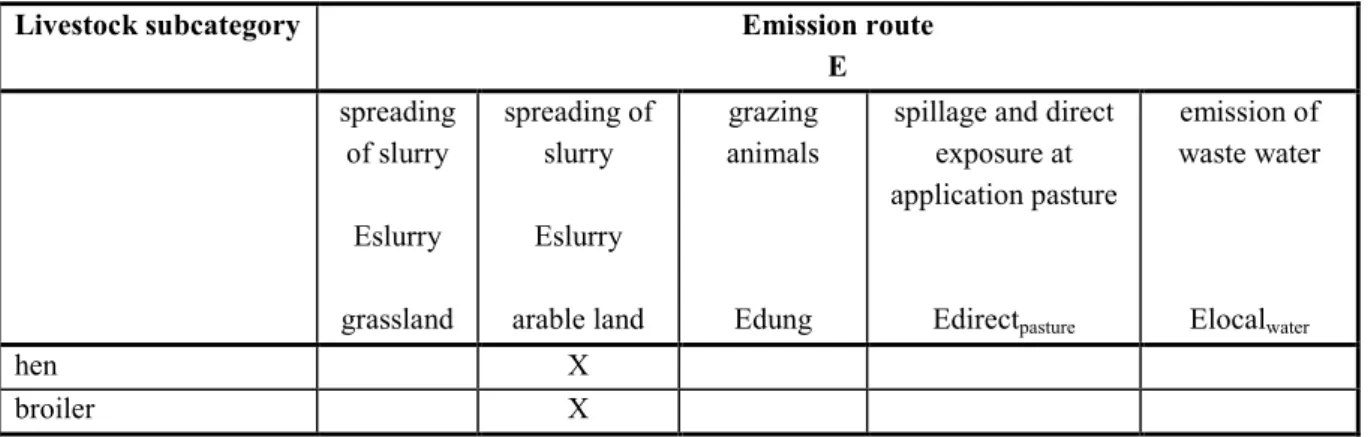
Table 11 Pick-list of animal subcategories and emission routes for chickens.
Livestock subcategory Emission route E spreading of slurry Eslurry grassland spreading of slurry Eslurry arable land grazing animals Edung
spillage and direct exposure at application pasture Edirectpasture emission of waste water Elocalwater hen X broiler X
Table 12 Default settings for chickens.
parameter symbol unit value
averaged body weight broilers mchicken broiler [kgbw.animal-1] 1
body weight adult chickens mchicken hen [kgbw.animal-1] 2
number of cycles per year Ncyclehen [animal.place-1.yr-1] 1
Ncyclebroiler [animal.place-1.yr-1] 7
number of housing days Thousingchicken [d.yr-1] 365
phosphate production during housing PP2O5 hen [kgP2O5.place-1.d-1] 0.0011
PP2O5 broiler [kgP2O5.place-1.d-1] 0.00055
3.6 Sheep
Most sheep are only put up between mid-February and mid-April to lamb. Over the year they spend 10.5 months in field and 1.5 months indoors. One ewe raises an average 1.7 lamb (range 1.33-2.80 [40]). The lamb and ewe are turned out approx. three weeks after giving birth, and the lamb is slaughtered after 6 months when it reached a weight of 40-45 kg. A mature ewe weighs an average 82 kg [41]. The ewes may be treated for diseases when they are put up, and approximately one week after giving birth the animals are treated with anthelmintics. This latter treatment is repeated in May-June and September-October. The body weight and dung production of the lambs is therefore chosen at 32 calendar weeks (end of May) and averaged for ewes and rams, single and twins.
Sheep can also be dipped or substances can be applied topically in high volumes. The following categories of sheep are used in the risk evaluation:
- sheep on pasture, >1 year old, including lambs ≤45 kg.
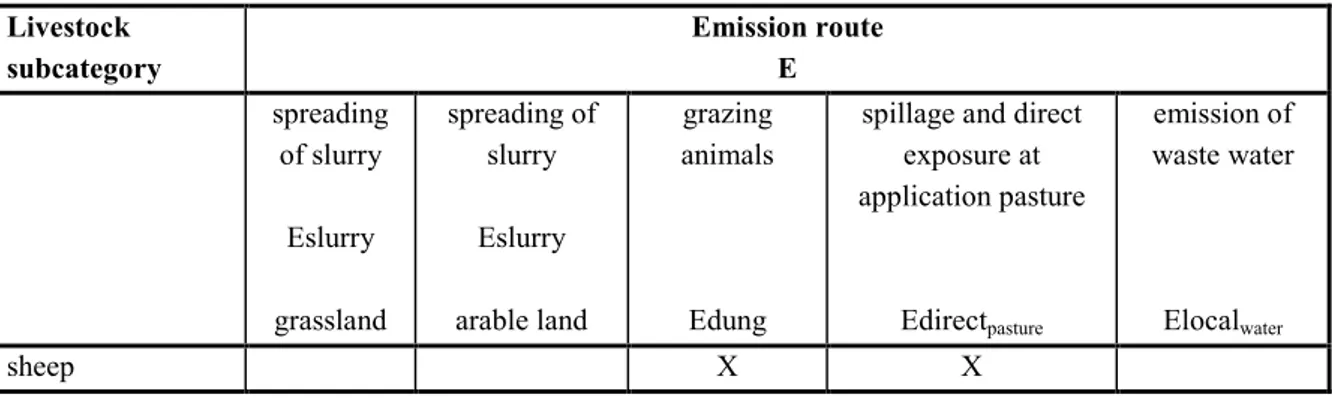
Table 13 Pick-list of animal subcategories and emission routes for sheep.
Livestock subcategory Emission route E spreading of slurry Eslurry grassland spreading of slurry Eslurry arable land grazing animals Edung
spillage and direct exposure at application pasture Edirectpasture emission of waste water Elocalwater sheep X X
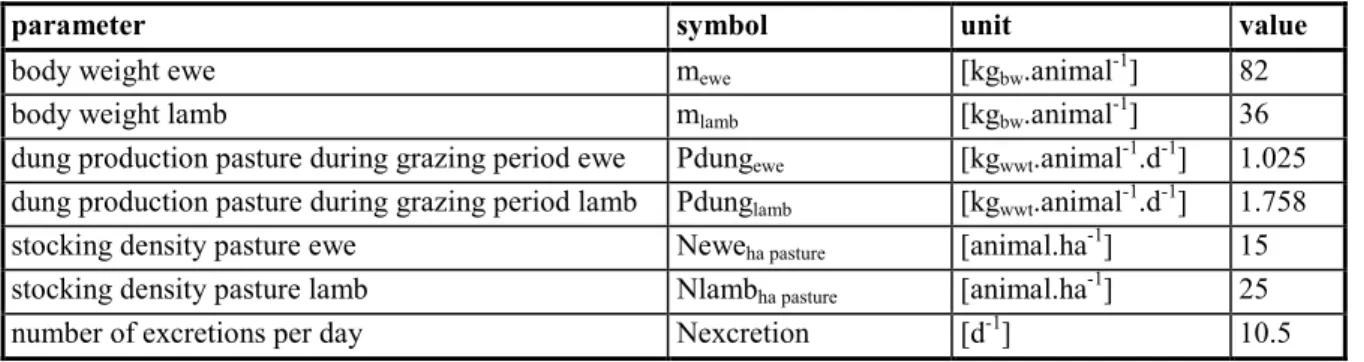
Table 14 Default settings for sheep.
parameter symbol unit value
body weight ewe mewe [kgbw.animal-1] 82
body weight lamb mlamb [kgbw.animal-1] 36
dung production pasture during grazing period ewe Pdungewe [kgwwt.animal-1.d-1] 1.025
dung production pasture during grazing period lamb Pdunglamb [kgwwt.animal-1.d-1] 1.758
stocking density pasture ewe Neweha pasture [animal.ha-1] 15
stocking density pasture lamb Nlambha pasture [animal.ha-1] 25
number of excretions per day Nexcretion [d-1] 10.5
3.7 Fish
Fish medicines are mostly added to the water, after which the circulation is stopped. Some antibiotics can be added to the feed.
The scale of fish cultivation for commercial purposes is limited in the Netherlands [42]. In 1994 in total 26 and 10 companies were involved in cultivating eel and catfish, respectively. Rainbow trout is cultivated on a small scale in flow-through and in landbased systems, in which the water body fulfils a role in water treatment. Several trout nurseries use flow-through systems: surface water is lead flow-through the fish basin over a settling tank back into the surface water system. There is one place in the province Zeeland where Salmonidae are kept in cages in the estuary. There are no cage systems in fresh surface water. Finally, there are occasional projects in the cultivation of turbot, tilapia, and sturgeon.
Most nurseries use recirculation systems that recycle the water after a (biological) water treatment (filtration). Catfish nurseries discharge on the Sewage Treatment Plants (STP), but 40% of the eel nurseries discharge directly on surface water. The number of companies that discharge the fish water untreated is negligible, as most have some way of water treatment (filters, settlement basins, ponds) before the water is discharged. The recycling systems and the settlement tanks before discharge remove virtually all particles. Many nurseries collect the sludge from this treatment and sell or use it as fertiliser.
The following scenarios are proposed, based on information given in [42]. The scenarios are based on a fish farm that breeds 50 tonnes eel a year, the median production.
a) Continuous treatment; with recirculation/filtration, followed by settlement tank and STP; b) Continuous treatment; without recirculation/filtration, followed by settlement tank; c) Occasional treatment (up to 4 times a year), without recirculation/filtration before
discharge on the settlement tank and STP;
d) Occasional treatment (up to 4 times a year), without recirculation/filtration before discharge on the settlement tank.
On a yearly basis an eel farm discharges 200-1900 m3 water per tonne fish, depending on the water use. An average 250 m3 per tonne fish is used here, which results in a turnover rate of 35 m3.d-1. It is assumed that the total water volume of the nursery4 is 70 m3. After the
settlement tank the water fraction is discharged, while the sludge (2% dry matter) in the tank (and filters) is used as soil fertiliser. Per tonne fish 13 kg P (equivalent to 60 kg P2O5) is
removed in the sludge. The load from the settlement tank and recirculation system will be expressed in terms of kg chemical per day, and it is assumed that this load is equally spread over 25 days in case of occasional treatment.
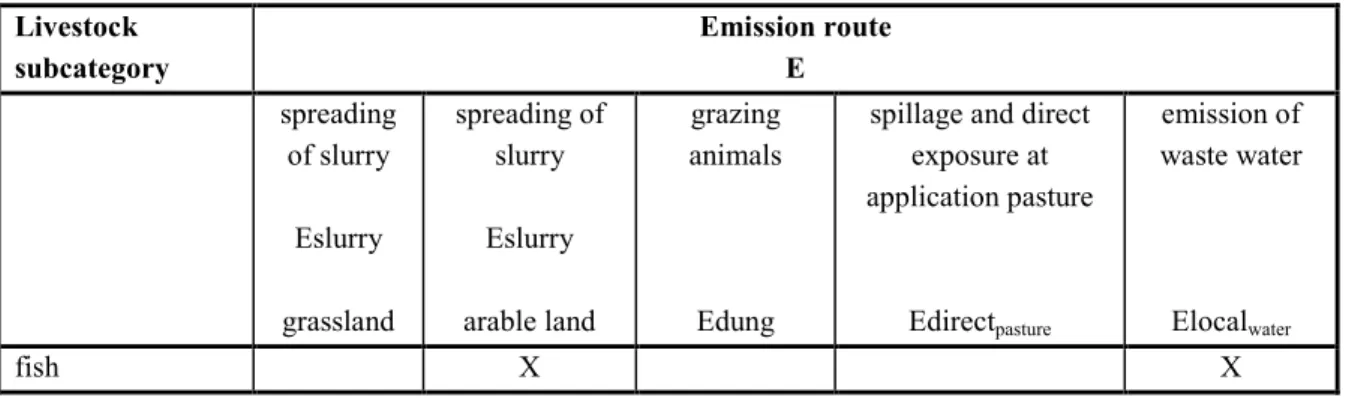
Table 15 Pick-list of animal subcategories and emission routes for fish.
Livestock subcategory Emission route E spreading of slurry Eslurry grassland spreading of slurry Eslurry arable land grazing animals Edung
spillage and direct exposure at application pasture Edirectpasture emission of waste water Elocalwater fish X X
Table 16 Default settings for fish.
parameter symbol unit value
phosphate production per day PP2O5 fish [kgP2O5.d-1] 8.22
fraction retention in sludge with filtration Fret, filtration [-] 0.5
fraction retention in sludge without filtration Fret [-] 0
number of application continuous treatment Napplcon. [yr-1] 365
number of application occasional treatment Napplocc. [yr-1] 4
volume of waste water continuous treatment Vwaste watercon. [l] 35000
volume of waste water occasional treatment Vwaste waterocc. [l] 70000
dilution factor receiving water continuous treatment DILUTIONfish,con. [-] 5
dilution factor receiving water occasional treatment DILUTIONfish,occ. [-] 3
emission period for discharge to STP Temissionstp [d] 25
3.8 Agricultural manuring practice in the Netherlands
The Dutch agricultural practice is characterised by:
- restricted manure spreading periods for grassland and arable land; - annual phosphate immission standards for animal fertiliser;
- annual nitrate immission standards for both artificial and animal fertiliser;
- injection of slurry into the grassland, ranging from just below the turf up to 30 cm depth; - spreading of slurry onto arable land, immediately followed by a tillage operation;
- different fertiliser loads on sand, clay and peat soils, with variation in solid/liquid fractions depending on the season;
- different fertiliser recommendations depending on fertiliser type, soil type and crop. The periods in which the spreading of manure (i.e. stable manure, slurry and sludge) is allowed are different for indicated and non-indicated areas. For indicated areas this period is February 1 August 31 for grassland and arable land. For nonindicated areas this period is February 1 -September 15 for grassland and the whole year for arable land.
Cattle manure is used on grasslands and arable lands. Other manure types are predominantly used on arable land. Manure quality has been defined for administrative purpose [38], and these data reveal that manure application is limited by phosphate load for all animal categories. We assume that the phosphate immission standard is filled in one event, as this is practice in most fields [38]. During winter the manure is stored for 152 days. The amount of manure produced in this period determines the dilution of the excreted dosage. We need to take into account the number of treatments per place per year. A treatment that is repeated every cycle is given twice a year to veal, but seven times to broilers. We therefore calculate a maximum concentration in the manure, based on the intervals between spreading.
Degradation in the manure tank is not taken into account in the Phase I total residue approach. Manure tank conditions are variable and not standardised in the risk model, hence at the moment the incorporation of experimental results in the risk calculations is ambiguous [43].
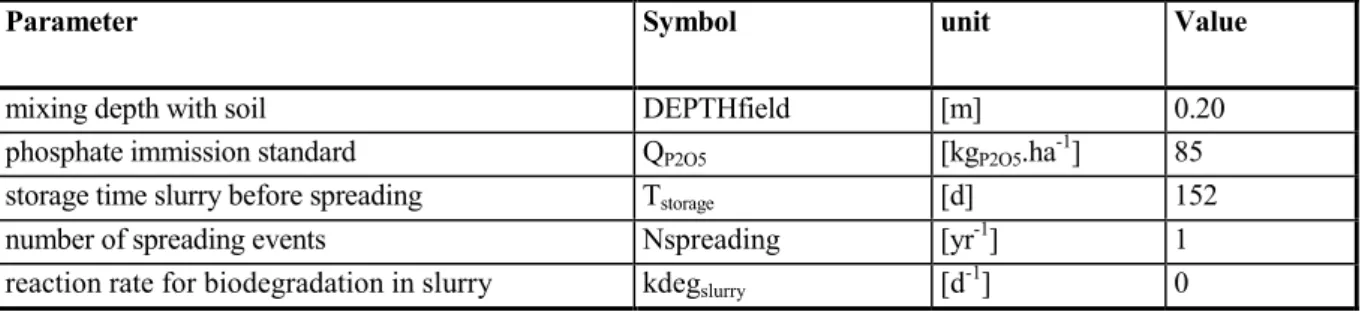
Table 17 Default settings for spreading of manure on grassland and arable land.
Parameter Symbol unit Value
mixing depth with soil DEPTHfield [m] 0.20
phosphate immission standard QP2O5 [kgP2O5.ha-1] 85
storage time slurry before spreading Tstorage [d] 152
number of spreading events Nspreading [yr-1] 1
4. Emission and distribution models
4.1. Concentrations in dung
Treated animals that graze in the field excrete drug residues in the urine and faeces. Relevant environmental compartments that are exposed directly are the dung, the soil, and the surface water.
We assume that in the event the herd need a remedy that takes several treatments over a few days, the animals are housed or stabled. Therefore the model has to take only
single-application products into account. We need a reasonable maximum concentration in dung, which preferably is determined in controlled experiments.
When this information is not delivered, we calculate a worst-case maximum. If useful information on excretion is available, this can be used to calculate a better estimation of the concentration in the dung.
Use the factors in Table 24 to adjust the dosage of products with external application. In addition, sheep are supposed to rub off 20% of the dosage they receive from dipping.
Table 18 Default settings for the module for the calculation of the maximum concentration in dung.
parameter symbol unit value
duration of treatment Ttreatment [d] 1
highest fraction excreted in dung in one day Fmax. excreted dung [-] 1
number of dung excretion events per day Nexcretion [d-1] 10.5
Model for the calculation of the maximum concentration in dung if PECdung is not available
from the dossier:
PECdung Q C m T F Nexcretion
Pdung
product c animal treatment excreted dung
animal
= ⋅ ⋅ ⋅ ⋅ max. . ⋅
input
Qproduct dosage product used [kg.kgbw-1.d-1] S
Cc concentration a.i. in product [mgc.kg-1] S
manimal (averaged) body weight [kgbw.animal-1] S/D
Ttreatment duration of treatment [d] D
Fmax. excreted dung highest fraction excreted in dung in one day [-] S/D
Pdunganimal dung production animal in field [kgwwt.animal-1.d-1] O
Nexcretion number of dung excretion events per day [d-1] D
output
4.2. Concentrations in soil
The soil can be reached by direct and indirect exposure: - spreading of slurry and sludge;
- leaching from dung on the pasture; - direct excretion with urine on the pasture;
- emission of (high volume) topical application fluids.
4.2.1. The concentration in soil after spreading of slurry
The concentration in the soil depends on a number of factors. One has to consider the relation between the moments the substance is excreted into the slurry and the moments the slurry is removed from the basin, thus the time the substance is in the slurry. The effective time degradation can take place in slurry cannot be calculated mathematically. Therefore arbitrary values will be given to simulate an average situation. The amount of slurry spread depends on the immission standard and the phosphate content of the slurry. For the model calculations it is assumed that the excretion of residues into slurry takes place in one single event (in reality the excretion could takes several days).
The immission standard is filled in one spreading event. Given Tstorage the maximum number
of applications (Napplication) within the winter storage period is:
Table 19 Pick list for the calculation of the PECsoil.
Ncycleanimal Tcycleanimal Napplication
≤2.4 ≥152 1
2.5-4.7 77-151 2
4.8-7.2 51-76 3
Input
Ncycleanimal Number of cycles per year [animal.place-1.yr-1] D
Output
Tcycleanimal Duration of cycle [d] O
Napplication Number of applications per storage period [animal.place-1] O
In case degradation is not considered (Phase I total residue approach): Qexcreted =Qproduct ⋅C Tc ⋅ treatment ⋅Fexcreted ⋅manimal
P2O5 storage excreted P2O5 T P on Napplicati Q C ⋅ ⋅ =
DEPTHfield CONV RHOsoil Q C PECsoil field area O P O P ⋅ ⋅ ⋅ = 2 5 2 5
Substances used for topical application (spraying or pour-on) on animals may reach the slurry directly due to spillage (drift from spraying). For pour-on this emission is considered
negligible. Sprays and dips are supposed to spill 20% of the dosage.
Table 20 Default settings for the calculation of the concentration in slurry by direct exposure.
product type symbol unit value
spray Fslurryspillage [-] 0.2
pour-on Fslurryspillage [-] 0
The Fexcreted in the formula is corrected with (1- Fslurryspillage) and finally the concentration in
slurry caused by the Fslurryspillage is added.
) )
1
(( spillage excreted spillage
animal treatment
c product
excreted Q C T m Fslurry F Fslurry
Q = ⋅ ⋅ ⋅ ⋅ − ⋅ +
In case degradation is considered in Phase II, for every substance of concern, the following equations can be applied. Manure tank conditions are variable and not standardised in the risk model, hence at the moment the incorporation of experimental results in the risk calculations is ambiguous [43].
Qexcreted =Qproduct ⋅C Tc ⋅ treatment ⋅Fexcreted ⋅manimal
k DT slurry slurry deg ln deg = 2 50 2 / deg 1 1 k slurryTrest rsl on Napplicati rsl P2O5 storage excreted P2O5 e F F P T Q C ⋅ − ⋅ − − ⋅ ⋅ =
Frsl =e−kdegslurry⋅Tcyclusanimal
Trest =Tstorage −(Napplication− ⋅1) Tcyclus Tcyclus = 365 / Ncyclusanimal
DEPTHfield CONV RHOsoil Q C PECsoil field area O P O P ⋅ ⋅ ⋅ = 2 5 2 5
Input-output list of the models for the calculation of the concentration in soil after uptake and excretion into slurry.
input
Qproduct Dosage product used [kg.kgbw-1.d-1] S
Cc Concentration a.i. in product [mgc.kg-1] S
Ttreatment Duration of treatment [d] S
manimal (averaged) body weight [kgbw.animal-1] O
Fexcreted Fraction excreted in faeces and urine [-] S/D
Ncycleanimal Number of cycles per year [animal.place-1.yr-1] O
PP2O5 Phosphate production animal in stable [kgP2O5.place-1.d-1] O
DT50degslurry Half-life time in slurry [d] S/D
Tstorage Average storage time slurry grassland/arable land [d] O
Nspreading Number of slurry spreading events in a year [yr-1] O
QP2O5 Phosphate immission standard [kgP2O5. ha-1] D
RHOsoil Dry bulk density of soil [kg.m-3] Dc
DEPTHfield Mixing depth with soil [m] O
CONVarea field Conversion factor for the area of the agricultural field [m2.ha-1] Dc
Napplication Number of applications per storage period [animal.place-1] O
intermediate results
kdegslurry Reaction rate for transformation in slurry [d-1] O
Frsl Fraction remaining in slurry after time Tinterval [-] O
Qexcreted Amount substance excreted [mgc.animal-1] O
CP2O5 Concentration in phosphate [mgc.kgP2O5-1] O
Tcycle Duration of cycle [d] O
Trest Duration of storage after last treatment [d] O
output
PECsoil Concentration in the soil [mgc.kgsoil-1] O
4.2.2. The concentration in soil by spreading of urine and leaching
from dung
Substances that are taken up and are excreted by grazing animals reach the soil. Urine is spread in several events per day and penetrates the soil. Residues might leach from dung into the soil. We assume that the water fraction in the dung is transferred to the soil (e.g. when raining) and that the residues are evenly distributed in the top 5 cm throughout the field (Table 21).
Substances with external application on grazing animals have a fraction of the dosage that is spilled (Fsoilspillage). See § 4.2.4 and Appendix I for more information.
Model for calculation of the concentration in soil after spreading of urine and leaching from dung.
Qexcreted urine =Qproduct⋅C mc⋅ animal ⋅Fexcreted urine⋅Ttreatment Qleached.dung =Qproduct ⋅C mc⋅ animal⋅Fexcreted dung⋅Fleached.dung⋅Ttreatment
Fexcreted dung = −1 Fexcreted urine unless experimentally measured.
F Fwater K leached dung dung dung water . = −
Kdung water Fwaterdung Fsoliddung Kpdung RHOsolid
dung
− = + ⋅ 1000 ⋅
Kpdung =Focdung ⋅Koc
(
)
DEPTHfield CONV RHOsoil Nanimal Q Q PECsoil field area field dung leached urine excreted ⋅ ⋅ ⋅ + = inputQproduct dosage product used [kg.kg bw-1.d-1] S
Cc concentration a.i. in product [mgc.kg-1] S
manimal (averaged) body weight [kgbw.animal-1] P
Ttreatment duration of treatment [d] D
Fexcreted urine fraction excreted in urine [-] S/D
Nanimalfield stocking density animals [animal.ha-1] P
RHOsoil dry bulk density of soil [kg.m-3] Dc
DEPTHfield mixing depth with soil [m] Dc
CONVarea field conversion factor for the area of the field [m2.ha-1] Dc
RHOsoliddung density of dung solids [kg.m-3] Dc
RHOwater density of water [kg.m-3] Dc
Fwaterdung fraction water in dung [m3.m-3] P
Fsoliddung fraction solids in dung [m3.m-3] P
Focdung weight fraction of fraction organic carbon in dung [kg.kg-1] Dc
Koc partition coefficient organic carbon - water [dm3.kg-1] S/O
intermediate results
Qexcreted urine quantity a.i. excreted with urine [mgc.animal-1] O
Qleached dung quantity a.i. leached with dung [mgc.animal-1] O
Fexcreted dung fraction excreted in dung [-] O/S
Fleached dung fraction leached from dung [-] O
Kdung-water partition coefficient solids and water in dung [m3.m-3] O
Kpdung partition coefficient solids and water in dung [dm3.kg-1] O
output
Table 21 Default settings for the module for spreading of urine and leaching from dung.
parameter symbol unit value
duration of treatment Ttreatment [d] 1
fraction excreted in urine Fexcretedurine [-] 1
bulk density of soil RHOsoil [kg.m-3] 1500
mixing depth with soil DEPTHfield [m] 0.05
conversion factor for area of the agricultural field CONVarea field [m2.ha-1] 10000
density of dung solids RHOsoliddung [kg.m-3] 1675
density of water RHOwater [kg.m-3] 1000
weight fraction of organic carbon in dung Focdung [kg.kg-1] 0.44
fraction leached from dung Fleached dung [-] 0
4.2.3. The concentration in soil by spreading of sludge from
fisheries
It is assumed the sludge is only spread on arable land. In case of the total residue approach, the degradation terms are not used.
Table 22 Default settings for the calculation of the concentration in soil after spreading of sludge.
parameter symbol unit value
bulk density of soil RHOsoil [kg.m-3] 1500
conversion factor for the area of the agricultural field CONVarea field [m2.ha-1] 10000
phosphate production per day PP2O5 fish [kgP2O5.d-1] 8.22
reaction rate for biodegradation in slurry kdegskurry [d-1] 0
mixing depth in soil DEPTHfield [m] 0.20
Storage time sludge Tstorage [d] 152
Table 23 Pick list for the default settings of the fraction of retention in sludge, treatment time and volume of waste water.
type of treatment type of water treatment Fret [-] Napplicationfish,soil Vwaste water [l]
continuous treatment filtration and settlement tank 0.5 equals Tstorage 35000
continuous treatment settlement tank 0 equals Tstorage 35000
occasional treatment settlement tank 0 2 70000
input
type of treatment [-] S
type of water treatment [-] S
output
Fret fraction of chemical retained [-] O
Napplicationfish,soil number of applications during storage period [-] O
Vwaste water volume of waste water [l] O
Models for the calculation of the concentration in soil after spreading of sludge. 1. General formulas. ) 1 ( ret c product
emitted Q C Vwaste water F
Q = ⋅ ⋅ ⋅ − DEPTHfield CONV RHOsoil C Q PECsoil field area O P O P ⋅ ⋅ ⋅ = 2 5 2 5 2. Continuous treatment: 2 / deg 1 1 slurry rest fish T k rsl on Napplicati rsl P2O5 storage emitted P2O5 e F F P T Q C ⋅ − ⋅ − − ⋅ ⋅ = Frsl =e−kdegslurry⋅1 T rest = 1 3. Occasional treatment: C Q T P e P2O5 emitted storage P2O5 k slurryTrest = ⋅ ⋅ − deg ⋅ /2 =152 rest T input
Qproduct dosage product used [kg.l-1] S
Cc concentration a.i. in product [mgc.kg-1] S
Vwaste water volume of waste water discharged [l] O
Fret fraction of retention in sludge [-] O
PP2O5 fish phosphate production per day [kgP2O5.d-1] D
Napplicationfish number of applications per storage period for fish
treatment
[-] O
Trest maximum time remaining after last treatment [d] D
Q P2O5 phosphate immission standard [kgP2O5. ha-1] D
RHOsoil bulk density of soil [kg.m-3] Dc
DEPTHfield mixing depth with soil [m] D
CONVarea field conversion factor for the area of the agricultural field [m2.ha-1] Dc
intermediate results
kdegslurry reaction constant transformation in slurry [d-1] O
Frs fraction remaining in soil after time Tinterval [-] O
Frsl fraction remaining in sludge after time Tinterval [-] O
Qemitted amount of substance emitted [mgc] O
CP2O5 concentration in phosphate [mgc.kgP2O5-1] O
output
4.2.4. The concentration in soil by direct exposure
Substances used for topical application (spraying or pour-on) on grazing animals may reach the environment directly due to spillage (drift from spraying), washing off by rain and rubbing off. Initially, a calculation is performed where it is assumed that the dosage for the entire heard reaches the soil completely. This can be calculated using the model in § 4.2.2 and using Fexcreted urine = 1. Should the trigger for soil be exceeded, a refined calculation is
made, assuming spillage, uptake and excretion.
Table 24 Default settings for the calculation of the concentration in soil by direct exposure.
product type symbol unit value
spray Fsoilspillage [-] 0.2
pour-on Fsoilspillage [-] 0
For pour-on this emission is considered negligible. Sprays are supposed to spill 20% of the dosage. In addition, sheep are supposed to rub off 20% of the dosage they receive from dipping. The Qproduct in § 4.2.2 is corrected with (1- Fsoilspillage) (see Table 24) and finally the
concentration in soil caused by the Fsoilspillage is added.
Discharge of sheep dips may be regulated by instructions induced by law or by good agricultural practice. When the remaining dip should be spread over the land as if it were slurry, than this scenario should be used for calculations. In the event these specific instructions are lacking, a worst-case scenario is used. The concentration in soil after discharge of dipping fluids on the land depends on the concentration of the product in the fluid. The area and volume of soil that will be contaminated depends on the volume of the fluid discharged and soil structure. Soil has a volume fraction of solids of 0.6 (see Table 26). The fluid will take maximally 40% of the soil volume by superseding the air and the present soil porewater.
Table 25 Default settings for the module for discharge of sheep dips.
parameter symbol Unit value
bulk density of soil RHOsoil [kg.m-3] 1500
fraction of the product remaining in dip after treatments Frd [-] 0.8
volume fraction of solids in soil Fsolidssoil [m3. m-3] 0.6
Model for calculation of the concentration in soil after discharge of sheep dips.
water Vdilution
C D
RHOsoil Fsolids F PECdip PECsoil = ⋅ rd ⋅(1− soil) input
Dproduct dosage product used [kg] or [l] S
Cc concentration a.i. in product [mgc.kg-1] or [mgc.l-1] S
Frd fraction of the product remaining in dip after treatments [-] D/S
Fsolidssoil volume fraction of solids in soil [m3. m-3] Dc
Vdilution water volume of dilution water prescribed [m-3] S
intermediate results
PECdip initial (prescribed) concentration in dip fluid or foot bath [mgc.m-3] O
output
PECsoil concentration in the soil [mgc.kgsoil-1] O
4.3. The concentration in groundwater
In Phase I the concentration in groundwater is not assessed. In Phase II experimental data on DT50 and Koc are available and the groundwater leaching model PEARL is used for
calculations [44].
4.4. The concentration in surface water
Surface water is reached by direct and indirect exposure: - run-off;
- leaching and drainage; - erosion;
- direct excretion into surface water; - emission of waste water from fisheries.
Run-off and erosion are not considered to be important distribution factors in the
Netherlands. An exposure assessment of surface water through leaching and drainage is not considered necessary in case the Koc of the drug substance is >500 l/kg.
4.4.1. Leaching from agricultural soil
Substances not adsorbed to soil particles may be present in the soil water and thus be prone to leaching and drainage during rainfall events. The concentration in the surface water will be influenced by the amount of rainfall relative to the interstitial pore water and subsequent dilution by the receiving water. It is assumed that catchment areas tend to be proportional in size to the receiving stream therefore no account is taken of the size of the catchment or receiving water. Further dilution occurs on entry of run-off water into receiving water (a factor of 10 is chosen)