Rijksinstituut voor Volksgezondheid en Milieu
National Institute for Public Health and the Environment
Rijksinstituut voor Integraal Zoetwaterbeheer en Afvalwaterbehandeling Institute for Inland Water Management and Waste Water Treatment
Rijksinstituut voor Kust en Zee
National Institute for Coastal and Marine Management
Keuringsdienst van Waren
Inspectorate for Health Protection and Veterinary Public Health Monitoring of radiation in the environment in the Netherlands Results in 2002
G.J. Knetsch, editor
This report was commissioned by the Ministry of Housing, Spatial Planning and the Environment within the framework of project 861020; monitoring Euratom.
Abstract
The Dutch government is compelled to measure radioactivity in the environment under terms of the Euratom Treaty of 1957. This report presents the results of radioactivity measurements in the Dutch environment in 2002. The measurements were carried out by RIVM, RIZA, RIKZ and Inspectorate for Health Protection and Veterinary Public Health. Radioactivity measurements were carried out on airborne particles, deposition, surface water, seawater, drinking water and food (honey, powdered milk, game, poultry, blueberry and chanterelle). No measurements were performed on milk since 1998. Results for ambient dose equivalent rates have been obtained from the National Radioactivity Monitoring Network.
In 2002 two unusual levels of radioactivity were found in the Dutch environment. The
activity concentration of 210Pb in air dust during week 45 (3000 ± 300 µBq⋅m-3) is the highest concentration since 1991. A deposited 7Be-activity as high as that of week 43
(158 ± 19 Bq⋅m-2) has not occurred since 1998.
Furthermore, the 3H-activity in the Meuse exceeded the target value (10 Bq⋅L-1) in ten out of thirteen samples taken. However the yearly average (15 Bq⋅L-1) is within range of previous years.
The Dutch monitoring program deviates from the recommendations of the European union, mainly concerning the measurement of drinking water, milk and food.
Preface
The following institutes have contributed to the report:
The National Institute for Public Health and the Environment (RIVM)
Data on air dust, deposition, ambient dose rates and drinking water.
ing. G.J. Knetsch (editor), dr. P.J.M. Kwakman, mw. ir. C. de Hoog, ing. R.B. Tax, dr. H.A.J.M. Reinen (RIVM/LSO), mw. ir. J.F.M. Versteegh (RIVM/IMD).
The Institute for Inland Water Management and Waste Water Treatment (RIZA)
Data on surface water from the main inland waters.
drs. J.M. van Steenwijk, mw. M. Holierhoek, C. Engeler, ing. M van der Weijden, mw dr. A. Houben-Michalkova.
The National Institute for Coastal and Marine Management (RIKZ)
Data on seawater.
drs. V.T. Langenberg, ing. R.W. Bovelander.
The Inspectorate for Health Protection and Veterinary Public Health (KvW)
Data on foodstuffs. ing. J.A.M. Geertsen.
Contents
Samenvatting 5
Summary 7
1. Introduction 10
2. Airborne particles 11
2.1 Gross α- and β-activity 11
2.2 γ-Emitting nuclides 13
3. Deposition 17
3.1 Gross α- and β-activity 17
3.2 γ-Emitting nuclides 19
4. National Radioactivity Monitoring Network 21
5. Surface water and seawater 25
5.1 Introduction 25
5.2 The results for surface water 28
5.3 The results for seawater 31
6. Water for human consumption 37
7. Milk 38
8. Food 39
8.1 Honey 39
8.2 Powdered Milk 39
8.3 Game and poultry 39
8.4 Other products 39
9. Conclusions 40
References 41
Appendix A 45
Samenvatting
In het kader van het Euratom Verdrag uit 1957 is de Nederlandse overheid verplicht om radioactiviteitsgehaltes te meten in de compartimenten lucht, water en bodem. In 2000 heeft de Europese Unie dit nauwkeuriger gespecificeerd middels aanbevelingen. Hierin wordt in detail beschreven wat moet worden gemeten (luchtstof, de omgevingsdosis, oppervlaktewater, drinkwater, melk en voedsel) en met welke frequentie. De resultaten dienen jaarlijks te
worden gerapporteerd. In dit rapport worden de resultaten gegeven van
radioactiviteitsmetingen in het Nederlandse milieu in 2002. De metingen zijn verricht door RIVM, RIZA, RIKZ en Keuringsdienst van Waren.
In luchtstof werd de jaargemiddelde activiteitsconcentratie bepaald van totaal-α, totaal-β, 7Be, 137Cs en 210Pb. In depositie werd de totale jaarlijkse activiteit bepaald van totaal-α, totaal-β, 3H, 7Be, 134Cs, 137Cs, 210Pb en 210Po. Totaal-α respectievelijk totaal-β is de totale activiteit aan α- dan wel β-straling uitzendende nucliden. De resultaten zijn weergegeven in Tabel S1. Met het Nationaal Meetnet Radioactiviteit (NMR) werden activiteitsconcentraties bepaald in luchtstof voor totaal-α en kunstmatige β (β-straling uitgezonden door nucliden afkomstig van menselijk handelen). Het verschil tussen de NMR-metingen en bovenstaande metingen wordt vooral veroorzaakt door de bijdrage van kortlevende natuurlijke radionucliden (radon en dochterproducten). Het jaargemiddelde voor de totaal-α-activiteitsconcentratie in luchtstof (inclusief radondochters) was 3,1 Bq·m-3. Het jaargemiddelde voor de berekende kunstmatige β-activiteitsconcentratie in luchtstof week niet significant af van nul. Met het NMR werd daarnaast het omgevingsdosisequivalenttempo bepaald, de jaargemiddelde meetwaarde was 73 nSv·h-1. Gebaseerd op eerder onderzoek wordt aangenomen dat deze waarde een
overschatting is met 5 tot 10 nSv·h-1.
In oppervlaktewater werd de jaargemiddelde activiteitsconcentratie bepaald van 3H en rest-β (totaal-β minus het van nature aanwezige 40K). Daarnaast werd in oppervlaktewater de
jaargemiddelde activiteitsconcentratie bepaald van 137Cs in zwevend stof. In zeewater werd de jaargemiddelde activiteitsconcentratie bepaald van totaal-α, rest-β, 3H en 90Sr. In zwevend stof in zeewater werd de jaargemiddelde activiteitsconcentratie bepaald van 137Cs en 210Po. De resultaten zijn weergegeven in Tabel S1.
Gangbare waarden die in ruw water voor de drinkwaterproductie gevonden worden, zijn 1-10 Bq·L-1 voor 3H-activiteit en 0,1-1 Bq·L-1 voor zowel totaal-β als rest-β-activiteit. In dit water is weinig kalium, en dus 40K, aanwezig.
Radioactiviteitsmetingen zijn verricht aan een aantal voedingsproducten. De resultaten zijn weergegeven in Tabel S1. Radioactiviteit werd niet gedetecteerd in enkele bemonsterde producten, waaronder bosbes en cantharel. Sinds 1998 zijn er geen metingen verricht aan melk.
In 2002 zijn er in het Nederlandse milieu enkele ongebruikelijke niveaus van radioactiviteit gevonden. De activiteitsconcentratie van 210Pb in luchtstof gedurende week 45
(3000 ± 300 µBq⋅m-3) is de hoogste concentratie sinds 1991. Sinds 1998 is de gedeponeerde 7Be-activiteit niet meer zo hoog geweest als die van week 43 (158 ± 19 Bq⋅m-2). Daarnaast overschreed de 3H-activiteit in de Maas in tien van de dertien in 2002 genomen monsters de streefwaarde van 10 Bq⋅L-1. Het jaargemiddelde (15 Bq⋅L-1) ligt in het bereik van voorgaande jaren.
Vergeleken met de aanbevelingen van de Europese Unie blijkt dat het Nederlandse
meetprogramma op een aantal punten tekortschiet, met name voor wat betreft controle van drinkwater, melk en overige voedingsmiddelen.
Summary
The Dutch government is compelled to measure radioactivity in air, water and soil under the terms of the Euratom Treaty of 1957. In 2000 the European Union specified this treaty by means of recommendations, in which is described the matrices to be measured (air dust, ambient dose equivalent rate, surface water, drinking water, milk and food) and the frequency of the measurements. The results should be published yearly. This report presents the results of radioactivity measurements in the Dutch environment in 2002. The measurements were carried out by RIVM, RIZA, RIKZ and the Inspectorate for Health Protection and Veterinary Public Health.
The yearly averaged activity concentration in air dust was determined for gross α, gross β, 7Be, 137Cs and 210Pb. The yearly total activity in deposition was determined for gross α, gross β, 3H, 7Be, 134Cs, 137Cs, 210Pb and 210Po. Gross α respectively gross β is the total activity of nuclides emitting α- respectively β-radiation. The results are presented in Table S1.
The National Radioactivity Monitoring Network (NMR) was used to determine the activity concentrations in air of gross α and artificial β (β-radiation emitted by man-made nuclides). The difference between the NMR data and those mentioned above is mainly due to the contribution of short-lived natural radionuclides (radon and its daughters). The yearly averaged gross α-activity concentration in air dust was 3.1 Bq·m-3. The yearly average of the calculated artificial β-activity concentration did not deviate significantly from zero. The NMR was also used to determine the ambient dose equivalent rate, the yearly averaged measured value was 73 nSv·h-1. Based upon earlier research it is assumed that this value is an
overestimate of 5 to 10 nSv·h-1.
The yearly averaged activity concentrations of 3H and residual β (gross β minus naturally occurring 40K) were determined in surface water. The yearly averaged activity concentration of 137Cs was determined in suspended solids in surface water. In seawater the yearly averaged activity concentration was determined for gross α, residual β, 3H and 90Sr. The yearly averaged activity concentrations of 137Cs and 210Po were determined in suspended solids in seawater. The results are presented in Table S1.
Typical activities found in raw input water for drinking water production were 1-10 Bq·L-1 for 3H-activity and 0.1-1 Bq·L-1 for gross β- and residual β-activity. There is little potassium, and thus 40K, present in this water.
Radioactivity was determined in some food products. The results are presented in Table S1. Radioactivity was not detected in several products sampled, amongst which blueberry and chanterelle.
No measurements were performed on milk since 1998. In 2002 two unusual levels of
radioactivity were found in the Dutch environment. The activity concentration of 210Pb in air dust during week 45 (3000 ± 300 µBq⋅m-3) is the highest concentration found since 1991. A
deposited Be-activity as high as that of week 43 (158 ± 19 Bq⋅m ) has not occurred since 1998.
Furthermore, the 3H-activity in the Meuse exceeded the target value (10 Bq⋅L-1) in ten out of thirteen samples taken. However the yearly average (15 Bq⋅L-1) is within range of previous years.
The Dutch monitoring program deviates from the recommendations of the European union, mainly concerning the measurement of drinking water, milk and food.
Tabel S1: Overzicht van de resultaten in 2002. Table S1: Summary of the results in 2002.
Matrix Parameter Location Values Frequency
(per year)
Air dust (1) Gross α 1 0.05 mBq·m-3 53
Gross β 1 0.432 mBq·m-3 53 7Be 1 3.210 mBq·m-3 53 137Cs 1 <0.002 mBq·m-3(2) 53 210Pb 1 0.486 mBq·m-3 53 Deposition (3) Gross α 1 20.6 Bq·m-2 12 Gross β 1 97 Bq·m-2 12 3H 1 <1630 Bq·m-2 (4) 12 7Be 1 1510 Bq·m-2 53 134Cs 1 <0.1 Bq·m-2(2) 53 137Cs 1 <0.1 Bq·m-2(2) 53 210Pb 1 125 Bq·m-2 53 210Po 1 7.5 Bq·m-2 12
Surface water (1) Residual β 3 0.030-0.114 Bq·L-1 13
3H 3 4.5-15.4 Bq·L-1 6 or 13 (5) 137Cs 4 10-22 Bq·kg-1 6, 13 or 53 (5) Seawater (1) Gross α 8 0.211-0.438 Bq·L-1 4, 11 or 13 (5) Residual β 8 0.063-0.148 Bq·L-1 4, 11 or 13 (5) 3H 8 0.8-5.0 Bq·L-1 4 or 13 (5) 90Sr 4 <0.001-0.004 Bq·L-1 4 or 13 (5) 137Cs 5 6-10 Bq·kg-1 1, 3 or 4 (5) 210Po 5 80-110 Bq·kg-1 1, 3 or 4 (5) Food (6, 7)
Various kinds of honey 137Cs - n.d. (8) 97 (0) (9)
Heather honey 137Cs - 28-327 Bq·kg-1 19 (19) (9)
Powdered milk 137Cs - 6-33 Bq·kg-1 80 (9) (9)
Game and poultry 137Cs - 28 and 69 Bq·kg-1 95 (2) (9)
(1) = Yearly average is shown.
(2) = Detection limit of individual measurement is shown. (3) = Yearly total is shown.
(4) = Yearly total based on ten detection limits and two measured values. (5) = Frequency is depending on location.
(6) = Given range represents values of individual samples.
(7)= Samples were analysed for 134Cs as well, but it was not detectable. (8) = Not detectable.
1.
Introduction
Levels of radioactive nuclides of natural origin, such as 40K and daughters from the uranium and thorium series may be enhanced as a result of human activities, e.g. emissions from factories processing ores. Man-made radionuclides are found in the environment due to, for example, nuclear weapons tests or discharges from nuclear installations. It is advisable to monitor radiation in the environment to provide knowledge of levels of radiation under normal circumstances and to look out for any abnormalities. In this report results are presented of radioactivity measurements in the environment in the Netherlands. The aim of this report is threefold. Firstly, it presents a survey of measurements on radioactivity in the Dutch environment under normal circumstances in 2002. Secondly, it is aimed at determining compliance of monitoring programs in the Netherlands with the EU recommendation and at reporting omissions. Thirdly, it is the Dutch national report on radioactivity in the
environment to the EU and to other Member States.
The definition used in this report for the residual β-activity is the total β-activity (gross β-activity) minus the β-activity of 40K.
The results will, in general, be presented in graphs and tables with a minimum amount of text. More detailed tables are presented in Appendix A.
Chapters 2 to 8 have been subdivided according to the structure of the Recommendation on the Application of Article 36 of the Euratom Treaty [1], and give the results of measurements for various environmental compartments. In chapter 9 general conclusions are presented.
2.
Airborne particles
The 2002 monitoring program for determining radioactive nuclides in air dust is given in
Table 2.1. The sampling was done on the RIVM premises in Bilthoven. Air dust samples for
the measurement of gross α, gross β and γ-emitters were collected weekly with a High Volume Sampler (HVS). A detailed description of sampling, sample treatment and the analytical method is given in previous reports [2, 3, 4].
Table 2.1: Monitoring program in 2002 for the determination of radioactive nuclides in air dust.
Matrix Location Parameter Sample Sample Analysis
period volume frequency
Air dust Bilthoven gross α, gross β week 500 m3 (1) weekly
Bilthoven γ-emitters (2) week 50000 m3 weekly
(1) A sub sample of 1% from the filter through which about 50000 m3 is sampled. (2) γ-spectroscopic analysis of specific γ-emitting nuclides.
2.1
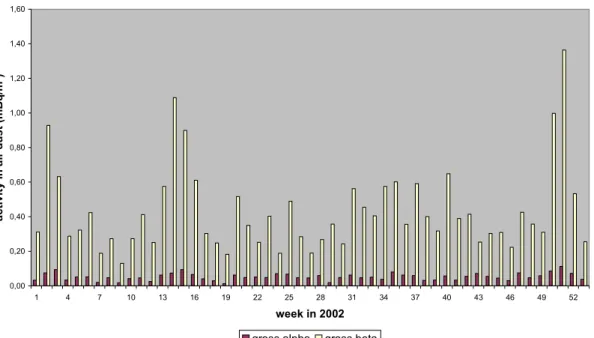
Gross α- and β-activity
The weekly results of gross α- and β-activity concentrations in air dust are given in Figure 2.1 and Table A1 (see Appendix A). Due to large uncertainties caused by variations in dust thickness on the filters, gross α-activity concentrations in air dust should be regarded as indicative values [5]. The period between sampling and analysis is 5 to 10 days, which is long compared to the decay time of the short-lived decay products of 222Rn and 220Rn. This is to ensure that these naturally occurring decay-products do not contribute to the measured α- and β-activity concentrations.
Figure 2.1: Weekly results of gross α- and β-activity concentrations of long-lived nuclides in air dust sampled at RIVM in 2002.
0,00 0,20 0,40 0,60 0,80 1,00 1,20 1,40 1,60 1 4 7 10 13 16 19 22 25 28 31 34 37 40 43 46 49 52 week in 2002 a c tiv it y in a ir dus t ( m B q /m 3 )
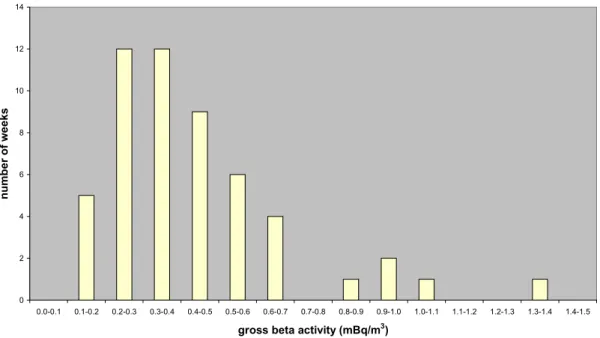
The frequency distributions of gross α-activity and gross β-activity concentrations in air dust are given in Figures 2.2 and 2.3, respectively.
Figure 2.2: Frequency distribution of gross α-activity concentration of long-lived nuclides in air dust collected weekly at RIVM in 2002. Mean concentration is 0.05 (SD=0.02) mBq⋅m-3. SD is the standard deviation and illustrates the variation in weekly averages during the year.
Figure 2.3: Frequency distribution of gross β-activity concentration of long-lived nuclides in air dust collected weekly at RIVM in 2002.
Mean concentration is 0.432 ± 0.004 (SD=0.2) mBq⋅m-3. 0 5 10 15 20 25 0.00-0.02 0.02-0.04 0.04-0.06 0.06-0.08 0.08-0.10 0.10-0.12 0.12-0.14 0.14-0.16 0.16-0.18 0.18-0.20
gross alpha activity (mBq/m3)
n u m b e r o f w eeks 0 2 4 6 8 10 12 14 0.0-0.1 0.1-0.2 0.2-0.3 0.3-0.4 0.4-0.5 0.5-0.6 0.6-0.7 0.7-0.8 0.8-0.9 0.9-1.0 1.0-1.1 1.1-1.2 1.2-1.3 1.3-1.4 1.4-1.5
gross beta activity (mBq/m3)
n u m b e r o f w eeks
Figure 2.4: Yearly averages of gross α- and gross β-activity concentration of long-lived nuclides in air dust from the outset of the respective monitoring campaigns. The high level in 1986 was caused by the accident at the Chernobyl nuclear power plant.
The yearly averages of the gross α- and β-activity concentrations of long-lived nuclides in 2002 are within the range of the results from the period 1992-2001 [6].
Figure 2.4 shows a change in the activity concentrations in 1987. This is caused by an
alteration in the measuring technique since mid 1986 [7]. Due to this alteration in measuring technique gross α data came available. The year 1992 was the start of yet a different sampling procedure (sampling of air dust with a High Volume Sampler) and sample treatment which resulted in another change in the activity concentrations [8]. The results between mid 1986 and 1992 are underestimates due to the different sampling procedure and sample treatment.
2.2
γ-Emitting nuclides
The detection limits for the nuclides considered in the gammaspectroscopic analysis of the HVS-samples are given in Table A2. The only nuclides that could be detected were 7Be and 210Pb (Table A3, Figure 2.5, 2.6 and 2.7). Since late 1999 the detection limit of 137Cs is higher (2.0 µBq⋅m-3) than during 1991-1999 (0.1 µBq⋅m-3), due to a different detector set-up.
The behaviour of 7Be in the atmosphere has been studied world-wide [9, 10, 11, 12, 13, 14, 15]. Natural 7Be (half-life 53.3 days) is formed by spallation reactions of cosmogenic radiation with atmospheric nuclei, such as carbon, nitrogen and oxygen resulting in the formation of BeO or Be(OH)2 molecules. Approximately 70% of 7Be is produced in the stratosphere, with the remaining 30% being produced in the troposphere. A residence time is estimated at about a year in the stratosphere and about six weeks in the troposphere. Most of the 7Be produced in the stratosphere does not reach the troposphere except during spring when seasonal thinning of the tropopause takes place at midlatitudes, resulting in air exchange between stratosphere and troposphere. In the troposphere 7Be rapidly associates mainly with submicron-sized aerosol particles. Gravitational settling and precipitation
0,0 0,1 0,2 0,3 0,4 0,5 0,6 0,7 0,8 0,9 1,0 1983 1984 1985 1986 1987 1988 1989 1990 1991 1992 1993 1994 1995 1996 1997 1998 1999 2000 2001 2002 year acti vi ty i n ai r dust (m Bq/ m 3 )
gross alpha gross beta
processes accomplish transfer to earth’s surface. Seasonal variations in the concentration of 7Be in surface air is influenced by the following main atmospheric processes: wet and dry deposition, mass exchange between stratosphere and troposphere, vertical transport in the troposphere and horizontal transport of air masses from the subtropics and midlatitudes into the tropics and polar regions.
The red line in Figure 2.5 shows the seasonal variation of the 7Be-activity concentration, with peaks during the spring and summer periods, reflecting the seasonal variations in the transport rate of air from stratosphere to troposphere. Figure 2.5 further shows the influence of the solar cycle. The maximum at 1997 and the minimum at 2000-2002 are consistent with the solar minimum (measured by radio flux and sunspot count) of 1997 and the solar maximum of 2000-2002 [16]. Geomagnetic storms, a result of solar activities, are affected by the 11-year solar cycle. In the summer of 1991 two severe geomagnetic storms caused a significant world-wide disturbance of earth’s geomagnetic field. This resulted in a
considerable decrease in cosmogenic radiation, unprecedented in at least the previous four decades [17]. The absence of a 1991 summer peak in the 7Be-activity concentration can be explained by the decrease in cosmogenic radiation.
Figure 2.5: Weekly averaged activity concentrations (blue) of 7Be in air dust at RIVM in 1991-2002. The red line represents a moving average of 13 weeks. Yearly average for 2002 is 3210 ± 40 (SD=1100) µBq⋅m-3.
The concentrations found for 7Be in 2002 fit in the pattern described above.
The nuclide 137Cs (half-life 30.2 years) is of anthropogenic origin. The two main sources of 137Cs in the environment are nuclear weapons tests and the Chernobyl accident. Nowadays resuspension of already deposited activity is the main source of airborne 137Cs-activity.
Figure 2.6 shows a peak during May 1992. During the same period several wildfires occurred
near the Chernobyl area [18]. The level of airborne 137Cs-activity increased ten times in the 30-km exclusion zone around Chernobyl. It is plausible that the airborne 137Cs was
0 1000 2000 3000 4000 5000 6000 7000 8000 9000 10000 year 7Be-acti vi ty ( µ Bq /m 3) 1992 1993 1994 1995 1996 1997 1998 1999 2000 2001 2002 1991
transported to Western Europe due to the weather conditions in the same period, dry and a strong eastern wind [19]. On the 29th of May 1998 an incident occurred at Algeciras (Spain), an iron foundry melted a 137Cs-source concealed in scrap metal [20]. As a result elevated levels of airborne 137Cs-activity were measured in France, Germany, Italy and Switzerland during late May and early June. Figure 2.6 shows a slightly elevated level of 137Cs-activity (second peak) around the same period (29th of May until 5th of June 1998). Such slightly elevated levels are not uncommon as can be seen in Figure 2.6. These elevations may be related to resuspension of already deposited dust especially during a strong wind from the continent [20].
Figure 2.6: Weekly averaged activity concentrations of 137Cs in air dust at RIVM in
1991-2002. In 2002 all measurements were below the detection limit. The detection limit was higher than during 1991-1999, due to a different detector set-up.
The primary source of atmospheric 210Pb (half-life 22.3 years) is the decay of 222Rn exhaled from continental surfaces. Therefore the atmospheric concentration of 210Pb over the
continental areas is in general higher than that over the oceanic ones (222Rn exhalation from the ocean is 1000 times less than that from the continents). The reported reference value of 210Pb in air dust is 500 µBq⋅m-3 [21]. In the atmosphere this radionuclide is predominantly associated with submicron-sized aerosols [22, 23]. The mean aerosol (carrying 210Pb) residence time in the troposphere is approximately 5 days [24].
Other sources of 210Pb in air dust are volcanic activity and industrial emissions [25, 26, 27, 28, 29]. Industrial emissions are discharged by power plants using fossil fuels, fertiliser and phosphorus industries, and as exhaust gasses of traffic. In the Netherlands the emission of power plants is only of local importance regarding 210Pb deposition. The emission by other industries contributes a significant part of the yearly total 210Pb deposition [27]. Volcanic eruptions bring U-decay products in the atmosphere like 226Ra, 222Rn, 210Pb and 210Po. Beks et al. [27] estimate that volcanoes contribute 60 TBq⋅year-1 to the atmospheric 210Pb stock. If the volcanic deposition is evenly distributed world-wide, the contribution to the yearly total 210Pb deposition would be negligible.
0 2 4 6 8 10 12 14 16 year 137 Cs-acti v it y (µ Bq/ m 3) 1992 1993 1994 1995 1996 1997 1998 1999 2000 2001 2002 1991
Figure 2.7: Weekly averaged activity concentrations of 210Pb in air dust at RIVM in 1991-2002. Yearly average for 2002 is 486 ± 9 (SD=500) µBq⋅m-3.
Except for the higher concentration of 210Pb during week 45 (31st ofOctober until 8th of November) the results do not differ significantly from those found in 1991-2001. Unusual values might be explained by natural phenomena like an explosive volcanic eruption, Saharan dust and resuspension of (local) dust. The unusual value of week 45 (3000 ± 300 µBq⋅m-3) can not be explained by these natural sources as is shown below. On the 26th of October the Etna started with the biggest explosive eruption in all of Europe of the last hundreds years [30, 31, 32]. Considering the direction of the plume (mainly south or east) during that period it is unlikely for the emitted 210Pb to have been transported to the Netherlands.
On the 27th of October the most violent storm in twelve years passed over the Netherlands. With wind speeds up to 148 km⋅h-1 [33] loose soil could be resuspended in the air, which might contribute to the 210Pb concentration in air. However, no elevated levels of
submicron-sized aerosols (PM10) were measured during that period by the LML (Landelijk Meetnet Luchtkwaliteit) [34] which suggests that no significant resuspension of soil occurred. Another possible source of 210Pb is Saharan dust, as reported elsewhere [35, 36, 37].
Considering the absence of elevated levels of submicron-sized aerosols (as measured by the LML) it seems unlikely that a considerable amount of Sahara dust was present in the air during week 45. 0 500 1000 1500 2000 2500 3000 3500 year 210 P b -acti v it y (µ Bq/ m 3) 1992 1993 1994 1995 1996 1997 1998 1999 2000 2001 2002 1991
3.
Deposition
The 2002 monitoring program for determining radioactive nuclides in deposition is given in
Table 3.1. Sampling was done on the RIVM premises in Bilthoven. Samples were collected
weekly for γ-emitters and monthly in case of gross α, gross β, 3H and 210Po.
Table 3.1: The 2002 monitoring program for the determination of radioactive nuclides in deposition.
Matrix Location Parameter Sample Sample Analysis
period volume frequency
Deposition Bilthoven γ-emitters (1) week variable weekly
Bilthoven gross α, gross β, and 210Po month variable monthly
Bilthoven 3H month variable quarterly
(1) γ-spectroscopic analysis of specific γ-emitting nuclides.
3.1
Gross α- and β-activity
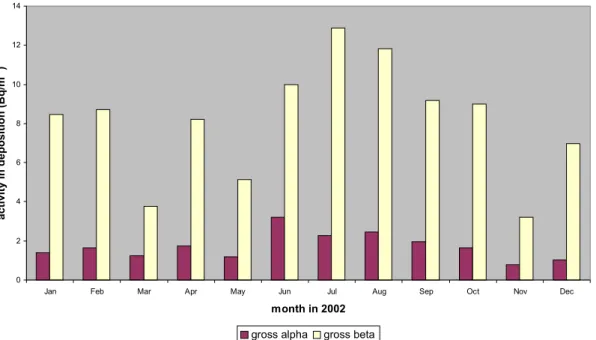
The monthly deposited gross α- and gross β-activities of long-lived nuclides are given in
Figure 3.1 and Table A4. The yearly total deposition of gross α and gross β was 20.6 ± 0.9
and 97 ± 2 Bq·m-2, respectively. These values do not differ significantly from those measured since 1987, as illustrated in Figure 3.2 and Table A5. The measuring technique for gross α and gross β was changed around mid 1986 [38], which makes it difficult to compare data before 1986 with data after 1986 [39].
Figure 3.1: Monthly deposited gross α- and gross β-activity of long-lived nuclides at RIVM in 2002. 0 2 4 6 8 10 12 14
Jan Feb Mar Apr May Jun Jul Aug Sep Oct Nov Dec
month in 2002 act ivit y in deposit ion ( B q/m 2 )
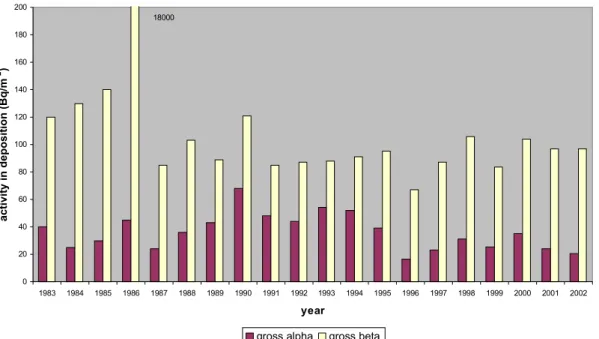
Figure 3.2: Yearly gross α- and gross β-activity of long-lived nuclides deposited at RIVM from 1983 to 2002 (see Table A5). The 1986 level resulted from the accident at the Chernobyl nuclear power plant.
The monthly deposition of 3H is given in Table A4. In 2002 less then 1630 Bq·m-2 of 3H was deposited. Ten out of twelve measurements were below the detection limit. Therefore detection limits were used for the calculation of the yearly total. From 2001 onward single analyses are carried out instead of duplicate. Together with a less stable background this resulted in a higher detection limit for 3H in 2001 than in previous years. From 2002 onward measurements are carried out on a new Liquid Scintillation Counter. Figure 3.3 shows the decay of 3H after the end of the atmospheric nuclear weapons tests in the seventies.
Figure 3.3: Yearly deposition of 3H at RIVM in the period 1970-2002. 0 20 40 60 80 100 120 140 160 180 200 1983 1984 1985 1986 1987 1988 1989 1990 1991 1992 1993 1994 1995 1996 1997 1998 1999 2000 2001 2002 year act ivit y in deposit ion ( B q/m 2 )
gross alpha gross beta
18000 0 2000 4000 6000 8000 10000 12000 14000 1970 1972 1974 1976 1978 1980 1982 1984 1986 1988 1990 1992 1994 1996 1998 2000 2002 year 3 H-act ivit y in deposit ion ( B q/m 2 )
The monthly α-spectroscopy results for 210Po are given in Table A6. The results for previous years are given in Table A7. In 2002 7.5 ± 1.0 Bq·m-2 of 210Po was deposited. Because no 210Po was detected in the October deposition, the detection limit was used for the October contribution to the year total.
3.2
γ-Emitting nuclides
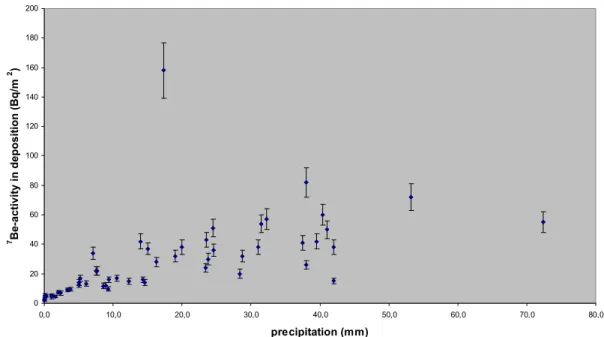
Detectable quantities of the naturally occurring nuclides 7Be and 210Pb were found, with yearly total depositions of 1510 ± 30 and 125 ± 5 Bq·m-2, respectively. The nuclides 134Cs and 137Cs were not found (detection limit is 0.1 Bq·m-2 for both nuclides). The weekly results for deposition of 7Be and 210Pb are given in Table A8. The results for previous years are given in
Table A7. The correlation between the amount of precipitation and the deposition of 7Be (Figure 3.4) is less clear than in previous years [6]. A deposited 7Be-activity as high as found in week 43 (158 ± 19 Bq⋅m-2) has not occurred since 1998 [40]. However, during 1998 the 7Be-activities correlated with a large amount of precipitation (78–125.5 mm), where in 2002 the precipitation was relatively low (17.3 mm).
Figure 3.4: The weekly deposition of 7Be at RIVM in 2002 versus precipitation.
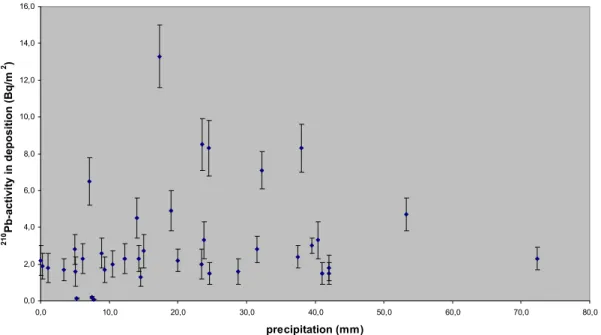
The correlation between the amount of precipitation and the deposition of 210Pb is even less clear (see Figure 3.5).
0 20 40 60 80 100 120 140 160 180 200 0,0 10,0 20,0 30,0 40,0 50,0 60,0 70,0 80,0 precipitation (mm) 7 Be-act ivit y in deposit ion ( B q/m 2 )
Figure 3.5: The weekly deposition of 210Pb at RIVM in 2002 versus precipitation. 0,0 2,0 4,0 6,0 8,0 10,0 12,0 14,0 16,0 0,0 10,0 20,0 30,0 40,0 50,0 60,0 70,0 80,0 precipitation (mm) 210 Pb-act ivit y in deposit ion ( B q/m 2 )
4.
National Radioactivity Monitoring Network
This chapter presents data on gross α-activity concentrations, artificial β-activity concentrations in air and ambient dose equivalent rates as measured by the National
Radioactivity Monitoring Network (Nationaal Meetnet Radioactiviteit). The data on gross α and artificial β differ in sample size, sampling frequency and analytical procedures from those given in the previous chapter. The difference between the NMR data and those mentioned in the previous chapter is mainly due to the contribution of short-lived natural radionuclides (radon daughters).
The NMR consists of 14 aerosol monitors for determining gross α- and artificial β-activity concentrations and 163 ambient dose equivalent rate monitors [41]. The 14 sites with an aerosol monitor are also equipped with a dose equivalent rate monitor. These 14 dose equivalent rate monitors are differently placed from the 163 dose equivalent rate monitors with regard to height (3.5 meter versus 1 meter above ground level) and surface covering. Therefore, results can differ between the two types of monitors [42]. Hence, these 14 dose equivalent rate monitors are not taken into account for calculating the yearly averaged ambient dose equivalent. The reported artificial β-activity concentrations are calculated from the difference between the measured gross β-activity concentration and the natural gross β-activity derived from the measured gross α-activity concentration.
The 14 aerosol FAG FHT59S monitors were replaced by 14 new Berthold BAI 9128 monitors during the second half of 2002. Due to differences in detection method, filter transport,
calibration nuclides and algorithms the results for the activity concentrations are not exactly the same. By running both monitors simultaneously at the same location, the measured gross α-activity concentration was compared. On average the Berthold monitor reports about 20% higher values than the FAG monitor [43]. The estimated uncertainty for both monitors is about 20%. Hence, the difference is within the estimated uncertainty. No correction is applied for the difference in the gross α-activity concentration between the Berthold and FAG
monitor.
The data presented in this chapter are based on ten-minute measurements. Averages over the year are calculated per location using daily averages from the ten-minute measurements (Tables A9 and A10). The data on external radiation, expressed in ambient dose equivalent, contain a systematic error because of an overestimation of the cosmogenic dose rate and an underestimation of the terrestrial dose rate. Based upon earlier research [42, 44] it is assumed that the ambient dose equivalent rate is overestimated by 5 to 10 nSv.h-1. However, NMR data are not corrected for these response errors.
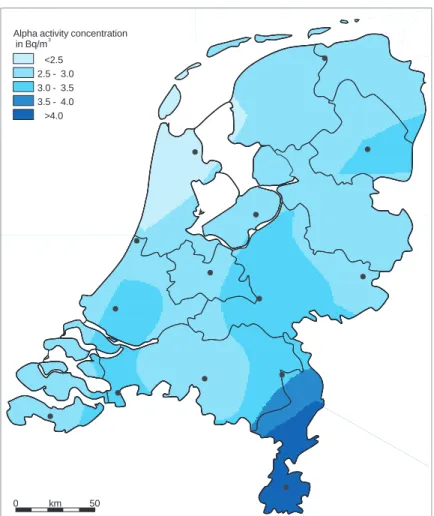
In Figures 4.1 and 4.3, an impression has been constructed of the spatial variation in the yearly averages of the NMR data using RIVM’s Geographical Information System (GIS). A non-linear interpolation algorithm (and extrapolation using a grid) was applied to calculate values in between the NMR stations.
Alpha activity concentration in Bq/m3 <2.5 2.5 - 3.0 3.0 - 3.5 3.5 - 4.0 >4.0
Alpha activity concentration in Bq/m3 <2.5 2.5 - 3.0 3.0 - 3.5 3.5 - 4.0 >4.0 0 km 50
Figure 4.1: Spatial variation in the average gross α-activity concentration in air dust in 2002. The dots represent the locations of the aerosol monitors.
Figure 4.2: Yearly averages for gross α-activity concentration.
0.0 0.5 1.0 1.5 2.0 2.5 3.0 3.5 4.0 1990 1991 1992 1993 1994 1995 1996 1997 1998 1999 2000 2001 2002 year al p h a acti v it y co n cen tr ati o n (B q /m 3 )
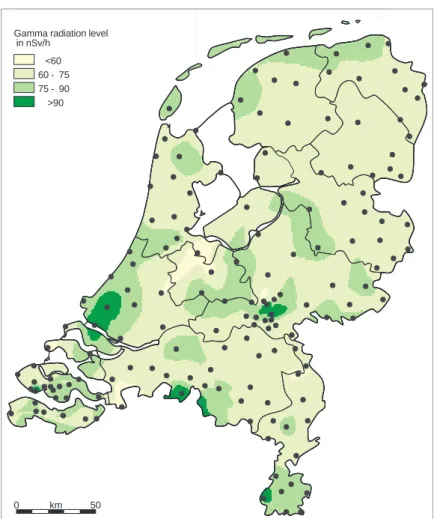
Gamma radiation level in nSv/h <60 60 - 75 75 - 90 >90 Gamma radiation level in nSv/h <60 60 - 75 75 - 90 >90 0 km 50
Figure 4.3: Spatial variation in the average ambient dose equivalent rate in 2002. The dots represent the locations of the dose equivalent rate monitors.
Figure 4.4: Yearly averages of the ambient dose equivalent rate.
71 72 73 74 75 76 77 1996 1997 1998 1999 2000 2001 2002 year am b ien t d o se eq u ival en t r a te (n Sv/ h )
Figures 4.2 and 4.4 present the yearly averages of gross α-activity concentration and ambient
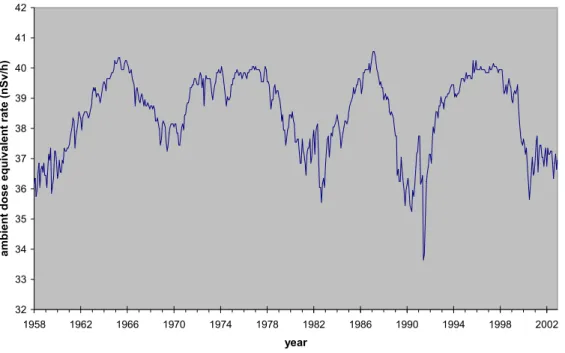
dose equivalent rate from 1990 to 2002, respectively. The yearly averaged gross α-activity concentration in air dust was 3.1 Bq·m-3 (based on the yearly averages of the 14 measurement locations). This value does not differ significantly from previous years. The yearly average of the calculated artificial β-activity concentration does not deviate significantly from zero. Since 1996 the analysis of the ambient dose equivalent rate has been based on the set of 163 stations. The yearly averaged ambient dose equivalent rate in 2002 is calculated using 156 stations. The remaining 7 stations were not operational. For the ambient dose equivalent rate the yearly averaged measured value was 73 nSv·h-1. It is assumed that this value is an overestimate of 5 to 10 nSv.h-1. Figure 4.5 shows the influence of the 11-year solar cycle on the cosmogenic contribution to the ambient dose equivalent rate. The decrease in the ambient dose rate equivalent (as given by the NMR) during 1996 to 2002 (Figure 4.4) might be related to the decrease in the cosmogenic contribution.
Figure 4.5: Cosmogenic contribution to the ambient dose equivalent rate (at sea level), influenced by the solar cycle. Location 51° 26’ north latitude and 3° 43’ eastern longitude, air pressure 1019 hPa. Figure derived from data supplied by Office of Aerospace Medicine [45]. 32 33 34 35 36 37 38 39 40 41 42 1958 1962 1966 1970 1974 1978 1982 1986 1990 1994 1998 2002 year am b ien t d o se eq u ival en t r a te (n Sv/ h )
5.
Surface water and seawater
5.1
Introduction
The Institute for Inland Water Management and Waste Water Treatment (RIZA) and the National Institute for Coastal and Marine Management (RIKZ) regularly monitor the concentration of a number of radioactive nuclides in surface water and seawater. The
monitoring program presented here forms only part of the total monitoring program. A more detailed description of the monitoring program, underlying strategy and results of
measurements on radioactivity in Dutch waters are reported elsewhere [46, 47, 48].
The locations presented in this report have been chosen to represent the major inland waters and seawater. The 2002 monitoring program is shown in Tables 5.1, 5.2 and Figure 5.1. Radioactive nuclides were determined in water and suspended solids. The samples were collected at random times.
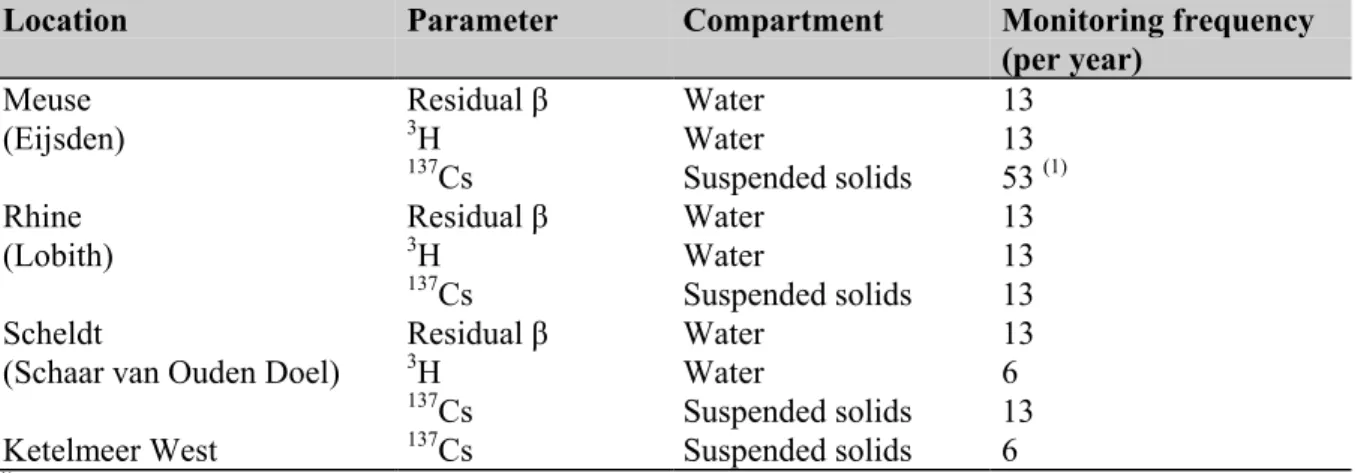
Table 5.1: Monitoring program for the determination of radioactive nuclides in surface water in 2002.
Location Parameter Compartment Monitoring frequency
(per year)
Meuse Residual β Water 13
(Eijsden) 3H Water 13
137Cs Suspended solids 53 (1)
Rhine Residual β Water 13
(Lobith) 3H Water 13
137Cs Suspended solids 13
Scheldt Residual β Water 13
(Schaar van Ouden Doel) 3H Water 6
137Cs Suspended solids 13
Ketelmeer West 137Cs Suspended solids 6
(1) Data were available for 52 out of 53 samples taken.
The results for surface water are presented in Tables A11 and A12 and in Figures 5.2 to 5.7. The results for seawater are presented in Tables A13 and A14 and in Figures 5.8 to 5.19.
The samples were analysed at the RIZA laboratory in Lelystad. The radioactive nuclides were determined according to standard procedures [47] and [49]. In the Netherlands target values are in use for radioactive materials in surface water, which are given in the Fourth memorandum on water management (“Vierde Nota waterhuishouding”) [50]. The yearly averages are
Table 5.2: Monitoring program for the determination of radioactive nuclides in seawater in 2002.
Area Location Parameter Compartment Monitoring
frequency (per year)
Coastal area Noordwijk 2 (1) Gross α Water 4
(KZ) Residual β Water 4
3H Water 4
137Cs Suspended solids 1 (2)
210Po Suspended solids 1 (2)
Southern North Sea Noordwijk 70 (1) Gross α Water 4
(ZN) Residual β Water 4
3H Water 4
90Sr Water 4
Central North Sea Terschelling 235 (1) Gross α Water 4
(CN) Residual β Water 4
3H Water 4
90Sr Water 4
Delta Coastal Waters Schouwen 10 (1) Gross α Water 11 (3)
(VD) Residual β Water 11 (3)
3H Water 4
90Sr Water 4
Westerscheldt Vlissingen Boei Gross α Water 13 (4)
(WS) Residual β Water 13 (4)
3H Water 13 (4)
90Sr Water 13 (4)
137Cs Suspended solids 4
210Po Suspended solids 4
Eems-Dollard Huibergat Oost Gross α Water 4
(ED) Residual β Water 4
3H Water 4
Bocht van Watum 137Cs Suspended solids 4
210Po Suspended solids 4
Wadden Sea West Marsdiep Noord Gross α Water 4
(WW) Residual β Water 4
3H Water 4
Doove Balg West 137Cs Suspended solids 1 (2)
210Po Suspended solids 1 (2)
Wadden Sea East Dantziggat Gross α Water 4
(WO) Residual β Water 4
3H Water 4
137Cs Suspended solids 3 (2)
210Po Suspended solids 3 (2)
(1) Number indicates distance from shore. For example Noordwijk 2 means Noordwijk 2 km offshore. (2) Normally 4 times per year. Not all measurements could be performed due to insufficient amount of collected suspended solids.
(3) Normally 12 times per year. One sample was not taken. (4) Normally 12 times per year.
Sea water areas:
CN = Central North Sea
ED = Eems-Dollard
WO = Wadden Sea East
WW = Wadden Sea West
ZN = Southern North Sea
KZ = Coastal area
VD = Delta Coastal Waters
WS = Westerscheldt
Fresh water areas:
KM = Ketelmeer R = Rhine M = Meuse S = Scheldt 1 = Terschelling 235 2 = Terschelling 135 3 = Terschelling 100 4 = Huibergat Oost
5 = Bocht van Watum
6 = Dantziggat
7 = Doove Balg West
8 = Marsdiep Noord 9 = Ketelmeer West 10 = Noordwijk 2 11 = Noordwijk 10 12 = Noordwijk 70 13 = Schouwen 10 14 = Vlissingen Boei
15 = Schaar van Ouden Doel
16 = Lobith
17 = Eijsden
Noordwijk 2 means Noordwijk 2 km offshore.
Figure 5.1: Overview of monitoring locations for the monitoring program in surface water and in seawater. Terschelling 135 km offshore and Terschelling 100 km offshore were the old monitoring locations for the Central North Sea during 1989 and 1988-1994 (except 1989), respectively. Terschelling 235 km offshore is the monitoring location for the Central North Sea from 1995 and onwards. Noordwijk 10 km offshore was the old monitoring location for the Coastal area during 1988-1998. Noordwijk 2 km offshore is the monitoring location for the Coastal area from 1999 and onwards [47].
5.2
The results for surface water
The general monitoring strategy for surface water is to monitor the inland and border crossing waters of the Netherlands. Therefore the Meuse, Rhine and Scheldt are monitored at Eijsden, Lobith and Schaar van Ouden Doel, respectively.
Figure 5.2: The residual β-activity concentration in 2002 for the Meuse, Rhine and Scheldt, with yearly averages of 30, 38 and 114 mBq⋅L-1, respectively. Averaged values are shown in case of multiple measurements per month. The dotted line represents the target value [50].
Figure 5.3: Yearly averaged residual β-activity concentrations.
The yearly averaged concentrations of residual β in 2002 are within the range of those in previous years. The averaged residual β-concentrations are below the target value of
200 mBq⋅L-1. Residual β in the Scheldt shows a change in the trend since 1994. This is caused by a change in measuring technique, which only applies to salt and brackish water [47]. Therefore, no change in trend is shown for the Meuse and the Rhine.
0 50 100 150 200 250
Jan Feb Mar Apr May Jun Jul Aug Sep Oct Nov Dec
month in 2002 re s idua l be ta a c tiv it y ( m B q /l)
Meuse Rhine Scheldt
0 50 100 150 200 250 300 350 400 450 1978 1979 1980 1981 1982 1983 1984 1985 1986 1987 1988 1989 1990 1991 1992 1993 1994 1995 1996 1997 1998 1999 2000 2001 2002 year re s idua l be ta a c tiv it y ( m B q /l)
Figure 5.4: The 3H-activity concentration in 2002 for Meuse, Rhine and Scheldt, with yearly averages of 15.4, 4.5 and 6.9 Bq⋅L-1, respectively. Averaged values are shown in case of multiple measurements per month.
Figure 5.5: Yearly averaged 3H-activity concentrations.
The 3H-activity in the Meuse exceeded the target value (10 Bq⋅L-1) 10 out 13 times. The
elevated levels of 3H in the Meuse (Figure 5.4) could originate from the nuclear power plants Tihange (Belgium) or Chooz (France). The yearly averaged concentrations of tritium in 2002 are within the range of those in previous years. In 2002 the averaged tritium concentration in the Meuse (15 Bq·L-1) is above the target value of 10 Bq·L-1.
0 5 10 15 20 25 30 35 40
Jan Feb Mar Apr May Jun Jul Aug Sep Oct Nov Dec
month in 2002 3 H -a c tiv it y ( B q/l)
Meuse Rhine Scheldt
0,0 5,0 10,0 15,0 20,0 25,0 30,0 35,0 1978 1979 1980 1981 1982 1983 1984 1985 1986 1987 1988 1989 1990 1991 1992 1993 1994 1995 1996 1997 1998 1999 2000 2001 2002 year 3 H -a c tiv it y ( B q/l)
Figure 5.6: The 137Cs-activity concentration in suspended solids in 2002 for the Meuse, Rhine, Scheldt and Ketelmeer-West with yearly averages of 10, 18, 12 and 22 Bq⋅kg-1, respectively. Averaged values are shown in case of multiple measurements per month.
Figure 5.7: Yearly averaged 137Cs-activity concentrations in suspended solids. Data on Ketelmeer-West are available since 1995.
The yearly averaged concentrations of 137Cs in 2002 are within the range of those in previous years. The averaged 137Cs-concentrations are below the target value of 40 Bq·kg-1.
The yearly averaged concentration of 137Cs is consistently higher at Ketelmeer-West compared to that at Lobith. This indicates an extra contribution besides the one currently originating from the Rhine, which can be explained by the following. Ketelmeer serves as a sink for Rhine sediment and thus contains a large amount of sediment deposited in previous years. A considerable amount of sediment, containing 137Cs originating from the Chernobyl accident, resuspends in the relatively shallow Ketelmeer due to wind influences [51].
0 10 20 30 40 50 60
Jan Feb Mar Apr May Jun Jul Aug Sep Oct Nov Dec
month in 2002 137 C s -acti v it y (B q /kg )
Meuse Rhine Scheldt Ketelmeer-West
0 10 20 30 40 50 60 1992 1993 1994 1995 1996 1997 1998 1999 2000 2001 2002 year 137 C s -acti v it y (B q /kg )
5.3
The results for seawater
Figure 5.8: The gross α-activity concentration in seawater in 2002. The yearly averages for the Coastal area (KZ), Southern North Sea (ZN), Central North Sea (CN), Delta Coastal Waters (VD), Westerscheldt (WS), Eems-Dollard (ED), Wadden Sea West (WW) and Wadden Sea East (WO) are 438, 255, 283, 211, 346, 290, 405 and 425 mBq⋅L-1, respectively.
Figure 5.9: Yearly averaged gross α-activity concentrations.
Gross α and residual β are indicative parameters [47]. In the first half of 2000 the background of the measuring equipment was unstable and higher than usual, which resulted in lower results. Therefore yearly averaged concentrations of gross α in 2000 are based on data starting from the end of July 2000. Changes in the trend in the period 1985-1997 are explained
elsewhere [47]. The results of 2002 are within the range of those in the period 1995-2001.
0 100 200 300 400 500 600 700
Jan Feb Mar Apr May Jun Jul Aug Sep Oct Nov Dec
month in 2002 a lpha a c tiv it y ( m B q /l) KZ ZN CN VD WS ED WW WO 0 100 200 300 400 500 600 700 800 1985 1986 1987 1988 1989 1990 1991 1992 1993 1994 1995 1996 1997 1998 1999 2000 2001 2002 year a lpha a c tiv it y ( m B q /l) KZ ZN CN VD WS ED WW WO
Figure 5.10: The residual β-activity concentration in seawater in 2002. The yearly averages for the Coastal area, Southern North Sea, Central North Sea, Delta Coastal Waters,
Westerscheldt, Eems-Dollard, Wadden Sea West and Wadden Sea East are 67, 66, 63, 80, 108, 82, 87 and 148 mBq⋅L-1, respectively.
Figure 5.11: Yearly averaged residual β-activity concentrations.
Residual β shows a change in the trend since 1994. This is caused by a change in measuring technique, which only applies to salt and brackish water [47]. The yearly averaged
concentrations of residual β in 2002 are within the range of those in the period 1994-2001.
0 50 100 150 200 250
Jan Feb Mar Apr May Jun Jul Aug Sep Oct Nov Dec
month in 2002 re s idua l be ta a c tiv it y ( m B q /l) KZ ZN CN VD WS ED WW WO 0 50 100 150 200 250 300 350 400 1985 1986 1987 1988 1989 1990 1991 1992 1993 1994 1995 1996 1997 1998 1999 2000 2001 2002 year re s idua l be ta a c tiv it y ( m B q /l) KZ ZN CN VD WS ED WW WO
Figure 5.12: The 3H-activity concentration in seawater in 2002. The yearly averages for the Coastal area, Southern North Sea, Central North Sea, Delta Coastal Waters, Westerscheldt, Eems-Dollard, Wadden Sea West and Wadden Sea East are 4.4, 3.9, 0.8, 3.9, 5.0, 2.8, 3.3 and 2.8 Bq⋅L-1, respectively.
Figure 5.13: Yearly averaged 3H-activity concentrations.
Nuclear power plants discharge the nuclides 3H and 137Cs. Nuclear fuel reprocessing plants discharge the nuclides 3H and 90Sr. Discharges by the research centre at Doel (Belgium) and the nuclear power plants at Doel and Borssele (the Netherlands) are monitored in the
Westerscheldt (WS). The impact of reprocessing plants at Sellafield (England) and Le Havre (France) is monitored in the Central North Sea (CN) and Southern North Sea (ZN),
respectively [47]. The impact of both sources (nuclear power and reprocessing plants) is monitored indirectly in the Delta Coastal Waters (VD). The yearly averaged concentrations of 3H in 2002 are within the range of those in previous years.
0 1 2 3 4 5 6 7 8 9 10
Jan Feb Mar Apr May Jun Jul Aug Sep Oct Nov Dec
month in 2002 3 H -a c tiv it y ( B q/l) KZ ZN CN VD WS ED WW WO 16.0 0 1 2 3 4 5 6 7 8 9 10 1985 1986 1987 1988 1989 1990 1991 1992 1993 1994 1995 1996 1997 1998 1999 2000 2001 2002 year 3 H -a c tiv it y ( B q/l) KZ ZN CN VD WS ED WW WO
Figure 5.14: The 90Sr-activity concentration in seawater in 2002. The yearly averages for the Southern North Sea, Central North Sea, Delta Coastal Waters and Westerscheldt are 3, 4, <1 and 1 mBq⋅L-1, respectively.
Figure 5.15: Yearly averaged 90Sr-activity concentrations.
The yearly averaged concentrations of 90Sr in 2002 are within the range of those in previous years. 0 2 4 6 8 10 12
Jan Feb Mar Apr May Jun Jul Aug Sep Oct Nov Dec
month in 2002 90 S r-a c tiv it y ( m B q /l) ZN CN VD WS 0 2 4 6 8 10 12 1994 1995 1996 1997 1998 1999 2000 2001 2002 year 90 S r-a c tiv it y ( m B q /l) ZN CN VD WS
Figure 5.16: The 137Cs-activity concentration in suspended solids in seawater in 2002. The yearly averages for the Coastal area, Westerscheldt, Eems-Dollard,Wadden Sea West and Wadden Sea East are 9, 6, 10, 9 and 8 Bq⋅kg-1, respectively. Data were not available in May (KZ and WW), August (KZ, WW and WO) and November (KZ and WW) due to insufficient amount of collected suspended solids.
Figure 5.17: Yearly averaged 137Cs-activity concentrations in suspended solids.
The yearly averaged concentrations of 137Cs in 2002 are within the range of those in previous years. In 2001 data were not available for Wadden Sea West due to insufficient amount of collected suspended solids.
The nuclide 210Po originates from the uranium decay chain and is discharged by the phosphate processing industry and production platforms for oil and gas [47]. Discharges via the main rivers are monitored in the Coastal area (KZ). Discharges by ore and phosphate processing industries in Belgium and the Netherlands are monitored in the Westerscheldt (WS).
0 2 4 6 8 10 12 14 16
Feb May Aug Nov
month in 2002 137 C s -acti v it y (B q /kg ) KZ WS ED WW WO 0 5 10 15 20 25 1996 1997 1998 1999 2000 2001 2002 year 137 C s -acti v it y (B q /kg ) KZ WS ED WW WO
Discharges by Germany, Delfzijl and Eemshaven are monitored in the Eems-Dollard (ED). The impact of these discharges is monitored indirectly in the Wadden Sea (WW and WO) together with activity originating from the North Sea.
Figure 5.18: The 210Po-activity concentration in suspended solids in seawater in 2002. The yearly averages for the Coastal area, Westerscheldt, Eems-Dollard,Wadden Sea West and Wadden Sea East are 110, 80, 97, 110 and 106 Bq⋅kg-1, respectively. Data were not available in May (KZ and WW), August (KZ, WW and WO) and November (KZ and WW) due to
insufficient amount of collected suspended solids.
Figure 5.19: Yearly averaged 210Po-activity concentrations in suspended solids.
The yearly averaged concentrations of 210Po in 2002 are within the range of those in previous years. In 2001 data were not available for Wadden Sea West due to insufficient amount of collected suspended solids.
0 20 40 60 80 100 120 140 160
Feb May Aug Nov
month in 2002 210 Po -acti v it y (B q /kg ) KZ WS ED WW WO 0 20 40 60 80 100 120 140 160 180 1996 1997 1998 1999 2000 2001 2002 year 210 Po -acti v it y (B q /kg ) KZ WS ED WW WO
6.
Water for human consumption
In the Netherlands, water pumping-stations monitor raw input water for 3H-, gross β- and residual β-activity. The monitoring frequency is from once to twenty times per year
depending on the volume of water produced. Typical activities for 3H are 1-10 Bq·L-1. Typical activities for both gross β- and residual β-activity are 0.1-1 Bq·L-1. Since there is almost no 40K present, gross β- and residual β-activities are equal.
The activity of natural nuclides, such as 226Ra and 222Rn, in Dutch drinking water is very low. In 1994 a survey was carried out to determine the radon activity of Dutch water [52]. The average concentration found was 2.2 Bq·L-1 for drinking water produced from groundwater.
7.
Milk
Until 1997 RIVM monitored radioactivity in milk under authority of the Chief Veterinary Inspectorate for Public Health of the Ministry of Health, Welfare and Sport.
Because of the low levels of radioactivity found in the milk samples, the Chief Veterinary Inspectorate for Public Health of the Ministry of Health, Welfare and Sport decided to stop the monitoring program in 1998. This is not in compliance with the Euratom recommendation [1], in which it is recommended to monitor gamma emitters and 90Sr in milk samples taken from dairies.
8.
Food
Radioactivity is measured in food suspected to contain more than the normal activity concentrations. The measurements are performed by the Inspectorate for Health Protection and Veterinary Public Health. Measurements were carried out according to standard procedures [53]. The results are presented in Table 8.1.
8.1
Honey
In total 116 samples of honey were analysed [54]. The activity (sum of 134Cs and 137Cs) was found to be below the set limit of 600 Bq⋅kg-1 [55]. All samples of heather honey contained 137Cs. The activity varied from 28 up to 327 Bq⋅kg-1.
8.2
Powdered Milk
Via the import team 80 samples of powdered milk were offered for analysis. The samples originated from Eastern Europe. Measurable quantities of activity were found in 9 samples, varying from 6 up to 33 Bq⋅kg-1. The samples containing activity originated from Poland. The activity found was below the limit of 370 Bq⋅kg-1.
8.3
Game and poultry
In total 95 samples of game and poultry were analysed. Measurable quantities of activity were found in some samples of game. A sample of deer contained 69 Bq⋅kg-1 and a sample of roe contained 28 Bq⋅kg-1.
8.4
Other products
Some products, amongst which blueberry and chanterelle, were sampled within the scope of
Customs Import Surveillance. Radioactivity was not detected in these products. Table 8.1 Results of analysis of food for 134Cs and 137Cs.
Product Number of
samples
Number of positive samples
134Cs (Bq⋅⋅⋅⋅kg-1) 137Cs (Bq⋅⋅⋅⋅kg-1)
Various kinds of honey 97 0 n.d. n.d.
Heather honey 19 19 n.d. 28-327
Powdered milk 80 9 n.d. 6-33
Game and poultry 95 2 n.d. 28 and 69
9.
Conclusions
In 2002 two unusual levels of radioactivity were found in the Dutch environment. The
activity concentration of 210Pb in air dust during week 45 (3000 ± 300 µBq⋅m-3) is the highest concentration since 1991. A deposited 7Be-activity as high as that of week 43
(158 ± 19 Bq⋅m-2) hasn’t occurred since 1998.
Furthermore, the 3H-activity in the Meuse (yearly average 15 Bq⋅L-1) exceeded the target value (10 Bq⋅L-1) in ten out of thirteen samples taken. No measurements were performed on milk since 1998. This does not comply to the Recommendation on the Application of Article 36 of the Euratom Treaty.
References
[1] EC, 2000. Recommendation of the Commission of the European Communities on the application of Article 36 of the Euratom Treaty. EC Brussels, 2000/473/Euratom. [2] R.M.W.Overwater (ed), 1998. Monitoring of radiation in airdust, deposition and an
overall country milk sample. Results in the Netherlands in 1996. RIVM Bilthoven, Report no. 610056043.
[3] S.T. van Tuinen (ed), 1996. Monitoring of radiation in the atmosphere and a food chain. Results in the Netherlands in 1995. RIVM Bilthoven, Report no. 610056029.
[4] R.B. Tax, P.J.M. Kwakman, A.P.P.A. van Lunenburg and M.H. Tijsmans, 1994. Development of a High Volume Air Sampler for the sensitive detection of γ-emitting radionuclides attached to aerosols. Results obtained in the test period 1991-1992. RIVM Bilthoven, Report no. 610056005.
[5] NEN, 1991. Bepaling van de kunstmatige totale α-, kunstmatige totale β-activiteit en gammaspectrometrie van luchtfilters en berekening van de volumieke activiteit van de bemonsterde lucht. NEN Delft, NVN 5636.
[6] G.J. Knetsch (ed), 2002. Monitoring of radiation in the environment in the Netherlands. Results in 2001. RIVM Bilthoven, Report no. 610056048.
[7] A.C. Koolwijk, F.C.M. Mattern, R.M.S. Drost, A. Ockhuizen, 1988. Onderzoek naar de radioactiviteit in luchtstof te De Bilt. Resultaten over 1986. RIVM Bilthoven, Report no. 248202007.
[8] F.J.Aldenkamp, R.M.S. Drost, A.C. Koolwijk, P.J.M. Kwakman, A.P.P.A. van Lunenburg, A. Ockhuizen, R.B. Tax, M.H. Tijsmans, L.J. de Vries and P.J.M. van Westerlaak, 1993. Milieurapportage 1993 IV. Monitoring of radiation in atmosphere, water and a food chain. Results in the Netherlands in 1992. RIVM Bilthoven,
Report no. 749204014.
[9] S. Sugihara, N. Momoshima, Y. Maeda and S. Osaki, 2000. Variation of atmospheric 7Be and 210Pb depositions at Fukuoka, Japan. IRPA 10th congress, internetsite:
www.irpa.net/irpa10/cdrom/00822.pdf (July 2003).
[10] C. Ródenas, J. Gómez, L.S. Quindós, P.L. Fernández and J. Soto, 1997. 7Be
concentrations in air, rain water and soil in Cantabria (Spain). Appl. Radiat. Isot. 48, 545-548.
[11] S. Talpos and V. Cuculeanu, 1997. A study of the vertical diffusion of 7Be in the atmosphere. J. Environ. Radioactivity 36 (1), 93-106.
[12] K.N. Yu and L.Y.L. Lee, 2002. Measurements of atmospheric 7Be properties using high-efficiency gamma spectroscopy. Appl. Radiat. Isotop. 57, 941-946.
[13] C. Papastefanou and A. Ioannidou, 1995. Aerodynamic size association of 7Be in ambient aerosols. J. Environ. Radioactivity 26, 273-282.
[14] H.W. Feely, R.J. Larsen and C.G. Sanderson, 1989. Factors that cause seasonal variations in 7Be concentrations in surface air. J. Environ. Radioactivity 9, 223-249. [15] C.L. Fogh, J. Roed and K.G. Andersson, 1999. Radionuclide resuspension and mixed
deposition at different heights. J. Environ. Radioactivity 46, 67-75.
[17] R.C.G.M Smetsers and R.O. Blaauboer, 1997. A dynamic compensation method for natural ambient dose rate based on 6 years data from the Dutch Radioactivity Monitoring Network. Radiat. Prot. Dosim. 69 (1), 19-31.
[18] S. I. Dusha-Gudym, 1992. Forest fires on the areas contaminated by radionuclides from the Chernobyl nuclear power plant accident. International Forest Fire News 7. Internetsite: www.fire.uni-freiburg.de (July 2003).
[19] KNMI database, July 2003. Internetsite: www.knmi.nl.
[20] T. Hantke, F.J. Aldenkamp, R.M.W. Overwater en H. Slaper, 1998. De jacht op een 137Cs-wolk in Zuid Europa – “aftermath” van een ongeval in Algeciras. NVS Nieuws 23 (4).
[21] UNSCEAR, 2000. Sources and effects of ionizing radiation. Volume 1: Sources. [22] E.A. Bondietti, C. Papastefanou, C. Rangarajan, 1987. Aerodynamic size associations
of natural radioactivity with ambient aerosols. In: Radon and its Decay Products: Occurrence, Properties and Health Effects, ACS Symp. Ser. No. 331, P.K. Hopke (Ed.), American Chemical Society, Washington DC, 377-397.
[23] T. Suzuki, Y. Maruyama, N. Nakayama, K. Yamada, K. Ohta, 1999. Measurement of 210Po/210Pb activity ratio in size fractionated aerosols from the coast of the Japan sea. Atmospheric Environ. 33, 2285-2288.
[24] T. Tokieda, K. Yamanaka, K. Harada, S. Tsunogai, 1996. Seasonal variations of residence time and upper atmospheric contribution of aerosols studied with Pb-210, Bi-210, Po-210 and Be-7. Tellus, 48B, 690-702.
[25] G. Lambert, P. Bristeau, G. Polian, 1976. Emission and enrichments of Radon daughters from Etna volcano magma. Geophys. Res. Lett. 3 (12), 724-726. [26] J. Sato, T. Doi, T. Segawa, S. Sugawara, 1994. Seasonal variation of atmospheric
concentrations of 210Pb and 7Be at Tsukuba, Japan, with a possible observation of 210Pb originating from the 1991 eruption of Pinatubo volcano, Phillippines. Geochem. J. 28, 123-129.
[27] J.P. Beks, D. Eisma, J. van der Plicht, 1998. A record of atmospheric 210Pb deposition in the Netherlands. Sci. Total Environ. 222, 35-44.
[28] J. Sato, 2003. Natural radionuclides in volcanic activity. Appl. Radiat. Isotop. 58, 393-399.
[29] G. Lambert, B. Ardouin, G. Polian, 1982. Volcanic ouput of long-lived Radon daughters. J. Geophys. Res. 87 (C13), 11103-11108.
[30] CSIRO, August 2003. Internetsite: www.dar.csiro.au/information/etnaeruption.html. [31] Italy’s Volcanoes, August 2003. Internetsite:
http://boris.vulcanoetna.com/ETNA_2002.html. [32] Stromboli Online, August 2003. Internetsite:
http://www.educeth.ch/stromboli/etna/index-en.html.
[33] G. Groen, 2002. De storm van 27 oktober 2002. Meteorologica 4, 4-8. [34] LML database, July 2003. Internetsite: www.lml.rivm.nl.
[35] E.Y. Nho, B. Ardouin, M.F. Le Cloarec, M. Ramonet, 1996. Origins of 210Po in the atmosphere at Lamto, Ivory Coast: biomass burning and Saharan dust. Atmospheric Environ. 30 (22), 3705-3714.
[36] M.A. Mélières, M. Pourchet, S. Richard, 2003. Surface air concentration and deposition of lead-210 in French Guiana: two years of continuous monitoring. J. Environ. Radioactivity 66, 261-269.
[37] P.G. Appleby, A.O. Koulikov, L. Camarero, M. Ventura, 2002. The input and transmission of fall-out radionuclides through Redó, a high mountain lake in the Spanish Pyrenees. Water, Air & Soil Pollution: Focus 2, 19-31.
[38] L.H. Vaas, F.C.M. Mattern, R.M.S. Drost, P. Glastra, A.C. Koolwijk en
A. Ockhuizen, 1989. Onderzoek naar de radioactiviteit van neerslag. Resultaten over 1986. RIVM Bilthoven, Report no. 248701005.
[39] L.H. Vaas, F.C.M. Mattern, R.M.S. Drost, P. Glastra, A.C. Koolwijk en
A. Ockhuizen, 1989. Onderzoek naar de radioactiviteit van neerslag. Resultaten over 1987. RIVM Bilthoven, Report no. 248701006.
[40] J.E.M. Jacobs (ed), 2000. Monitoring of radiation in the Environment. Results in the Netherlands in 1998. RIVM Bilthoven, Report no. 610056045.
[41] C. de Hoog, S.T. van Tuinen en F.J. Aldenkamp, 2002. The National Radioactivity Monitoring Network. The second generation (in Dutch). NVS Nieuws 2002/2, p. 32-36.
[42] R.O. Blaauboer and R.C.G.M. Smetsers, 1996. Variations in outdoor radiation levels in the Netherlands. Thesis University of Groningen, Groningen.
[43] C. de Hoog en R.B. Tax, 2003. Achtergronddocument bij NMR integrale rapportage 2002.
[44] R.C.G.M. Smetsers, L.J. de Vries, A.P.P.A. van Lunenburg and F.J. Aldenkamp, 1996. National radioactivity monitoring network (LMR): Data report 1993–1995. RIVM Bilthoven, Report no. 610056028.
[45] Office of Aerospace Medicine, November 2003. Internetsite: http://www.cami.jcbi.gov/AAM-600/Radiation/600radio.html. [46] RIZA and RIKZ, July 2003. Internetsite: www.watermarkt.nl.
[47] E.J. de Jong en O.C. Swertz, 2000. Radioactieve stoffen in de zoute wateren. RIKZ, Den Haag, Report no. RIKZ/2000.041.
[48] L.J. Gilde, K.H. Prins, C.A.M. van Helmond, 1999. Monitoring zoete rijkswateren. RIZA Lelystad, Report no. 99.004.
[49] E.J. de Jong, W. Lutthmer, B. Munster, 1995. Onderzoek naar radioactieve stoffen in Rijkswateren. Resultaten 1992. RIZA, Lelystad.
[50] Ministerie V&W, 1998. Vierde Nota waterhuishouding. Den Haag.
[51] J.E.M. Beurskens, C.G.C. Dekker, J. Jonkhoff and L. Pomstra, 1995. Microbial dechlorination of hexachlorobenzene in a sedimentation area of the Rhine river. In: Microbial transformation of chlorinated aromatics in sediments (dissertation), Wageningen.
[52] F.M. Versteegh, F.W. van Gaalen, B.A. Baumann, E. Smit en L. Vaas, 1995. Resultaten van het meetprogramma drinkwater 1994 voor parameters uit het Waterleidingbesluit en enkele aanvullende parameters. RIVM Bilthoven, Report no. 731011009.
[53] Keuringsdienst van Waren Oost, 1998. Werkvoorschrift CHE01-OT802 Keuringsdienst van Waren Oost, Bepaling van de activiteit van gammastraling uitzendende nucliden in een telmonster met halfgeleiderspectrometrie. Nijmegen. [54] Keuringsdienst van Waren Oost, 2003. Radiologisch jaarverslag 2002. Zutphen. [55] EEC, 1990. Council Regulation on the conditions governing imports of agricultural
products originating in third countries following the accident at the Chernobyl nuclear power-station. EEC Brussels, No. 737/90.