RIVM report 441100020/2004
HIV and Sexually Transmitted Infections in the Netherlands in 2003
An update: November 2004
Editors: M.J.W. van de Laar and E.L.M. Op de Coul
This investigation has been performed by order and for the account of Ministry of Health, Welfare and Sports, within the framework of the project Epidemiology and surveillance of HIV and STI.
Report prepared by:
The Surveillance Unit of STI and HIV/AIDS, Centre of Infectious Epidemiology, National Institute for Public Health and the Environment,
with special thanks to Femke Koedijk, Liesbeth van der Eerden and Marion de Boer
In collaboration with:
HIV Monitoring Foundation & HIV treatment centres STI sentinel surveillance network
ISIS laboratory surveillance at the National Institute for Public Health and the Environment ISIS/Osiris - Inspectorate of Health
Rapport in het kort
HIV en seksueel overdraagbare aandoeningen in Nederland in 2003. Update: november 2004.
De toename van seksueel overdraagbare aandoeningen (SOA), die de afgelopen jaren werd waargenomen, lijkt in 2003 enigszins te zijn gestabiliseerd. De continue toename in het aantal gevallen van syfilis en de epidemie van Lymphogranuloma venereum (LGV) bij
homo/biseksuele mannen duidt echter op toename in onveilig seksueel gedrag. Continue alertheid is nodig om verdere verspreiding van SOA en HIV te voorkomen.
Per augustus 2004 zijn 9767 personen met HIV geregistreerd, waarvan 847 gediagnosticeerd in 2003. Eind 2003 waren er naar schatting 16400 personen in Nederland geïnfecteerd met HIV. Homo/biseksuele mannen vormden hierbij nog steeds de grootste groep. Het aandeel van heteroseksuelen met HIV steeg de laatste jaren, maar lijkt zich in 2003 te stabiliseren. De hoogste HIV prevalentie in Nederland werd gevonden bij homo/biseksuele mannen (0-22%) en injecterende druggebruikers (0-26%). De HIV prevalentie bij de heteroseksuele bevolkingsgroep varieerde van 0 tot 1,4%.
Het aantal gevallen van Chlamydia is gelijk gebleven en gonorroe daalde met 16%. Het aantal gevallen van syfilis en virale SOA nam echter nog steeds toe. In 2000-2003 is het aantal gevallen van syfilis bij mannen meer dan verdubbeld. Deze forse toename van syfilis komt grotendeels op het conto van homo/biseksuele mannen. Genitale wratten zijn de meest voorkomende virale SOA. In 2003 is de resistentie tegen ciprofloxacin bij gonorroe toegenomen tot 9%. In
Amsterdam wordt deze resistentie voor het eerst vaker gezien bij homo/biseksuele mannen dan bij heteroseksuelen.
De epidemie van LGV bij, voornamelijk HIV positieve, homo/biseksuele mannen heeft tot intensivering van surveillance geleid. Op 1 september 2004 waren 92 gevallen gerapporteerd. Na (inter)nationale berichtgeving over deze epidemie worden gevallen nu ook vanuit andere
Europese landen gemeld. In Nederland lijkt LGV nog steeds langzaam toe te nemen.
Bekend HIV positieve personen nemen een belangrijk deel van de SOA voor hun rekening: 20% van alle gonorroe, Chlamydia en syfilis in homo/biseksuele mannen wordt gezien bij HIV positieven. We concluderen dat het seksuele risicogedrag bij homo/biseksuele mannen onverminderd hoog is met een reëel risico op verdere verspreiding van SOA en HIV.
Continue alertheid is geboden om verdere verspreiding van SOA en HIV te voorkomen en hierbij dient te worden gezocht naar innovatieve methoden in preventie en interventie.
Abstract
HIV and Sexually Transmitted Infections in the Netherlands in 2003. An update: November 2004.
The increasing trend of Sexually Transmitted Infections (STIs), as observed in the last few years, seemed to have stabilised in 2003. The continuous increase of syphilis diagnoses and the
outbreak of Lymphogranuloma venereum (LGV) among men who have sex with men (MSM), indicate an increase of sexual risk behaviour. Permanent alertness will be required to prevent a further spread of STIs and HIV.
As of August 2004, a total of 9767 HIV cases were reported in the Netherlands, of which 847 were newly diagnosed in 2003. By the end of 2003, there were an estimated 16400 people living with HIV/AIDS in the Netherlands. MSM still accounted for the majority of the registered cases, although the proportion decreased over time. The increase of heterosexually acquired infections in recent years seemed to have levelled off in 2003. HIV prevalence in the Netherlands was highest among MSM (0-22%) and injecting drug users (IDUs) (0-26%). HIV prevalence among heterosexuals varied between 0-1.4%.
In 2003, the number of diagnoses of genital chlamydial infection remained stable; the number of diagnoses of gonorrhoea decreased by 16%. However, diagnoses of syphilis and viral STIs continued to increase in 2003. Between 2000 and 2003, the number of syphilis diagnoses more than doubled among men. This sharp increase can largely be attributed to MSM. Genital warts were the most common viral STI. The percentage of ciprofloxacin resistance seemed to have increased fairly rapidly in 2003. In Amsterdam, the prevalence of gonococcal antimicrobial resistance was, for the first time, higher in MSM than in heterosexuals.
Enhanced surveillance of LGV was started in the Netherlands in a response to the outbreak of LGV among, predominantly HIV infected, MSM. By September 2004, 92 cases of LGV had been reported. LGV had been reported by other European countries as well, following the international alerts in January 2004.
Known HIV infected individuals accounted for an important part of STIs: 20% of all diagnoses of gonorrhoea, chlamydia and syphilis among MSM were seen in known HIV infected MSM. Therefore we can conclude that unsafe sex practices are on-going in MSM with a potential risk of a further spread of STI and HIV.
Permanent alertness and innovative prevention and intervention methods will be needed to prevent a further spread of STIs and HIV.
Preface
This report continues the practice of presenting annual surveillance data and a review of the epidemiology of sexually transmitted infections (STI) and HIV/AIDS in the Netherlands. However, this is the first report to integrate the data and epidemiology of STI and HIV/AIDS. In this report we have aimed to produce an overview of recent trends and current developments in the field of STI and HIV/AIDS. The surveillance of STI and HIV/AIDS has been changed considerably in the past few years and this report describes the results of that process. We do not pretend to cover STI and HIV/AIDS in great depth but focus on the issues relevant for the current status of HIV and STI in the Netherlands with commentaries and interpretation of the data. Detailed data supplements are provided in the appendices.
We hope that this report will contribute to a better understanding of the distribution and determinants of STI and HIV/AIDS in the Netherlands and also to improved effectiveness of prevention measures. The information is made accessible for policy makers, researchers in the HIV/AIDS field and anyone with an interest in HIV/AIDS and STI in the Netherlands. More information on HIV/AIDS and STI in the Netherlands, is available at www.soahiv.nl. A copy of this report can also be downloaded in pdf format from this website.
Acknowledgements
We gratefully acknowledge the collaboration with physicians, public health doctors and nurses, microbiologists, epidemiologists, dermatologists, behavioural scientists, prevention workers and other professionals working in the field of STI and HIV/AIDS. We would like to thank
organisations for their continuing collaboration: HIV Monitoring Foundation, STI sentinel surveillance network, STI clinics and public health services, SOA AIDS Nederland, GGD Nederland, Rutgers Nisso group, NIGZ, HIV Vereniging and Schorerstichting.
We thank our colleagues from the RIVM, the HMF, and the STI sentinel network for their contribution to this report and for their comments on earlier drafts: Maaike van Veen, Marja Molag, Petra Brandsema (RIVM), Irene van Valkengoed, Ard van Sighem, Luuk Gras and Frank de Wolf (HMF), Ton Coenen and Han Fennema (STI sentinel network).
Further information
Any comment or suggestions that would improve the usefulness of this report are appreciated and should be sent to soahiv@rivm.nl.
Contents
SAMENVATTING---8
SUMMARY---10
1. INTRODUCTION --- 12
2. METHODS OF HIV SURVEILLANCE IN THE NETHERLANDS--- 13
2.1 BACKGROUND--- 13
2.2 HIV/AIDS REGISTRY--- 13
2.3 ANONYMOUS UNLINKED HIVSURVEYS--- 14
2.4 ADDITIONAL INFORMATION--- 14
3. METHODS OF STI SURVEILLANCE IN THE NETHERLANDS --- 16
3.1 BACKGROUND--- 16
3.2 STI SENTINEL SURVEILLANCE NETWORK--- 16
3.3 NOTIFICATION OF HEPATITIS B--- 18
3.4 LABORATORY SURVEILLANCE OF STI --- 18
3.5 ENHANCED SURVEILLANCE OF LGV --- 19
PART A: HIV/AIDS: STATE OF THE EPIDEMIC ---21
4. DIAGNOSED CASES OF HIV AND AIDS --- 22
4.1 HIV CASES--- 22
4.2 NEWLY DIAGNOSED HIV CASES IN 2003--- 26
4.3 AIDS CASES AND AIDS RELATED DEATHS--- 27
5. HIGH RISK GROUPS--- 29
5.1 INJECTING DRUG USERS--- 29
5.2 MIGRANT POPULATIONS--- 30
5.3 COMMERCIAL SEX WORKERS AND CLIENTS--- 31
5.4 STI CLINIC ATTENDEES AND OTHER TEST SITES--- 31
6. GENERAL POPULATION--- 34
6.1 BLOOD DONORS--- 34
6.2 PREGNANT WOMEN--- 35
7. HIV INCIDENCE AND NATIONAL ESTIMATE --- 37
7.1 HIV INCIDENCE--- 37
7.2 NATIONAL ESTIMATE OF HIV INFECTIONS,2003 --- 38
8. FOCUS ON YOUNG PEOPLE, MIGRANT POPULATIONS, MSM --- 39
8.1 YOUNG PEOPLE--- 39
8.2 MIGRANT POPULATIONS--- 40
8.3 MSM --- 41
PART B: SEXUALLY TRANSMITTED INFECTIONS ---43
9. STI CLINIC ATTENDEES --- 44
9.1 RECENT TRENDS--- 44
9.2 DETERMINANTS OF ATTENDEES--- 45
10. GENITAL CHLAMYDIAL INFECTION --- 47
10.1 RECENT TRENDS--- 47
10.2 DETERMINANTS OF INFECTION--- 48
10.3 LABORATORY SURVEILLANCE--- 49
11. GONORRHOEA --- 52 11.1 RECENT TRENDS--- 52 11.2 DETERMINANTS OF INFECTION--- 53 11.3 LABORATORY SURVEILLANCE--- 54 11.4 ANTIBIOTIC RESISTANCE--- 56 12. SYPHILIS --- 58 12.1 RECENT TRENDS--- 58 12.2 DETERMINANTS OF INFECTION--- 60 12.3 LABORATORY SURVEILLANCE--- 60 13. HEPATITIS B --- 62 13.1 RECENT TRENDS--- 62 13.2 DETERMINANTS OF INFECTION--- 63 13.3 CHRONIC HEPATITIS B --- 64 14. GENITAL WARTS --- 66 14.1 RECENT TRENDS--- 66 14.2 DETERMINANTS OF INFECTION--- 67 15. GENITAL HERPES --- 68 15.1 RECENT TRENDS--- 68 15.2 DETERMINANTS OF INFECTION--- 69 16. LYMPHOGRANULOMA VENEREUM--- 70 16.1 EARLY REPORTS--- 70
16.2 PUBLIC HEALTH ACTION--- 70
16.3 CLINICAL SIGNS AND DIAGNOSTICS--- 71
16.4 CURRENT STATUS OF THE LGV OUTBREAK--- 72
17. CONCURRENT STI AND HIV --- 74
17.1 KNOWN HIV INFECTED INDIVIDUALS--- 74
17.2 NEWLY DIAGNOSED HIV INFECTIONS--- 75
18. FOCUS ON YOUNG PEOPLE, MIGRANT POPULATIONS, MSM --- 77
18.1 YOUNG PEOPLE (16-24 YEARS)--- 77
18.2 MIGRANT POPULATIONS--- 79
18.3 MEN WHO HAVE SEX WITH MEN--- 80
19. GENERAL CONCLUSION AND RECOMMENDATIONS --- 83
APPENDIX A: SOURCES OF STI AND HIV/AIDS SURVEILLANCE IN THE NETHERLANDS---89
APPENDIX B: TABLES AND FIGURES HIV/AIDS SURVEILLANCE---91
APPENDIX C: TABLES AND FIGURES STI SURVEILLANCE---105
APPENDIX D: METHODS OF THE NATIONAL ESTIMATE OF PLWHA IN 2003---123
APPENDIX E: HIV MONITORING FOUNDATION---129
APPENDIX F: STI SENTINEL SURVEILLANCE NETWORK---134
APPENDIX G: TABLES AND FIGURES IN THIS REPORT---135
Samenvatting
HIV/AIDS
In augustus 2004 waren in totaal 9767 personen met HIV in Nederland geregistreerd. Eind 2003 waren er naar schatting in Nederland 16400 HIV geïnfecteerden. De homo/biseksuele mannen met HIV vormden de grootste groep, al daalde hun aandeel over de tijd. Het aandeel van heteroseksueel geïnfecteerden is in de laatste jaren toegenomen, maar lijkt zich in 2003 te stabiliseren. Van de 847 personen die in 2003 met HIV zijn gediagnosticeerd, is 44% door homo/biseksueel contact en 44% door heteroseksueel contact geïnfecteerd. De groep injecterende druggebruikers is klein (2%). Het merendeel van de niet-Nederlandse heteroseksuelen is in het buitenland geïnfecteerd: in Afrika ten zuiden van de Sahara en in mindere mate in Latijns-Amerika en het Caribische gebied.
De hoogste HIV prevalentie in Nederland wordt gezien bij homo/biseksuele mannen (0-22%) en injecterende druggebruikers (0-26%). De HIV prevalentie onder heteroseksueel geïnfecteerden varieert van 0 tot 1,4%. De landelijke screening van HIV bij zwangere vrouwen is in 2004 geïmplementeerd. De HIV prevalentie was 0,06% in de eerste helft van 2004.
Seksueel overdraagbare aandoeningen
In 2003 is de SOA surveillance in Nederland veranderd door de implementatie van het SOA peilstation. De vergelijking met de SOA cijfers van voorgaande jaren wordt hierdoor bemoeilijkt zodat de resultaten met de nodige voorzichtigheid dienen te worden geïnterpreteerd.
De toename van SOA, die de afgelopen jaren werd waargenomen, lijkt in 2003 enigszins
gestabiliseerd te zijn. Het aantal gevallen van Chlamydia bleef ongeveer gelijk en gonorroe daalde met 16%. Echter, het aantal gevallen van syfilis en virale SOA nam in 2003 nog steeds toe. De meeste gevallen van syfilis (87%) werden gevonden bij homo/biseksuele mannen. De toename in syfilis in de periode 2000-2003 werd gekenmerkt door enkele epidemieën zoals die in Amsterdam (50% van de gevallen) en in de rest van het land, Rotterdam, Den Haag, Utrecht, Groningen en Twente.
Mannen en vrouwen jonger dan 25 jaar lopen het grootste risico op Chlamydia of gonorroe. Twee derde van alle vrouwen met gonorroe of Chlamydia is jonger dan 25 jaar. Gonorroe wordt, in vergelijking met Chlamydia, vaker gerapporteerd in stedelijke gebieden, bij homo/biseksuele mannen en bij personen met een SOA voorgeschiedenis. Etnische minderheden (waaronder personen afkomstig uit Suriname, de Nederlandse Antillen en Aruba) lopen relatief meer risico op Chlamydia of gonorroe.
In 2003 bleek dat de resistentie tegen ciprofloxacin bij gonorroe was toegenomen. In Amsterdam werd deze resistentie, voor het eerst, vaker gezien bij homo/biseksuele mannen dan bij
heteroseksuelen.
In 2003 zijn de virale SOA verder toegenomen. De incidentie van acute hepatitis B gevallen in de aangifte was alleen toegenomen bij mannen, hoewel het aandeel van homo/biseksuele mannen enigszins afgenomen was. Genitale wratten waren de meest voorkomende virale SOA
gediagnosticeerd in het SOA peilstation.
De epidemie van Lymphogranuloma venereum in Nederland werd het eerst gezien in Rotterdam, maar later werden ook gevallen retrospectief gerapporteerd uit andere delen van het land. De LGV epidemie lijkt in Nederland langzaam toe te nemen. OP 1 september 2004 waren 92 gevallen gerapporteerd. Het klinisch beeld is soms moeilijk herkenbaar waardoor de diagnose kan worden gemist. Het werkelijke aantal gevallen van LGV zal vermoedelijk hoger liggen dan het hier gerapporteerde aantal. Het merendeel van de homo/biseksuele mannen met LGV blijkt ook met HIV geïnfecteerd te zijn.
Simultane SOA en HIV
Bekend HIV positieve personen nemen een belangrijk deel van de SOA voor hun rekening: 20% van alle gonorroe, Chlamydia en syfilis in homo/biseksuele mannen werd gezien bij bekend HIV positieven. In 84%, respectievelijk 57% van de Chlamydia en gonorroe gevallen betrof dit een anorectale infectie. Wij concluderen dat het seksuele risicogedrag bij homo/biseksuele mannen onverminderd hoog is met een reëel risico op verdere verspreiding van SOA en HIV. Deze groep is van belang voor de volksgezondheid omdat op dit moment meerdere epidemieën van SOA (syfilis, LGV, resistente gonorroe en HIV), tegelijkertijd voorkomen in deze groep.
Continue alertheid en innovatieve methoden in preventie en interventie zijn nodig om verdere verspreiding van SOA en HIV te voorkomen.
Summary
HIV/AIDS
As of August 2004, a total of 9767 HIV cases had been reported in the Netherlands. By the end of 2003, an estimated 16400 people were living with HIV/AIDS in the Netherlands. Men who have sex with men (MSM) still account for the majority of the registered cases, although the proportion has decreased over time. The increase of heterosexually acquired infections, as observed in recent years, seemed to have levelled off in 2003. Of all 847 newly diagnosed HIV infections in 2003, both MSM and heterosexuals accounted for 44% and IDUs for 2%. The majority of the non-Dutch heterosexuals acquired the HIV infection abroad; in sub-Saharan Africa and to a lesser extent in Latin America and the Caribbean.
HIV prevalence in the Netherlands is highest among MSM (0-22%) and IDUs (0-26%). HIV prevalence among heterosexuals varies from 0 to 1.4%. In 2004, national screening of HIV in pregnant women was implemented in the Netherlands. The HIV prevalence was 0.06% in the first half of 2004.
Sexually Transmitted Infections
In 2003, STI surveillance in the Netherlands was converted into an STI sentinel surveillance network. The resultant lack of comparable data hampered comparison of data, so results should be interpreted with caution.
In 2003, the rate of increase in diagnoses of some STIs seemed to have slowed down: the number of genital chlamydial infection remained stable at the 2002 level and diagnoses of gonorrhoea decreased by 16%. However, diagnoses of syphilis and viral STIs continued to increase in 2003. MSM accounted for 87% of diagnoses of syphilis seen in men. The rise in syphilis between 2000 and 2003 was associated with a number of outbreaks in Amsterdam (50% of all cases), but also in other parts of the country, i.e. Rotterdam, The Hague, Utrecht, Groningen and Twente region.
Men and women younger than 25 years of age are at highest risk of acquiring genital chlamydial infection, which is also true for gonorrhoea. Two-thirds of all female diagnoses of chlamydial infection and gonorrhoea are seen in women younger than 25 years. Compared with genital chlamydial infection, gonorrhoea tends to be a more concentrated disease with higher rates in urban areas, among MSM (61% of male cases) and individuals with a history of STIs (50%). Specific ethnic minorities (for example, those from Surinam, Netherlands Antilles and Aruba) are at high risk for both genital chlamydial infection and gonorrhoea.
In 2003, the percentage of ciprofloxacin resistance seemed to have increased fairly rapidly. In Amsterdam, resistance was, for the first time, higher in MSM than in heterosexuals.
Between 2002 and 2003, the number of diagnosed viral STIs further increased. The incidence of notified cases of acute hepatitis B infections increased only in men, although, the proportion of MSM was on the decrease. Genital warts were the most common viral STI, seen in the STI sentinel surveillance network in 2003.
The outbreak of Lymphogranuloma venereum in the Netherlands was first reported in Rotterdam but soon cases were reported retrospectively throughout the country. The LGV outbreak seems to be slowly increasing, with yet unknown dynamics, and with clinical signs that easily could be missed. The number of LGV cases reported here represents probably a minimum estimate of disease occurrence. The LGV outbreak was seen predominantly among HIV infected MSM. Concurrent STI and HIV
Known HIV infected individuals account for an important part of STIs: 20% of all diagnoses of gonorrhoea, chlamydial infection and syphilis in MSM are seen in known HIV infected MSM. Among these, anorectal infections were seen in 84% of the diagnoses of chlamydia and in 57% of gonorrhoea. We may conclude that unsafe sex practices are on-going in MSM with a potential risk of a further spread of STI and HIV. MSM form a major public health concern because various epidemics (e.g., syphilis, LGV, resistant gonorrhoea and HIV) occur simultaneously in this group.
Permanent alertness and innovative prevention and intervention methods will be needed to prevent a further spread of STIs and HIV.
1.
Introduction
In 2002, the organisation of STI and HIV surveillance in the Netherlands was changed considerably to meet recent developments in the field of STI and HIV (e.g. changes in legislation, accessibility of treatment). The National Institute for Public Health and the
Environment (RIVM) was assigned to implement the new STI and HIV surveillance nationally. Also, the Ministry of Health, Welfare and Sports (VWS) appointed the RIVM as the national surveillance unit (SU) for STI and HIV/AIDS in the Netherlands.
This report summarizes national surveillance data for HIV/AIDS and STI in the Netherlands. It is prepared by the STI/HIV Surveillance Unit of the RIVM. The core task of the SU is to monitor trends in STI and HIV in the Netherlands and to identify determinants of infection to provide insight in the occurrence of these diseases. The SU collaborates with numerous partners in the field of STI and HIV to collect data for surveillance, e.g. STI clinics, public health services, the HIV Monitoring Foundation (HMF), public health laboratories and other health care providers.
Available data on HIV and STI from surveys, national registries and cohort studies are compiled in this report and provide an overview of the current status of HIV and STI in the Netherlands. Preliminary data have been presented at the annual expert meeting on the surveillance of STI and HIV. The objective of the expert meeting is to review the current trends is STI and HIV in the Netherlands and to identify gaps in our knowledge. Based on this evaluation, modifications in current surveillance activities or new surveillance initiatives are suggested to the steering committee of STI and HIV/AIDS surveillance. The steering committee reviews the suggestions and advises the Ministry of VWS to improve the response to the actual HIV and STI situation in the Netherlands.
The information is made accessible for policy makers, researchers in the HIV/AIDS field and anyone with an interest in HIV/AIDS and STI in the Netherlands. More information on HIV/AIDS and STI in the Netherlands, is available at www.soahiv.nl and
2.
Methods of HIV surveillance in the Netherlands
2.1
Background
Since 2000, UNAIDS and the WHO have promoted the second generation surveillance framework [www.who.int/hiv/strategic/surveillance/en]. This approach aims to improve the understanding of the HIV epidemic through the collection of information from various sources, including data on other STI and risk behaviour. The second generation framework also aims to tailor surveillance systems to the countries’ type of the HIV epidemic.
The Netherlands has a concentrated HIV epidemic, according to the UNAIDS/WHO criteria, with a low HIV prevalence in the general population but a relatively high prevalence (> 5%) in at least one subpopulation, e.g. men who have sex with men (MSM) and injecting drug users (IDUs). Until 2002, HIV/AIDS surveillance in the Netherlands was based on voluntary notification of new AIDS patients, supplemented with HIV surveys among IDUs, STI clinic attendees, and visitors of two obstetrics clinics and an abortion clinic. Although the AIDS registry has played an important role in monitoring the Dutch HIV epidemic, its use as an epidemiological tool became less important with the introduction of HAART in 1996 that changed the HIV epidemiology and the life expectancy of those infected with HIV.
In 2001, the Council for Health Research (RGO) reviewed the Dutch HIV surveillance system and recommended the Ministry of VWS upon the future structure of the system: a national HIV registry was to be implemented and more information was needed on high risk groups and their potential in spreading HIV into the general population.1 Anonymous unlinked HIV surveys
among commercial sex workers (CSWs) and their clients, migrant populations, and bisexual men were suggested. Furthermore, the surveys among attendees of STI clinics and IDUs should be continued. In 2002 the RIVM was assigned to implement the new HIV surveillance.
2.2
HIV/AIDS registry
From January 2002, a new HIV/AIDS reporting system became the backbone of the HIV surveillance in the Netherlands. From this date, data of all newly diagnosed HIV infected
individuals were collected by the HIV Monitoring Foundation (HMF). The goal of the HMF is to monitor HIV infected individuals seen in 22 HIV treatment centres in the Netherlands to study changes in the epidemic, the natural history of HIV and the effects of treatment.
The HIV/AIDS registry in the Netherlands is different from in other European countries, as registered individuals form a cohort that is followed prospectively from the time of diagnosis. HIV infected individuals who were diagnosed prior to the start of the HMF, were included in the cohort retrospectively. The HMF largely follows the organisational structure that had been established for monitoring HIV in the ATHENA project, a clinical study following HIV infected individuals who are treated with HAART. The epidemiological data on newly diagnosed HIV infections, as well as trends in new AIDS diagnoses after 2000, are reported in collaboration with the SU at the RIVM.
Between 1987 and 2002, AIDS cases were reported to the Inspectorate of Health (national AIDS registry, IGZ). Physicians voluntarily reported AIDS cases by using standardized report forms. With the start of the HIV/AIDS monitoring system in 2002 by the HMF, the national AIDS registry was ended. In this report AIDS cases from 1999 or earlier are obtained from the AIDS registry. After 2000, AIDS cases from the HMF monitoring system were used since the AIDS registry was incomplete between 2000-2002.
2.3
Anonymous unlinked HIV Surveys
Between 1994-2002, 16 HIV surveys among IDUs were carried out in 9 areas. In 2003, new anonymous unlinked HIV surveys were initiated among migrant populations from HIV endemic areas (sub-Saharan Africa, Surinam, and the Netherlands Antilles), CSWs, and their clients. The objectives of the HIV surveys are: (1) to assess the prevalence of HIV infection and the status of risk behaviour and (2) to monitor trends in the prevalence over time in repeated surveys and (3) to assess the potential for further spread to the general population. The surveys are conducted in collaboration with public health services and local organisations for CSWs, IDUs and migrant groups. Social mapping of the risk groups is conducted. Participation in the survey is entirely voluntary and anonymous. Data on sexual behaviour, travel, sex between men, and injecting behaviour are collected within each survey. A saliva sample is taken for an HIV antibody test. The HIV surveys are approved by the Medical Ethics Committee of the University Medical Centre in Utrecht.
2.4
Additional information
HIV surveillance among STI clinic attendees is conducted since 1991 in Amsterdam and since 1994 in Rotterdam. In Amsterdam, two cross sectional studies including 1000 visitors each are conducted every year. In Rotterdam, visitors are included during the whole year (opting-out
principle). Since 1997, HIV testing is promoted at all STI clinics in the Netherlands, as part of an active HIV testing policy that was implemented following the accessibility of HAART.
The only nationwide HIV serosurveillance in the Netherlands is that of blood donors and pregnant women. Standard HIV screening is offered to all pregnant women since January 2004. The test is offered in the first trimester of pregnancy as part of the prenatal screening that includes also hepatitis B (since 1976) and syphilis (since 1960). In Amsterdam, pregnant women are tested for HIV from 1988 onwards in a sentinel surveillance study in two hospitals and an abortion clinic. Since 2003, all pregnant women in Amsterdam are screened for HIV in a pilot for the national program.
HIV incidence data are obtained from the Amsterdam Cohort Studies (ACS) on HIV/AIDS, which started in 1984 among MSM and in 1985 among IDUs. These cohorts give insight in HIV rises in an early state and are needed for prevention activities to respond effectively to the HIV epidemic. From 1995 and 1998, special recruitment started among young (<30 years) MSM and IDUs, respectively.
The ACS is a collaboration of the MHS, the Academic Medical Centre (AMC) and the CLB division of the Sanquin blood supply foundation in Amsterdam
[www.amsterdamcohortstudies.org].
To estimate the HIV incidence in surveys, the MHS in Amsterdam used a serologic testing algorithm (STARHS). STARHS is an effective tool to measure the number of recent infections in cross sectional studies with large populations.
In this report, we also provide an estimate of the number of people living with HIV/AIDS (PLWHA) in the Netherlands in 2003. For this estimate, the UNAIDS point prevalence
workbook was used, developed for making estimates of HIV/AIDS prevalence in countries with low level and concentrated epidemics. This estimate was based on HIV prevalence data from the serosurveillance studies and estimates of population sizes of the various high risk groups in the Netherlands.
3.
Methods of STI surveillance in the Netherlands
3.1
Background
Until 2003 STI surveillance in the Netherlands consisted of the notification data for gonorrhoea, infectious syphilis (1976-1998), acute hepatitis B virus infections (1976-present), the STI registration of consultations at public health services (1984-2002), and the registration of diagnoses at the free STI clinics and a number of low-threshold STI clinics (1991-2002). The notification data of gonorrhoea and infectious syphilis were considered to be the most reliable source in surveillance, i.e. to monitor trends in disease. The annual reports of the national STI registration and the STI clinic in Amsterdam provided additional information on the
determinants of transmission and risk groups.
On request of the Inspectorate of Health, a national working group reviewed the Dutch STI surveillance system and recommended the Ministry of VWS upon the future structure of the system2: a STI sentinel surveillance network was to be implemented, consisting of six free STI clinics and a number of public health services outside the large cities. Furthermore, the STI surveillance also should include the notification data of hepatitis B and the data of the laboratory surveillance of gonorrhoea, genital chlamydial infection and infectious syphilis. Additionally, it was suggested that the contribution of general practitioners in diagnosis and treatment of STI in the Netherlands needed to be reviewed with the objective to design a future STI monitor. Finally, a prevalence study of STI was recommended to assess the sensitivity of the STI surveillance in the Netherlands. In 2002, the RIVM was assigned to implement the new STI surveillance, with the STI sentinel surveillance network to be realised first.
3.2
STI sentinel surveillance network
The STI sentinel surveillance network was implemented in January 2003 after intensive
preparation by various partners in the STI field in the Netherlands, i.e. the National Institute for STI and AIDS Control in the Netherlands (SOA AIDS Nederland), Netherlands Association for Community Health Services (GGD Nederland; for the public health services), STI clinic of Amsterdam (GG&GD Amsterdam; for the STI clinics), and the RIVM. Specific STI surveillance objectives were formulated by using the CDC evaluation guidelines (e.g. quantity,
comprehensiveness, simplicity, flexibility, representativeness of risk groups). A minimum set of epidemiological data was chosen and STI services were selected to meet the surveillance
objectives. The unity of reporting is a ‘new consultation’, e.g. an individual attends because of a new disease episode, which is not related to previous health conditions, and medical examination or laboratory testing is carried out.
The STI sentinel surveillance network consists of 14 participants. The sentinel network covers on average 80% of all consultations and 88% of all STI diagnoses as registered in the former STI registration. The reporting of consultations is facilitated by a web based application (SOAP). Individual reports contain epidemiological, clinical data and test results on a wide range of STI. SOAP was implemented at April 1, 2003. Recently a survey was carried out to study the
satisfactoriness of SOAP and the timeliness in reporting. It was demonstrated that the timeliness of reporting (= days between date of consultation and date of reporting to RIVM) has decreased from on average 105 days in April 2003 to 22 days in March 2004.
In this report, the results of the first year of the STI sentinel surveillance network are presented with respect to the number and nature of new consultations and diagnoses. We focus on the major STI, e.g. genital chlamydial infection, gonorrhoea, infectious syphilis, viral STI and HIV infection.
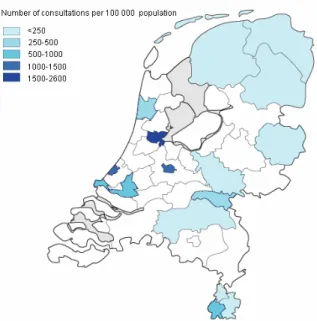
Figure 1: Number of consultations per 100000 population, the STI sentinel surveillance network, the Netherlands, 2003
Limitations of data
In 2003, data are incomplete for two large STI clinics due to initial technical difficulties and problems with the new surveillance system. Comparison of trends with previous years is hampered because the data are not available for all participants of the STI sentinel network. For comparing trends in this report, a selection was made of clinics of which previous data were available. Nevertheless, trends should be interpreted with caution.
3.3
Notification of hepatitis B
The compulsory notification of newly diagnosed acute hepatitis B virus infections (since 1976) and chronic HBV infections (since April 1999) includes epidemiological data on the occurrence of disease within specific risk groups. Since 2002, all public health services notify HBV cases by using the web based application Osiris. Data are presented per region and calculated as the incidence per 100000 population in 2002-2003.
3.4
Laboratory surveillance of STI
The laboratory surveillance, as part of the Infectious Diseases Information System (ISIS), collects data on gonorrhoea, genital chlamydial infection and infectious syphilis with the
objective to monitor trends and to detect changes in an early state (early warning). Data from all participating laboratories, including positive and negative test results, are obtained electronically overnight. Also a unique identifier, gender, date of birth, date of sampling, place of residence, material of sample and origin of sample are sent to ISIS. Reports are generated automatically, tables and reports are updated daily on the website.
Case definition
A surveillance diagnosis for each disease was formulated based on the specific diagnostic tests. Also, a period is established in which an individual can be counted positive only once and to allow re-infection after that specific period. The surveillance diagnoses of STI are described in the specific chapters on STI in part C of this report.
Limitations of the data
The current laboratory surveillance is a (convenience) sample based system and has not been implemented nationally yet. Laboratory surveillance covers now approximately 3.2 million people in the Netherlands (total population: 16 million) and is expected to expand to cover 6-7 million people in 2006. In 2000 – 2003, the number of participating laboratories changed. For this report, laboratories are only included if they participated incessantly in the surveillance. In February 2001, a large laboratory was included. In 2003, two laboratories temporarily stopped data exchange because of technical modifications. The data of these laboratories will be re-included retrospectively when the data become available. To be able to compare the number of tests and the rates of positive test results, the data are presented as incidence rates. Incidence rates are calculated with estimated population (adherences) of the laboratories. These adherences are based on the number and size of hospitals, the number of hospitalizations and inhabitants of each region.
3.5
Enhanced surveillance of LGV
In December 2003, a cluster of LGV cases was reported in Rotterdam among, predominantly HIV infected, MSM.34 This is a highly unusual event with (inter) national implications for public health given the known sexual networks of MSM. Following the initial report, a team was formed to coordinate control and prevention activities. Alerts were sent to STI and HIV clinics, gastroenterologists and public health services. An LGV awareness campaign was targeted at the specific homosexual subgroup via gay websites, e-mail newsletters and leaflets in gay venues.5
The RIVM started an enhanced surveillance of LGV to assess the size and nature of this outbreak. Also an additional questionnaire for LGV was drawn up to collect more detailed information of confirmed cases on clinical signs and social and behavioural parameters. In this report, the current status of the LGV outbreak will be presented.
4.
Diagnosed cases of HIV and AIDS
Key points
- A cumulative total of 9767 HIV cases had been reported in the Netherlands up to August 2004. In 2003, 847 new HIV cases were diagnosed. The number of people living with HIV in 2003 is estimated at 16400.
- In 2003, MSM accounted for 44% of the newly diagnosed HIV infections, heterosexuals for 44%, and IDUs for 2%.
- The increase of heterosexually acquired infections, as observed over the past years, levelled off in 2003.
- The median age at HIV diagnosis in 2003 was 36 years. Age at diagnosis increased over time among MSM, heterosexuals of Dutch origin and IDUs. Individuals of non-Dutch origin were, in general, younger than Dutch individuals.
- HIV prevalence in the Netherlands was highest among MSM (0-22%) and IDUs (1-26%). HIV prevalence among heterosexuals was low (0–1.4%) and stable (range: depending on the source).
- HIV prevalence among pregnant women in the Netherlands was 0.06% in the first half of 2004 (preliminary results).
4.1
HIV cases
0 100 200 300 400 500 600 700 800 900 1000 <1985 1985 1986 1987 1988 1989 1990 1991 1992 1993 1994 1995 1996 1997 1998 1999 2000 2001 2002 2003 2004 0 1000 2000 3000 4000 5000 6000 7000 8000 9000 10000Footnote: 2004 not completed
In August 2004, a cumulative total of 9767 HIV cases had been registered by the network of HIV treatment centres in the national database of the HIV Monitoring Foundation6
[www.hiv-monitoring.nl]; 847 cases were diagnosed in 2003 (figure 2). Of all registered cases, 77% was male and 23% female. Ninety eight percent of the individuals was infected with HIV-1. Forty four percent of all individuals were seen in treatment centres in Amsterdam (table B.1). The proportion of HIV cases diagnosed outside Amsterdam increased over time to 62% in 2003 (P<0.0001, chi-square test) (figure 3).
Figure 3: Number of new HIV diagnoses in Amsterdam and elsewhere, by year of HIV diagnosis
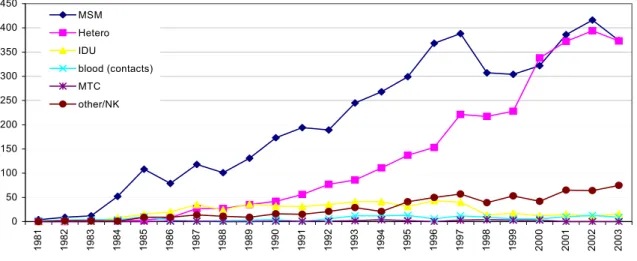
Men who have sex with men (MSM) were the largest group (51%), followed by heterosexual men and women (32%). Five percent of the HIV infections were diagnosed in IDUs. Individuals with risk through blood (products) accounted for 1% of the infections (table B.2). For 9% of the HIV cases a likely route of transmission was undetermined.
Footnote: MTC= mother to child
Figure 4: Number of HIV cases, by year of HIV diagnosis and transmission risk group
0 100 200 300 400 500 600 700 <1985 1985 1986 1987 1988 1989 1990 1991 1992 1993 1994 1995 1996 1997 1998 1999 2000 2001 2002 2003 A ms terdam outs ide A ms terdam
0 50 100 150 200 250 300 350 400 450 1 981 1982 1983 1984 1985 9861 1987 1988 1989 1990 1991 9921 1993 1994 1995 1996 1997 1998 1999 2000 2001 2002 2003 MSM Hetero IDU blood (contacts) MTC other/NK
The proportion of MSM decreased over time from 59% in 1996 to 44% in 2003, while the proportion of heterosexuals increased from 25% to 44% (p<0.0001, chi-square test). The last three years, the proportions did not change significantly with year of diagnosis.
The peak in HIV cases among MSM in 1996-1997 and 2001-2002 was probably due to an increased willingness to test following the access to HAART (1996-1997); the peak in 2001-2002 was likely to be caused by the official start of the HIV registry in 2001-2002 and a more active HIV testing policy which was launched in the Netherlands in 1997 (figure 4).
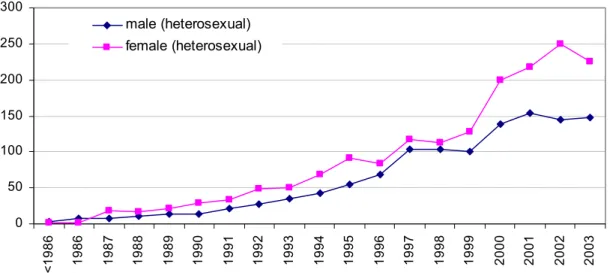
Since 1999, the number of HIV cases among heterosexual women exceeded the number of cases among heterosexual men (figure 5). In 2003, the number of women did not further increase and may seem to have stabilised.
0 50 100 150 200 250 300 < 1986 1986 1987 1988 1989 1990 1991 1992 1993 1994 1995 1996 1997 1998 1999 2000 2001 2002 2003 male (heterosexual) female (heterosexual)
Figure 5: Number of HIV cases (heterosexuals), by year of HIV diagnosis and gender
A small majority (57%) of the HIV infected individuals originated from the Netherlands
(table B.3). The largest non-Dutch group consisted of sub-Saharan Africans, accounting for 17% of the HIV cases. The second largest non-Dutch group (10%) included individuals from the Caribbean and Latin America, predominantly Surinamese and Antilleans (63%).
Figure 6: Geographic distribution of HIV cases, by gender (a: male, b: female)
A difference was observed by gender. Most HIV infected men originated from the Netherlands (66%), whereas the largest non-Dutch group among women were those from sub-Saharan Africa (44%) (figure 6a-b).
Over time, the number of new diagnoses among Dutch women remained stable: less than 50 cases per year (figure B.1). The number of non-Dutch women significantly increased over time (58% in 1996 and 85% in 2001, p<0.0001, chi-square test), due to an increase of women from sub-Saharan Africa (34% in 1996 and 60% in 2001). After 2001, the proportion of women from sub-Saharan Africa stabilised at 57% in 2003. The proportions of women from other regions did not change significantly over time.
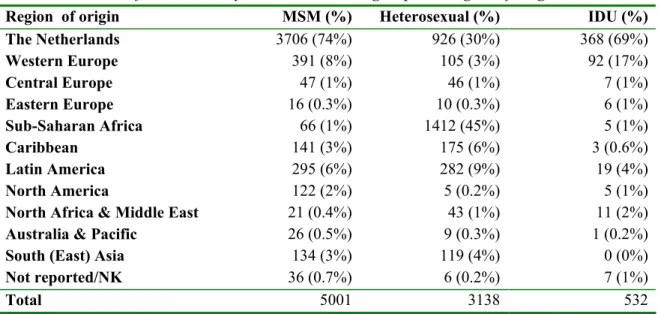
In contrast to heterosexual men, the majority of MSM originated from the Netherlands (37% versus 74%) (table 1). The second largest non-Dutch group of MSM were men from other West European countries (8%). Among heterosexual men, 37% was of African origin, 37% was Dutch and 14% of Latin American or Caribbean origin.
Most IDUs originated from the Netherlands (69%), other West European countries (17%), and Latin America (4%).
Most HIV infected individuals were between 30 and 39 years of age at diagnosis. Men had a median age of 36 years, whereas women were significantly younger: 30 years. This did not change over the past few years. Individuals of non-Dutch origin were, in general, younger than Dutch individuals: 32 and 36 years, respectively (table B.6). For more information on MSM, migrant populations and young people with HIV: see chapter 8.
Netherlands
66% Middle East & North Africa 1% Caribbean 3% Western Europe 7% South East Asia 2% not reported/NK 1% sub-Sahara Africa 11% South America 6% Central Europe 1% North America 2% Netherlands 30% sub-Sahara Africa 44%
Middle East & North Africa 1% Western Europe 6% South East Asia 5% Central Europe 1% Caribbean 5% South America 8% A B
Table 1: Number of HIV cases, by transmission risk group and region of origin
Region of origin MSM (%) Heterosexual (%) IDU (%)
The Netherlands Western Europe Central Europe Eastern Europe Sub-Saharan Africa Caribbean Latin America North America
North Africa & Middle East Australia & Pacific
South (East) Asia Not reported/NK 3706 (74%) 391 (8%) 47 (1%) 16 (0.3%) 66 (1%) 141 (3%) 295 (6%) 122 (2%) 21 (0.4%) 26 (0.5%) 134 (3%) 36 (0.7%) 926 (30%) 105 (3%) 46 (1%) 10 (0.3%) 1412 (45%) 175 (6%) 282 (9%) 5 (0.2%) 43 (1%) 9 (0.3%) 119 (4%) 6 (0.2%) 368 (69%) 92 (17%) 7 (1%) 6 (1%) 5 (1%) 3 (0.6%) 19 (4%) 5 (1%) 11 (2%) 1 (0.2%) 0 (0%) 7 (1%) Total 5001 3138 532
Footnote NK: not known; MSM: men having sex with men; IDU: injecting drug user
4.2
Newly diagnosed HIV cases in 2003
Of the 847 newly diagnosed HIV cases, 600 (71%) were male and 247 (29%) were female. Of those infected sexually (88%), half were infected heterosexually and half through sex between men. Ninety two percent of all female cases were heterosexuals. Sixty one percent of all newly diagnosed heterosexual cases were female.
Injecting drug use accounted for 2% of the new diagnoses. Seventy three percent of all IDUs were male. Risk through blood (products) represented 1% (n=7) of the HIV cases in 2003. For 8% the transmission risk group was undetermined (table B.10).
In 2003, 71% of the cases were diagnosed in the Western region of the country, of whom 53% were diagnosed in Amsterdam (table B.11).
Of the newly diagnosed cases, 47% originated from the Netherlands, 29% from sub-Saharan Africa, 10% from Latin America and the Caribbean, 6% from Western Europe, 4% from South (East) Asia and 4% from other regions (table B.13).
Over 60% of the cases diagnosed in 2003 were between 20 and 40 years of age. Thirty-two cases (4%) were identified among teenagers (15-19 years). The median age at diagnosis in 2003 was 36 years and differed per risk group: the median age in MSM was 39 years, in heterosexuals 33 years and in IDUs 42 years (table B.14-17).
4.3
AIDS cases and AIDS related deaths
0 100 200 300 400 500 600 19 83 19 84 19 85 19 86 19 87 19 88 19 89 19 90 19 91 19 92 19 93 19 94 19 95 19 96 19 97 19 98 19 99 20 00 20 01 20 02 20 03 Deaths AIDS casesFootnote: the low value in 1999 is caused by the change in data sources of AIDS cases (sources: AIDS registration Health Inspectorate, HIV Monitoring Foundation)
Figure 7: Number of AIDS cases and AIDS related deaths
By August 2004, a cumulative total of 6331 AIDS cases was registered in the Netherlands (table B.18-19). The annual incidence of AIDS cases peaked in 1995, and declined sharply over the subsequent four years (figure 7). Since 1999, the rate of decline had slowed and the curve stabilised at 230-80 cases per year. One of the factors responsible for the decline of AIDS cases is the wide availability of highly active antiretroviral therapy (HAART), which slowed
progression from HIV to AIDS.7
The proportion of reported AIDS cases attributed to homosexual contacts decreased from 77% in 1988 to 41% in 2003. Conversely, there was an increase from 6% to 41% in the proportion of heterosexual AIDS cases.
The proportion of IDUs with AIDS fluctuated over the years between 3-14%. Overall, 4% of Dutch AIDS cases were reported with an unknown route of transmission.
The median age at AIDS diagnosis in 2003 was 38 years. Men were older than women at AIDS diagnosis, respectively 40 and 33 years. On average, individuals of Dutch origin were ten years older at AIDS diagnosis than individuals of African origin: 43 and 33 years (table B.20-21).
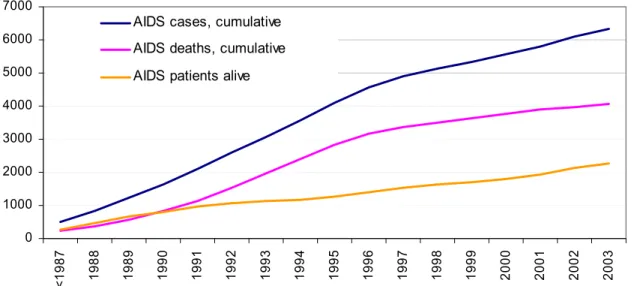
A very similar decline, as in the AIDS cases, was seen in the trend of AIDS related deaths (figure 7). Between 1983 and 2003, a cumulative total of 4065 individuals died because of AIDS, of whom 87 died in 2003. Antiretroviral treatment, which had a major effect on AIDS related deaths8, increased the number of AIDS patients alive in 2003 to more than 2000 (figure 8).
0 1000 2000 3000 4000 5000 6000 7000 <1 9 8 7 19 88 19 89 19 90 19 91 19 92 19 93 19 94 19 95 19 96 19 97 19 98 19 99 20 00 20 01 20 02 20 03
AIDS cases, cumulative AIDS deaths, cumulative AIDS patients alive
5.
High risk groups
5.1
Injecting drug users
Between 1994 and 2003, 16 surveys among IDUs were conducted in 9 different regions
(Amsterdam, Rotterdam, Limburg, Twente, Brabant, The Hague, Arnhem, Groningen, Utrecht). The primary objectives of the study were to monitor the HIV prevalence and risk behaviour to assess the potential for further spread.
IDUs were enlisted through health care institutions (e.g. methadone care, needle exchange, low threshold daytime care projects), supplemented by recruitment at street (including prostitution projects) and detainment sites. The survey population is made up of IDUs who use hard drugs regularly. Respondents were asked to give a saliva sample for HIV testing and a questionnaire on demographics and risk behaviours.9
Approximately, 3500 IDUs participated in the surveys in various cities in the Netherlands. HIV prevalence rates ranged from 0.5 to 26% (table 2). The highest prevalence rates were found in Amsterdam (26%) and Heerlen (South Limburg, 22%). HIV prevalence remained stable in all cities except for Heerlen (1994:11%, 1996; 16%, 1998/99: 22%). Of the participants, 64% originated from the Netherlands.
In the six months preceding the survey, a considerable proportion of the participants had borrowed syringes or needles from some one else (11-30% of current injectors) and not always used condoms with steady partners (76-96%), casual partners (39-73%) or clients (13-50%). The percentage of IDUs reporting recent borrowing of drug equipment decreased in all cities where repeated surveys were conducted.9
There is a potential for further spread of HIV from IDUs to the general population, given the high prevalence and reported unsafe sex, also with non-IDUs.
Table 2: HIV prevalence and risk behaviour among IDUs Region Year of survey HIV prevalence Borrowing I Condom use V steady partner Condom use V casual partner Condom use V clients Amsterdam 1996 1998 26% 26% 18% 12% 24% 15% 60% 53% 70% 71% Rotterdam 1994 1997 2002/2003 12% 9% 10% 18% 10% 8% 9% 16% 15% 53% 46% 57% 80% 69% 68% South LimburgII 1994 1996 1999 10% 12% 14% 19% 17% 10% 14% 13% 11% 39% 61% 51% 87% 83% 75% Utrecht 1996 5% 17% 16% 55% 83% Arnhem 1991/1992 1995/1996 1997 2% 2% 1% 42% 39% 16% na 10% 4% na 49% 47% 60% 79% 78% Groningen 1997/1998 1% 11% 11% 43% 76% BrabantIII 1999 5% 17% 12% 39% 83% The Hague 2000 2% 21% 16% 27% 60% TwenteIV 2000 3% 30% 8% 32% 50%
Footnote: IDU: ever injected drugs and using hard drugs at least once a week (i.e. heroine, cocaine products, amphetamine or methadone) in the six months prior to recruitment I. Percentage of IDUs that borrowed used syringes or needles in the last six months. II. Percentage of IDUs infected with HIV in Maastricht: 8% (1994), 3% (1996), 5% (1999); in Heerlen: 11% (1994), 17% (1996) en 22% (1999). III. Eindhoven, Helmond, Den Bosch. IV. Almelo, Hengelo, Enschede. V. Condom use: last 6 months always used condoms. NA= not available
5.2
Migrant populations
Migrants from areas where HIV is endemic are likely to be at risk for HIV through sexual contact in their country of origin. Individuals from Sub-Saharan Africa, Surinam and the Netherlands Antilles form relatively large immigrant groups in the Netherlands. However, little is known on these groups and the determinants of risk behaviour in the country of origin. The only study available was carried out by the MHS in Amsterdam in 1997/1998. HIV prevalence in this study was 1.1%. Sexual contact in the country of origin was frequently reported. Risk
behaviour and sexual contact between various ethnic groups (intermixing) were often found.10 To obtain more insight in these populations and to study the intermixing, risk behaviour and the potential to further spread, HIV surveys were set up. First, pilots were carried out to test the questionnaire and methodology in these groups.
In 2002, the RIVM started anonymous unlinked HIV surveys in which at least 200 participants were included per ethnic subgroup. Locations for recruitment were determined in the course of social mapping together with migrant organizations and the public health service (e.g. festivals,
churches, sports events, and community centres). The major focus of the study is to determine HIV prevalence, risk behaviour and intermixing between ethnic groups and with the general population.
The MHS in Amsterdam started a project in 2002 among Surinamese and Antilleans that aims to investigate the characteristics of travellers, their sexual behaviour while travelling, and the sexual networks. The main purposes of the study are to investigate the risk of heterosexual HIV
transmission on visits to the country of origin, and the epidemiological relationships between countries by genotyping HIV strains. For this study, saliva and blood samples are collected in the Netherlands, Surinam, and the Netherlands Antilles. The first results of these projects are
expected in 2005.
5.3
Commercial sex workers and clients
Since commercial sex workers (CSWs) have many sexual contacts, and their clients can form a bridge to the general population, the anonymous unlinked HIV surveys also include these groups. The main purpose of the surveys is to investigate HIV prevalence, the sexual risk behaviour with clients and with non-commercial partners, and the mobility of CSWs. The first surveys among CSWs were conducted in Rotterdam (2002) and Amsterdam (2003/2004). In each survey, 200-400 CSWs are recruited. In Rotterdam, CSWs working in a streetwalkers districts, clubs and brothels were included. In Amsterdam, also window prostitution is included. In 2004, a pilot among clients of CSWs was carried out in Amsterdam to asses the feasibility of a HIV survey in this group. The first results of the surveys among CSWs and their clients are expected in 2005.
5.4
STI clinic attendees and other test sites
Visitors of STI clinics are, in general, at higher risk of HIV infection. HIV testing is recommended whenever a person is examined for, or diagnosed with an STI.
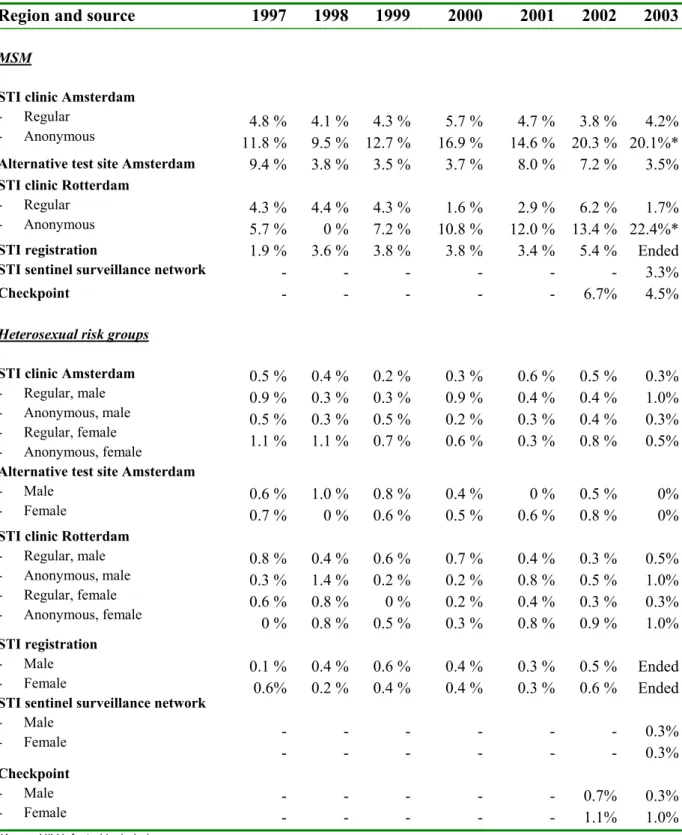
Table 3 provides an overview of trends in HIV positive test results obtained from surveys at STI clinics in Amsterdam and Rotterdam, the former STI registration until 2003, and the STI sentinel surveillance network in 2003.11121328
Among MSM prevalence rates varied between 0 and 22% (table 3). The HIV prevalence in the anonymous surveys is higher than that in regular HIV tests by name. In the anonymous survey among MSM in Amsterdam, an increase of HIV prevalence was observed over time (up to 20% in 2003). The increase, however, was mainly caused by known HIV positive MSM attending the STI clinic. By including only newly diagnosed HIV infected MSM, the HIV prevalence was 7%.
In Rotterdam, the HIV prevalence was also 7% in 2003 when known HIV positive MSM were excluded.
At the alternative test site of the MHS in Amsterdam, HIV prevalence among MSM varied between 4 and 9%. There was no significant trend over time.
At ‘Checkpoint’, a one-hour HIV testing facility in Amsterdam that started in June 2002, the HIV prevalence among MSM was 4.5% in 2003, which is similar to the prevalence at the alternative test site and the regular screening at the STI clinic of the MHS (3.5% and 4.2%, respectively). Over a 1000 HIV tests were done at Checkpoint in 2003.14 Checkpoint is staffed by the HIV association Netherlands (HIV Vereniging Nederland) and focuses on MSM. The rapid procedure may persuade those at high risk who refrain from or postpone HIV testing because of the one-week waiting period after the conventional HIV test. In 2003, 66% of the visitors give ‘rapidity of the test result’ as the main reason to visit Checkpoint. For more information: www.hivnet.org.
HIV prevalence among heterosexual visitors of STI clinics was low (0-1.4%) and stable over time.
Table 3: HIV prevalence among STI clinic attendees and other test sites 11 12 13
Region and source 1997 1998 1999 2000 2001 2002 2003
MSM
STI clinic Amsterdam
- Regular
- Anonymous 11.8 %4.8 % 4.1 %9.5 % 12.7 %4.3 % 16.9 %5.7 % 14.6 % 4.7 % 20.3 % 3.8 % 20.1%*4.2%
Alternative test site Amsterdam 9.4 % 3.8 % 3.5 % 3.7 % 8.0 % 7.2 % 3.5%
STI clinic Rotterdam
- Regular
- Anonymous 4.3 %5.7 % 4.4 %0 % 4.3 %7.2 % 10.8 %1.6 % 12.0 % 2.9 % 13.4 % 6.2 % 22.4%*1.7%
STI registration
STI sentinel surveillance network
1.9 % -3.6 % -3.8 % -3.8 % -3.4 % - 5.4 % - Ended 3.3% Checkpoint - - - 6.7% 4.5%
Heterosexual risk groups STI clinic Amsterdam
- Regular, male - Anonymous, male - Regular, female - Anonymous, female 0.5 % 0.9 % 0.5 % 1.1 % 0.4 % 0.3 % 0.3 % 1.1 % 0.2 % 0.3 % 0.5 % 0.7 % 0.3 % 0.9 % 0.2 % 0.6 % 0.6 % 0.4 % 0.3 % 0.3 % 0.5 % 0.4 % 0.4 % 0.8 % 0.3% 1.0% 0.3% 0.5% Alternative test site Amsterdam
- Male
- Female 0.6 %0.7 % 1.0 %0 % 0.8 %0.6 % 0.4 %0.5 % 0.6 % 0 % 0.5 % 0.8 % 0%0%
STI clinic Rotterdam
- Regular, male - Anonymous, male - Regular, female - Anonymous, female 0.8 % 0.3 % 0.6 % 0 % 0.4 % 1.4 % 0.8 % 0.8 % 0.6 % 0.2 % 0 % 0.5 % 0.7 % 0.2 % 0.2 % 0.3 % 0.4 % 0.8 % 0.4 % 0.8 % 0.3 % 0.5 % 0.3 % 0.9 % 0.5% 1.0% 0.3% 1.0% STI registration - Male - Female
STI sentinel surveillance network
- Male - Female 0.1 % 0.6% 0.4 % 0.2 % -0.6 % 0.4 % -0.4 % 0.4 % -0.3 % 0.3 % - - 0.5 % 0.6 % - - Ended Ended 0.3% 0.3% Checkpoint - Male - Female -- -- -- -- - - 0.7% 1.1% 0.3%1.0%
6.
General population
In the Netherlands, the only nationwide ongoing serosurveillance is that of blood donors and pregnant women. These populations are often studied to identify HIV trends in populations at low and moderate risk of HIV infection.
6.1
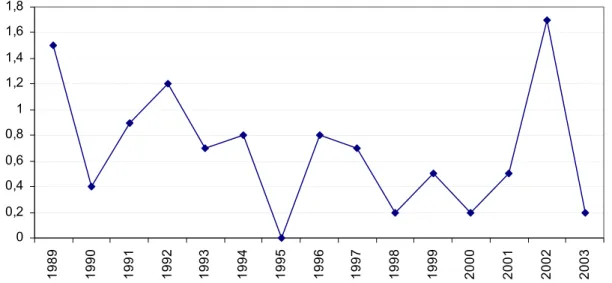
Blood donors
In 2003, 509600 blood donors were registered in the Netherlands. The overall prevalence and incidence of HIV antibodies have been low in that year: new donors: 0.0029% (prevalence), regular donors: 0.0002% (incidence). No marked trend over time was observed (figure 9-10).
0 2 4 6 8 10 12 14 16 1989 1990 1991 1992 1993 1994 1995 1996 1997 1998 1999 2000 2001 2002 2003
Source: C. van der Poel, personal communication, Stichting Sanquin Bloedvoorziening, Amsterdam
0 0,2 0,4 0,6 0,8 1 1,2 1,4 1,6 1,8 1989 1990 1991 1992 1993 1994 1995 1996 1997 1998 1999 2000 2001 2002 2003
Source: C. van der Poel, personal communication, Stichting Sanquin Bloedvoorziening, Amsterdam
Figure 10: HIV incidence (per 105 donoryears) among regular blood donors in the Netherlands
6.2
Pregnant women
Since 1988, pregnant women in Amsterdam are tested for HIV in a sentinel surveillance study.15 Until 2002, HIV prevalence was slightly increasing; the last few years mainly due to an increase of known HIV positive women becoming pregnant (figure 11). In 2003, HIV prevalence was 1.2% (24/1952) which is slightly lower than in 2002 (1.4%, 26/1912).
Since 2003, all pregnant women in Amsterdam are offered an HIV test. In that year,
13329 women were tested (2.1% refused). Thirty five women were HIV positive (0.3%). Of these, 16 knew their HIV positive serostatus; 26 had a non-Dutch origin (74%) (18 sub-Saharan Africa, 4 Surinam/Antilles, 1 Caribbean, 3 other).15
Since January 2004, standard screening for HIV is offered to all pregnant women in the
Netherlands (opting out method). The HIV test is offered as part of the prenatal screening. The Healthcare Insurance Board (College voor Zorgverzekeringen, CVZ) is collecting the
information on HIV test results from the regional vaccination bureaus.
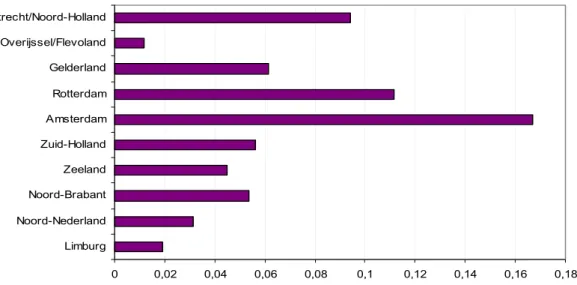
In the first six months of 2004, approximately 95000 women were tested for HIV. Of those women, 60 were HIV positive (HIV prevalence: 0.06%). The highest prevalence was observed in Amsterdam: 0.17% (9/5385) (figure 12).
0 500 1000 1500 2000 2500 1 988 1989 1990 1991 1992 1993 1994 1995 1996 1997 1998 1999 2000 2001 2002 2003 0 0,2 0,4 0,6 0,8 1 1,2 1,4 1,6 number of HIV tests HIV prevalence
Figure 11: HIV prevalence (%) and number of tests among pregnant women in Amsterdam (sentinel study) 0 0,02 0,04 0,06 0,08 0,1 0,12 0,14 0,16 0,18 Limburg Noord-Nederland Noord-Brabant Zeeland Zuid-Holland Amsterdam Rotterdam Gelderland Overijssel/Flevoland Utrecht/Noord-Holland
Source: preliminary data regional vaccination bureaus; M. Witteveen personal communication, CVZ
7.
HIV incidence and national estimate
7.1
HIV incidence
The yearly HIV incidence among MSM and drug users are obtained from the Amsterdam Cohort Studies (ACS) of HIV infection and AIDS. The study population consists of MSM and drug users living in Amsterdam and surroundings. The first enrolment of MSM took place in 1984 including men aged 18-65 years. From June 1995, recruitment was focused on young (≤30 years) MSM. For more details16: www.amsterdamcohortstudies.org.
The HIV incidence among MSM in the ACS in 2003 was estimated at 1.8 per 100 person-years (PY). The last decade, the HIV incidence is relatively stable in the range of 0-2 per 100 PY. Compared to 2002 (1.4/100 PY), the HIV incidence in 2003 is slightly higher (figure 13).16
Figure 13: Yearly HIV incidence among MSM (30 years or younger at entry) in ACS
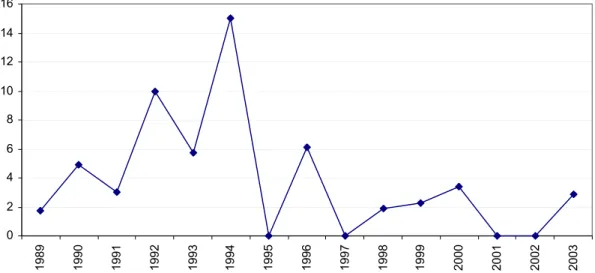
The first enrolment of IDUs in the ACS took place between 1985-1990. From 1998, recruitment was focused on young drug users (≤30 years). From 1999, no HIV infections were found among IDUs. Among all drug users (including non-injecting), one HIV infection was found in 2001 and one in 2002. In 2003, no drug users were tested HIV positive (figure 14).16
Figure 14: Yearly HIV incidence among IDUs (30 years or younger at entry) in Amsterdam
0 1 2 3 4 5 6 7 8 1985 1986 1987 1988 1989 1990 1991 1992 1993 1994 1995 1996 1997 1998 1999 2000 2001 2002 2003 0 1 2 3 4 5 6 7 8 9 10 198 5 198 6 198 7 198 8 198 9 199 0 199 1 199 2 199 3 199 4 199 5 199 6 199 7 199 8 199 9 200 0 200 1 200 2 200 3
Drug users, total Injecting drug users
7.2
National estimate of HIV infections, 2003
The Point Prevalence workbook, developed by UNAIDS/WHO, was used to estimate the number of people living with HIV and AIDS (PLWHA) in the Netherlands. The workbook program is suitable for estimates and short term projections of HIV/AIDS in countries with low level and concentrated epidemics. Estimating the number and distribution of PLWHA is important in deciding how prevention resources should be allocated, as well as planning care and support needs on a national scale.17
The workbook approach focuses on defining populations highly exposed to HIV and the spread of HIV to groups less exposed. Estimates of populations sizes and HIV prevalence rates were used to calculate the number of PLWHA in the Netherlands.18 The total estimate of the number of PLWHA is the sum of the number of PLWHA among the high risk groups and among populations at lower risk.
For the estimate, we divided the Netherlands into two different geographical regions: Amsterdam and the remaining regions. The following high-risk groups were included: IDUs, MSM, migrants from HIV endemic regions, CSWs, and attendees of STI clinics. The HIV prevalence in low-risk groups (adults, 15-49 year) was calculated by using HIV data from pregnant women. For details on methods: appendix D.
The total number of PLWHA in the Netherlands in 2003 is estimated at 16410 [9659 - 20443] (table 4). The range is determined by calculating the number of PLWHA on the basis of lower bounds and higher bounds of all 95% CI of HIV prevalence rates. The total number of women with HIV/AIDS in the Netherlands is estimated at 5417 (33%). The adult HIV prevalence rate - across the total population of age 15-49 - is 0.2%. The HIV prevalence among IDUs and MSM in the Netherlands are estimated at 9.1% and 5.8%, respectively (data not shown). The ratio between individuals at low risk (PLR) and high risk (PHR) for HIV is 0.23.
Table 4: Estimate of PLWHA in the Netherlands in 2003
National Estimates for year: 2003
Number of Adults (15-49) LWHA 16410
Adult Prevalence (15-49) 0.2%
Number of Women (15-49) LWHA 5417
% of adults (15-49) who are women 33%
Finally, the estimate on populations affected by HIV/AIDS in the Netherlands should constantly being improved on the basis of new data and research findings. For some risk groups, more recent HIV prevalence rates are needed. However, ongoing new HIV surveys among immigrant populations, CSWs and their clients will provide new prevalence rates the coming years.
8.
Focus on young people, migrant populations, MSM
8.1
Young people
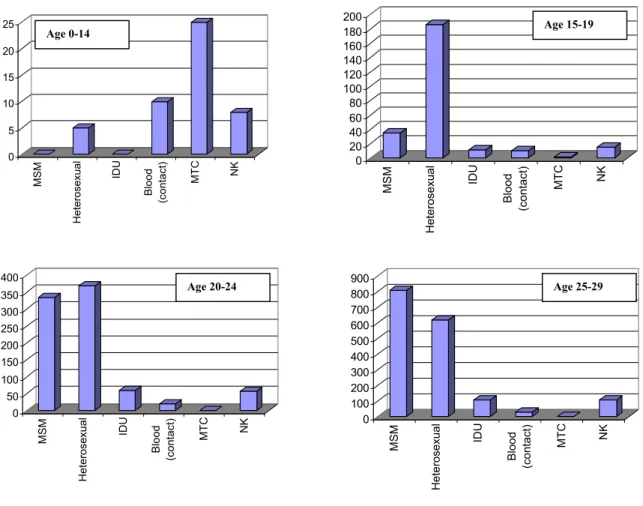
Of all HIV cases in the HMF monitoring system, 270 (3%) were teenagers (10-19 years), 840 (9%) were young adults (20-24 years) and 1674 (18%) were individuals aged 25-29 years. The distribution of the transmission risk groups differed per age group. Children aged 0-15 most often acquired the infection from their mother. Among teenagers aged 16-19, the majority is infected through heterosexual contact; while among individuals above 20 sex between men became increasingly important (figure 15).
Footnote: MTC= mother to child
Figure 15: Number of HIV infected individuals, by age group and transmission risk group
0 5 10 15 20 25 MSM Heterosexual IDU Blood (c ontact) MT C NK 0 20 40 60 80 100 120 140 160 180 200 MSM Heterosexual IDU B lood (c ont act ) MTC NK 0 50 100 150 200 250 300 350 400 MSM Het eros ex ual IDU Blood (c ont ac t) MTC NK 0 100 200 300 400 500 600 700 800 900 MSM Heterosexual IDU Blood (contact) MTC NK Age 0-14 Age 15-19 Age 20-24 Age 25-29
Sixty percent of the children younger than 15 years were Dutch and 29% were born in sub-Saharan Africa. Of children aged 15-19, the majority originated from sub-sub-Saharan Africa (60%). Young adults (20-29 years) most often originated from the Netherlands, sub-Saharan Africa (23%) and Latin America/Caribbean (9%) (figure B.6).
At present, the registration of HIV infected children is still incomplete due to the recent formation of a more elaborate registration system.
8.2
Migrant populations
Forty-two percent of all registered HIV cases were born abroad. Fifty-three percent of all migrants was infected through heterosexual contact. The majority (41%) originated from sub-Saharan Africa, 24% from Latin America/Caribbean, 16% from Western Europe, and 6% from South (East) Asia.
Figure 16 shows the distribution of transmission risk groups among HIV infected individuals by country of origin. The most prevalent risk group among the Dutch population was MSM (67%), while sex between men only accounted for 4% of the infections among Africans. The
proportions of MSM among individuals from Surinam and the Netherlands Antilles were 31% and 40%, respectively.
Footnote MTC: mother to child; IDU: injecting drug use; MSM: men having sex with men
Figure 16: HIV infected individuals, by transmission risk group and region of origin
Heterosexual 17% MSM 67% other/NK 8% IDU 7% Blood (products) 1% MSM 31% Heterosexual 56% Blood (products) 1% IDU 4% other/NK 8% MSM 40% Heterosexual 49% IDU 1% Blood (products) 1% other/NK 9% MSM 4% Heterosexual 83% MTC 1% other/NK 10% Blood (products) 2% Netherlands Surinam Netherlands
The majority of the heterosexuals acquired the infection abroad (61%). For heterosexuals of non-Dutch origin, 78% was infected abroad, most often in the region from which they originated (table B.24). Of the individuals from sub-Saharan Africa, for whom the country of infection is known (66%), 87% was infected in sub-Saharan Africa. Among Surinamese individuals, 28% was infected in Surinam and 70% in the Netherlands. Of the individuals from the Netherlands Antilles/Aruba, 44% was infected in the region of origin and 48% in the Netherlands (see also: report HIV Monitoring Foundation 2003).19
Among heterosexual women, African women were the youngest at diagnosis (median age: 28 years). West European women were older: 32 years. Among heterosexual men, Dutch and Asian men were the oldest: 40 and 42 years. African men were the youngest: 34 years (table 5). The median age at HIV diagnosis was stable over time for heterosexuals originating from sub-Saharan Africa, and Latin America/Caribbean. The median age of heterosexuals born in the Netherlands increased from 29 years in 1992 to 39 years in 2003 (figure B.7).
Table 5: Median age (years) of heterosexual population, by region of origin and gender
Region of origin Male (age/IQR) Female (age/IQR) Total (age/IQR) The Netherlands
Western Europe Sub-Saharan Africa Caribbean
Latin America South (East) Asia
40.4 (32.7-48.8) 37.5 (33.5-47.4) 33.6 (28.2-38.2) 36.0 (30.4-42.9) 37.4 (31.9-46.6) 42.4 (33.5-52.5) 31.5 (26.0-41.5) 31.9 (28.9-40.5) 28.4 (23.7-33.7) 31.1 (25.2-38.0) 30.9 (26.3-37.6) 30.5 (26.5-34.9) 35.7 (28.5-45.7) 35.2 (30.2-45.0) 30.4 (24.9-35.6) 33.0 (27.3-39.5) 33.8 (28.0-41.2) 31.7 (27.5-36.4)
Footnote: IQR= inter-quartile range
8.3
Men who have sex with men
The majority of MSM with HIV is Dutch (74%) (table 1). Other frequently reported regions of origin are: Western Europe (8%), Latin America (6%), the Caribbean (3%), and South (East) Asia (3%). These proportions did not change significantly over time.
For 68% of the MSM, the country of infection was known (table B.24). The majority of the men (89%) was infected in the Netherlands. Among the MSM who were born in the Netherlands this proportion was 97%. Of the non-Dutch MSM, 58% was infected in the Netherlands.
Of all MSM, 7% is younger than 25 years at HIV diagnosis (table B.5). Ten percent is 50 years or older. MSM are, in general, younger at HIV diagnosis than heterosexual men (table 5-6). MSM from the Caribbean and Latin-America are the youngest: 32 years. The oldest are MSM from the Netherlands (table 6).