Referentieraming energie en emissies 2010-2020
193
0
0
Hele tekst
(2) Acknowledgement This report has been written for the Projectbureau Schoon en Zuinig (Project Office Clean and Efficient) of the Dutch Ministry of Housing, Spatial Planning and the Environment and the Dutch Ministry of Economic Affairs. This report contains the English translation of the Dutch report „Referentieramingen Energie en Emissies 2010-2020, registered under ECN report number ECN-E--10-004. The ECN project number is 50046. The PBL report number is 500161005. The contact persons of this project are coordinating authors Bert Daniëls of ECN (tel. +31-224564426, e-mail: daniels@ecn.nl) and Sonja Kruitwagen of PBL (tel. +31-30-2743526, e-mail: sonja.kruitwagen@pbl.nl). In addition to the coordinating authors a large number of employees of ECN and PBL have contributed to this study: Luuk Beurskens (ECN), Pieter Boot (ECN), Eric Drissen (PBL), Jeroen van Deurzen (ECN), Hans Elzenga (PBL), Gerben Geilenkirchen (PBL), Joost Gerdes (ECN), Coen Hanschke (ECN), Michiel Hekkenberg (ECN), Anco Hoen (PBL), Benno Jimmink (PBL), Sander Kieboom (PBL), Sander Lensink (ECN), Stefan Luxembourg (ECN), Marijke Menkveld (ECN), Pieter Kroon (ECN), Kees Peek (PBL), Arjan Plomp (ECN), Marian van Schijndel (PBL), Ad Seebregts (ECN), Jos Sijm (ECN), Jeffrey Sipma (ECN), Sietske van der Sluis (PBL), Joost van Stralen (ECN), Casper Tigchelaar (ECN), Martine Uyterlinde (ECN), Martijn Verdonk (PBL), Paul Vethman (ECN), Cees Volkers (ECN), Wouter Wetzels (ECN), Alessia de Vita (ECN), Harry Wilting (PBL). The English translation was conducted by Marlies Kamp (ECN). The final layout was done by Kim Stutvoet-Mulder (ECN).. Abstract The Reference projection 2010-2020 examines the future development of Dutch energy use, greenhouse gas emissions and air pollution up to 2020. The Reference projection is based on assumptions regarding economic, structural, technological and policy developments. With regard to the latter, the “Schoon en Zuinig” (Clean and Efficient) policy programme for energy and climate, introduced in 2007, plays an important role. According to Schoon en Zuinig, greenhouse gas emissions have to be reduced by 30% in 2020 compared to 1990; the annual energy efficiency improvement has to increase to 2% and the target share of renewable energy production in total consumption in 2020 is 20%. To assess the effects of the policy measures from the Schoon en Zuinig policy programme, the Reference projection explores three policy variants: one without policies introduced after 2007, one including only post-2007 policies that are already fixed, and one including proposed policy measures as well. Here, policies refer to Dutch as well as to European policies. The results indicate that the climate and energy targets will not be reached with the current instruments. Including proposed policy measures, the estimated greenhouse gas reduction will amount to 16-24% relative to 1990, the renewable energy share will rise to 13-16% and the annual energy efficiency improvement between 2011 and 2020 will amount to between 1.1 and 1.6%. European targets for greenhouse gas emissions can be reached, especially in the case of implementation of the proposed policies. As for renewable energy, the implementation of proposed policies is imperative for attaining the target, but likely to be insufficient. Current European targets for air pollutants are within reach. 2020 emission levels of most air pollutants are lower than the current 2010 National Emission Ceilings, with the exception of ammonia, where there is a substantial chance that the 2020 emissions will exceed the 2010 ceiling. However, ceilings are likely to become more stringent towards 2020.. 2. ECN-E--10-049.
(3) Contents List of tables. 5. List of figures. 6. List of boxes. 8. Summary. 9. S.1 S.2 S.3 S.4 S.5 S.6 S.7 S.8 S.9 S.10 S.11 S.12. Introduction Developments in energy use Developments in greenhouse gas emissions Policy Effects Clean and Efficient targets Greenhouse gases: -30% in 2020 compared to 1990 Renewable energy: 20% in 2020 Energy saving: avarage of 2% annually in 2011-2010 European targets Conclusions greenhouse gas emissions and energy Emissions of air-polluting substances Conclusions about air polluting substances. 9 10 10 11 12 13 14 14 14 15 15 16. 1.. Introduction 1.1 Objective and scope 1.2 Outline approach 1.3 Reading instructions. 17 17 17 18. 2.. Method and starting points 2.1 Policy variants 2.2 Uncertainty analysis 2.3 Demography and economy 2.4 Fuel and CO2 prices 2.5 Other. 19 19 19 21 24 28. 3.. Energy and CO2 3.1 Introduction 3.2 Industry 3.3 Traffic and transport 3.4 Households 3.5 Trade, Services and Government 3.6 Agriculture. 29 29 30 36 42 53 60. 4.. Energy supply 4.1 Electricity production 4.2 Decentralised CHP 4.3 Renewable energy 4.4 Refineries. 65 65 76 79 84. 5.. Other greenhouse gases 5.1 Introduction 5.2 Agriculture 5.3 Other greenhouse gases non agriculture. 89 89 91 94. 6.. Air polluting substances 6.1 Nitric oxides (NOx) 6.1.1 Stationary sources 6.1.2 Traffic and transport 6.2 Sulphur dioxides (SO2). ECN-E--10-049. 97 97 97 102 105. 3.
(4) 6.3. 6.4 6.5 7.. Volatile organic compounds (NMVOC) 6.3.1 Netherlands total 6.3.2 Industry, energy sector, refineries and waste processing 6.3.3 Traffic and transport 6.3.4 Households, TSG and agriculture Ammonia (NH3) 6.4.2 Agriculture Particulate matter 6.5.1 Introduction. Synthesis: Policy and objectives of climate and energy 7.1 Target range Clean and Efficient 7.1.1 Greenhouse gas emissions 7.1.2 Energy saving 7.1.3 Renewable energy 7.2 EU targets 7.3 Overview of policy effects 7.4 Looking ahead to 2030. 109 109 111 112 113 114 115 119 119 125 125 126 129 132 134 134 140. References. 143. Appendix A. Energy balances. 148. Appendix B B.1 B.2 B.3 B.4. Overview policy measures Clean and Efficient Traffic and transport Policy industry, energy and agriculture Policy for the built environment Policy for other greenhouse gases. 158 158 168 173 177. Appendix C. Emissions of greenhouse gases and air-polluting substances. 178. Appendix D Differences energy and greenhouse gases compared to previous projection. 182. Appendix E. Targets, tasks and realisations. 183. Appendix F. Oil extraction. 184. Appendix G List of abbreviations and glossary G.1 List of used abbreviations G.2 Glossary. 4. 186 186 189. ECN-E--10-049.
(5) List of tables Table S.1. Total greenhouse gas emissions, targets and realisations. 14. Table 2.1 Table 2.2. Population developments 2008-2020 according to CBS Number of households and distribution of number of households according to size Annual economic growth, disposable income and consumer expenditure Annual growth of the value added tax according to sector Uncertain factors CO2 emission industry (Mton) Uncertain factors electricity demand industry Uncertain factors CO2 emissions traffic and transport Uncertain factors biofuels traffic and transport Uncertain factors Electricity demand traffic and transport Summarising overview table: Energy use households in 2020? Uncertain factors CO2 emission Households Uncertain factors electricity demand households Uncertain factors renewable heating households Uncertain factors CO2 emission trade, services and government Uncertain factors electricity demand trade, services and government Uncertain factors CO2 emission agriculture Uncertain factors renewable heat agriculture Uncertain factors electricity demand agriculture Growth installed production capacity Northwest Europe New construction plans central capacity („electricity plants‟), 2008-2020 Net average electrical conversion efficiencies Uncertain factors CO2 emissions large-scale electricity generation Uncertain factors CO2 emission reduction decentralised CHP Renewable heating in case of implementation of intended policy Uncertain factors renewable electricity Uncertain factors renewable heat central Maximum allowed sulphur content of fuel oil for sea-going vessels Uncertain factors CO2 emission refineries Uncertain factors electricity demand refineries Detailed overview of the other GHG emissions (Mton CO2-eq) in 2007 and 2020 Uncertainties about other greenhouse gases agriculture Uncertainties other greenhouse gases other sectors Development of the NOx emission of stationary sources per sector Development NOx emission and emission trade Uncertainty in the NOx emission in 2020 The development of the SO2 emission of stationary sources per sector Economic and other uncertainties in the SO2 emission in 2020 Uncertainties Volatile organic compounds Uncertain factors NH3 emission Uncertainties in PM10 emissions from traffic Uncertainties PM10 emissions of agriculture Uncertainty in PM10 emissions of IER sectors Greenhouse gas emissions total, targets and realisation Greenhouse gas emission per sector, non-ETS Saving rate per sector. 21. Table 2.3 Table 2.4 Table 3.1 Table 3.2 Table 3.3 Table 3.4 Table 3.5 Table 3.6 Table 3.7 Table 3.8 Table 3.9 Table 3.10 Table 3.11 Table 3.12 Table 3.13 Table 3.14 Table 4.1 Table 4.2 Table 4.3 Table 4.4 Table 4.5 Table 4.6 Table 4.7 Table 4.8 Table 4.9 Table 4.10 Table 411 Table 5.1 Table 5.2 Table 5.3 Table 6.1 Table 6.2 Table 6.3 Table 6.4 Table 6.5 Table 6.6 Table 6.7 Table 6.8 Table 6.9 Table 6.10 Table 7.1 Table 7.2 Table 7.3. ECN-E--10-049. 22 23 24 36 36 40 41 41 48 51 51 51 59 59 64 64 64 66 68 74 75 78 83 84 84 85 87 88 90 94 96 99 99 100 107 107 110 114 121 123 124 126 128 130. 5.
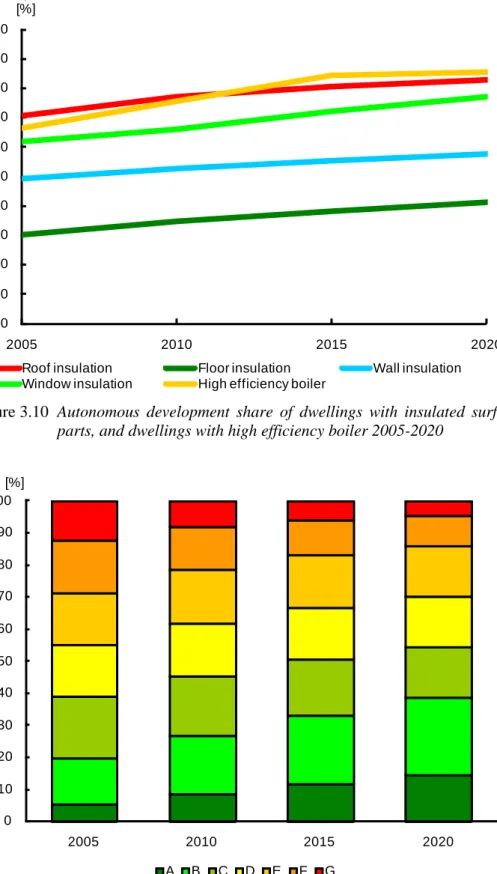
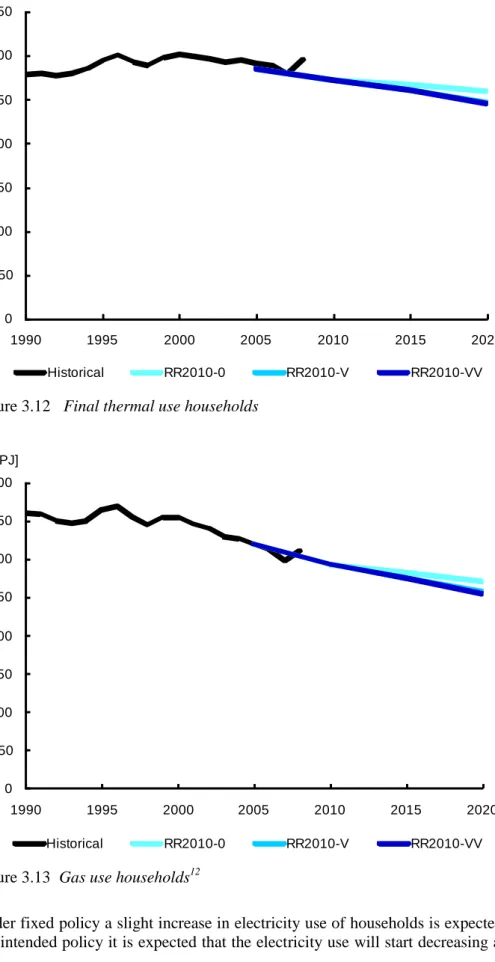
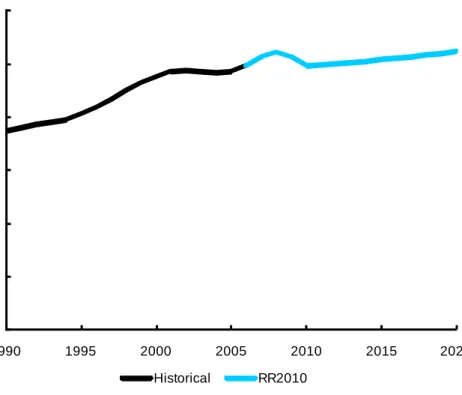
(6) Table A.1 Table A2 Table A.3 Table A.4. Energy balance 2008 corrected for climate Energy balance 2020 without new national and European policy since 2007 Energy balance 2010 under fixed national and European policy Energy balance 2010 upon implementation of intended national and European policy Table A.5 Energy balance 2015 without new national and European policy since 2007 Table A.6 Energy balance 2015 under fixed national and European policy Table A.7 Energy balance 2015 upon implementation of intended national and European policy Table A.8 Energy balance 2020 without new national and European policy since 2007 Table A.9 Energy balance 2020 under fixed national and European policy Table A.10 Energy balance 2020 upon implementation of intended national and European policy Table B.1 Traffic and transport policy Table B.2 Policy industry, energy and agriculture Table B.3 Policy for the built environment Table B.4 Policy for other greenhouse gases Table C.1 Greenhouse gas emission per sector, including temperature correction, excluding land use, land use change and forestry (LULUCF) and international bunkers Table C.2 Other greenhouse gases per substance Table C.3 Air-polluting emission per sector Table F.1 Oil extraction in the Netherlands, historical and forecast. 148 149 150 151 152 153 154 155 156 157 159 168 173 177. 178 179 180 184. List of figures Figure S.1 Figure S.2 Figure S.3 Figure S.4 Figure S.5. Energy mix 2005-2020 Greenhouse gas emissions Policy effects greenhouse gas emissions per sector and category of measures Clean and Efficient: targets and realisations Emissions NEC substances and targets 2010. Figure 2.1 Figure 2.2 Figure 3.17 Figure 3.1 Figure 3.2 Figure 3.3 Figure 3.4 Figure 3.5 Figure 3.6 Figure 3.7 Figure 3.8 Figure 3.9 Figure 3.10. Indicational breakdown of marginal prices per user category for natural gas 26 Indicational breakdown of marginal prices per user category for electricity 26 Target range More with Less covenant 52 Distribution primary energy according to sector, 2008 29 Distribution of greenhouse gas emissions according to sector, 2008 30 Distribution of CO2 emissions according to industrial sector, 2008 30 Distribution industrial primary use according to sector, 2008 31 Primary energy use industry 1990-2020 33 Final electricity use industry 1990-2020. 33 Final thermal use industry 1990-2020 34 CO2 emissions traffic and transport 38 Number of households and dwellings 43 Autonomous development share of dwellings with insulated surface construction parts, and dwellings with high efficiency boiler 2005-2020 44 Autonomous development energy labels dwellings 2005-2020 44 Final thermal use households 47 Gas use households 47 Final electricity use households1990-2020. 48 Primary energy use households 49 CO2 emissions households 50. Figure 3.11 Figure 3.12 Figure 3.13 Figure 3.14 Figure 3.15 Figure 3.16. 6. 10 11 12 13 15. ECN-E--10-049.
(7) Figure 3.17 Figure 3.18 Figure 3.19 Figure 3.20 Figure 3.21 Figure 3.22 Figure 3.23 Figure 3.24 Figure 3.25 Figure 3.26 Figure 4.1 Figure 4.2 Figure 3.3 Figure 4.4 Figure 4.5 Figure 4.6 Figure 4.7 Figure 4.8 Figure 4.9 Figure 4.10 Figure 4.11 Figure 4.12 Figure 4.13 Figure 5.1 Figure 5.2 Figure 5.3 Figure 5.4 Figure 6.1 Figure 6.2 Figure 6.3 Figure 6.4 Figure 6.5 Figure 6.6 Figure 6.7 Figure 6.8 Figure 6.9 Figure 6.10 Figure 7.1 Figure 7.2 Figure 7.3 Figure 7.4 Figure 7.5 Figure 7.6 Figure 7.7 Figure 7.8 Figure 7.9 Figure 7.10 Figure 7.11 Figure 7.12 Figure 7.13 Figure F.1. Development of labour volume in FTE in the TSG sector Final thermal use TSG Gas use TSG Final electricity use TSG Primary energy use TSG CO2 emission TSG Fossil energy use in agriculture Final thermal energy use agriculture Development of CO2 emissions in agriculture Final electrical consumption agriculture Finale electricity demand Netherlands Installed capacity in the Netherlands Production mix, distributed into nuclear, coal, gas and renewable Fuel use in the Dutch electricity production Import/export balance Netherlands CO2 emissions electricity plants CHP capacity, including renewable CHP CHP electricity production, including renewable CHP Avoided primary energy through renewables Electricity production from renewable sources Heat production from renewables Energy consumption refineries CO2 emission in the policy variants Distribution other greenhouse gases, 2008 Development of total emission of other greenhouse gases in the Netherlands Development emission of other greenhouse gases in agriculture Development emission of other greenhouse gases non agriculture Development of NOx emission Netherlands total Development of the NOx emission of stationary sources Development of NOx emissions in traffic and transport Development of SO2 emission Netherlands total The development of the SO2 emission of stationary sources Share in total NMVOC emissions in 2007 per sector Development of NMVOC emission in the Netherlands 1990-2020 Development of NH3 emission Netherlands total Distribution of PM10 emissions according to sector, 2007 Development of PM10 emission Netherlands total Target range Clean and Efficient Non-ETS emissions per sector Energy saving rate per sector Avoided primary energy by renewable energy, divided into type. Uncertainties in intended policy are mainly linked to the lower end. Shares of energy carriers 2005-2020 User balance of fossil fuels Total greenhouse gas emissions Total effect Clean and Efficient policy Effects fixed Clean and Efficient policy Effects of Clean and Efficient policy in the non-ETS sectors Effects of Clean and Efficient policy in the ETS sectors Development of CO2 emissions 1990-2030 Effects of Clean and Efficient policy in the period 2020-2030 Development of the oil extraction in the Netherlands [PJ]. ECN-E--10-049. 53 55 56 57 57 58 62 62 63 63 65 70 71 71 72 74 77 78 81 82 83 86 87 89 90 93 95 97 98 102 105 106 109 110 114 120 120 125 129 130 133 135 136 136 137 138 139 139 141 142 185. 7.
(8) List of boxes Box 2.1 Box 2.2 Box 2.3 Box 2.4 Box 3.1 Box 3.2 Box 3.3 Box 4.1 Box 4.2 Box 4.3 Box 4.4 Box 6.1 Box 7.1 Box 7.2 Box 7.3 Box 7.4 Box 7.5. 8. Settlement: dealing with targets in the end year Similarities and differences with the medium term projection of CPB The effect of the dollar rate on the oil price The impact of CO2 and fuel prices on energy use and emissions The effect of covenants New insights may result in setbacks Target range More with Less Integration of large-scale wind energy deployment Comparison projection prices 2010-2013 with forward prices Policy starting points SDE SDE and EEG: A comparison of premium and tariff systems Development ammonia emission until 2010 and 2015 Targets and realisations greenhouse gas emission and the position of the ETS A closer look at the Dutch energy saving target Conflicting targets I: Renewable energy and energy saving Conflicting targets II: The role of ETS The definition of renewable energy in the Netherlands according to the Dutch and European target. 20 23 24 26 35 39 51 73 75 79 80 119 126 129 131 131 132. ECN-E--10-049.
(9) Summary S.1. Introduction. In this Reference projection the development of energy use and greenhouse gas emissions and other air-polluting substances in the Netherlands are mapped for the period until 2020. It takes into account the economic recession of 2009 and 2010 and a moderate growth of the economy in the period 2011-2020. This Reference projection contains the current insights and anticipated energy prices and the price of CO2 emission allowances. Recent policy changes and new insights in emission factors are also included. Uncertainties with regard to economic growth, price developments and effectiveness of policy are expressed by means of uncertainty bandwidths. The previous Reference projection of 2005 and the update of 2009 only sketched the developments under fixed policy conditions. The current projection is dedicated to the working programme Clean and Efficient, which is still partly in the intended policy stage. The projection maps the effect of the working programme Clean and Efficient, including European Policy as of 2007. The projection shows how energy demand, the share of renewable energy and the emissions of greenhouse gases will evolve in the medium term for three policy variants: (1) without the new national and European policy as of 2007; (2) with fixed national and European policy, and (3) implementation of the intended national and European policy. The elaboration and implementation of intended policy is uncertain, which is partly due to the fall of the Balkenende IV cabinet. A comparison of the projection with the policy objectives will show if, in what areas and to what extent the policy is insufficient. The variant addressing performances for fixed policy (RR2010-V) sketches the expected policy gap in 2020. The variant for intended policy (RR2010-VV) shows to what extent the intended policy of the Balkenende IV cabinet would close the policy gap. This projection is not an outlook that examines all conceivable policy options. However, it can be used as a starting point for searching additional policy that can be used to realise the targets after all. Part of this study is dedicated to projecting the anticipated emissions of air polluting substances: nitrogen oxides (NOx), sulphur dioxide (SO2), ammonia (NH3), particulate matter and volatile organic compounds (NMVOC). These substances are covered by the European Emission Ceiling and are also called NEC substances (national emission ceiling). The projection of these substances is based on fixed policy only.. ECN-E--10-049. 9.
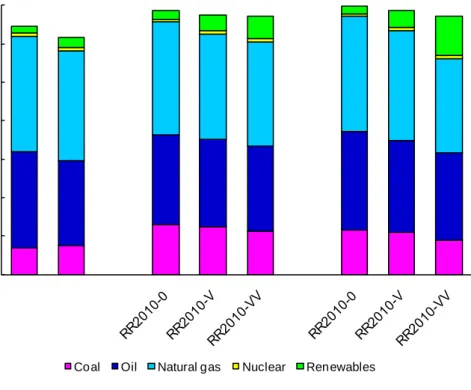
(10) S.2. Developments in energy use [PJ] 2005. 2010. 2015. 2020. 3500 3000 2500 2000. 1500 1000 500 0. Coal. Oil. Natural gas. Nuclear. Renewables. Figure S.1 Energy mix 2005-2020 The energy use in the Netherlands decreased between 2005 and 2010, which was partly due to the economic recession. After that period, there is a distinct increase in anticipated energy use. Especially the use of coal will increase significantly between 2010 and 2015 as a result of new electricity plants that will enter into operation. As more policy is implemented, the increase in energy use will be more modest and the share of renewable energy will increase significantly (Figure S.1; RR2010-VV). Among other things, the implementation of intended policy will lead a total fossil fuel use in 2020 that is about 100 PJ lower than in 2010.. S.3. Developments in greenhouse gas emissions. Fluctuations in energy use affect the greenhouse gas emissions: there is a decrease until 2010 and an increase between 2010 and 2015 as a result of new electricity plants that will enter into operation.. 10. ECN-E--10-049.
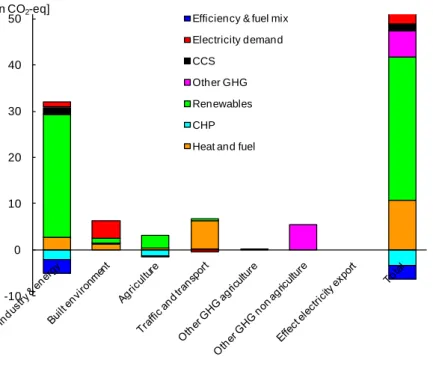
(11) [Mton CO2 eq] 250. 200. 150. 100. 50. 0 1990. 1995 Historical. 2000 RR2010-0. 2005. 2010 RR2010-V. 2015. 2020. RR2010-VV. Figure S.2 Greenhouse gas emissions 1990-2020 With fixed policy the projected greenhouse gas emissions in 2020 amount to 219 (198-229) Mton CO2 equivalents (Figure S.2; RR2010-V). Roughly speaking the emissions have stabilised compared to 1990. Without Clean and Efficient policy the emission in 2020 would have amounted to 237 (217249) Mton CO2 equivalents (Figure S.2; RR2010-0). If intended policy is implemented, greenhouse gas emissions in 2020 will decrease to 193 (174-207) Mton CO2 equivalents (Figure S.2; RR2010-VV). The emissions of this variant decrease particularly after 2015. The only clear decrease in the emission development trend can be seen when intended policy is implemented (Figure S.2). No conclusions can be drawn about target range based on the above-mentioned developments in emissions (see Section S.6).. S.4. Policy Effects. The total effect of the Clean and Efficient policy is an emission reduction of over 44 Mton. Almost 19 Mton can be ascribed to the fixed Clean and Efficient policy and about 26 Mton can be ascribed to intended policy. Figure S.3 shows the contribution of the various measures and sectors to the total policy effect of 44 Mton. The largest contribution is provided by the intended production of renewable energy, followed by decreased fuel demand from traffic, reductions of other greenhouse gases and a lower electricity demand in the built environment. Some smaller negative side effects can also be observed: deployment of CHP is limited due to the increase in renewable energy and heat and lower electricity demand.. ECN-E--10-049. 11.
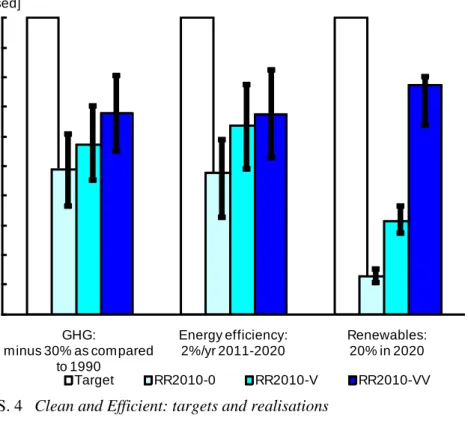
(12) [Mton CO2-eq] 50. Efficiency & fuel mix Electricity demand. 40. CCS Other GHG. 30. Renewables CHP. Heat and fuel. 20. 10. 0. -10. Figure S. 3 Policy effects greenhouse gas emissions per sector and category of measures. S.5. Clean and Efficient targets. The Balkenende IV cabinet has the following targets: Decrease the greenhouse gas emissions with 30% in 2020 compared to 1990. Increase the energy saving pace to on average 2% annually in the period 2011 to 2020. Increase the share of renewable energy to 20% in 2020. Figure S.4 illustrates the three separate targets and the expected realisations for the three policy variants.. 12. ECN-E--10-049.
(13) [% of target realised] 100 90 80 70 60 50 40 30 20 10 0 GHG: Energy efficiency: minus 30% as compared 2%/yr 2011-2020 to 1990 Target RR2010-0 RR2010-V. Renewables: 20% in 2020 RR2010-VV. Figure S. 4 Clean and Efficient: targets and realisations. S.6. Greenhouse gases: -30% in 2020 compared to 1990. The Dutch target of 30% reduction compared to 1990 corresponds to an emission target of 150 Mton in 2020. Part of the greenhouse gas emissions in the Netherlands is produced by sectors covered by the European emission trading system (ETS) as a result of European legislation. These ETS sectors include electricity plants, refineries and the largest part of industry. A European emission ceiling will enter into force as of 2012. The main non ETS sectors are traffic, the built environment and part of agriculture. The Balkenende IV cabinet declared that the reduction target of 30% applies both to ETS and to non ETS sectors, separately. This results in an emission target of 63 Mton for ETS sectors and 87 Mton for non ETS sectors. As the ETS allows companies to trade their emission allowances, additional emission reduction within ETS sectors in the Netherlands will not result in additional emission reductions in Europe. After all, the European emission ceiling is fixed. Therefore, the Balkenende IV cabinet decided to book the 21% reduction compared to 2005 as agreed upon in Europe for the Dutch emissions covered by the ETS, regardless of whether or not the actual reduction is realised within the Netherlands. This means that the realisation of the Dutch ETS businesses for the target is fixed at 75 Mton, regardless of the actual emission. Only the emission reduction outside the ETS sectors can make direct contributions to the national greenhouse gas emission target. As for the effect of fixed policy, 13 Mton of the total effect of 19 Mton of emission reduction is covered by the ETS. Over 5 Mton is not covered by non ETS, thus contributing to the national emission target. If intended policy would be implemented, the amount of emission reduction outside the ETS would increase to 12 Mton. As the realisation of the ETS businesses is fixed at 75 Mton, the policy deficit in the ETS sectors is 12 Mton by definition. The policy deficit in the non ETS sectors amounts to 16 Mton when fixed policy is implemented and will decrease to 9 Mton when intended policy is implemented (see Table S.1).. ECN-E--10-049. 13.
(14) Table S.1 Total greenhouse gas emissions, targets and realisations No C&E* policy Fixed policy Intended policy Target 2020 Emission greenhouse gases (physical) 2020 [Mton CO2 eq] ETS 130 116 Non ETS 108 102 Total 237 219 Realisation greenhouse gases 2020 [Mton CO2 eq] ETS 75 75 Non ETS 108 102 Total 183 177 Policy deficit [Mton CO2 eq] ETS 12 12 Non ETS 21 15 Total 33 27 *. 97 96 193 75 96 171. 63 87 150. 12 9 21. Clean and Efficient.. S.7. Renewable energy: 20% in 2020. The renewable energy target amounts to a share of 20% of total energy demand in 2020. The main policy instrument for achieving this target is the renewable energy subsidy scheme SDE, a subsidy scheme for the production of renewable energy. In fixed policy, the budget for the SDE scheme amounts to about 1 billion euro annually, including obligations from the former subsidy scheme environmental quality of electricity production (MEP). Based on the subsidy amount, the share of renewable energy will amount to about 6% (190 to 240 PJ). The intended expansion of the SDE subsidy scheme will result in a renewable energy share of about 15% (440 to 500 PJ). The required subsidy finance will increase to 3 to 4 billion euro annually in 2020. The 20% renewable energy target will not be achieved this way.. S.8. Energy saving: average of 2% annually in 2011-2020. Energy demand is partly influenced by the energy saving pace. Without Clean and Efficient policy the pace will not go higher than 0.7 to 1.2% annually. In case of implementation of fixed policy, the energy saving pace amounts to 1 to 1.5% annually between 2010 and 2020. Implementing intended policy will increase the energy saving pace to 1.1 to 1.6%. The annual 2% target will thus not be achieved. The energy saving pace will increase especially in the built environment and the transport sector, both in the variant with fixed and the variant with intended policy. In the built environment this is mainly the result of the European standards for electrical appliances resulting from the Ecodesign guideline. In transport, the tightening of the European CO2 standardisation of vehicles has led to decreased fuel consumption. This trend is enhanced by the national fiscal incentives for buying energy efficient cars.. S.9. European targets. The European Commission requires the Dutch sectors that are not covered by the emission trading scheme to reduce their greenhouse gas emissions with 16% in 2020 compared to 2005. The fixed policy will probably not suffice to meet the European emission target. By implementing intended policy, the target will most likely be realised.. 14. ECN-E--10-049.
(15) On top of that, there is also a renewable energy target of 14% of heat, transport fuels and electricity demand. Realising the 14% renewable energy target also requires implementation of intended policy. Given the uncertainties with regard to the policy effects, the implementation of intended policy does not guarantee that the target will be realised.. S.10 Conclusions greenhouse gas emissions and energy The greenhouse gas emissions and energy use in the Netherlands will only decrease in absolute terms compared to 1990 if intended policy is implemented. This is also necessary to meet the European targets set for the Netherlands. Still, full implementation of intended policy is insufficient to meet the Schoon en Zuinig targets.. S.11 Emissions of air-polluting substances The emission of air-polluting substances partially relates to energy use, but it also depends on other factors. For example, the emission of ammonia mainly depends on the number of animals and the use and storage of manure.. [kton] 600. 500. 400. 300. 200. 100. 0 1990. 1995. 2000. 2005. NOx. SO2. NH3. 2010 NMVOC. 2015. 2020. PM10. Figure S. 5 Emissions NEC substances and targets 2010. Nitrogen oxides (NOx) The current EU target for NOx emissions as of 2010 amounts to 260 kton. Between 2010 and 2020 the NOx emission will decrease with 30%. The projected emission of NOx in 2020 amounts to 185 kton (bandwidth 162-224). This is mainly due to the decreasing NOx emission in traffic. Although the traffic volume increases with about 20%, the European emission standard for passenger cars and lorries results in an emission reduction by a factor 2 to 3 per driven kilometre.. ECN-E--10-049. 15.
(16) Sulphur dioxide (SO2) The current EU target for SO2 emission amounts to 50 kton as of 2010. The projected emission of SO2 in 2020 amounts to 46 kton (bandwidth 41 – 49). The SO2 emission increases with 10% between 2010 and 2020. The main sectors contributing to the SO2 emissions include the industry, refineries and the electricity sector. Until 2010 the emissions in industry and refineries decreased, which was mainly due to the economic recession. From 2010 onwards emissions start increasing again in industry due to economic growth. The emissions of refineries stabilize between 2010 and 2020 as a result of the implementation of the sector ceiling. In the electricity sector, the emissions increase due to expansion of generation capacity (new electricity plants). The emissions stabilize between 2015 and 2020 as a result of the implementation of the sector ceiling.. Ammonia (NH3) As of 2010, the EU ceiling for NH3 emissions amounts to 128 kton. The projected NH3 emission amounts to 118 kton in 2020 (bandwidth 102-138), 102 kton of which is emitted by agriculture. Between 2010 and 2020 the NH3 emission decreases with about 10%. Due to market developments the total livestock is expected to stabilize roughly at the level of 2007. Some differences can be noticed at the level of specific animal species. The reduction in NH3 emission is mainly realised due to additional requirements for stables.. Particulate matter (PM10) The particulate matter emission (PM10) remains more or less stable between 2010 and 2020. The projected PM10 emission in 2020 amounts to 29 kton (bandwidth 25-35). There is no EU target for PM10 emissions. Industry, traffic and agriculture make the largest contributions to the emission. In industry the emission increases, following the pattern of economic developments. The emission in traffic decreases due to the use of soot filters. Agriculture shows a mixed picture: on the one hand the emission increases due to housing requirements in view of animal welfare; on the other hand new companies or companies that expand are required to take additional emission reduction measures, which leads to a reduction in the emission. On balance, the emission in agriculture in 2020 is about the same as in 2010. This projection has also mapped the emission of ultrafine particles (PM2.5). As their emission data are derived from the PM10 data, their development is more or less the same.. Volatile organic compounds (NMVOC) The NMVOC emission increases with a few percent between 2010 and 2020 and amounts to 149 kton in 2020 (bandwidth 132-168). The EU target amounts to 185 kton as of 2010. Especially the emissions from traffic and the energy sector decrease. This decrease is contrasted by an increase in emission by all other actors. The consumer emissions show the largest increase as a result of the use of cosmetics and other care products, paint and cleaning products.. S.12 Conclusions about air polluting substances The current EU ceilings for air-polluting substances are within reach. The insights gained during this projection learn that in case of implementation of fixed policy the projected emissions of most substances in 2020 are lower than the current EU ceilings. One exception is NH3, which has a ceiling in the projected bandwidth, which could result in 2020 emissions that are higher than the ceiling. The EU ceilings will be tightened before 2020.. 16. ECN-E--10-049.
(17) 1.. Introduction. 1.1. Objective and scope. This Reference projection provides insight in the expected developments in energy and emissions up to 2020 in support of Dutch energy, climate and air policy. It provides answers to the questions if the national policy objectives for 2020 are within reach and if the Netherlands will be able to comply with the European obligations. Both the European and Dutch authorities have formulated policy objectives for the amount of greenhouse gas emission, the emission of airpolluting substances, the share of renewable energy and the energy saving pace in the Netherlands. This report helps assess if targets are within reach and provides a reference in preparation of new policy. The main reason for publishing this new Reference projection was the policy process of the Clean and Efficient (Schoon en Zuinig) programme. The Dutch Minister of Housing, Spatial Planning and the Environment planned on reporting to the Dutch Lower Chamber about the progress in this dossier in the spring of 2010 and to announce additional policy measures to realise the targets, if needed. The policy process of Clean and Efficient is at a standstill now that the Dutch cabinet has resigned and the additional policy package will only be sent to the Chamber for information purposes. This projection can now serve as preparation of possible policy amendments by a new Cabinet. Apart from the above-mentioned reason for publishing a new Reference projection, ECN and PBL periodically update the Reference projection because insights about future expectations are subject to change. The energy and climate targets for 2020 can be characterised as intermediate targets. Limiting the global temperature rise to two degrees requires drastic emission reduction in the long term, including in the Netherlands. This report does not address the question to what extent the 2020 targets and the measures implemented for realizing these targets fit in the long-term perspective. Neither does this report analyse which policy options are conceivable. This projection only presents the effects of fixed and intended policy as announced by the Balkenende IV Cabinet. The costs of fixed and intended policy have not been calculated either. The question if the fixed or intended policy measures constitute a cost-effective policy package is thus outside the scope of this projection.. 1.2. Outline approach. To be able to sketch an image of the energy and emission developments in 2020, an image of the demographical and economic development is needed first. Demographical developments influence the economic developments (potential labour force) but they are also relevant for the number of dwellings, for example. A macro view is given on the economic developments until 2020. This view is subsequently translated into volume developments in sectors. The energy use and the volume of emissions depend on the amount of goods and services that is produced and consumed. In addition, projections are made for the energy prices. Policy also influences the deployment of energy and the amount of emissions, i.e. European and Dutch energy and climate policy. A significant outcome of the European climate policy is the price for CO2 emission allowances. Among other things. The emission of the so-called other greenhouse gases is barely related to energy use. In agriculture, the volume of the livestock is an important variable for the emission of the greenhouse gases methane and nitrous oxide. The livestock volume also influences the NH3 emissions significantly. Combining the demographical and economic developments and the resulting volume developments for 2020 with the energy and CO2 prices and the effect of policy results in a. ECN-E--10-049. 17.
(18) background view for establishing the energy use and emission volume. Including specific developments in sectors, the deployed fuel mix and the emission factors results in an overall picture of the emission. This projection presents not only the energy and emission projection under fixed policy conditions; it also maps the expected effects of intended Clean and Efficient policy. To interpret the effects of the total Clean and Efficient policy package, the projection shows how the emissions would have developed without Clean and Efficient Policy. The air-polluting emissions are only projected under fixed policy conditions. The projection can be characterised by a business as usual image: except for changes in policy, this projection assumes trend wise developments. As the future is surrounded by uncertainties by definition, the projection also maps the uncertainties of the main assumptions and translates them into effects on energy use and emissions. The uncertainties are ultimately presented as a bandwidth reflecting a 90% reliability interval.. Differences with previous projection This new projection differs in many ways from the previous Reference projection (ECN/PBL, 2005), which was updated most recently in 2009 (ECN/PBL, 2009). Beside the changes in policy, this projection is based on calculations with different prices and economic growth. It also includes the latest insights in emission factors. As the Reference projection results from an integral calculation, it is difficult to derive the exact effect of the separate factors. In Appendix D the main differences are interpreted roughly.. 1.3. Reading instructions. This report describes the assumptions and provides an outline explanation of the results of the projected emissions. Background reports will be published about several subjects, containing more detailed information. Nevertheless, the report elaborates several subjects because certain details are relevant for interpreting the results. These elaborations are usually incorporated in text boxes. A text box thus contains more in-depth information or additional explanation of a subject. Chapter 2 addresses the used method and the general starting points of this report. Chapter 3 describes the energy and CO2 developments per sector. Chapter 4 addresses the question what the energy supply will look like in 2020. Chapter 5 subsequently discusses the development of the other greenhouse gases and Chapter 6 describes the development of the air-polluting substances. Chapter 7 is a synthesis chapter in which the effects of the Clean and Efficient policy are analysed. Such a synthesis on air policy is not included in this report.. 18. ECN-E--10-049.
(19) 2.. Method and starting points. 2.1. Policy variants. Political decision-making is a continuous process. Not all policy included in this projection has the same status. Fixed policy, which has completed the political decision-making stage, is the most certain policy. But new energy and climate policy has also been announced. Political decision-making in this so-called intended policy has not yet been completed which makes the effects of the intended policy inherently more uncertain. The Balkenende IV Cabinet planned on implementing road pricing, but the resignation of the Cabinet unsettled these plans. Therefore this Reference projection distinguishes policy variants, i.e. a variant that maps only the effects of fixed policy and a variant that maps the effects of fixed and intended Clean and Efficient policy. To be able to interpret the total effect of Clean and Efficient policy, there is also a variant without Clean and Efficient policy. A full policy overview is included in Appendix B. The chapters discuss only the policy components that have a substantial effect and do not aim to be exhaustive. The starting points of the fixed policy are as much as possible derived from public documents and discussed with involved ministries if needed. All policy that passed the decision-making stage by October 2009 will be considered fixed policy. The intended Clean and Efficient policy is primarily derived from the working programme Clean and Efficient and supplemented by other proposed measures for energy and climate policy, such as the surcharge on the electricity price to generate additional funding for subsidizing renewable energy. In those cases where intended policy lacked concreteness the ministries have indicated which implementation this Reference projection should use. All policy variants use the same assumptions for economy, demography and energy and CO2 prices. The only difference is the assumed policy. In the figures and tables of this report the three policy variants are indicated by abbreviations (1) RR2010-0, which is the variant without Clean and Efficient policy; (2) RR2010-V which is the variant with fixed policy; and (3) RR2010-VV which is the variant with fixed and intended Clean and Efficient policy. One exception is constituted by the air-polluting substances; their emissions were only projected under fixed policy conditions.. 2.2. Uncertainty analysis. The projection also maps the main uncertainty factors and their influence on energy use and emissions. The uncertainties with regard to general assumptions about economy, demography and energy and CO2 prices are translated into an uncertainty in energy use and emissions per sector. Moreover, the characteristic uncertainties per sector have also been mapped. These different uncertainty factors were used to calculate the bandwidths in energy use, emissions, saving pace and amount of renewable energy. This was done for the Netherlands, and for the separate sectors, if relevant. This report does not discuss the assumptions and results of the uncertainty analysis separately, but as part of the description of the sector, target range, policy, etcetera. Unless stated otherwise, the uncertainties apply to all three policy variants. The bandwidth applies to the variant with fixed policy; the bandwidth of the other two variants may show slight deviations. In case of large deviations, the bandwidth for the variant is mentioned separately.. ECN-E--10-049. 19.
(20) Policy related uncertainties are important. The mapped policy uncertainties do not include the implementation of policy, but only the uncertainties in the effects of policy, given the policy starting point. The uncertainties do not bear upon the exact implementation of policy such as the exact standard, the available budget, etcetera. The policy uncertainties do include the uncertainties in the effect realised by policy in view of a certain standard, budget, etcetera. The reason why only this uncertainty is included in effects is the fact that interpretation of policy is not an uncontrollable external uncertainty but a choice of the Cabinet. The uncertainty analysis also takes into account the uncertainties in the monitoring of emissions. On the one hand, this uncertainty depends on year after year of fluctuations as a result of weather conditions, for example. On the other hand, fluctuations may arise because emissions are difficult to establish by definition. In case of some substances the monitoring uncertainty is substantial and very determinant for the total uncertainty bandwidth. This is mainly the case with other greenhouse gases and NMVOC (see Chapter 5, Section 6.3 and Text box 2.1 (Settling the account: dealing with targets in the end year). In the illustration of uncertainties in the tables, the bottom value of the bandwidth reflects a low value of the uncertain factor and the top value reflects a high value of the bandwidth. This could mean that the top has a negative value. A high CO2 price will for example lead to lower emissions. Box 2.1 Settlement: dealing with targets in the end year 2020, a cold year with little wind. Heating of dwellings and offices requires more gas than in an average year. Therefore the CO2 emissions are higher than usual. The wind energy yield is lower than usual. Is this a major setback for realising the energy and climate targets? Year after year of fluctuations in emissions constitutes uncertainty for the realisation of the targets. If these fluctuations are not controllable, there are ways to include them in the verification of the targets. Examples include a multi-annual accounting period and normalization. Multi-annual settlement period Realisation of the Kyoto target is verified based on the emissions of the period 2008-2012. This diminishes the role of accidental fluctuations: they are expected to more or less balance each other out in a multi-annual period. Normalisation If fluctuations are (largely) linked to measurable factors, this will make it possible verify them with normalized realizations. In this process realizations are translated into standard situations. This way, energy used that is corrected for degree days can be translated into the use in an average year and the production of wind energy can be adjusted with correction for wind speed. How do Clean and Efficient and the Reference projection deal with uncertainties resulting from annual fluctuations? The work programme Clean and Efficient does not provide explicit information on how it deals with the uncertainties of the annual fluctuations. The Reference projection assumes that these fluctuations will be tested against normalised emissions and energy use, whenever possible. The calculated values are already based on standard assumptions for temperature, wind supply, etcetera. Uncertainties resulting from annual fluctuations have not been taken into account for these factors. 20. ECN-E--10-049.
(21) 2.3. Demography and economy. Demographical and economic developments The environmental load in the period 2010-2020 has been calculated against a background of demographical and economic development, based on a most realistic estimate. Demographical developments were derived from prognoses made by CBS (Statistics Netherlands) about the population size and the development of the number of households. The macro-economic growth is based on the structural growth of the labour productivity of 1.7% annually, as used by CPB (Netherlands Bureau for Economic Policy Analysis) for long-term studies, and on an estimate of the growth of the working population.. Population size The population size is based on the most recent population prognosis of CBS (van Duin, 2009). According to this prognosis the population size will increase from 16.4 million in 2008 to 17.0 million in 2020 (Table 2.1.), an average annual growth of 0.3%. The population growth is decreasing: in the last decade the annual growth rate 0.5%. The CBS also provides an uncertainty bandwidth for the population size in 2020, but it uses a reliability interval that differs from the reliability interval of 90% that we use here. From the CBS reliability interval a bandwidth can be derived for the 90% reliability interval. This bandwidth would range from 16.5 million to 17.5 million persons. Despite the expected increase in population size, the potential working population (the number of persons aged 15 to 65) will decrease by 0.1% annually in the next decade. This is a unique development in the history of the Netherlands. Despite the fact that the total number of persons younger than 65 decreases, the number of persons aged 15 to 34 increases with 0.4% annually up to 2020 (Table 2.1). This is partly the result of continued immigration, A large share of the immigrants are aged 15 to 35 years. The number of persons older than 65 will increase from 2.4 million persons in 2008 to 3.4 million persons in 2020. The share of persons older than 65 in the total population will increase from 14.7% in 2008 to 19.7% in 2020. Table 2.1 Population developments 2008-2020 according to CBS. Total population 0-14 years 15-34 years 35-64 years 65+ years Potential working pop.1. 2008 [mln] 16.4 2.9 4.0 7.1 2.4 11.1. 2010 [mln] 16.5 2.9 4.0 7.1 2.5 11.1. 2020 [mln] 17.0 2.7 4.2 6.7 3.4 10.9. Annual growth 2008-2020 [%] 0.3 -0.6 0.4 -0.4 2.8 -0.1. Households According to the CBS households prognosis the number of persons per household will further decrease in the next years. The average number of persons in a private household will decrease from 2.24 in 2008 to 2.14 in 2020 (van Duin en Loozen, 2009). As a result, the number of households will increase from 7.2 million in 2008 to 7.9 million in 2020. The uncertainty bandwidth for the number of households in 2020 is 7.3 to 8.5 million.. 1. The potential working population is the total population of the age group 15-65 years.. ECN-E--10-049. 21.
(22) Table 2.2 Number of households and distribution of number of households according to size Annual growth 2008 2010 2020 2008-2020 [%] [mln] [mln] [mln] Population size 16.41 16.54 17.01 0.3 Total number households 7.24 7.35 7.86 0.7 Single person households 2.57 2.64 3.01 1.3 Multiple persons households 4.67 4.72 4.85 0.3 Average household size 2.24 2.22 2.14 -0.4. Macro-economic developments The Reference projection assumes a structural growth of the economy that is based on the structural growth of labour productivity and on employment growth. As for labour productivity, CPB assumes a structural growth of 1.7% annually (CPB, 2006). Employment will be addressed at a later stage. The Reference projection takes into account the impact of the credit crisis, which caused economic shrinkage in 2009 and 2010. The Reference projection uses the economic prognoses for 2009 and 2010 provided by the Centraal Economisch Plan 2009 of CPB (CPB, 2009). At that time, CPB anticipated an economic shrinkage of 3.5% for 2009 and ¼% for 20102. The negative economic growth of 2009 and 2010 also affects the growth in subsequent years. Due to the credit crisis unemployment will rise and due to higher unemployment the wages will increase more slowly. The lower growth in labour costs means that businesses will be less inclined to invest in higher labour productivity to save costs. This will put the growth in labour productivity under pressure. In the period 2011-2020 the average annual growth of labour productivity is therefore below the structural level at an estimated growth rate of 1.4% annually. As a result of this lower growth of labour productivity less employment loss will occur and in 2020 unemployment will decrease to the average level of the last decade.. Employment Employment depends on demand and supply of labour. The development of labour supply (i.e. the working population) depends on the development of the potential working population and the increase the labour productivity. The potential working population will decrease with 0.1% annually between 2011 and 2020. Employment is expected to increase in the next years. However, due to the higher unemployment that resulted from the credit crisis this increase will be modest. An annual growth of employment of 0.1% does not change the size of the working population between 2011 and 2020. The unemployment that arose because of the credit crisis will be solved by 2020 and return to a normal level. This means that employment will increase with 0.3% annually in the period 2011-2020. The average economic growth between 2011 and 2020 is estimated at 1.7% annually (Table 2.3.) based on an annual growth in labour productivity of 1.4% and a growth of employment of 0.3% annually. In the past the growth of labour productivity and employment fluctuated significantly from one year to the next. Over a longer period of time the average fluctuation is less significant. Taking 2. After that CPB provided new quarterly forecasts for the economic growth in 2009 and 2010. The adjustments of June 2009 and September 2009 showed a rather gloomy picture, but more recent forecasts, i.e. the Centraal Economisch Plan of March 2010 (CPB, 2010a) anticipates -4% for 2009 and +1.5% for 2010. The depth of the economic recession thus seems to be less profound compared to the previous projection. The Reference projection was almost finished when the most recent CPB forecast was published. The CEP forecast of 2009, which was used for this Reference projection, seems to be nearest to the CPB forecast compared to the other forecasts that were published. The changes in emissions resulting from the latest economic insights are limited and stay within the bandwidth that is used.. 22. ECN-E--10-049.
(23) into account the fluctuations in the past, this Reference projection assumes a bandwidth for economic growth of 1 to 2.5% for the period 2010-2020. Box 2.2 Similarities and differences with the medium term projection of CPB In March 2010 CPB published an economic outlook for the period 2011-2015 (CPB, 2010b). CPB estimates an average annual economic growth of 1.75% for this period. This is about the same as the 1.7% annual economic growth that is assumed for this period by the Reference projection. Looking at the various demand categories, CPB anticipates a higher growth for export and investments and a lower growth for private consumption and government consumption than the Reference projection. This could mean that the basic industry and agriculture, which both depend to a relatively large extent on export, will grow more significantly in the CPB forecast than in the Reference projection. However, CPB does not provide any forecasts for sectoral developments. For the Reference projection the macro-economic growth was projected in May 2009, whereas the MLT projection of CPB was published on 16 March 2010.. Consumption According to CPB the disposable income and consumption will decrease in 2009 and 2010 as a result of the credit crisis. In the period 2010-2011 the disposable income will lag somewhat behind the economic growth, because other expenditure that must be financed from the economic growth will increase more rapidly. In the last decades consumer expenditures increased by 0.3% more rapidly annually than the disposable income. As for the period 2011-2020, it is assumed that the growth of consumer expenditure will be 0.3% higher annually than the growth of the disposable income3, which is in line with the development of the last decades and the scenarios described in Huizinga and Smid (2004). Table 2.3 Annual economic growth, disposable income and consumer expenditure Growth per capita Growth Dutch economy [%] [%] 2009 2010 2011-2020 2009 2010 2011-2020 Economic growth (GDP) -3.8 -0.8 1.4 -3.5 -0.3 1.7 Disposable income -0.6 -0.8 1.3 -0.3 -0.5 1.6 Consumer expenditures -0.6 -0.8 1.7 -0.3 -0.5 1.9 The growth in consumer expenditure is not evenly divided among the various types of domestic expenditure. Food, clothing, rent and rental value, gas, electricity and water expenditure increase more slowly than the total average; holiday and leisure expenditure grows faster.. Developments in production sectors When establishing the environmental burden it is important to know the economic developments of the individual production sectors because they show large differences in environmental burden per produced euro. The credit crisis mainly affects the industry (Table 2.4.). The industrial shrinkage in 2009 and 2010 is therefore much larger than the shrinkage of the entire economy. The public sector and the government are less affected by the credit crisis; they still experience growth in 2009 and 2010. In the period 2011-2020 the differences in growth among the various sectors are smaller than in the crisis years 2009 and 2010. The tertiary services and industry show a higher than average growth in 2011-2020. The chemical industry is the largest growing industry. The growth in the base metal industry is also higher than the average of the entire industry. The foods industry has a somewhat lower growth. The growth of the other sectors lags far behind the average economic 3. Consumption expenditure of households can grow more rapidly than the dispensable income if households also tap into their savings and other property titles. These may also include pension savings (Huizinga en Smid, 2004, p. 39).. ECN-E--10-049. 23.
(24) growth, which is mainly due to the mineral extraction that is expected to shrink significantly between 2011 and 2020 because of the decreasing gas extraction. Where relevant, Chapter 3 will further address the development of the sub sectors and their corresponding volume developments, energy demand and emissions. The assumed development of the livestock is described in Section 6.4. Table 2.4 Annual growth of the value added tax according to sector 2009 2010 [%] [%] Agriculture -3.4 0.8 Industry -7.9 -0.7 Tertiary Services -4.0 -0.4 Public Services and Government 1.4 0.9 Other -3.1 -0.8 Total -3.5 -0.3. 2.4. 2011-2020 [%] 1.5 1.9 2.3 1.7 0.3 1.7. Fuel and CO2 prices. Commodity prices of fuels Commodity prices are the trading prices, excluding the cost of delivery and taxes and surcharges. The Reference projection assumes an oil price of $70 per barrel as of 2010, which is based on the euro-dollar exchange rate of mid 2008. The bandwidth used for the calculations is $40 to $100 per barrel, which is in line with the CPB study of the oil price in the long term (CPB, 2010). This bandwidth is related to the structural price level and does not take temporary peaks into account. At $70 per barrel the price amounts to €8/GJ. The gas price is on average about €6.5/GJ between 2010 and 2020, which corresponds to about 19ct/€m3. The projection assumes the same relative bandwidth as for oil: 11 to 27 €ct/m3. The coal price is on average about €2.2/GJ. The coal price has a less volatile history, which is why the projection assumes a smaller bandwidth: €1.8 to 2.7€/GJ. The electricity prices are not used as input for the projection, but they are a result in which fuel prices, CO2 prices and the development of generation capacity play important roles. Section 4.1 provides an explanation of the prices calculated in the projection. Box 2.3 The effect of the dollar rate on the oil price The projection assumes an oil price of $70 per barrel and a bandwidth of $40-$100 per barrel. The current oil price (on 9 March 2010) is $81 per barrel (http://www.finanzen.net/rohstoffe/oelpreis). However, these oil prices cannot be easily compared, because the value of the dollar also changes. As a result of the often heavy fluctuations in the exchange rate of the dollar compared to the euro and other currencies, the price in dollars often provides a distorted picture. An oil price expressed in euros would be more meaningful to provide a price level for European consumers and businesses than a price expressed in dollars. The $70 used in the projection has been translated into an oil price in euros by means of an exchange rate of mid 2008 (€1 is $1,53). News coverage about the oil price always refers to a price in dollars, though. As a result an oil price in euros is not meaningful at all for most people. Therefore the Reference projection also reports the oil price expressed in dollars. To be able to establish the difference between the as-. 24. ECN-E--10-049.
(25) sumed price and the current price a correction should be made for the changes in the exchange rate. The below table shows how the price of $70 (2008 dollars) is translated into euro at various exchange rates. A cheaper euro implies a higher oil price. On 9 March 2010 the value of the euro is $1.36 instead of $1.53. Thus $70 per barrel for Euro countries is similar to $79 per barrel mid 2008. The current oil price, as stated earlier, is $81/barrel, which is just as expensive for Euro countries as $91/barrel would have been mid 2008. The current price is thus approaching the ceiling of the bandwidth used by the projection. Exchange rate ($/€) => oil price in dollars of 2008 1.9 1.8 1.7 1.6 1.5 3 1.5 1.4 1.3 6 1.3 1.2 1.1 1. => => => =>. 56 60 63 67. More expensive Euro. => => =>. 70 71 77. Mid 2008. => => => => =>. 79 82 89 97 107. 9 March 2010. Cheaper Euro. Price of CO2 emission allowances Those businesses that are engaged in the European emission trading system must also take the CO2 price into account. The projection assumes a CO2 price of €20/ton CO2 for the period 20102020, using a bandwidth of €10 to €40/ton CO2. The economic recession has resulted in a surplus of allowances in the period 2008-2012. Businesses are allowed to use (part of) this surplus in the period 2013-2020. As the economic growth has also been moderated, the demand for CO2 allowances in this projection increases more slowly, resulting in prices that remain structurally lower than anticipated before the recession until 2020.. End user prices Commodity prices and CO2 prices constitute only part of the price that citizens and businesses pay for energy. The commodity price is the dominant price component only for large users such as electricity plants and large industrial businesses. In the case of small and medium-sized businesses the energy taxes and supply costs are just as important or even more important.. ECN-E--10-049. 25.
(26) [cent2008/m 3] 50. Households. Medium-size. 45. Greenhouse horticulturists. Large users. 2008 2010 2020. 2008 2010 2020. 40 35 30 25 20 15 10 5 0 2008 2010 2020. VAT. 2008 2010 2020. CO2 price. Energy tax. Distribution. Commodity. Figure 2.1 Indicational breakdown of marginal prices per user category for natural gas [cent2008/kWh] 35 30. Households. Average-size. Greenhouse horticulturists. Large users. 25 20 15 10 5 0 2008 2010 2020. VAT Energy tax Distribution. 2008 2010 2020. 2008 2010 2020. 2008 2010 2020. SDE surcharge transport and capacity Commodity. Figure 2.2 Indicational breakdown of marginal prices per user category for electricity The figures provide an indication of the natural gas and electricity prices for various categories of energy users. To visualize the SDE surcharge, the electricity price shown here entails the variant with intended policy. Figure 2.1 also shows the share of the CO2 price in the marginal costs for natural gas use of ETS participants.. 26. ECN-E--10-049.
(27) Box 2.4 The impact of CO2 and fuel prices on energy use and emissions Higher CO2 and fuel prices make energy more expensive and energy saving and transition to renewable energy more rewarding. Yet, the effect of a higher oil or gas price is not always as significant as what may seem obvious at first. Moreover it may take a long time before the effect has fully developed. Many different aspects play a role in weakening the role that price stimuli may play in energy use. Fixed price components Especially in the case of small users and transport fuels a large part of the price is not composed of the trade price of oil or gas; its main components are taxes, supply tariffs or excises. Relatively speaking, a large increase in the oil price, for example, implies a much smaller increase for the end user. Share of energy in costs Energy usually takes up a relatively small share in the total cost of an activity, which is why little attention is paid to them. Even in the energy intensive industry, for example, the share of labour in the costs is usually much larger than the cost of energy. In the rest of the industry, especially in the services sector, the share of energy in the total cost is much smaller. That is why companies often pay more attention to other aspects when making investment decisions, such as labour costs or product quality. Even in households the cost of energy is usually low compared to other costs. Split incentives In the case of house-renting the person carrying the cost of the energy saving measure is usually not the person who benefits from these measures. The landlord can take measures but he will not benefit from the results, whereas the tenant is not allowed to take measures while he would benefit from the results. This does not only apply to dwellings, but also to companies that rent office space or equipment. Policy In some cases policy has already resulted in implementing measures that would be unprofitable with the current energy prices. Thus, policy cuts away the ground from under the feet of the price incentive. Slowness and natural moments An industrial installation may last up to forty years in some cases and a dwelling much longer than that. After installing or construction there are limited options for lowering the energy use. Therefore it may take quite some time before a higher energy price takes full effect. It is not until replacement or renovation is needed that the higher energy price will be transferred onto a new decision. Uncertainty The energy price often does not stay high for a long time. Energy prices can be very volatile and any measure that will only be profitable in case of high energy prices will not be taken if the investor expects the energy prices to lower again. Cushioning An increase in the gas price may lead to a higher electricity price, but this effect is usually relatively smaller. Higher gas prices may cause electricity producers to increase the deployment of coal-fired plants, which limits the effect on the cost price of electricity.. ECN-E--10-049. 27.
(28) 2.5. Other. Change in average temperature This projection takes into account the expected change in average temperature4. A higher average outdoor temperature decreases the energy use for heating, but increases the energy use for cooling.. Use of historical data The figures and tables in the projection show the projected development of energy use and emissions together with the available historical data. The data on energy use and CO2 emissions were taken from MONIT5. These data are based on the emission registration, the CBS data and NEA. The data from MONIT have been adjusted to visualise the structural trends. This means that MONIT corrects for changes in the observation system of CBS (e.g. changes in the sector division used by CBS) and that it corrects for annual fluctuations in the outdoor temperature. The emission data for other greenhouse gases and air-polluting substances (the so-called NEC substances) were taken from the emission registration.. Linking to historical data The adjusted historical data on energy use and CO2 emissions are used as a starting point for the Reference projection, but in a number of cases the projection data and historical ranges are not well-attuned. There can be various reasons for this. Sometimes the available historical data are not well-attuned. Some of the historical ranges contain fluctuations that are not included in the calculations, for example due to large maintenance work to installations. Moreover, a number of sectors are not monitored by CBS. The energy use of these „other users‟ (construction, agriculture, services) is derived by deducting the data of the other sectors from the total energy use of the Netherlands. The agricultural energy use is still estimated based on LEI data and construction is also estimated, leaving the services sector as the last entry. In this sector the historical ranges have the lowest reliability. Data received after calculations After the calculations were finished some new historical data on the energy use became available. Especially in the case of other users (construction, agriculture, services) these ranges can show relatively large deviations from the used ranges. As these data are expected to become the new standard they were used for the historical data in the figures, despite the fact that they were not the starting point of the calculations.. 5-year intervals In a number of cases the link between projection and history are distorted because the projection shows only 5-year intervals and the historical ranges are annual ranges. The manner in which the energy and emissions decrease in the run-up to the recession of 2010 cannot be visualised by the projection. The underlying calculations do take this into account.. 4 5. The projection assumes the same trend as the WLO [CPB/MNP/RPB 2006]. MONIT is the acronym for „Monitoring the Development of National energy use, Information and Trend analysis‟. MONIT has data on energy use. Production of electricity, production of renewable energy en emissions of greenhouse gases and air-polluting substances, in various sectors of the Dutch society. Data are available for the period 1990-2006. In addition to historical data, the system also contains energy and emission series of various scenarios and projections.. 28. ECN-E--10-049.
(29) 3.. Energy and CO2. 3.1. Introduction. In 2008 the Netherlands emitted 207 Mton CO2eq of greenhouse gases and the energy use in the Netherlands amounted to 3349 PJ. Both data have been corrected for temperature: emissions and use have been translated into a year of temperatures according to the long-term trend.. Export Households Traffic and transport. Services. Industry Agriculture and horticulture. Figure 3.1 Distribution primary energy according to sector, 2008 The division of the primary energy use contains only the end user sectors. The energy losses of the energy companies in primary use have been allocated to the sectors to which they supply energy. The export of energy is not part of primary use, but the conversion losses of the export are6. This amounts to 6% of the primary use. At 40% the industry is the largest user in primary use. Almost half of this use consists of so-called feedstocks: The use of energy (e.g. petroleum) as a raw material, for example for plastics. Households and Traffic each use about 17%, followed by the services sector at nearly 15%. At the bottom of the list is agriculture at 4%. The distribution of CO2 emissions shows quite a different picture. It shows the emissions in the sectors where they were emitted; the energy companies are included here. The largest source of CO2 emissions is the energy companies (38%), followed by traffic (23%) and industry (19%). Households (10%), services (6%) and agriculture (4%) conclude the list. The CO2 emission takes up 85% of the total Dutch greenhouse gas emissions.. 6. Especially the export of oil products is very important in the Netherlands.. ECN-E--10-049. 29.
(30) Households. Traffic and transport. Industry. Services. Agriculture. Energy companies. Figure 3.2 Distribution of greenhouse gas emissions according to sector, 2008. 3.2. Industry. Introduction The Netherlands has many large chemical businesses. Therefore, the share of the industry in the total primary energy use is high at about 40%. The total CO2 emission of the industry was 32.9 Mton; including industrial cogeneration in which energy companies participate 40.5 Mton. Cokes plants. Construction Food and drugs. Other industry Construction materials Other metal Base metal. Paper. Chemical industry. Figure 3.3 Distribution of CO2 emissions according to industrial sector, 2008. 30. ECN-E--10-049.
(31) Other industry Construction materials. Cokes plants Construction industry. Food and drugs. Other metal Paper. Base metal. Chemical industry. Figure 3.4 Distribution industrial primary use according to sector, 2008 Almost half of all primary energy in the industry is used for non-energetic purposes. Examples include the use of naphtha in cracking processes and of coking coal for steel production. The non-energetic use in the organic basic chemistry increased exceptionally in the energy statistics of the last years. In 2007 the statistics show a trend break caused by a change in the definition of the CBS.. Drivers The economic crisis led to a steep fall in world trade and in the demand for industrial products. The energy-intensive industry and the metal industry are among the most severely affected sectors. Recuperation of the economy will lead to resumption of the growth of the added value. The chemical industry has a relatively large average growth in the period 2011-2020 at 2.6% annually. The Netherlands continues to be an attractive production location for chemical industry due to the presence of strong clusters of companies and good logistics. Corus Steel aims to increase its production significantly in the short term and intends to continue growing up to a production volume of 10 million tons in 20207. The growth in the metal industry amounts to 1.7% annually. The food and feeds industry has an average annual growth of 1.3% and the other industry grows 2% annually. Many industrial companies cater for their heat demand by means of CHP plants, thus saving energy. After a strong increase in industrial CHP in the 1990s, this growth stagnated. The projection shows a slight growth of CHP until 2020. The yield of CHP has become more uncertain as a result of the liberalised electricity market. To suffer less from low electricity prices in off-peak hours, being able to deploy installations in a flexible manner would be favourable. 7. Personal communication C. Pietersen based on public statement of a senior executive of Tata.. ECN-E--10-049. 31.
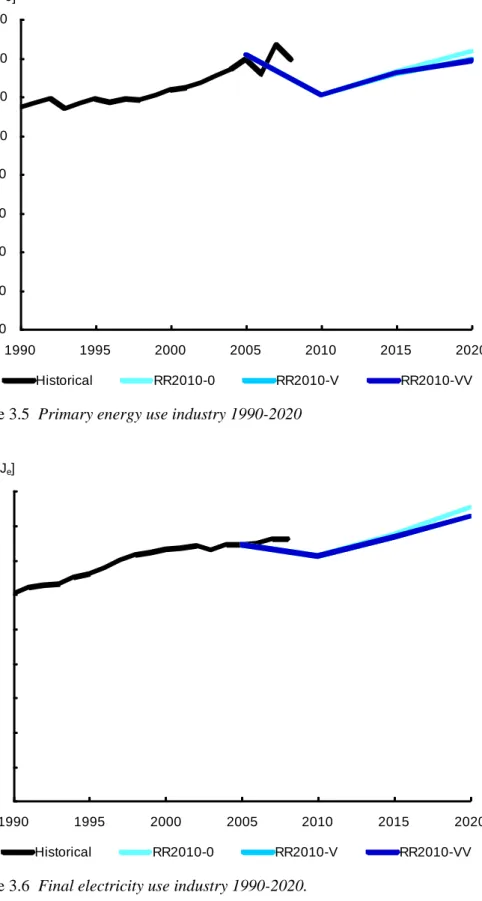
(32) Policy The large energy-intensive industrial companies are engaged in the European Emission Trading System (ETS). However, the emission trade only encourages energy saving to a limited extent, because the price of CO2 allowances will not increase significantly until 2020. For long time Dutch energy policy has been based to a large extent on voluntary covenants. Industrial parties close long-term agreements with the government about energy saving, emission reduction and renewable energy. The Covenant Benchmarking Energy Efficiency and the Long-term Agreement Energy Efficiency 2001-2012 (LTA2) expire in 2012. The variant without Clean and Efficient does not have a sequel. The Clean and Efficient policy does: These two covenants were recently replaced by new long-term agreements. In October 2009 all companies participating in the emission trade signed the Long-term Agreement Energy Efficiency for ETS enterprises (LEE). A large number of smaller and less energy-intensive companies acceded to the new Long-term Agreement Energy Efficiency 2001-2020 (LTA3) in 2008. By signing covenants, businesses commit themselves to formulating energy saving plans, monitoring and implementation of long-term studies. The Environmental Protection Act obliges nonETS businesses to take measures with a payback period up to five years; the covenants play a facilitating role in the actual implementation of these measures. Chain efficiency will receive more attention in the new covenants, but there is no distinct elevation of the ambition level or improved enforceability. Therefore, the new covenants will not result in a trend break. The differences in policy between the variants with fixed policy and intended policy are too limited for the industry.. Results Due to the economic crisis, the primary energy use of the industry dropped abruptly between 2008 and 2010. However, in the period of economic recuperation after 2010 the primary energy use starts growing again.. 32. ECN-E--10-049.
(33) [PJ] 1600 1400 1200 1000 800 600 400 200 0 1990. 1995 Historical. 2000. 2005. RR2010-0. 2010 RR2010-V. 2015. 2020. RR2010-VV. Figure 3.5 Primary energy use industry 1990-2020 [PJe] 180 160 140 120 100 80 60 40 20 0 1990. 1995 Historical. 2000 RR2010-0. 2005. 2010 RR2010-V. 2015. 2020. RR2010-VV. Figure 3.6 Final electricity use industry 1990-2020.. ECN-E--10-049. 33.
(34) [PJ] 500 450 400 350 300 250 200 150 100 50 0 1990. 1995 Historical. 2000 RR2010-0. 2005. 2010 RR2010-V. 2015. 2020. RR2010-VV. Figure 3.7 Final thermal use industry 1990-2020 As a result of the intended covenant policy, the energy saving pace will keep up to speed in the variants with fixed and intended policy. In the variant without Clean and Efficient policy there are no successors to the existing covenants, resulting in a drop in the energy saving pace when these covenants end. The European Ecodesign Directive establishes standards for appliances, which increases the energy saving.. 34. ECN-E--10-049.
Afbeelding

+7


GERELATEERDE DOCUMENTEN
The building type, the theoretical total energy use (‘Energy Performance Certificate’ score combined with the gross floor area), and the number of rooms (in 5 classes) are
The energy profiles of world regions vary widely in terms of the energy types used, the energy users, the food products driving consumption, or the dependency of imported energy in
Six determinants of RE use change have been identified, they are: population growth, shift from non-RE to RE use, technological (overall energy efficiency), trade structure,
This research discusses how enterprise resource planning (ERP) systems are used by organizations in the Dutch energy industry to exercise control over business operations..
waar de snijnippel een gedaante heeft verkregcn conform met de doorbuiging van de blank, op het moment dat de ponskracht zijn maximale waarde bereikt.. Een en
Het document is geschreven voor zorgaanbieders, zorgmedewerkers, mantelzorgers, studenten en andere geïnteresseerden om te laten zien hoe leefstijlmonitoring gebruikt kan
Ja nou dat is zeg maar een beetje hoeveel water we per persoon als mens gebruiken en de groene water footprint is dan eigenlijk hoeveel regenwater we voor bepaalde producten of per
De overstort van de vijver 100pl in een verdiept gcdeelte, De zij wanden van de overstort zijn van los gestapelde stenen.. De ruimte in die overs tort gebruik ik de hele
