Perspectives on the Future of Nature in Europe: Visualisation
Alexandra Tisma, Ed Dammers, Henk van Zeijts and Sandy van Tol PBL Netherlands Environmental Assessment Agency, The Hague Alexandra.tisma@pbl.nlAbstract
The use of visualisation in landscape planning is very common. However, its contribution to the creation of large-scale scenario studies is underestimated. For the Nature Outlook, several visualisation techniques were used; both in participatory scenario building and to inspire stakeholders in thinking about the future of nature in Europe. Photographs, icons, thematic maps, artist impressions, posters and films were created and used in various phases of the study. Interactive scenario workshops benefited from combined visualisation techniques because the disadvantages of one technique are compensated by another. Visualisation helped to structure information and keep participants on track during discussions, and inspired participants to create their preferred future. In dissemination, visualisation helped to explain future storylines in a compelling and attractive way. Keywords
Nature, scenarios, perspectives, Europe, visualisation. 1 INTRODUCTION
Scenario projects, in general, make the future tangible and provide inspiration to policymakers. In the Nature Outlook project (www.pbl.nl/natureoutlook), new ways of addressing the policy challenge to halt biodiversity loss were studied. The basic idea for the study was that public and business engagement could be increased by taking the variety of people’s perspectives on nature into account; which would also increase the effectiveness of nature policies. The PBL researchers developed four main scenarios, consisting of the
following four perspectives on the future of nature in Europe: Strengthening Cultural Identity; Allowing Nature to find its Way; Going with the Economic Flow; and Working with Nature. Each perspective represents a characteristic way of thinking about nature and society. In Strengthening Cultural Identity, people feel connected with nature and the landscape; they consider this an integral part of their local and regional communities and as essential to a fulfilling life. In Allowing Nature to find its Way, people feel strongly about the great intrinsic value of natural processes and species; nature is defined by dynamic
processes and should be left to its own devices. In Going with the Economic Flow, nature suits people’s lifestyles, and businesses and citizens take the initiative in nature
development. In Working with Nature, people try to use natural processes and strive for optimal, long-term delivery of ecosystem services, for the benefit of both society and the economy. The perspectives represent distinct visions about the future of nature, describing why people would want a particular type of nature in the future (2050), what this desired nature would look like, and how that vision could be realised (Van Zeijts et al., 2017; Dammers et al., 2017).
Visualisation has played an important role in the development of the Nature Outlook’s perspectives. During preparations for the project, literature study showed that visualisation techniques are often used to communicate scientific results for environmental planning
purposes and for the development of nature and landscape policy. Visualisation is used to enhance the perception and understanding of scientific outcomes (Appleton and Lovett, 2003; Sheppard, 2005; Pettit et al., 2011) and bring large data sets to life. It is also employed as a method to guide and structure discussions (Herzele and Woerkum, 2011), enabling people to become part of an interactive decision-making process (Stock et al., 2007), and has an important role as a communication and engagement medium (Wu et al., 2010; Drummond and French, 2008; Lange and Hehl-Lange, 2005; Harris, 1989). People can
participate more effectively if information is presented both visually and verbally. It is known from experimental evidence that representational devices (e.g. text, diagrams or maps) can shape and channel social interaction (Herzele and Woerkum, 2011). However, literature review showed scarce examples of studies that use visualisation in scenario development, and most of those scenarios were for small areas (e.g. Celio et al., 2015; Tress and Tress, 2003; Michel et al., 2016; Larondelle et al., 2016).
This paper intends to inspire scenario developers to make more use of visualisation techniques, and to challenge designers to become engaged in scenario making. Chapter 2 presents the development process for the main storylines of the four perspectives and reflects on the contribution of combined visualisation techniques during the various development stages. Chapter 3 shows the visualisation techniques that were used in the dissemination of results. Finally, Chapter 4 draws lessons from the application of techniques in the Nature Outlook.
2 ROLE OF VISUALISATION IN THE DEVELOPMENT OF THE NATURE OUTLOOK PERSPECTIVES
Perspectives were developed in collaboration with stakeholders, during three dialogues. Each dialogue included around 30 representatives from European environmental, research and economic sectors, representatives of European organisations involved in nature conservation, forestry, agriculture, hunting, health care and research (for dialogue reports, see www.pbl.nl/natureoutlook). The dialogues were held in Brussels, in 2014 and 2015. During the first dialogue, the participants drafted four perspectives. The project team, subsequently, structured these drafts and elaborated them in storylines, to be discussed during the second dialogue. For the third dialogue, participants used the perspectives to discuss a range of nature-related societal issues. The project team then used various sources to elaborate and further enhance the perspectives’ storylines.
Visualisation was used during the whole process, and specific visualisations were prepared for each dialogue. Inspired by the examples from the literature study, we defined the overall goals of the Nature Outlook’s visualisations, namely to inspire the participants, stimulate and structure discussions, and to enhance mutual understanding of the storylines and their spatial consequences. We made an inventory of broadly used techniques, and selected to use photographs, maps, icons, artist impressions, posters and films. The selection was based on the needs and purposes of the various stages of the project.
2.1 Use of visualisation during the first dialogue
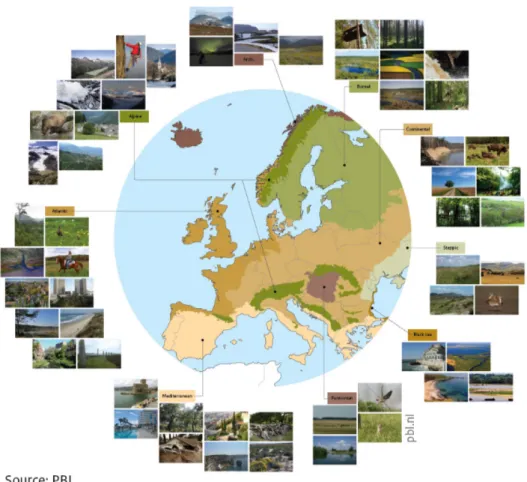
During the first dialogue, the first prototypes of the perspectives for nature in 2050 were constructed. To generate a large number of guiding ideas for the perspectives, the participants were divided into groups of two or three persons. For this purpose,
represented the variety in European nature, in coastal, mountainous, urban, and river regions (Figure 1).
Figure 1. Poster showing some of the photographs used in the first dialogue
E
ach group of participants had a set of 100 photographs to choose from, to create collages and describe, in words and drawings, their particular vision for nature (Figure 2). This process resulted in 12 guiding ideas, such as ‘Sustainable Use of Nature as Conservation’, ‘Wilderness at the heart of society’, ‘Nature, business and innovation’, ‘Connectivity between all citizens and nature’, and ‘Boxed Nature’.The 12 guiding ideas were clustered on the basis of their substantive consistency. This resulted in four combinations: ‘Nature as Foundation of Society’, ‘From the Past to the Future’, ‘Paradigm Shift’, and ‘Nightmare for Nature and People’. Finally, the participants were invited to elaborate the guiding ideas by generating ideas about the image of nature in 2050 and a potential pathway to achieve that image.
2.2 Use of visualisation during the second dialogue
Building on the first dialogue, the second focused on elaborating the perspectives on nature. This involved modifying the names of the perspectives and some of their content, in order to make them more consistent and contrasting. This resulted in four perspectives: ‘Cultural Nature’, ‘Wild Nature’, ‘Boxed Nature’ and ‘Functional Nature’.
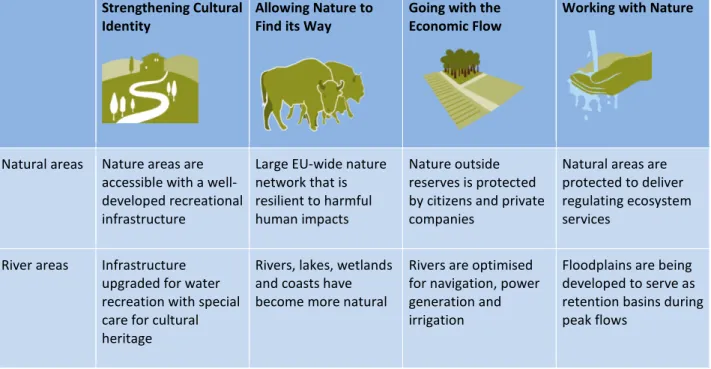
The participants were asked to further elaborate the perspectives in four rounds, in which participants 1) added information, 2) made the perspectives more inspiring, 3) enhanced their relevance for policy-making, and 4) made the advantages and disadvantages of the perspectives more explicit. Many relevant ideas were added, and, to support discussion, we used posters (Figures 3 and 4) displaying:
•
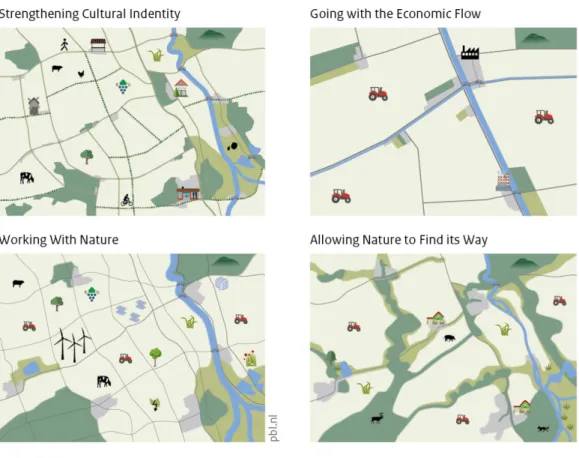
Maps of Europe showing main land-use types: urban, agriculture, nature, water and infrastructure.•
Thematic maps of those land uses, but zoomed in on an imaginary region, in four landscape settings: natural, rural, urban and river area. Spatial characteristics of the perspectives were used as input for these maps, as summarised in Table 1.•
Icons, printed on stickers showing functions and activities that can take place in these areas, grouped in five main categories: natural services, energy production, recreation, nature and built environment.Table 1. Overview of the four perspectives on the future of nature in Europe Strengthening Cultural
Identity Allowing Nature to Find its Way Going with the Economic Flow Working with Nature
Natural areas Nature areas are accessible with a well-developed recreational infrastructure
Large EU-wide nature network that is resilient to harmful human impacts
Nature outside reserves is protected by citizens and private companies
Natural areas are protected to deliver regulating ecosystem services
River areas Infrastructure upgraded for water recreation with special care for cultural heritage
Rivers, lakes, wetlands and coasts have become more natural
Rivers are optimised for navigation, power generation and irrigation
Floodplains are being developed to serve as retention basins during peak flows
Rural areas Introduction of landscape elements, maintenance of characteristic landscapes Separation of farmland and nature network; abandoned farmland actively turned into wild nature Homogenous production landscapes, dominated by intensive, large-scale farming Agricultural landscapes designed to deliver services such as pest control, pollination and erosion control Urban areas In and around cities,
many attractive and accessible green and blue spaces are found
Wild nature is penetrating the cities, corridors connect cities with nature areas
Large well-designed parks with restricted access; public parks are scarce and small
In and around cities, many functional green and blue spaces are found
The maps on posters supported the part of the discussion related to land-use changes and other spatial effects of the perspectives and to stimulate participants to generate their own ideas about these effects. After the dialogue, the maps were elaborated by the team, and participants’ comments and ideas were included in the text describing the perspectives and in the new versions of the thematic maps.
Figure 4. Posters and thematic maps used in the second dialogue
Figure 3. The development process for the perspectives during the three dialogues: example of Strengthening Cultural Identity perspective
2.3 Use of visualisation during the third dialogue
After the second dialogue, the perspectives were elaborated by the team, using the outcomes of the previous dialogue, additional interviews and literature review. Names of the perspectives were adapted to the latest content and matching icons were designed by PBL (final names and icons are shown in Table 1).
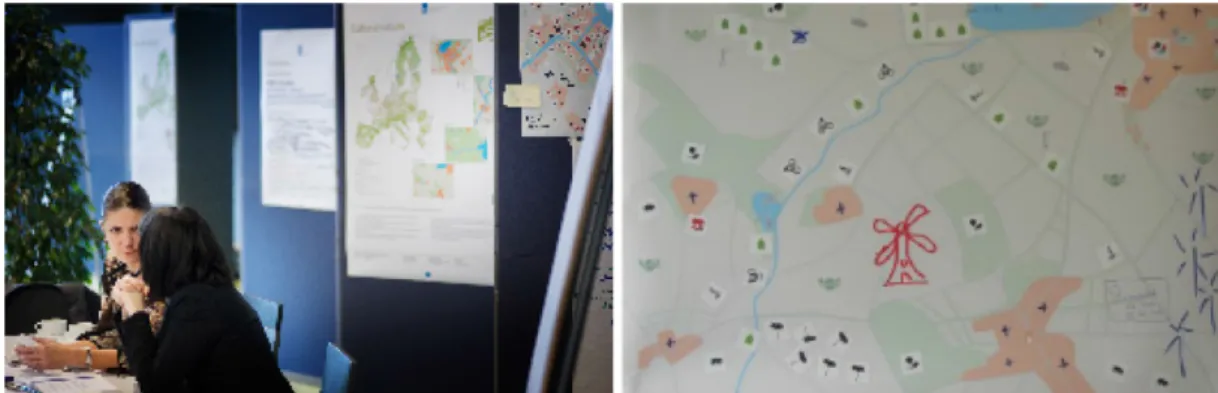
This dialogue was the last in a series of three. It focused on using the perspectives to derive key messages related to nature policy and other policies. During these discussions,
visualisation had an informative role. The posters were displayed for participants to read the perspectives’ summaries and see the photographs and thematic maps that illustrated the main characteristics of the perspectives and their spatial impact on a regional scale. Also, enlarged thematic maps were displayed for participants to use to illustrate or support the discussion (Figure 5). Maps provided the starting point and the basis for creation of the final thematic maps, included in Dammers et al. pp. 57–58 (2017).
Figure 5. Posters and thematic maps displayed during the third dialogue
2.4 Evaluation of the use of visualisation in dialogues
The value of visualisation as used in the three dialogues was evaluated by analysing participant feedback provided after the third dialogue, and by participative observation of the team members during all three dialogues.
Participants liked the posters, in general, but not everyone used them. According to them, the posters were well-illustrated and helpful, well-organised and clear. The posters gave them a good introduction, and the information in them was used during the dialogues. A critical remark was that posters gave the impression of putting things into separate boxes rather that illustrating connectedness. During the discussions, it became clear that participants interpreted them in various ways.
The thematic maps were perceived as a very good idea and nicely presented, well-placed and organised together with the posters. However, they were not used enough; a
participant mentioned that some training was needed for the efficient use of them. It was mentioned that groups with spatial planning experience made better use of them. Others mentioned that it was more like sim-city than reality, with an overload of detailed
information. Participants said that there was insufficient time for reflecting, using and understanding the maps.
During the dialogues, team members were observing and making notes on how participants were using the visual material. Photographs were easily and readily used by all the
participants in the first dialogue. They were easy to understand and covered a great variety of examples of views on nature. With regard to the thematic maps, participants added their sketches and comments to almost all maps, although not all groups used them to the same extent. Participants were given the opportunity to use the maps however they chose, which resulted in a great variation in approaches and styles. The thematic maps seemed to be too abstract for the participants. EU maps were too detailed to work with, and contained too many icons. Nevertheless, they were used, albeit in a rough and sketchy way.
2.5 Discussion of evaluation results
We can conclude that the photographs made a significant contribution in enhancing communication and structuring the discussions in groups, and were a source of inspiration for the participants in generating their visions of nature. The team spent a large amount of energy on the creation of thematic maps and they were appreciated by the majority of participants. However, they were not used as much as expected, during the three dialogues. Posters were considered a useful source of information, and served as a reminder of the main ideas of the perspectives.
For those who plan to use maps in similar projects, we can suggest several improvement strategies gained from this experience. To reach their full potential in interactive dialogues, the reason for using maps must be clear and simple. The method should be introduced beforehand, and include a description of the goals and potential use of the maps, which should be limited to a few expected results. As complex visualisation techniques are known to require appropriate guidance (Sheppard, 2001), it is important that workshop moderators are instructed on how to help participants to integrate the creation of maps into other activities during the workshop. Involving designers to help stakeholders during the
workshops may also help, in this respect. A good balance should be found between leaving participants free in how they use the visual material and structuring their task. Before using the maps in a workshop, it would be better to first test the material. Furthermore, thematic maps are abstract; maps with real-life cases (real regions) might work better, or,
alternatively recognisable examples and references could be added to improve understanding.
3 VISUALISATION OF THE FINAL RESULTS OF NATURE OUTLOOK PROJECT
After the dialogues were completed, the team started to finalise the study, producing main and background reports, website material and films. Texts and visual material were
combined to present the study in a clear, short, appealing, pleasant-to-read and scientifically sound way. The aim was for the material to cover various spatial scales, from regional (thematic maps) to local levels (photographs and artist impressions).
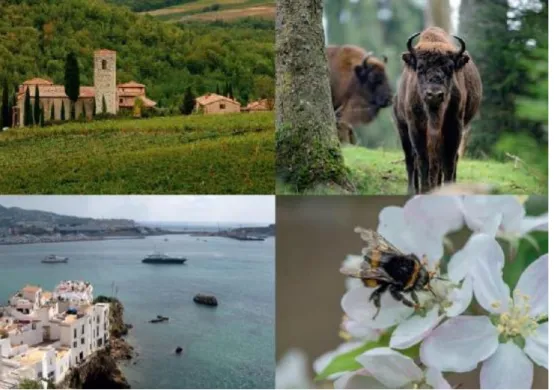
Figure 6. Examples of photographs used when presenting the perspectives
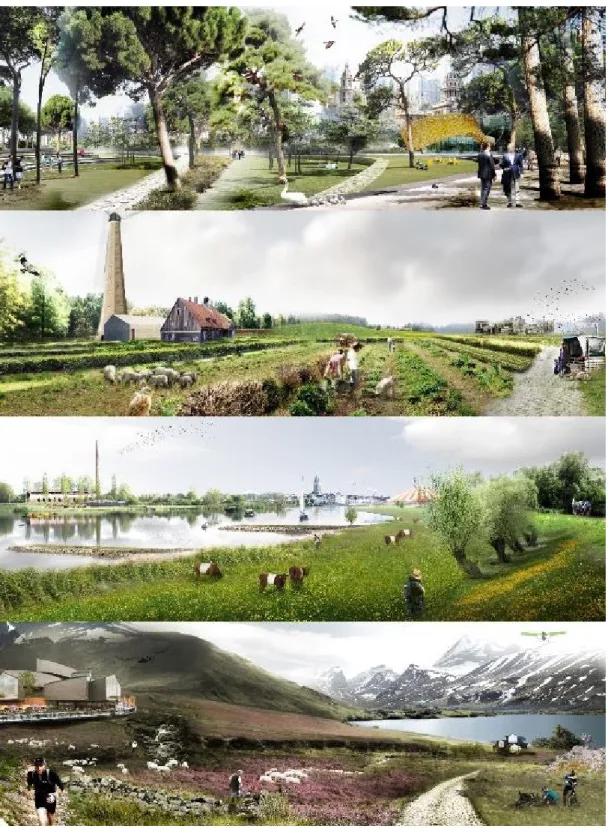
Artist impressions were created for each perspective, showing what urban, rural, river and natural landscapes could look like, in a particular perspective. They comprise the elements from the storylines, translating them into realistic looking images of future landscapes, with details such as flora and fauna, human activities, types of housing, and energy production methods.
Figure 7. Artist impressions showing what landscapes could look like in urban, rural, river and natural areas, from the Working with Nature perspective (designed for PBL by AENF Visuals)
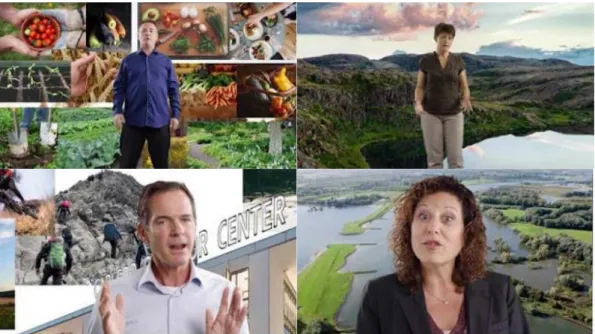
Figure 8. Stills from videos, all available on YouTube (produced for PBL by DPI Animation House)
Short films (2.5 minutes each) were created for each perspective, showing its essence and combining emotion and information. Starting with the personal view, the films explain what the future could look like and what would be needed to achieve that particular future. We found the films to be a powerful tool to provoke debate during the presentations of the project. While watching the films, people may think about which aspects of the perspectives they like and which they do not. This may stimulate discussion between people with
different views, lead to mutual understanding, and even to the formation of new coalitions. In the final stage of the project, thematic maps were finalised and given two purposes: to show the consequences of the perspectives for landscape patterns and land use (Figure 9), and to illustrate how the perspectives could be used for building joint visions among
stakeholders (Figure 10). The descriptions and visualisations of the perspectives provided by the Nature Outlook can be used as material to create a joint vision by using bricolage (improvisation) technique. Inspired by the arts and design, four methods of bricolage can be distinguished: making a pastiche, constructing a palette, fashioning a collage, and creating an assemblage (for details, see Dammers et al., 2017, Chapter 10). Figure 10 shows how the thematic maps can be used to create joint visions, using palette and assemblage techniques. Constructing a palette, for instance, refers to combining elements from various perspectives in a joint vision by allocating one type of land use per distinct sub-area. The use of
assemblage refers to combining elements from various perspectives in a joint vision by allocating various land uses to the same sub-area.
Figure 9. Thematic maps showing changes in landscape patterns and land use in rural areas
Figure 10. Practicing bricolage: thematic maps are used to illustrate palette and assemblage technique in forming joint visions
4 CONCLUSIONS AND RECOMMENDATIONS
The Nature Outlook study used various visualisation techniques to support and enhance stakeholder participation in the development of the perspectives, and to present the results of the study in a comprehensible and appealing way. Combinations of several techniques, such as photographs, icons, thematic maps, artist impressions, posters and films, were created and used in different phases of the project.
During the development of the four perspectives for the future of nature in Europe, visualisation was used in the three dialogues, to inspire the participants, stimulate and structure discussions, and to enhance mutual understanding of the storylines and their spatial consequences. In the Nature Outlook, photographs were found to be the easiest to use and most appreciated visualisation technique. This is hardly surprising, as the
photographs illustrated the concrete and desirable sides of each perspective, such as new nature, improved environmental quality and ecosystem services. On the other hand, the participants used the thematic maps, but not as much as expected. This can be explained by the insufficient amount of time for instruction and clarity about the role of the maps in the process. Therefore, suggestion is that, if the maps are used for interactive workshops with non-professionals, participants would need additional instruction on how to use them. Informative posters with images and in clear and concise wording helped to structure the information for the participants and kept them on track during discussions. Furthermore, visualisations were a powerful tool to inspire participants to create their preferred future. Finally, we can say that our experience has shown that interactive scenario workshops certainly can benefit from combined visualisation techniques.
Visualisation in the dissemination of results from the Nature Outlook project had two objectives. Firstly, to provide information on the results and how to use them, the thematic maps were used to illustrate how to combine elements from the perspectives. Secondly, visualisations were used for telling the stories of the perspectives in ways other than in words. Information was combined with emotion. Reactions from the public during the project presentations have shown that the visual material is very much appreciated by the target groups. The films, in particular, have shown to be helpful in stimulating debate on the future of nature in Europe.
To date, visualisations have played a minor role in scenario studies. From our study, we found that they were very helpful in participative scenario building and had added value in the dissemination of the results from the Nature Outlook study.
REFERENCES
Appleton, K., and Lovett, A. (2003). GIS-based visualisation of rural landscapes: defining ‘sufficient’ realism for environmental decision-making. Landscape and Urban Planning, 6, 117–131.
Celio, E., Ott M., Sirén, E., and Grêt-Regamey, A. (2015). A prototypical tool for normative landscape scenario development and the analysis of actors’ policy preferences. Landscape and Urban Planning 137, 40–53.
Dammers, E., Ludwig, K., Van Puijenbroek, P., Tisma, A., Van Tol, S., Vonk, M., Bouwma, I., Farjon, H., Gerritsen, A., Pedroli, B., and Van der Sluis T. (2017). Perspectives on the future of
nature in Europe: storylines and visualisations. PBL Netherlands Environmental Assessment Agency, The Hague.
Drummond, W.J., and French, S.P.F. (2008). The future of GIS in planning: converging technologies and diverging interests. Journal of the American Planning Association, 74(2), 161.
Harris, B. (1989). Beyond geographic information systems: computers and the planning professional. Journal of the American Planning Association, 55(1), 85–90
Herzele, A. van, and Woerkum, C. van (2011). On the argumentative work of map-based visualization, Landscape and Urban Planning, 100(4), 396–399.
Lange, E., and Hehl-Lange, S. (2005). Combining a participatory planning approach with a virtual landscape model for the siting of wind turbines. Journal of Environmental Planning and Management, 48(6), 833–852.
Lange, E., Hehl-Lange, S., and Brewer, M.J. (2008). Scenario-visualization for the assessment of perceived green space qualities at the urban-rural fringe. Journal of Environmental Management, 89(3), 245–256.
Larondelle, N., Frantzeskaki, N., and Haase, D. (2016). Mapping transition potential with stakeholder and policy-driven scenarios in Rotterdam City. Ecological Indicators 70, 630– 643.
Mitchell, M., Lockwood, M., Moore, S., and Clement, S. (2016). Building systems-based scenario narratives for novel biodiversity futures in an agricultural landscape. Landscape and Urban Planning 145, 45–56.
Pettit, C.J., Raymond, C.M, Bryan, B.A., and Lewis, H. (2011). Identifying strengths and weaknesses of landscape visualization for effective communication of future alternatives. Landscape and Urban Planning, 100, 231–241.
Sheppard, S.R.J. (2005). Landscape visualisation and climate change: the potential for influencing perceptions and behaviour. Environmental Science & Policy. 8, 637–654. Sheppard, S. R. J., and Cizek, P. (2009). The ethics of Google Earth: Crossing thresholds from spatial data to landscape visualisation. Journal of Environmental Management, 90, 2102– 2117.
Smith, E.L., Bishop, I.D., Williams, K.J.H., and Ford, R.M. (2012). Scenario Chooser: An interactive approach to eliciting public landscape preferences. Landscape and Urban Planning, 106(3), 230–243.
Stock, C., Bishop, I., and Green, R. (2007). Exploring landscape changes using an envisioning system in rural community workshops. Landscape and Urban Planning, 79, 229–239. Tress, B. and Tress, G. (2003). Scenario visualisation for participatory landscape planning—a study from Denmark. Landscape and Urban Planning 64, 161–178.
Wu, H., Zhengwei, & H., Gong, J. (2010). A virtual globe-based 3D visualization and interactive framework for public participation in urban planning processes. Computers, Environment and Urban Systems, 34, 291–298.
Zeijts, H. van, Prins, A., Dammers, D., Vonk, M., Bouwma, I., Farjon, H. and Pouwels, R. (2017). European nature in the plural. Finding common ground for a next policy agenda. PBL Netherlands Environmental Assessment Agency, The Hague