• No results found

CO2 emissions from fuel combustion Part III: Total Greenhouse Gas Emissions; 2015 Edition

N/A
N/A
Protected

Academic year: 2021

Share "CO2 emissions from fuel combustion Part III: Total Greenhouse Gas Emissions; 2015 Edition"

Copied!
43
0
0

Bezig met laden.... (Bekijk nu de volledige tekst)

Hele tekst

(1)

PART III:

TOTAL GREENHOUSE GAS

EMISSIONS

(2)
(3)

1. TRENDS IN GHG EMISSIONS

CO

2

emissions from fuel combustion represent the majority of anthropogenic GHG emissions. However,

comprehensive analysis of emission trends considers other sources of CO

2

as well as other gases, knowing

that data on gases and sources other than CO

2

from fuel combustion are much more uncertain.

Country-specific estimates of CO

2

from biomass burning and F-gas emissions are particularly difficult to ascertain.

To complement work regarding the emissions of CO

2

from fuel combustion, the IEA elected to include

EDGAR data on other CO

2

sources and on five other greenhouse gases; methane (CH

4)

, nitrous oxide (N

2

O)

and the fluorinated gases (or “F-gases”) HFCs, PFCs and SF

6

, all gases addressed by the Kyoto Protocol.

Main changes in this edition are: (a) CO

2

emissions from fuel combustion were calculated by the IEA using

the default emission factors from the 2006 IPCC guidelines instead of the 1996 Guidelines, thereby

increas-ing emissions by about 0.5% to 2%; (b) CO

2

emissions from carbon released in fossil fuel use, labelled in the

sectoral energy balance as ‘non-energy use’ or ‘chemical feedstock’, are now reported in the Tables under

Industrial Processes and Others and taken from the EDGAR4.3.0 dataset (mainly based on the production of

specific chemicals, whereas previously estimated by IEA using consumption of specific fuels and default

fractions stored by fuel type); (c) CO

2

emissions of fugitive nature (such as leakages, transformation losses,

flaring) and of non-combustion emissions from industrial processes are also taken from the EDGAR4.3.0

dataset and reported in the Tables under Fugitives and Industrial Processes.

The information in Part III (with the exception of CO

2

emissions from fuel combustion) has been provided

by Jos G.J. Olivier from the PBL Netherlands Environmental Assessment Agency and Greet

Janssens-Maenhout from the Joint Research Centre (JRC) of the European Commission, using the EDGAR database

(version 4.3.0 and 4.2FT2010) developed jointly by JRC and PBL. Please see Chapter 2 for further details on

data sources and methodology.

Global and regional trends

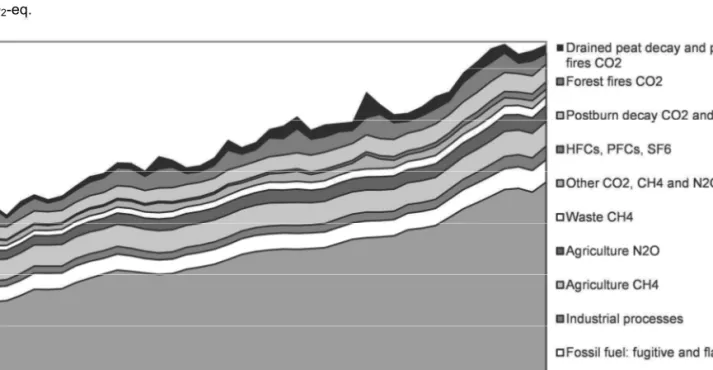
Dominated by emissions related to fossil fuels, total

emissions of all greenhouse gases - weighted by their

GWP

1

- increased by more than 80% since 1970

(Figure 1). Significant increases were observed for all

gases in the 1970-2010 period: CO

2

, including

large-scale biomass burning of forests and biomass decay

(107%); CH

4

(47%), N

2

O (43%), and the F-gases

(about 700%).

1. Global Warming Potential: see Box 1.

Global total GHG emissions increased by 31% during

the period 1990-2010, driven again by a 44% growth

in CO

2

emissions from fuel combustion. Over the

same period, although highly variable over time, CO

2

emissions from biomass burning and post-burn decay

– based on satellite observations – are assumed to

have decreased by about 10% with CO

2

from decay of

drained peatland increasing by 18%. Increases in CO

2

emissions from cement production (120%), CH

4

emis-sions from fossil fuel production (44%) and from

waste (21%), N

2

O emissions from agriculture (20%),

and the F-gases (about 225%, mainly from HFC use)

also contributed to the total increase. The F-gases

doubled their share of global emissions from 1% in

1990 to 2% in 2010.

(4)

The picture varies significantly across regions and

gases. In 2010, most methane (CH

4

) emissions

origi-nated in non-Annex I regions such as China (21%),

Asia excl. China (21%), and Latin America (12%).

Emissions from Annex I countries contributed 26%

of total emissions, with the largest contribution

com-ing from the Annex I members of the Former Soviet

Union (8%) and North America (8%).

CH

4

emissions from animals and their waste are

dom-inant in Latin America and South Asia, while

emis-sions from rice cultivation are common in South, East

and Southeast Asia. Fugitive methane emissions are

concentrated at coal production sites in East Asia

(mainly China), North America, Europe and Eurasia,

and at gas production and distribution systems in the

Former Soviet Union countries and North America.

Methane from waste stems mainly from landfills in

Annex I countries and from wastewater disposal

pre-dominantly in non-Annex I countries.

Non-Annex I regions produced three-quarters of global

nitrous oxide (N

2

O) emissions in 2010: Africa (19%),

Asia excl. China (18%), China (18%) and Latin America

(14%). N

2

O emissions from Annex I countries

contribut-ed 27% to the global total, with most emissions

originat-ing in North America (11%) and OECD Europe (9%).

N

2

O emissions from animal waste are dominant in the

non-Annex I regions of Latin America, Africa and

South Asia; N

2

O from fertiliser use is largest in East

Asia (mainly China) and Latin America followed by

North America, Annex II Europe and South Asia

(mainly India). N

2

O emissions from crop production

are largest in North America, Latin America, South

Asia and East Asia. Industrial processes also emit

sig-nificant volumes of N

2

O.

The shares of Annex I countries in total CH

4

and total

N

2

O emissions (26% and 27% respectively) are

rela-tively low compared to their share in global CO

2

emis-sions (38%).

In 2010, most fluorinated gas (F-gas) emissions

orig-inated in Annex I countries (66%), with North America

contributing 38%, OECD Europe 13%, OECD Asia

Oceania 9% and Other Europe and Eurasia 7%. Non

Annex I countries contributed about 34% to global

F-gas emissions.

Figure 1. Global GHG emissions 1970-2010

GtCO

2

-eq.

(5)

Trends by gas

In 2010, CO

2

contributed 76% of global GHG

emissions, CH

4

about 16%, N

2

O about 6% and the

combined F-gases about 2% (Figure 2). The largest

sources of GHG emissions were the energy sector

(67%, mainly CO

2

fossil fuel use), and agriculture

(11%, mainly CH

4

and N

2

O). Other sources of

green-house gases were CO

2

from biomass burning (10%,

mostly forest and peat fires and post-burn decay in

non-Annex I countries), and CO

2

from processes in

cement production (3%). Please note that emissions

from forest and peat fires are highly variable over the

years.

Figure 2. Global GHG emissions

by gas/source in 2010

CO

2

emission trends

Energy increasingly dominates the trend in global CO

2

emissions, accounting for 82% of the global total in

2010, up from 72% in 1970. This share varies between

90-99% in most Annex I countries, whereas it varies

more widely in non-Annex I countries (e.g. lower than

10% in some African, Latin American and Asian

countries).

Over the 1990-2010 period, total fossil fuel

combus-tion emissions of CO

2

increased about 45%

world-wide (by about 147% in non-Annex I countries while

decreasing 4% in Annex I countries). Emissions from

electricity and heat production and from road

transport dominated global trends. Between 1990 and

2010, CO

2

emissions from electricity and heat

produc-tion increased on average by 18% for Annex II

coun-tries and by 105% in other councoun-tries. Over the same

period, road transport emissions rose 23% in Annex II

countries and 125% in other countries. By 2010, these

two sectors together accounted for 59% of global total

CO

2

emissions from fuel combustion. The

introduc-tion at the beginning of this publicaintroduc-tion provides a

more complete discussion of CO

2

emissions in 2013

and the recent trends in energy-related CO

2

emissions.

In 2010, the highly variable emissions from

deforesta-tion (i.e. forest fires) and from decay of drained

peat-land accounted for about 7% of global CO

2

emissions

(or about 13% including indirect CO

2

emissions from

post-burn decay of remaining aboveground biomass).

The share of deforestation in global emissions was

about 18% until 2000. Since 2000, however, this share

has decreased due to rapidly increasing emissions

from fossil fuel combustion. In 2010, CO

2

emissions

from processes in cement clinker production –

i.e. excluding fossil fuel use – represented almost 4%

of total CO

2

emissions worldwide. Between 1990 and

2010, CO

2

from cement production increased by more

than 150%.

CH

4

emission trends

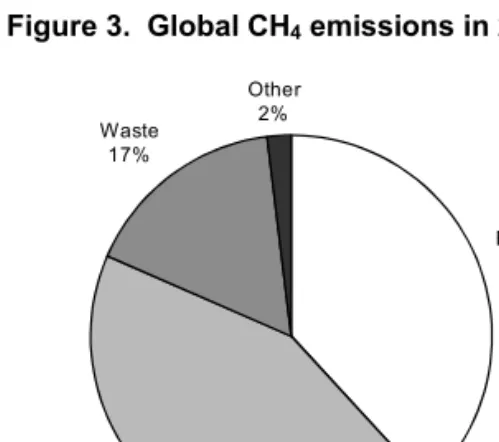
As seen in Figure 3, the major global sources of

me-thane (CH

4

) emissions in 2010 were (a) agriculture

(43%), mainly from enteric fermentation by animals

and animal waste, from rice cultivation and from

sa-vannah burning; (b) energy production and

transmis-sion/distribution (38%), mainly from coal production,

and gas production, transmission and distribution; and

(c) waste (17%), from landfills and wastewater.

Figure 3. Global CH

4

emissions in 2010

Between 1970 and 2010, global methane emissions

increased by almost half. In the 1970s emissions

in-creased with an average growth rate of 1.3% per year.

In the 1980s, this growth rate slowed down to an

av-erage 1.1% per year, determined mainly by the growth

rates of emissions in Other Europe and Eurasia (from

increased gas production and transmission) and in

East Asia (where coal production shifted towards

sur-CO2-Fossil fuel use 61% CO2-Other 15% CH4-Energy 6% CH4-Agriculture 7% CH4-Other 3% N2O-Agriculture 4% N2O-Other 2% F-gas-All2% Energy 38% Agriculture 43% Waste 17% Other 2%

(6)

face mining, which releases less methane than

under-ground mining). In addition, enteric fermentation by

ruminants and waste and wastewater disposal

contrib-uted to the increased emissions, particularly in

non-Annex I regions. Emissions from rice cultivation are

estimated to have decreased due to changes in types of

rice grown and to other organic amendment practices.

In the 1990s, an average decrease of 0.2% per year

was observed. The economic decline of Former Soviet

Union countries in the early 1990s strongly influenced

this global methane trend. Their emissions from coal

production, from gas transmission and from animals

(enteric fermentation) decreased substantially between

1990 and 1995. It should be stressed, however, that

detailed statistics for this region are uncertain over

this period. Despite the overall decline in the 1990s,

increases were observed regionally: for gas

produc-tion in the Middle East and North America, for

land-fills in Latin America and wastewater in South Asia,

for large-scale biomass burning in developing

coun-tries and for coal production in China.

Since 2000, emissions started increasing again, with an

average growth rate of 1.9% per year, yielding a faster

increase than in the last four decades. This led to a

global increase of about 20% over the period

2000-2010, driven by increased coal mining in China (+50%)

and increased cattle numbers in Brazil (+23%).

Between 1990 and 2010, country-specific trends of

activity data and emission factors lead to an increase

of global total methane emissions of about 17%.

Dur-ing this period, emissions in non-Annex I countries

increased about 38%, with the largest absolute growth

occurring in Asia and Africa. Emissions in Annex I

countries decreased by 18%, mainly driven by the

countries of the Former Soviet Union. Annex II

emissions as a whole decreased over the same period

by 16% and OECD Europe decreased by about 21%,

mainly as a result of the policies of the United Kingdom

and Germany, with reduced coal production and

in-creased methane recovery from coal mines (up to

50%). In North America and OECD Europe, methane

from landfills also decreased by about 50% due to

en-hanced waste separation and methane recovery.

N

2

O emission trends

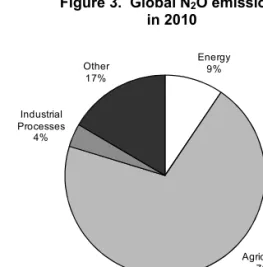
For nitrous oxide (N

2

O), agriculture contributed 70%

of emissions in 2010, mainly from synthetic

fertilis-ers, animal waste dropped on soils (either as animal

manure or on pasture during grazing) and agricultural

waste burning (Figure 3). Much smaller sources are

fuel combustion (9%, mainly from coal, fuelwood and

road transport) and industrial processes (4%), mostly

in Annex I countries. Between 1970 and 2010, global

emissions of N

2

O increased by about 43%. Increased

use of synthetic fertilisers and manure from livestock

since the 1970s caused agricultural emissions in South

Asia and East Asia to increase on average by 3-4%

annually. These regional emission trends continued

into the 2000s (Figure 7). Emissions from Latin America

and Africa also increased in the 1990s, predominantly

from the same sources and from forest fires.

Figure 3. Global N

2

O emissions

in 2010

In contrast, N

2

O emissions from industrial processes

decreased by 40% during the 1980s. This decrease

resulted from the gradual upgrade of global

produc-tion facilities for nitric acid. By 1990 about 20% of

the facilities were equipped for non-selective catalytic

reduction limiting NO

x

emissions while

simultaneous-ly reducing N

2

O emissions. Since 1990 further

reduc-tions occurred due to emission abatement in adipic

acid production.

During the 1970s, North America and Japan

intro-duced catalytic converters in cars with gasoline

en-gines to reduce emissions of precursors of

tropospheric ozone, but with higher N

2

O emissions as

a side effect. Since the 1990s this technology was also

introduced in Europe and Australia. Until about 2000

these catalytic converters contributed to an increase in

N

2

O emissions in these countries, however, in the late

1990s newer types were introduced with lower

specif-ic N

2

O emissions.

In the period 1990-2010, global N

2

O emissions are

estimated to have increased by only about 10%,

thanks to a 75% reduction in industrial emissions

from adipic acid manufacturing. Over this period,

emissions in non-Annex I countries increased by over

Energy 9% Agriculture 70% Industrial Processes 4% Other 17%

(7)

35%, mainly in the agricultural sectors of South Asia,

East Asia and Latin America. The increase was

par-tially offset by decreasing emissions in the

non-Annex I members of the Former Soviet Union

tries (-24%) and, to a lesser extent, in other EIT

coun-tries. In OECD Europe, N

2

O decreased by almost

29% since 1990, mainly due to emissions abatement

in the chemical industry, and to decreased use of

ni-trogen fertilisers.

Box 1: Global Warming Potential

The contribution of non-CO

2

gases to total

emis-sions can be estimated by expressing the emisemis-sions

of all the gases in CO

2

-equivalent units. For a given

gas, emissions expressed in mass are multiplied by

its specific weighting factor, the Global Warming

Potential (GWP). The GWP-100 is an estimate of

the relative contribution of 1 kg of that gas to

glob-al radiative forcing, as compared to 1 kg of CO

2

,

integrated over a fixed period of 100 years.

The data in this chapter follow the UN Framework

Convention on Climate Change (UNFCCC), which

used GWP values from the Second Assessment

Report (SAR) of the Intergovernmental Panel on

Climate Change (IPCC, 1997), for reporting total

greenhouse gas emissions: GWP-100 values of 21

for CH

4

, 310 for N

2

O and 23 900 for SF

6

. For the

most common HFCs, GWP-100 vary between 140

and

3

000 (1,300 for HFC-134a, 11

700 for

HFC-23). The GWP-100 for PFCs vary between

6 500 (CF

4

) to 9,200 (C

2

F

6

). The GHG data in this

chapter are all expressed in CO

2

-equivalents using

these GWP-100 values.

However, the Parties to the Climate Convention

have decided to use the updated GWP-100 values

from IPCC’s Fourth Assessment Report (IPCC,

2006) for their emissions inventory reporting from

2015 onwards. These GWP-100 values give a 19%

higher weighting to CH

4

(25), and a 4% lower

weighting to N

2

O (298). In addition, for the

F-gases, most GWP-100 values have increased, e.g.

by 10% for HFC-134a and by 26% for HFC-23. In

particular the higher GWP-100 value for CH

4

im-pacts the total GHG emissions trend and the share

of the sources. A GWP-100 value of 25 for CH

4

increases the share of total CH

4

in 2010 by 2.5%

points (from 15.8% to 18.3%) while the share of

CO

2

from fossil fuels decreases by 1.6% points

(from 61.2% to 59.6%).

HFC, PFC and SF

6

emission trends

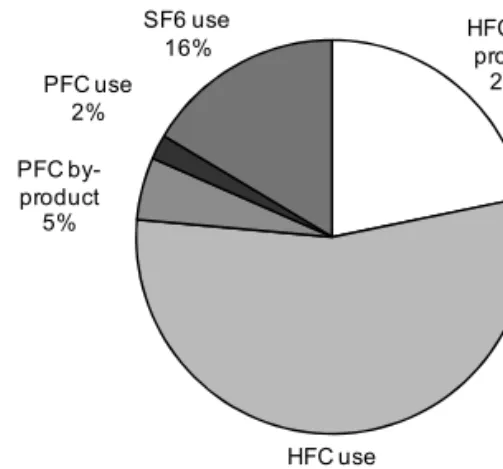
For the fluorinated gases (“F-gases”) (Figure 4),

emissions are split between “use” and “by-products”

because of the different ways in which they are

pro-duced. HFC use represented 55% of the total in 2010,

of which HFC 134a alone represented 42%. Total

by-product emissions of HFC contributed 22% and of

PFCs another 5%. SF

6

use represented 16%. Most

F-gas emissions are emitted by Annex I countries.

Figure 4. Global F-gas emissions in 2010

Between 1990 and 2010, the estimated emissions of

F-gases increased by about 225%, mainly due to an

increase in HFC emissions: emissions of HFC in 2010

were about nine times higher than in 1990. During the

same period, PFCs emissions decreased by about 35%

while SF

6

emissions increased by about 45%. Annex I

regions experienced large growth in F-gas emissions,

with regional increases on the order of 125% except

for North America which showed an increase of over

250%. On a regional basis, total F-gas emission trends

varied between 10% and 1500% for the non-Annex I

regions, with the largest absolute increases coming

from East Asia, driven by a fifteen-fold increase in

China, which is here included in East Asia.

Since 1995, global F-gas emissions have increased

more rapidly. The increase in HFC emissions

(4.5 times higher) more than offset a 30% reduction

in PFCs emissions. The small reductions in global

SF

6

emissions observed in the period 1996-2004

were mainly due to reductions in emissions from the

manufacture and use of switchgear for the electricity

sector. The large reduction in PFC emissions in

re-cent years is due to the phasing-out of old Søderberg

technology for aluminium production in China.

Global emissions of HFCs other than HFC-134a now

exceed emissions of HFC-134a, widely used for

refrigeration and air-conditioning.

HFC- by-product 22% HFC use 55% PFC by-product 5% PFC use 2% SF6 use 16%

(8)
(9)

2. SOURCES AND METHODS

The information in Part III (with the exception of CO

2

emissions from fossil fuel combustion) has been

provided by Jos

G.J.

Olivier and Greet

Janssens-Maenhout based on the EDGAR 4.2FT2010 dataset

except most other sources of CO

2

for which data from

EDGAR version 4.3.0 was used. JRC and PBL are

responsible for these datasets.

General note on EDGAR

Version 4 of the Emission Database for Global

Atmospheric Research (EDGAR4) has been developed

jointly by the European Commission’s Joint

Research Centre (JRC) and the PBL Netherlands

Environmental Assessment Agency and is hosted at

edgar.jrc.ec.europa.eu. EDGAR4 is providing global

anthropogenic emissions of greenhouse gases CO

2

,

CH

4

, N

2

O, HFCs, PFCs and SF

6

and of precursor

gas-es and air pollutants CO, NO

x

, NMVOC, SO

2

and the

aerosols PM

10

, PM

2.5

, BC, OC, per source category,

both at country level as well as on a 0.1x0.1 grid

online to its large community of users. EDGAR data

are used for policy applications and scientific studies

such as atmospheric modelling and were used for the

Fifth Assessment Report of the Intergovernmental

Panel on Climate Change (IPCC, 2014) (Working

Group III).

Activity data were mostly taken from international

sta-tistics (checked for completeness and consistency and

where required gap filled) and greenhouse gas emission

factors were selected mostly from the 2006 IPCC

Guidelines for National Greenhouse Gas Inventories

(IPCC, 2006) to ensure a consistent approach across

countries and complete and consistent time series. It is

stressed that the uncertainty in the resulting dataset at

national level may be substantial, especially for

methane and nitrous oxide, and even more so for the

F-gases (see Box 2 for more details). However, this

dataset provides a sound basis for comparability with

national emissions reports and other studies since the

methods used are either IPCC methodologies or

com-parable to them (see below), global totals are obtained

in a transparent way and comply with budgets used in

atmospheric studies, and the data were based on

inter-national information sources. The EDGAR 4.2 Fast

Track 2010 (FT2010 dataset is built on the previous

dataset 4.2 (with 1970-2008 time-series by adding

emissions for 2009 and 2010. For the GHG update,

reports of Annex I countries to the UN Convention on

Climate Change (UNFCCC) and the recent and

sig-nificant impact of Clean Development Mechanism

projects in developing countries to reduce CH

4

, N

2

O

and HFC-23 emissions were taken into account. This

applies to sources such as coal mines and landfills

(CH

4

recovery), nitric acid and adipic acid production

(N

2

O) and the production of HCFC-22 (HFC-23).

The EDGAR4.3.0 dataset covers 1970-2012

time-series for all sector-specific and country-specific

to-tals of greenhouse gases. Thereto new activity data

statistics (with updated and revised time series) were

uploaded and emission factors revised where

appro-priate. Although this dataset has been constructed

with great care, JRC and PBL do not accept any

liabil-ity from use of the data provided in this report

includ-ing any inaccuracies or omissions in the data

provided. For details on uncertainty and caveats

iden-tified in the dataset, as well as more detailed source

category estimates, we refer users to the EDGAR 4

website at edgar.jrc.ec.europa.eu. Note that estimates

for other more recent years than 2010 are made

public-ly available through this website. Most recent trends for

CO

2

emissions through 2014 are discussed in Olivier

(10)

Box 2: Uncertainty in greenhouse

gas emissions.

When considering comparative shares and trends in

greenhouse-gas emissions, data on gases and sources

other than CO

2

from fuel combustion are much more

uncertain. Country-specific estimates of CO

2

from

biomass burning and F-gas emissions are particularly

difficult to ascertain. The uncertainty in these

emis-sions is caused by the limited accuracy of

interna-tional activity data used and in particular of emission

factors selected for calculating emissions on a

coun-try level (Olivier, 2002; Olivier et al., 2005). For a

detailed evaluation of emission uncertainties using

international statistics and IPCC and other emission

factors we refer to the 2006 IPCC Guidelines (2006),

and for comparisons between countries and datasets

to Olivier et al (2005, 2010, 2015).

For global total anthropogenic CO

2

emissions the

calculated uncertainty in the total ranges from

about ‐10% to +10%, including large-scale biomass

burning. For global emissions of CH

4

, N

2

O and the

F‐gases uncertainty estimates of 25%, 30% and

20%, respectively, were assumed based on default

uncertainty estimates for the 2006 IPCC

methodol-ogies (IPCC, 2006), which correspond with

emissions estimates inferred from atmospheric

con-centration measurements (UNEP, 2012).

When considering emission shares and trends of

countries one should note that:

CO

2

: Fossil fuel combustion, which is often the

largest source of CO

2

in a country, is estimated to

have an uncertainty of about 5% (95% confidence

interval) for OECD countries. However, for many

non-OECD countries the uncertainty is estimated at

about 10%. This is often regarded as the most

accu-rate source of GHG emissions.

CH

4

: Uncertainties are particularly large for

me-thane emissions from fugitive sources (coal mining

and from oil and gas production and transmission)

and from landfills and wastewater.

N

2

O: Uncertainties of most N

2

O sources are very

large, e.g. the uncertainty for agricultural sources

may sometimes exceed 100%.

F-gases: Uncertainties in annual emissions of most

sources of F-gases are very large, e.g. at a country

level they may well exceed 100%. Therefore, the

figures provided for individual countries should be

considered solely as order-of-magnitude estimates.

Source definitions

The source definitions for Fuel combustion refer to

the categories and codes used in the 2006 IPCC

guide-lines, Chapter 8 of Vol. 1: General guidance and

report-ing (IPCC, 2006). For other categories and codes the

definitions refer to the Revised 1996 IPCC guidelines,

Chapter 1 of Vol. 1: Reporting instructions (IPCC, 1996).

For carbon dioxide:

Fuel combustion refers to fossil fuel combustion only.

Emissions have been estimated by the IEA using the

methodology as described in Part I, Chapter 3: IEA

estimates: Changes under the 2006 IPCC Guidelines.

(2006 IPCC Source/Sink Category 1A)

Fugitive refers mainly to flaring of associated gas in oil

and gas production (in some cases including indirect CO

2

from methane venting) (IPCC Source/Sink Category 1B).

Industrial Processes refer to production of cement,

lime, soda ash, carbides, ammonia, methanol, ethylene

and other chemicals, metals and to the use of soda

ash, limestone and dolomite, and non-energy use of

lubricants and waxes. Emissions exclude Fuel

com-bustion emissions. (IPCC Source/Sink Category 2).

Other refers to direct emissions from forest fires and

peat fires, emissions from decay (decomposition) of

aboveground biomass that remains after logging &

de-forestation and emissions from the decay of drained peat

soils (IPCC Source/Sink Category 5). CO

2

from solvent

use (IPCC Source/Sink Category 3), from application of

urea and agricultural lime (IPCC Source/Sink Category 4)

and from fossil fuel fires (coal fires & the Kuwait oil fires)

(IPCC Source/Sink Category 7) is also included here.

For methane:

Energy comprises production, handling, transmission

and combustion of fossil fuels and biofuels (IPCC

Source/Sink Categories 1A and 1B).

Agriculture comprises enteric fermentation, rice

production, manure management, agricultural waste

burning (non-energy, on-site) and savannah burning

(IPCC Source/Sink Category 4).

Waste comprises landfills, wastewater treatment,

wastewater disposal and waste incineration

(non-energy) (IPCC Source/Sink Category 6).

Other includes industrial process emissions e.g.

meth-anol production, and forest and peat fires and other

vegetation fires (IPCC Source/Sink Categories 2 and 5).

(11)

For nitrous oxide:

Energy comprises combustion of fossil fuels and

bio-fuels (IPCC Source/Sink Categories 1A and 1B).

Agriculture comprises fertiliser use (synthetic and

manure), animal waste (manure) management,

agri-cultural waste burning (non-energy, on-site) and

sa-vannah burning (IPCC Source/Sink Category 4).

Industrial Processes comprise non-combustion

emis-sions from manufacturing of adipic acid, nitric

acid, caprolactam and glyoxal (IPCC Source/Sink

Category 2).

Other includes N

2

O usage, forest and peat fires

(in-cluding post-burn decay emissions from remaining

biomass) and other vegetation fires, human sewage

discharge and waste incineration (non-energy) and

indirect N

2

O from atmospheric deposition of NO

x

and

NH

3

from non-agricultural sources (IPCC Source/Sink

Categories 3, 5, 6 and 7).

For fluorinated gases:

HFC emissions comprise by-product emissions of

HFC-23 from HCFC-22 manufacture and the use of

HFCs (IPCC Source/Sink Categories 2E and 2F).

PFC emissions comprise by-product emissions of CF

4

and C

2

F

6

from primary aluminium production and the

use of PFCs, in particular for the manufacture of

sem-iconductors, flat panel displays and photovoltaic cells)

(IPCC Source/Sink Categories 2C, 2E and 2F). SF

6

emissions stem from various sources of SF

6

use

(mainly manufacturing of Gas Insulated Switchgear

(GIS) used in the electricity distribution networks)

(IPCC Source/Sink Categories 2C and 2F) and from

SF

6

production (Category 2E).

Data sources and

methodology for

EDGAR 4.2FT2010 and 4.3.0

The EDGAR 4.2FT2010 has been available online

since October 2013

2

. For greenhouse gases, the

de-fault emission factors from the 2006 IPCC Guidelines

(IPCC, 2006) were used, except for CH

4

and N

2

O

from road transport where technology-specific factors

were used from the EMEP-EEA emission inventory

guidebook (EEA, 2009).

2. See http://edgar.jrc.ec.europa.eu/overview.php?v=42FT2010.

To estimate the trend for the main sources of each

greenhouse gas in 2009 and 2010, an emissions trend

for each year was used as a proxy. These were taken

either from the Common Reporting Format (CRF)

files of the National Inventory Reports (NIR) reported

to the UNFCCC or from statistics for an activity that

was assumed to be a good proxy for that source, such

as sectoral CO

2

emissions (IEA, 2012), fossil-fuel

production (IEA, 2012), gas flaring of the U.S.

National Oceanic and Atmospheric Administration

(NOAA), production of steel, aluminium, cement,

lime and ammonia of U.S. Geological Survey (USGS)

or the World Steel Association (WSA), animal

num-bers, crop production and nitrogen fertiliser

consump-tion of the Food and Agriculture Organisaconsump-tion (FAO),

large-scale biomass burning of the GFED 3 dataset.

The use of the NIR trends allowed to account for

im-plemented control measures.

For small-scale sources, such as industrial process

sources of methane and nitrous oxide from

caprolac-tam production, linear extrapolation of the past trend

from 2005 to 2008 was assumed.

The EDGAR 4.3.0 dataset covers the entire period

1970-2012. CO

2

emissions data from this dataset were

used for Fugitives and Industrial Processes. The

methods, data sources and emission factors used for

this new dataset are the same as for version 4.2,

ex-cept that the activity data have been updated, and

sometimes revised, through 2012.

Methods and data applied for all years (except 2009

and 2010 in FT2010) are summarised below. More

details and full references on the EDGAR 4.2 FT2010

dataset can be found in Part III of last year’s report

3

.

Energy / Fugitives / Biofuel

The data sources for fugitive CO

2

emissions and CH

4

and N2O from energy are listed below. Data for

fossil fuel production and use for 138 countries were

taken from the IEA energy statistics for OECD and

Non-OECD countries 1970-2008. This dataset

com-prises 94 sectors and 64 fuel types. For the countries

of the Former Soviet Union, Former Yugoslavia and

former Czechoslovakia, a modified dataset was used

to achieve a complete time series for the new

coun-tries from 1970 to 2008, the sum of which converges

to the older dataset for the total Former Soviet Union,

Czechoslovakia and Yugoslavia. For another

62 countries, the aggregated IEA data for the regions

3. For Part III of that report see:

http://www.pbl.nl/en/publications/co2-emissions-from-fuel-combustion-2014-edition.

(12)

“Other America”, “Other Africa” and “Other Asia”

have been split using the sectoral IEA data per region

together with total production and consumption

fig-ures per country of coal, gas and oil from energy

sta-tistics reported by the US Energy Information

Administration (EIA).

Please note that the figures of CO

2

from fuel

combus-tion provided by the IEA in this report differ

some-what from the EDGAR 4.2FT2010 and EDGAR 4.3.0

dataset, for the following reasons:

 IEA energy statistics used for 1970-2008/2012 may

differ slightly due to revisions included in

subse-quent IEA releases. For EDGAR 4.2 FT2010 the

re-leases of 2007 and 2010 were used for 1970-1999

and 2000-2008, respectively (IEA, 2007, 2010),

 For EDGAR 4.3 (covering 1970-2012) the IEA

release in 2014 was used (IEA, 2014).

To estimate CH

4

emissions from fossil fuel production

and transmission, hard coal and brown coal

produc-tion data have been separated into surface and

under-ground mining based on various national reports. For

gas transport and distribution, pipeline length was

used as activity data. Pipeline length and material

sta-tistics are taken from reports on Europe by Eurogas

and Marcogaz, national reports (e.g. the United States

and Canada), UNFCCC and supplemental data from

CIA. Total amounts of natural gas flared (sometimes

including gas vented) for most countries for 1994

on-wards are primarily based on amounts of gas flared

determined from the satellite observations of the

in-tensity of flaring lights reported by NOAA. For other

years before 1994 and for other countries emissions or

emissions trends were supplemented by CO

2

trends

from CDIAC, EIA and UNFCCC.

Biofuel data were also taken from IEA. However, to

avoid incomplete time series for large sectors, solid

biomass consumption in the residential and

commer-cial sectors in non-OECD countries were replaced by

fuelwood and charcoal consumption from FAO. Also,

vegetal waste and dung used as fuel are based on

oth-er data sources. Charcoal production data woth-ere taken

from IEA and supplemented or extrapolated using

data from UN and FAO and include 49 more countries

not included in the IEA dataset.

Methane emission factors for coal mining are based

on average depths of coal production and include post

mining emissions. Methane recovery from coal

min-ing was included for twelve countries.

Emission factors for oil and gas production, transport

and distribution from the 2006 IPCC guidelines were

supplemented with data from UNFCCC. The CH

4

emission factor for venting and flaring has been

de-rived from country-specific data reported to UNFCCC

with the average value used as global default, applied

to all other countries. The CO

2

emission factor

ex-cludes the indirect emissions through gas venting.

For N

2

O from gasoline cars in road transport, the

frac-tion of cars equipped with different types of catalytic

converters was taken into account (based on various

references).

Industrial processes

Production data for the CO

2

sources cement, iron and

steel, non-ferrous metals and various chemicals were

based on UN Industrial Commodity Statistics. often

supplemented for recent years by data from the US

Geological Survey (USGS). The same method applied

to paper, wine, beer and bread production. Data for

other CO

2

sources such as production of lime, soda

ash, ammonia, ferroalloys and non-ferrous metals

were from USGS, supplemented by data reported to

the UNFCCC. Data from the International Fertiliser

Industry Association (IFA) was used for urea

produc-tion (where it is assumed that the fossil carbon in CO

2

from ammonia production is stored) and FAO for

production of pulp, meat and poultry. Iron and steel

production was further split into technologies (basic

oxygen furnace, open hearth, electric arc furnace)

us-ing data from the World Steel Association (WSA).

For the N

2

O sources nitric acid, adipic acid and

capro-lactam, production data are based on UNFCCC and on

smoothed and averaged data from SRI Consulting.

For other industrial production for which no

interna-tional statistics were available, such as silicon carbide

and glyoxal, UNFCCC was used, though limited to

Annex I countries.

However, for many countries interpolations and

ex-trapolations were necessary to arrive at complete time

series per country for 1970-2005/2008. Special

atten-tion had to be given to new EIT countries, in

particu-lar to Former Soviet Union and Former Yugoslavia

countries, to maintain consistency with the older totals

for the former countries.

Note that emissions of CO

2

from cement production

are based on the Tier 1 emission factor for clinker

production, whereas cement clinker production is

cal-culated from cement production reported by the

USGS and the implied clinker to cement ratio based

on either clinker production data from UNFCCC

re-porting (Annex I countries) and the China Cement

Almanac (for China) or ratios from the GNR database

(13)

from the Cement Sustainability Initiative (CSI) of the

World Business Council for Sustainable Development

(WBCSD). For adipic acid, abatement is only

as-sumed from 1990 onwards if indicated in UNFCCC

combined with activity data from SRI Consulting. For

nitric acid in 1970, all old technology is assumed,

changing their technology towards 1990 into high

pressure plants in non-Annex I countries and a mix of

low and medium pressure plants in Annex I countries

that matches reported emissions in UNFCCC.

Global annual total production of HCFC-22 was taken

from AFEAS and others and included captive

produc-tion, but was modified using UNFCCC and other data

sources. Primary aluminium production statistics per

country from UN were combined with smelter types

characterised by technology according to Aluminium

Verlag and others. The default emission factor for

HFC-23 from HCFC-22 manufacture was set for

non-OECD countries at the IPCC default for old,

un-optimised plants and for OECD countries at a

some-what lower and which decreased over time to reflect

atmospheric concentrations. Country-specific

frac-tions of emission abatement were estimated for six

Annex II countries based on reported emissions in

UNFCCC and UNEP Risø Centre for other countries.

For aluminium production the CF

4

emission factors

per technology were based on large-survey factors for

1990 to 2002 reported by the International Aluminium

Institute (IAI), but with modifications for Söderberg

technologies to comply with atmospheric

concentra-tion trends, and for C

2

F

6

based on the ratio to CF

4

re-ported in the 2006 IPCC Guidelines for default Tier 2

emission factors. The emission factors for the

F-gases as by-product emissions were based 2006

IPCC guidelines, but modified for HFC-23 to match

global emissions to observations of atmospheric

concentrations.

Global consumption of HFC-125, 134a (in three

applications) and 143a was taken from AFEAS for

HFC-152a, 227ea, 245fa, 32 and 365mfc from) and

for HFC-23, 236fa and 43-10-mee from other sources.

Global HFC consumption was distributed to countries

according to their share in global CFC-12 or CFC-11

consumption and calibrated to reported regional

totals). Global emission factors for HFC use were

mostly derived from the emissions also reported by

these data sources.

Global consumption data of PFCs (and SF

6

) for

semi-conductor manufacture for Annex I countries in 1990

to 2005 were mainly based on UNFCCC and for other

non-Annex I countries mainly based on their global

share in semiconductor manufacture. PFC consumption

for other PFC uses was based on data for PFC use in

fire extinguishing and air-conditioning.

Global consumption of SF

6

per application was taken

from Knopman and Smythe (2007). For SF

6

containing

switchgear, equipment manufacture and utility stock

estimates were adjusted using the method in Mais and

Brenninkmeijer (1998) with the regional and per

coun-try distribution based on various references and for

missing countries and years based on the trend in the

increase of electricity consumption as a proxy for GIS

stock additions. For primary magnesium production

and diecasting global consumption was distributed

us-ing production statistics from USGS and the

Inter-national Magnesium Association (IMA) and others for

the number of diecasting companies per country.

Note that both the variables for distributing global

total consumption per source category and the

emis-sion factors vary widely between different plants and

countries. This implies that the estimated emissions of

F-gases at country level should be considered as very

uncertain (an order of magnitude).

Solvent and other product use

For N

2

O from the use of anaesthesia and from aerosol

spray cans, an amount per capita in 2000 was used for

EIT and Annex II countries based on the average

val-ues in reported to the UNFCCC.

Agriculture

In general, the IPCC (2006) methodology and default

emission factors for CO

2

, CH

4

and N

2

O from the 2006

IPCC Guidelines were used, except for the instances

specified below. Please note that N

2

O emissions from

agriculture as reported in EDGAR 4.2 FT2010 are

substantially lower than those previously reported by

most Annex I countries due to two markedly lower

emission factors: 1) the default IPCC emission factor

(“EF1”) for direct soil emissions of N

2

O from the use

of synthetic fertilisers, manure used as fertiliser and

from crop residues left in the field has been reduced

by 20%; and 2) the default emission factor (“EF5”)

for indirect N

2

O emissions from nitrogen leaching and

run-off been reduced by 70% compared to the values

recommended in the 1996 IPCC Guidelines and the

IPCC Good Practice Guidance (IPCC, 1997, 2000).

Livestock numbers were taken from FAO. For enteric

fermentation by cattle, country-specific methane

emission factors were calculated following the IPCC

methodology (IPCC, 2006) using country-specific

milk yield (dairy cattle) and carcass weight (other

(14)

cattle) trends from FAO (2007) to estimate the trends

in the emission factors. For other animal types,

re-gional emission factors from IPCC (2006) were used.

Livestock numbers were combined with estimates for

animal waste generated per head to estimate the total

amount of animal waste generated. Nitrogen excretion

rates for cattle, pigs and chicken

in Europe were based

on the CAPRI model and for all other countries and

animal types in IPCC (2006). The trend in carcass

weight was used to determine the development in

ni-trogen excretion over time. The shares of different

animal waste management systems were based on

regional defaults provided in IPCC (2006) and

region-al trend estimates for diary and non-dairy cattle for the

fractions stall-fed, extensive grazing and mixed

sys-tems from Bouwman et al. (2005). Methane emissions

from manure management were estimated by applying

default IPCC emission factors for each country and

temperature zone. Livestock fractions of the countries

were calculated for 19 annual mean temperature zones

for cattle, swine and buffalo and three climates zones

for other animals (cold, temperate, warm). N

2

O

emis-sions from manure management were based on

distri-bution of manure management systems from Annex I

countries reporting to the UNFCCC, Zhou et al.

(2007) for China and IPCC (2006) for the rest of the

countries.

The total area for rice cultivation was obtained from

FAO which was split over different ecology types

(rainfed, irrigated, deep water and upland) using data

from the International Rice Research Institute (IRRI)

The total harvested area of rice production in China

was increased by 40%, due to recognition that official

harvested rice area statistics for China largely

under-estimate the actual area. Methane emission factors

were taken from IIASA (2007).

The same data as described above for manure

man-agement were used to estimate N

2

O emissions from

the use of animal waste as fertilizer by taking into

account the loss of nitrogen that occurs from manure

management systems before manure is applied to soils

and additional nitrogen introduced by bedding

materi-al. N

2

O emissions from fertilizer use and CO

2

from

urea fertilization were estimated based on IFA and

FAO statistics.

CO

2

emissions from liming of soils were estimated

from Annex I country reports to the UNFCCC and on

the use of ammonium fertilizers for other countries

from FAO,as liming is needed to balance the acidity

caused by ammonium fertilizers.

Areas of cultivated histosols were estimated by

com-bining three different maps: the FAO climate map and

soil map and the RIVM land use map. However,

where available, areas reported by Annex I countries

to the UNFCCC were used. Separate N

2

O emission

factors were applied for tropical and non-tropical

re-gions (IPCC, 2006).

Nitrogen and dry-matter content of agricultural

resi-dues were estimated based on cultivation area and

yield for 24 crop types from FAO (2007) and IPCC

(2006) factors. The fractions of crop residues removed

from and burned in the field were estimated using data

of Yevich and Logan (2003) and UNFCCC National

Inventory reports of 2008 for fractions burned in the

field by Annex I countries.

Indirect N

2

O emissions from leaching and runoff were

estimated based on nitrogen input to agricultural soils

as described above. Leaching and run-off was

as-sumed to occur in other areas than non-irrigated

dry-land regions, which were identified based mainly on

FAO. The fraction of nitrogen lost through leaching

and runoff was based on a study of Van Drecht et al.

(2003).

For savannah burning, estimates for areas burned are

based on satellite measurements (see next section).

Large-scale biomass burning

For estimating the amounts of biomass burned in

large-scale fires the three key parameters have to be

multiplied: (a) area burned, (b) aboveground biomass

density (fuel load) (kg/ha), and (c) fraction of

above-ground biomass burned (combustion completeness).

Country-specific data for large-scale biomass burning

(total amount of dry matter burned, which were

sub-divided into tropical and non-tropical forest fires,

sa-vannah fires and grassland fires), have been taken

from the gridded data of the Global Fire Emissions

Database (GFED version 2 of Van der Werf et al.,

2010) for the years 1997-2005. For years prior to

1997, the GFED v2.0 data were scaled back to 1970

using regional biomass burning trends from the

RETRO dataset (Schultz et al., 2008). GFED data for

agricultural areas were attributed to savannah and

grassland fires. The GFED data on biomass burning

were estimated using burned area time series for

2001-2005 derived from the MODIS satellite sensors

in combination with the fuel load estimated by

the satellite-driven Carnegie-Ames-Stanford-Approach

(CASA) biogeochemical model that was adjusted to

account for fires. The 1997–2000 period was included

using fire counts from the VIRS/ATSR sensors. For

(15)

2006-2008 only the trend in the activity data from the

GFED v3 model was used, since the new dataset is

not consistent with the previous version. The non-CO

2

emission factors for large scale biomass burning were

not taken from IPCC (2006), but updated values were

used from Andreae (2011), including the carbon

con-tent of 0.47 kg C/kg dry matter. For greenhouse gas

accounting purposes, net CO

2

emissions from

savan-nah and grassland fires have been assumed to be zero

(organic carbon in a short cycle). Note that there is a

large uncertainty in the assumptions for the carbon

contents and the fraction of carbon that is actually

being burned and thus in the amount of burned

carbon.

CO

2

emissions from large-scale biomass burning are

only one component of emissions from forest fires.

Roughly half of the aboveground biomass is not

burned, but rather decomposes over time. This results

in delayed decay emissions of approximately the same

level of magnitude as the direct emissions from the

fires but distributed over a period of 10 to 20 years

(IPCC, 2006). Post-burn CO

2

emissions have been

estimated from the same activity data as direct

burn-ing emissions by assumburn-ing that remainburn-ing

above-ground biomass decays in the 15 years after the year

the fire or deforestation occurred and a carbon content

of 0.47 kg C/kg dry matter tropical forest from IPCC

(2006).

For CO

2

emissions from drained peatlands the

prehensive dataset of Joosten (2009) was used,

com-prising of activity data and CO

2

emission factors per

hectare of drained peatland.

In addition, enhanced N

2

O emissions that occur after

large-scale tropical biomass burning were calculated

from the post-burn biomass dataset.

Waste handling

To estimate the amount of organic solid waste in

land-fills three key parameters have to been estimated:

(a) Municipal Solid Waste (MSW) generated per year

(kg/cap), (b) fraction of total solid waste that is

land-filled, and (c) fraction of Degradable Organic Carbon

(DOC) in the MSW (%). Total and urban population

figures were taken from UN. The amounts of

Municipal Solid Waste (MSW) generated are the

pri-mary statistics for emissions from landfills. For

70 countries, the 2006 IPCC Guidelines provide

coun-try-specific data for 2000 of the amount of MSW

gen-erated per year per capita (urban capita in case of

non-Annex I countries) and the fraction landfilled and

in-cinerated. For 58 more countries, country-specific

values for the MSW generation per capita were found

in the literature. For the remaining 91 countries, the

waste generation per capita in 2000 was estimated

using an exponential fit of the IPCC (2006)

country-specific data for 70 countries of MSW/cap for 2000 to

GDP/cap. For Annex I countries trend data for MSW

generation/cap are available for the period 1990-2005

reported to the UNFCCC. For other years and for

oth-er countries for which these data are not available,

extrapolation from 2000 back and forward was done

using the exponential fit mentioned above. Based on

regional defaults for the composition of MSW, IPCC

(2006) provides regional defaults for the fraction of

Degradable Organic Carbon (DOC). For Annex I

countries, country-specific data from UNFCCC were

used (sometimes including a change over time) and

for 94 Non-Annex I countries, country-specific MSW

composition data were found, from which the average

DOC value was calculated. However, note that in

ver-sion 4.2 for a number of Annex I countries the DOC

fraction was adjusted to better reflect the overall

emission trends for landfills as reported to UNFCCC.

Calculation of methane emissions from landfills using

the First Order Decay (FOD) model of IPCC (2006),

the Methane Conversion Factor (MCF), requires the

k-value and the Oxidation Factor (OX). The MCF is

characterised by the type of landfill: managed aerobic

or anaerobic, unmanaged deep or shallow. For the

k-value, which is the methane generation rate

(inverse-ly proportional to the halflife value of the DOC),

default regional MSW composition weighted k-values

for four climate zones (tropical dry/wet and

non-tropical dry/wet) were provided by IPCC (2006). For

EDGAR 4.2 FT2010, country-specific values were

cal-culated using the country-specific fractions of the

popu-lation (urban popupopu-lation for non-Annex I countries) in

each climate zone. The IPCC default values were used

to estimate the Oxidation Factor. Finally, the amounts

of methane recovered (and used or flared) to be

sub-tracted from the gross methane emissions, were taken

as reported by Annex I countries in UNFCCC and for

23 non-Annex I countries from CDM projects reported

by the UNEP Risø Centre.

For domestic wastewater, total organics in wastewater

(BOD

5

) was estimated using regional default or

coun-try-specific default values for BOD

5

generation per

capita per day provided by the 2006 IPCC Guidelines.

For industrial wastewater, total organically degradable

material in wastewater from industry was calculated

per type of industry from wastewater generation per

ton of product and COD (chemical oxygen demand) in

values of wastewater, using defaults from the 2006

(16)

types that produce most organics in wastewater are

available from UN. To estimate methane emissions

from domestic wastewater, additional information is

required on the wastewater treatment systems, such as

sewer systems (to wastewater treatment plants

(WWTP) or to raw discharge), latrines by type, open

pits and septic tanks. Regional or country-specific

default fractions for 2000 were from 2006 IPCC

Guidelines. In addition, country-specific fractions of

improved sanitation over time from Van Drecht et al.

(2009) were used, based on the UN Water Supply and

Sanitation (WSS) dataset and other national reports,

and fractions reported by Doorn and Liles (1999). For

industrial methane emissions, fractions of on-site

treatment in WWTP, sewer with and without

city-WWTP, and raw discharge were based on regional

values reported by Doorn et al. (1997)..

To estimate N

2

O emissions from wastewater, the

ac-tivity data used is the total annual amount of nitrogen in

the wastewater, which was calculated from annual

protein consumption per capita reported by FAO.

Other waste sources are incineration, with activity data

from UNFCCC and IPCC (2006) and extrapolations

assuming a fixed ratio to landfilling, and composting

(based on UNFCCC data and two other data sources).

Other sources

Indirect N

2

O emissions from atmospheric deposition

of nitrogen of NO

x

and NH

3

emissions from

non-agricultural sources, mainly fossil fuel combustion

and large scale biomass burning, were estimated using

nitrogen in NO

x

and NH

3

emissions from these

sources as activity data, based on EDGAR

4.2

FT2010 data for these gases. The same emission

fac-tor from the 2006 IPCC Guidelines was used for

indi-rect N

2

O from atmospheric deposition of nitrogen

from NH

3

and NO

x

emissions as was used for

agricul-tural emissions.

General Note

We note that EDGAR 4.2 FT2010 estimates for all

sources have been made for all years. For more

de-tailed data of the EDGAR 4.2 FT2010 dataset,

includ-ing the complete period 1970-2010 and a few small

corrections after the release of the dataset for some

sources of F-gas emissions in 2010 (HFC-23 from

HCFC manufacture and PFCs from solvent use and

from PV cell manufacture) and estimates for more

recent years we refer to the EDGAR version 4 website

at edgar.jrc.ec.europa.eu. Here also the new dataset

4.3.0 covering 1970 to 2012 will be available and for

CO

2

in Olivier et al. (2015).

References

Andreae, M. (2011). Updated emissions factors for

emissions of trace gases and aerosols from biomass

burning, pers. comm. 30 July 2011.

Bouwman, A.F., K.W. Van der Hoek, B. Eickhout

and I. Soenario (2005). Exploring changes in world

ruminant production systems. Agricultural Systems,

84,:121-153.

Doorn, M.R.J.,

R.P. Strait,

W.R. Barnard

and

B. Eklund (1997). Estimates of global greenhouse-gas

emissions from industrial and domestic waste water

treatment. Report no. NRMRL-RTP-086. R 8/18/97.

Pechan & Ass., Durham.

Doorn, M.J. and D.S. Liles (1999). Quantification of

methane emissions and discussion of nitrous oxide,

and ammonia emissions from septic tanks, latrines,

and stagnant open sewers in the world. EPA,

Washington DC. EPA report EPA-600/R-99-089,

October 1999.

EEA (2009). EMEP-EEA emission inventory

guidebook – 2009, European Environment Agency.

Internet: www.eea.europa.eu/publications.

FAO (2007, 2010, 2012, 2014). FAOSTAT. Live

animal numbers, crop production, total nitrogen

fertiliser consumption statistics for

2000-2008/2000-2010, 2000-2012.

IEA (2007, 2010, 2012, 2014). Energy Statistics of

OECD and Non-OECD Countries. Online data

service. Internet: data.iea.org.

IIASA (2007). GAINS model. Internet:

http://gains.iiasa.ac.at/models/index.html.

IPCC (1997). Revised 1996 IPCC Guidelines for

National Greenhouse Gas Inventories IPCC/OECD/

IEA, Paris.

IPCC (2000). Good Practice Guidance and

Uncertainty Management in National Greenhouse

Gas Inventories, IPCC-TSU NGGIP, Japan.

IPCC (2006). 2006 IPCC Guidelines for National

Greenhouse Gas Inventories. Eggleston, S., Buendia,

L., Miwa, K., Ngara, T., Tanabe, K. (eds.). IPCC-TSU

NGGIP, IGES, Japan. Internet: www.ipcc-nggip.iges.

or.jp/public/2006gl/index.html.

IPCC (2014). Climate Change 2014: Mitigation.

Contribution of Working Group III to the Fifth

(17)

Climate Change [ Edenhofer, O., R. Pichs-Madruga,

Y. Sokona, E. Farahani, S. Kadner, K. Seyboth, A.

Adler, I. Baum, S. Brunner, P. Eickemeier, B.

Kriemann, J. Savolainen, S. Schlömer, C. von

Stechow, T. Zwickel and J.C. Minx (eds.)],

Cambridge University Press, Cambridge,

United

Kingdom and New York, NY. Internet:

http://www.ipcc.ch/report/ar5/wg3/.

Joosten, H. (2009). The Global Peatland CO

2

Picture -

Peatland status and drainage related emissions in all

countries of the world. Wetlands International, Ede, The

Netherlands. Database received by pers. comm., 2010.

JRC/PBL (2012). EDGAR version 4.2FT2010. Joint

Research Centre/PBL Netherlands Environmental

Assessment Agency. Internet: edgar.jrc.ec.europa.eu/.

JRC/PBL (2015). EDGAR version 4.3.0. Joint

Research Centre/PBL Netherlands Environmental

Assessment Agency, forthcoming Fall 2015. Internet:

edgar.jrc.ec.europa.eu/.

Knopman, D. and K. Smythe (2007). 2004-2006 SF6

data summary. Project Memorandum

PM-2327-NEMA, 25 June 2007. Internet: epa.gov/highgwp/

electricpower-sf6/documents/04-06_data_summary.pdf

Mais, M. and C.M. Brenninkmeijer (1998).

Atmos-pheric SF6: Trends, Sources, and Prospects. Environ.

Sci. Technol., 32, 3077-3086.

Olivier, J.G.J. (2002). On the Quality of Global

Emission Inventories, Approaches, Methodologies,

Input Data and Uncertainties, Thesis Utrecht

University, Utrecht, ISBN 90 393 3103 0. Internet:

www.library.uu.nl/digiarchief/dip/diss/2002-1025-

131210/inhoud.htm.

Olivier, J.G.J., J.A. Van Aardenne, F. Dentener,

V.

Pagliari, L.N.

Ganzeveld and J.A.H.W.

Peters

(2005). Recent trends in global greenhouse gas

emissions: regional trends 1970-2000 and spatial

distribution of key sources in 2000. Environm. Sc., 2

(2-3), 81-99. DOI: 10.1080/15693430500400345.

Olivier, J.G.J., J.A. van Aardenne, S. Monni, U.M.

Döring, J.A.H.W. Peters and G. Janssens-Maenhout

(2010). Application of the IPCC uncertainty methods

to EDGAR 4.1 global greenhouse gas inventories. In:

“3rd International Workshop on Uncertainty in

Greenhouse Gas Inventories, 22–24 September,

2010”. Proceedings. Lviv Polytechnic National

University, Lviv, Ukraine. ISBN: 978-966-8460-81-4,

p. 219-226. Internet: http://bit.ly/1FHB0Wt.

Olivier, J.G.J., G. Janssens-Maenhout, M. Muntean

and J.A.H.W. Peters (2015). Trends in global CO

2

emissions. 2015 report, forthcoming Fall 2015.

Schultz, M.G., A. Heil, J.J. Hoelzemann, A. Spessa,

K. Thonicke, J.G. Goldammer, A.C. Held, J.M.C. Pereira

and M. van het Bolscher (2008). Global wildland fire

emissions from 1960 to 2000, Global Biogeochem.

Cycles, 22, doi:10.1029/2007GB003031.

UNEP (2012). The Emissions Gap Report 2012.

Appendix 1. Internet: http://bit.ly/1JFHD6H.

Van der Werf, G.R., J.T. Randerson, L. Giglio, G.J.

Collatz, M. Mu, P.S. Kasibhatla, D.C. Morton, R.S.

DeFries, Y. Jin and T.T. van Leeuwen (2010). Global

fire emissions and the contribution of deforestation,

savanna, forest, agricultural, and peat fires (1997–

2009). Atmos. Chem. Phys., 10, 11707-11735,

doi:10.5194/acp-10-11707-2010.

Van Drecht, G., A. Bouwman, J. Knoop, A. Beusen

and C. Meinardi (2003). Global modelling of the fate

of nitrogen from point and nonpoint sources in soils,

groundwater, and surface water. Global Biogeochemical

Cycles, 17, 1115, doi:10.1029/2003GB002060.

Van Drecht, G, A.F. Bouwman, J. Harrison and

J.M. Knoop (2009). Global nitrogen and phosphate in

urban wastewater for the period 1970 to 2050. Global

Biogeochemical Cycles, 23, GB0A03, doi:10.1029/

2009GB003458.

Yevich, R. and J. Logan (2003). An assessment of

biofuel use and burning of agricultural waste in the

developing world. Global biogeochemical cycles, 17,

1095, doi:10.1029/2002GB001952.

Zhou, J., M. Jiang and G. Chen (2007). Estimation of

methane and nitrous oxide emissions from livestock

and poultry in China during 1949-2003. Energy

(18)
(19)

Afbeelding

Figure 1.  Global GHG emissions 1970-2010  GtCO 2 -eq.
Figure 3.  Global CH 4  emissions in 2010
Figure 3.  Global N 2 O emissions   in 2010
Figure 4.  Global F-gas emissions in 2010

Referenties

GERELATEERDE DOCUMENTEN

De hogere kosten worden hoofdzakelijk veroorzaakt door de kosten van verzending voor konvokaties en aanrnaak van adresplaatjes.Bovendien werd een stempelmachine aangeschaft, zeer

This dissertation (Chapter 3) (3) Algebra and vocabulary skills at the start of an undergraduate programming course predict. programming skills at the end of the course,

tijden berekend zijn via empirische relaties die op hun beurt ver- kregen zijn uit relaksatietijden metingen die onderling ~en grate spreiding vertonen (zie

After analyzing scenario three, where the US Armed Forces were unaware of the location of the MSF hospital and aware of enemy presence, it may be concluded

De ecologische impact op een systeem zal alleen te bepalen zijn als naar het effect op specifieke soorten wordt gekeken en niet aan de hand van kwantitatieve algemene gegevens

Je kunt een beschrijving geven van de verschillende landschapszones (tropische, subtropische, gematigde, boreale, polaire en aride zone), waarbij je ingaat op het aanwezige

Ondertussen hebben regionale overheden, zoals provincies, waterschappen en gemeentes, juist behoefte aan kennis om de voortgang van de circulaire economie in hun regio op een

Femke Verwest (PBL Netherlands Environmental Assessment Agency); Philip Taylor (Federation Business School, Federation University Australia); Leo van Wissen (University of