using deep learning
Data-efficient discovery of thermoelectric materials
Academic year 2019-2020
Master of Science in Engineering Physics
Master's dissertation submitted in order to obtain the academic degree of
Cools-Ceuppens
Counsellors: Dr. ir. Michael Sluydts, Ir. Michiel Larmuseau, Ir. Maarten
Supervisors: Prof. dr. Stefaan Cottenier, Prof. dr. ir. Toon Verstraelen
Student number: 01508270
Preface
As in the blink of an eye, the exploration of a varied range of interesting physics courses has lead me and my fellow students to achieve our degree as applied scientists. More answers provide more questions and if one thing is clear, it is that an engineering physicist is able to tackle all kinds of challenging but rewarding topics. While I am usually guided be an unstoppable interest in quantum behaviour, I lately discovered the fascinating and surprising field of artificial intelligence. After an insightful summer internship at ML6, who would have thought it would be possible to reconcile both fields in a Master’s thesis?
Although the decision for this thesis subject may or may not have been guided by an excellent coffee machine at first, the continuous surprise of machine learning insights into these areas of physics have given me a lot of joy during this year. Above all, these nine months were a time of exploring the boundaries of science while sharing a large number of great laughs with both my thesis colleagues Enes and Frederik, but to the same extend with my thesis counsellors Michael, Maarten en Michiel. I will certainly miss the great atmosphere that was present in the complete CMM corridor, where the doors were always open to provide not only excellent physical insights but also a good sense of humour. More than ever, I became convinced that scientific research is a wonderful way to spend your time. I would like to thank professor Toon Verstraelen and professor Stefaan Cottenier for giving me the opportunity to temporarily join these halls.
Even when we were removed from our second homes in Zwijnaarde by a global pandemic, the team spirit persisted. I sincerely want to thank Michiel, Maarten and Michael for always being there to help and encourage. I would also like to thank Enes, Frederik and our other fellow students for always keeping me both interested and amused. I am very grateful for my corona bubble at home for their patience and comfort in languages that at some times shifted more to scientific English and Python from my part.
A last word of thanks goes to my girlfriend Jolien, among others for always pretending to share my love for graphs whilst providing me with a constant range of healthy snacks including but not limited to rhubarb lemonade and grilled chickpeas.
Jasper De Witte May 30, 2020
Copyright agreement
The author gives permission to make this master dissertation available for consultation and to copy parts of this master dissertation for personal use.
In all cases of other use, the copyright terms have to be respected, in particular with regard to the obligation to state explicitly the source when quoting results from this master dissertation.
Jasper De Witte May 25, 2020
Data-efficient discovery of
thermoelectric materials
using deep learning
by Jasper De Witte
Supervisors: Prof. dr. Prof. Stefaan Cottenier, Prof. dr. ir. Toon Verstraelen Counsellors: dr. ir. Michael Sluydts, ir. Michiel Larmusseau, ir. Maarten Cools-Ceuppens
Master’s dissertation submitted in order to obtain the academic degree of Master of Science in Engineering Physics
Faculty of Engineering and Architecture Academic year 2019-2020
Overview
Machine learning models are constructed for the prediction of thermoelectric material properties. Properties of interest include the material stability, the electronic band gap and the thermoelectric power factor. Trained on ab initio data, these allow for material discovery, orders of magnitude faster than conventional high-throughput methods. Deep learning models are built upon existing architectures that are used for the prediction of formation energies. Throughout this work, different machine learning techniques are tested to improve on the results. Data-efficient transfer learning techniques from natural language processing and computer vision are studied for their performance in a materials science setting. This way, knowledge transfer along different material properties and datasets is able to outperform ordinary training methods. Along with the inclusion of domain knowledge, all constructed models are able to improve on the current state of the art. By application on an in-house dataset of quaternary materials, three material groups are discovered as promising candidate materials for thermoelectric purposes.
Keywords
Density functional theory, deep learning, thermoelectricity, transfer learning, quaternary materials
Data-efficient discovery of thermoelectric materials
using deep learning
Jasper De Witte
Supervisor(s): Prof. dr. Stefaan Cottenier, Prof. dr. ir. Toon Verstraelen
Counsellor(s): dr. ir. Michael Sluydts, Ir. Michiel Larmusseau, Ir. Maarten Cools-Ceuppens Abstract— Quantum mechanical simulations are considered to be very
versatile tools for material screening, but still require tremendous amounts of computing time on supercomputing clusters. In this work, deep learning models are constructed to perform predictions with the same ab initio (from first principles) accuracy. In order to accelerate the discovery of thermo-electric materials, we focus on different related properties. The predictions are possible by extending on the previous work regarding deep learning architectures to model quantum mechanical interactions in materials. This way, state-of-the-art performance is achieved or improved for all properties of interest. This allows to employ the techniques for material screening, or-ders of magnitude faster than conventional methods. Evaluation on unseen data from a different distribution remains a sore point for most machine learning architectures. Nevertheless, the resulting procedure is evaluated on an house dataset containing quaternary structures, of particular in-terest because of their complex unit cells. This way, we find that new mate-rial classes such as quaternary tellurides of the form Z2AXTe4or AXZTe3
and antimonides of the form Z2AXSb2are promising candidates for
ther-moelectric applications.
Keywords— DFT, deep learning, thermoelectricity, transfer learning, quaternary materials
I. INTRODUCTION
T
HERMOELECTRIC materials are able to convert heat into electric power.[1] Their performance is captured by the di-mensionless figure of merit zT = σS2T /κ, with σ the electrical conductivity, S the Seebeck coefficient, T the temperature and κ the thermal conductivity.[2] It embodies the complex interplay of material properties necessary for the efficient conversion of energy. A large Seebeck coefficient implies a large open-circuit voltage for a given temperature difference. A high electrical conductivity reduces Joule heating to prevent a reduction of the temperature difference. During operation, the large temperature difference can be maintained because of the low thermal con-ductivity. The coupling between entropy currents and particle currents allows for the direct conversion of thermal to electrical energy. If a figure of merit of zT =4 is achieved, thermoelectric generators are likely to become useful for global-scale produc-tion.Even though different device architectures have been studied, the major challenge remains to discover the optimal performing material for the task[3]. Similar innovations in materials design dictate the potential for all kinds of energy technologies includ-ing but not limited to catalysts, solar cells and solid state batter-ies. Materials design has been guided by experimental testing in the past but remains a very time-consuming process guided by a lot of trial and error.
Over the years, innovations in computer science have lead to a great boost in the performance of computational modelling. Thanks to ab initio methods, the calculation of material proper-ties has proven successful since the 1970s[4]. Large-scale
cal-culations are possible with the current computational power of supercomputer clusters. High-throughput (HT) screening of ma-terial databases to find the optimal candidate mama-terials has be-come common practice. Nevertheless, it still requires hundreds or thousands of core years with immense computing powers. Such computational efforts have led us to ‘the fourth paradigm of science’: data-driven discovery. Within this point of view, the variety of available data can be bundled to allow the extraction of knowledge. New analytical techniques are being improved at an ever-increasing pace to retrieve new insights without the use of our own physical intuition. These methods are considered to be part of machine learning. Such algorithms construct a math-ematical model based on training data to make predictions for unseen samples. They are related to statistical methods, rather than our own explicitly programmed knowledge. This way, ma-chine learning models are starting to provide new insights in all kinds of different applications.
In this work, we construct machine learning models that are able to screen material databases for candidate materials in thermoelectric applications. The relationship between ma-terial structures and their thermoelectric performance is rather complex. Nevertheless, we are keen to retrieve an unknown and complex mapping between these crystal structures and their thermoelectric performance. It are these relations that we try to describe with machine learning architectures.
A. Data collections
To train our models, data was provided by similar crystal datasets. Numerous computationally expensive calculations of material properties have been performed in the past with density functional theory[4] (DFT). It allows for a direct mapping be-tween the electron density and the material properties.[5] That reduces the many-boy problem of N electrons with 3N spatial coordinates to the three spatial coordinates of the electron den-sity. It allows for a tractable method that is broadly applica-ble, within certain approximations[6]. Thanks to global-scale contributions of both material scientists and computer scientists, databases of calculations have been constructed to boost mate-rial discovery. We use data from 120 577 crystals provided by the Materials Project (MP) [6]. For more specific thermoelectric properties, the dataset by Ricci et al.[7] is used that contains 7 957 samples. It is available on the MPContribs[8] platform and contains results for a subset of the Materials Project. This way, the data can easily be combined for further analysis.
Material screening by application of our machine learning models will be applied on a dataset of quaternary materials that is constructed over the years at the CMM. Quaternaries contain 4 different chemical elements in the unit cell. Such materials have a higher chance to obtain complex crystal structures which makes them ideal for thermoelectric investigation. Material structures were taken from the experimental ICSD database[9], and the set was enlarged by substituting different elements. Around 65% of the materials are chalcogenides, containing S, Se or Te. All the chemical elements come from the s- and p-blocks of the periodic table.
II. METHODOLOGY
A. The SchNet architecture
With increasing data availability and computing power, ma-chine learning models are continuously growing in size. When at least thousands of data samples are available and the task of finding the optimal mapping between the inputs and the outputs is sufficiently complex, deep neural networks have become stan-dard practice. Neural networks contain massively parallel com-putation graphs inspired by the information processing in the brain. The term ‘deep’ reflects the large number of layers used to progressively extract more informative features from the raw input. This way, it eliminates the need for man-made feature extraction as is common in more traditional machine learning approaches. Deep learning for some research areas such as com-puter vision (CV) and natural language processing (NLP) have already become quite mature.[10] Lately, applications in materi-als science have sparked an interest as well.[11], [12], [13], [14] Therefore, we are able to build upon existing neural network ar-chitectures that have proven to be successful in the past. For our predictive models, we can extend the SchNet[12] ar-chitecture for materials. As an input, only the atomic numbers (Z1, ...Zn)and nuclear positions (r1, ..., rn)are used. To de-scribe the chemical elements in a language that computers can understand, they are transformed to a higher dimensional fea-ture vector (xl
1, ..., xln). l denotes the specific model layer and n is the dimension of our vector, also referred to as the num-ber of features. This vector gets updated throughout the model by so-called interaction blocks that capture the complex inter-actions between the nuclei. That is done by the application of continuous-filter convolutions[11] on the unit cell . The number of filters determines the processing power of the system. This way, material features are learned that take into account differ-ent contributions. The number of interaction blocks denotes how deep the model becomes, to take into account more complex and specific interactions. After a sufficient number of interactions, cross-feature information is processed by an output block. This way, the high-dimensional feature representation is reduced un-til one outcome for the required physical property is found. For a more elaborate explanation of the working principles of this model, we refer to the original work by Sch¨utt et al.[12]. B. Transfer learning
Transfer learning is a technique that focusses on knowledge gained by solving one problem to apply it to a related one. It
involves training a base neural network on a source domain and task and transferring the learned model parameters to a new net-work to train on the target domain and task[15]. When the tar-get domain is small, neural networks with a lot of parameters tend to overfit on the small dataset, making it unable to gen-eralize results to unseen data. Transfer learning from another dataset may greatly reduce overfitting, and has also shown to boost performance[10]. For different material properties, it has proven successful under similar circumstances[14] which is why we continue this line of thought by applying it to the SchNet network. We can transfer the feature vector that decodes the dif-ferent chemical elements across difdif-ferent models. Then, it only remains to train the subsequent processing in the neural network for the specific property. This way, the common behaviour of these elements is shared across machine learning models. C. Thermoelectric properties
Our goal is to select materials that agree to the common re-quirements for thermoelectric applications. This involves many boxes that should be ticked at the same time. A good thermo-electric material should be (energetically) stable. That is defined by the energy above the convex hull. For a material that is ap-plicable in practice, this value should remain very small. Fur-thermore, best-performing thermoelectric materials are doped semiconductors. To distinguish these, we are interested in the material band gap. Unwanted metals are removed by only se-lecting structures that contain a finite band gap. The remaining materials can be ranked based on the thermoelectric properties. In the literature, the complete figure of merit zT is usually not reported. Instead, it is common to focus on the power factor σS2which is another necessary but less time-consuming prop-erty[13] to determine. It omits the need to validate the thermal conductivity, which is still difficult to accurately determine us-ing DFT methods.[16], [17] This omission is motivated as the range of values for the thermal conductivity is a lot smaller than that of the power factors. To ensure the selection of appropriate materials, we thus apply a multi-step detection procedure: • The energy above the convex hull should be smaller than 50 meV to select (meta-) stable materials.
• The band gap should be larger than 50 meV to exclude metals. • The remaining materials are ranked by their power factor to ensure good thermoelectric performance.
We construct models that are able to determine these criteria by making different adaptations to the SchNet[12] architecture. C.1 Energy models
To asses the stability of a material, a lot of research has al-ready been done to predict the energy using machine learning. The SchNet[12] for materials architecture has been optimized to determine the formation energy which is not suited to make a complete prediction of the material stability. Rather, we make predictions regarding the energy above the convex hull which is also present in our training set. The difference is the reference
energy. Where the formation energy is relative to elemental ma-terials, the energy above the convex hull takes all known mate-rials into account. Nevertheless, apart from an optimization of the design choices, these predictions can be done with a very similar architecture.
C.2 Band gap models
Models similar to the SchNet architecture have been used in the past to predict material band gaps.[18], [19], [14] For these, the benefits of transfer learning were noted.[14] It turns out that the features used for the prediction of the formation energy are able to improve the band gap prediction. We therefore adopt the same technique and apply it to the SchNet model. Some mi-nor tweaks are able to further improve its performance. Similar prediction of one outcome for the band gap gives reliable re-sults. We can however expand the model to insert some domain knowledge. In physics, the fundamental band gap is defined by the energy difference between the top of the valence band and the bottom of the conduction band. Similarly, we can determine the band gap based on two output values. This way, we im-plicitly allow the model to regard the material band gap as the difference between both values. Ideally, these represent the two orbital energies. The band gap prediction is then defined as the difference between the maximal outcome for one orbital and the minimal outcome for another.
C.3 Power factor prediction
Machine learning models able to map only the material struc-ture to the complex thermoelectric properties have not been studied in the past. Instead, more traditional approaches have been applied to man-made material descriptors. For the pre-diction of power factors, we can compare with the results from Choudhary et al.[19]. They made a model to classify whether a candidate material falls in the higher or lower half of their power factor dataset. To maintain a broadly-applicable procedure, we will only use this preceding work as a benchmark. For our pre-dictions of thermoelectric properties with the SchNet network, the outcome of our model can again be reduced to a single value. Available data that contains power factor values is more scarce than for other properties. As a result, the benefits of transfer-ring common knowledge through the elemental feature vector increase. Information from the band gap models proved most useful. This comes as no surprise since the underlying transport properties are related to the band structure. To reduce overfitting to the smaller dataset, it proved useful to keep training times lim-ited. Similar to the work from Choudhary et al.[19], we finally classify whether the material under investigation falls in the up-per half of thermoelectric up-performance. In our case, that results in a threshold of 31.836 ln(µW/cmK2s) for a doping concentra-tion of 1018/cm3at 300 K.
III. RESULTS AND DISCUSSION
A lot of insight can be obtained from the analysis of our mod-els. In general, the performance is correlated with the cover-age of similar materials in the training set. For all models, re-gions of material space that are less populated in the training set are prone to larger errors. The MP dataset consists mainly
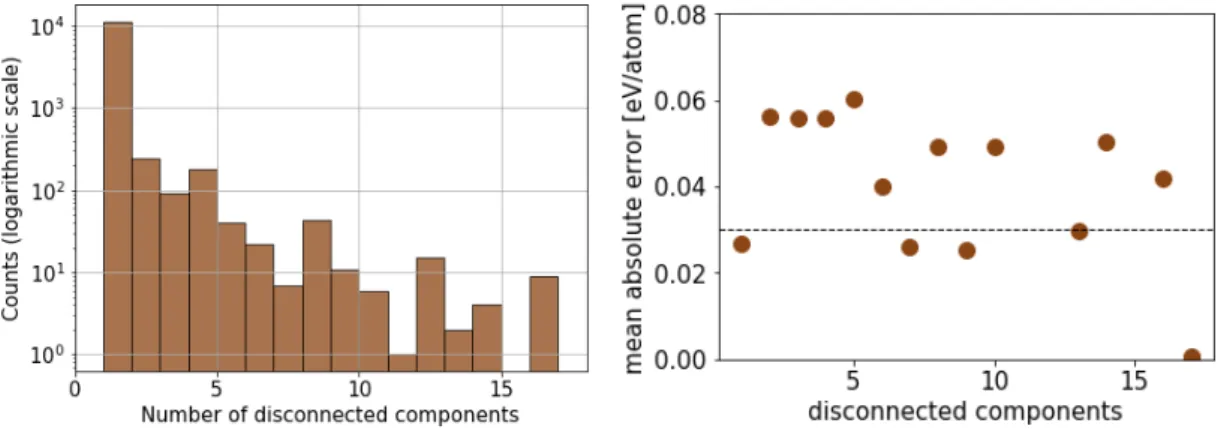
of 3D bulk materials. Nevertheless, we still found hundreds of 1D and 2D materials by applying typical graph algorithms[20]. Even structures with non-bonding clusters in the unit cell appear. Since these are under-represented as opposed to the majority of bulk materials, our model is not able to achieve similar perfor-mance for these cases. However, as much of the recent interest in thermoelectrics is focussed on nanostructured thin-films and wires[21], future additions might widen our applicability of the material space.
Furthermore, it is important to note that direct comparison with previous work should be done with care. The Materi-als Project database is constantly being expanded and updated. Therefore, it is relevant to know that we used version V2019.05 containing the materials available on October 2019.
A. Energy above the convex hull
As a starting point, we retrieve the same results for the for-mation energy as the current state-of-the-art[14] by the original implementation. This allows us to proceed to the energy above the convex hull as our stability metric of choice. Evaluation on the test set gives a mean absolute error (MAE) of 0.0307 eV/atom. Compared to the formation energy model (MAE = 0.0280 eV/atom), our results seem only to be slightly affected by the new definition. For unstable materials, the mean error is usually higher than for stable materials. However, since we are only interested in finding stable samples, this is not interpreted as an issue.
B. Band gap
To inspect the results of our new molecular orbital imple-mentation that consists of two outputs, we compared the perfor-mance for different model architectures. The results are given below:
Fig. 1. Result of the band gap predictions for increasingly complex models. The complexity of the model is denoted by three model parameters, namely the number of filters, features and interactions. The mean absolute error of the band gap (eV) is shown when using both the normal aggregation function and the new molecular orbital implementation.
Across all different design choices, the new method consis-tently outperforms the ordinary implementation. This proves our technique to be successful.
Two different tasks can be given to band gap models. So far, we have only tried to predict the exact outcome. Depending on the band gap value, a clear distinction can be made between metals and non-metals. In this work, we consider the common threshold of 50 meV to determine whether it belongs to one of
both classes. Band gaps smaller than 50 meV are generally con-sidered to belong to metals. Values above this point denote non-metals. Classification models are commonly evoked in the lit-erature to distinguish between both options. Only in a second step, the exact value is then predicted for non-metals.
Immediate quantitative results either indicate a metal or pre-dict the band gap of a non-metal. In our case, the optimal per-formance for the combined selective task was also found by a combined model. That means our models are trained on both metals and non-metals. As a result, it can also be directly ap-plied on any unseen sample no matter the class it belongs to. However, this makes direct comparison with the literature diffi-cult. As it was more common to separate both tasks in the past, a different number of training samples were used for the non-metal bandgap predictions. Still, we can compare the results of the ordinary implementation as opposed to the new method that includes the molecular orbitals (MO) implementation. The results are given below:
TABLE I
BAND GAP PERFORMANCE,COMPARED TO THE MODELS FROM THE LITERATURE. SCHNET DENOTES OUR ORIGINAL MODEL ANDSCHNET+
MODENOTES THE INCLUSION OF THE NEW MOLECULAR ORBITAL METHOD. REGARDING THE DATASET,WE COMBINED METALS AND NON-METALS IN ONE MODEL. THE NUMBER OF TRAINING SAMPLES IS GIVEN BETWEEN BRACKETS. FOR EVALUATION,THE MEAN ABSOLUTE
ERROR IS GIVEN IN EV.
Method Dataset MAE (eV)
CGCNN[18] MP non-metals (16 485) 0.388 MEGNet[14] MP non-metals (36 720) 0.330
SchNet full MP (96 461) 0.237
SchNet + MO full MP (96 461) 0.206
Both the MEGNet[14] performance and our results were found including the same transfer learning approach. Again, the molecular orbital implementation outperforms the ordinary method. Combined with the effect of the enlarged dataset, the improvement on the previous state-of-the-art results is substan-tial. This way, our machine learning model will be able to distin-guish small band gap materials better than possible before. By applying a threshold at 50 meV, we can also compare the results with classification methods from literature:
TABLE II
COMPARISON OF OUR MACHINE LEARNING MODEL WITH PREVIOUS CLASSIFICATION MODELS FOR NON-METALS. TPRDENOTES THE TRUE
POSITIVE RATE ANDTNRDENOTES THE TRUE NEGATIVE RATE.
Method Dataset TPR TNR
CGCNN[18] MP (28 046) 0.95 0.8 MEGNet[14] MP (55 391) 0.91 0.79 SchNet + MO MP (96 461) 0.91 0.85
Again, an overall improvement is found. It is important to note that the datasets have become much more diverse than pre-vious MP versions, especially the one used in the CGCNN net-work. When preferred, the classification threshold can be
ad-justed. This can move the focus either towards detecting all met-als or all non-metmet-als. The cost of a higher true positive rate is the inclusion of more false positives. For practical applications, an appropriate trade-of will dictate the final decision.
C. Thermoelectric properties
After the selection of stable non-metals, we finally arrive at the determination of the most promising thermoelectric samples. We decided to directly assess the thermoelectric power factor, with the inclusion of transferred knowledge from our band gap model. The results are given below:
TABLE III
COMPARISON OF OUR POWER FACTOR MODEL WITH PREVIOUS WORK. TWO OF THE THEIR RESULTS ARE GIVEN AS TAKEN FROM THE CHARACTERISTIC CURVE. TPRDENOTES THE TRUE POSITIVE RATE AND
FPRDENOTES THE FALSE POSITIVE RATE.
Work Dataset TPR FPR
Choudhary et al.[19] JARVIS-DFT (7 887) 0.60 0.19 0.85 0.43 This work MPContribs (7 957) 0.85 0.19 It is clear the application of the SchNet[12] architecture along with the transferred knowledge from band gap models allows for a large increase in performance. For similar results, the previous methods would either have to lose out in the true positive rate or select more false positives. That is a clear confirmation that abandoning the use of man-made feature descriptors is a step in the right direction for thermoelectric applications. A closer inspection shows that most difficulties arise in the correct pre-diction of especially low or high power factors. As these are uncommon in the training set, this is in line with the common cause of errors although we are typically interested in the best-performing sample. Therefore, a closer inspection of the highest ranked candidates might be more useful than the exact outcome of their respective power factors.
D. Evaluation on the quaternary dataset
For all three steps in the selection procedure denoted in the introduction of Section II, performances were achieved that ac-quire or improve on the current state-of-the-art. This allows for the reliable application on a material set of study. Over the years, an in-house dataset of quaternary materials has been constructed at the CMM. They are made up of four different chemical el-ements and can generally be considered to have complex unit cells. For that reason, they have the potential to be of interest for thermoelectric applications.
The dataset consists of 8 383 quaternary materials. DFT cal-culations in the past have already assessed the material stability and band gap. Thermoelectric calculations have so far not been considered. As computed by DFT, only 1 639 are considered to be (meta-)stable as they contain an energy above the convex hull of under 50 meV. The selection of non-metals further re-duces this number to 942 candidates. In other circumstances, DFT data might not be available. In that case, we can resort to the energy and band gap models trained on the MP database.
After inspection on the quaternary validation set, we found that 84% of the samples would have been retrieved this way. This confirms the strength of our models even on unseen data from a different distribution.
Finally, application of the power factor model is able to make predictions and select the best performing thermoelectric can-didates. Before diving into the results, we can inspect whether our model is able to reproduce a common relation with the band gap. From other high-throughput screening results[19], a de-creasing trend in terms of the power factor with respect to the band gap has been observed. It is interesting to see whether the calculated band gap by DFT, the predicted band gap and the predicted power factor are able to reproduce this relation for the current dataset. The results are visualized below:
Fig. 2. Relation between the band gap and predicted power factors of the qua-ternary dataset. Egdenotes the material band gap.
This is yet another check that seems to confirm the validity of our results as they agree to the known relationship with the band gap. It is a sign the model more or less focusses on this typical behaviour. From the predicted values, we can further in-spect the best-performing samples. This way, roughly 85% of the remaining selection is determined to fall into the category of high thermoelectric performance. That is a clear sign that the quaternary dataset contains a larger fraction of interesting can-didate materials as opposed to our training set.
Interestingly, the best-performing samples that arise appear to be dominated by three classes of material structures. These are of the form Z2AXTe4, AXZTe3and AXZ2Sb2. Several appro-priate materials are found with varying chemical elements on the Z-, A- and X-positions.
D.1 Z2AXTe4(Z = Ba, Na)
The first series of materials contains quaternary tellurides of the form Z2AXTe4. These are closely linked with the large power factor materials Tl2HgSnTe4, Tl2GeHgTe4 and Tl2CdSnTe4, part of the 15 best-performing structures in the training set. They were studied in the past by McGuire et al.[22] regarding their thermoelectric properties. All are iso-structural and crystallize in the same tetragonal spacegroup I-42m. As ex-pected for thermoelectric materials, they contain a complex unit cell. An example is shown in Figure 3.
Fig. 3. Ba2InNaTe4: a material structure selected to have promising
thermo-electric properties by our machine learning model.
It consists of 1D chains of edge-sharing tetrahedra centered around the A- and X-atoms with Te at the vertices. Different chains are separated by the Z-atoms. Similar to the Tl tellurides from McGuire et al.[22], the Z-, A- and X-atoms are located at the positions (0 1/2 0), (0 0 1/2) and (0 0 0) respectively. The Te atoms at the vertices remain located at (x x z) positions, with dif-ferent values for the x and z positions in difdif-ferent materials. The Tl tellurides synthesized by McGuire te al. are semiconductors with very low thermal conductivities and relatively high See-beck coefficients. They were the first to report this specific crys-tal structure. No stable structures were found when replacing the Tl1+ ions with alkali-metals. From our results, Na and Ba represent both an alkali- and alkaline earth metal able to make the replacement. Since these are also stable semiconductors, our model is very likely to have predicted these new promising materials correctly. It might be interesting to see whether these predictions can be confirmed by DFT and experiment in the fu-ture.
D.2 AXZTe3and Z2AXSb2
The remaining two material groups are of the form AXZTe3 and Z2AXSb2. Again, both series contain materials with a re-lated structure. They crystallize in the P21/c and Ibam space-group respectively. No similar materials are present in the train-ing set that allow for a direct comparison. Nevertheless, we can inspect a sample of the antimonides in Figure 4.
Fig. 4. Na2KGaSb2, from the series of high performing antimonides
Separated chains of connected tetrahedra, similar to the struc-tures from Section III-D.1, occur in all antimonide samples.
This might be a clue for the reason of their selection. Again, it is interesting for further research to see why and if these materials are correctly indicated for their thermoelectric performance.
IV. CONCLUSION
In this work, we have successfully constructed different ma-chine learning models to asses the thermoelectric potential of a given material structure. A stable non-metal is desired with a high power factor. All three underlying properties are deter-mined with machine learning models to see whether a given material structure meets the requirements. First, a model pre-dicts the stability with a MAE of 0.0301 eV/atom for the en-ergy above the convex hull. Then, non-metals are detected by the band gap model with a true positive rate of 0.91. Finally, a ranking of thermoelectric potential is applied to select high power factor materials with a true positive rate of 0.85. Pre-dictions of both the band gap and the power factor benefit from transfer learning across related tasks. Application of this proce-dure on an in-house dataset of quaternary structures allows for the determination of new material groups of interest. The best-performing thermoelectric candidates are dominated by three sets of which at least one has already partly been found in the past. All three therefore deserve a closer look in future work.
Some of the applied changes to the SchNet[12] model lead the way to evident further improvements. A small adjustment to the band gap models allowed for a more accurate material pre-diction thanks to a closer relation with the underlying physics. This opens the door to a more complete description of the ma-terial property in k-space. Although it remains unclear how to accomplish this with limited computing power, a successful im-plementation might prove to be very beneficial. So far, this map-ping has only been performed implicitly. Besides, the inclusion of training data regarding the bottom of the conduction band and the top of the valence band would undoubtedly further improve the band gap predictions.
In the future, material datasets will continue to expand. As a result, all models will further improve in performance due to the increase of training input. In the near future, the availability of thermoelectric data on the MPContribs platform will become five-fold. This will hopefully provide a boost to thermoelectric predictions, of which the machine learning approach has so far been under-exposed.
In a ‘sharing is caring’ setting, similar machine learning mod-els might all benefit from more related datasets. Unfortunately, large-scale calculations of transport properties remain untrivial. As thermoelectric datasets appear more related with each other than with experiment[19], direct training on experimental data might further expand the limits of material discovery. Another shortcoming at the current stage is the assumption to receive relaxed material structures. This way, a DFT step remains nec-essary before the machine learning models are able to embrace their full potential. When that issue is resolved, optimal materi-als can easily be found in materimateri-als space without the burdens of experimental or computationally expensive techniques. As these possibilities will definitely become realistic later on, a great fu-ture lies ahead for data-driven materials science.
REFERENCES
[1] H Julian Goldsmid et al., Introduction to thermoelectricity, vol. 121, Springer, 2010.
[2] G Jeffrey Snyder and Alemayouh H Snyder, “Figure of merit zt of a ther-moelectric device defined from materials properties,” Energy & Environ-mental Science, vol. 10, no. 11, pp. 2280–2283, 2017.
[3] Jose Recatala-Gomez, Ady Suwardi, Iris Nandhakumar, Anas Abutaha, and Kedar Hippalgaonkar, “Toward accelerated thermoelectric materials and process discovery,” ACS Applied Energy Materials, vol. 3, no. 3, pp. 2240–2257, 2020.
[4] Walter Kohn and Lu Jeu Sham, “Self-consistent equations including ex-change and correlation effects,” Physical review, vol. 140, no. 4A, pp. A1133, 1965.
[5] P. Hohenberg and W. Kohn, “Inhomogeneous electron gas,” Phys. Rev., vol. 136, pp. B864–B871, Nov 1964.
[6] Anubhav Jain, Shyue Ping Ong, Geoffroy Hautier, Wei Chen, William Davidson Richards, Stephen Dacek, Shreyas Cholia, Dan Gunter, David Skinner, Gerbrand Ceder, et al., “Commentary: The materials project: A materials genome approach to accelerating materials innova-tion,” Apl Materials, vol. 1, no. 1, pp. 011002, 2013.
[7] F. Ricci, W. Chen, U. Aydemir, G.J. Snyder, G.-M. Rignanese, A. Jain, and G. Hautier, “An ab initio electronic transport database for inorganic materials,” Scientific Data, vol. 4, pp. 170085, 2017.
[8] Patrick Huck, Dan Gunter, Shreyas Cholia, Donald Winston, AT N’Diaye, and Kristin Persson, “User applications driven by the community contri-bution framework mpcontribs in the materials project,” Concurrency and Computation: Practice and Experience, vol. 28, no. 7, pp. 1982–1993, 2016.
[9] Mariette Hellenbrandt, “The inorganic crystal structure database (icsd)—present and future,” Crystallography Reviews, vol. 10, no. 1, pp. 17–22, 2004.
[10] Jason Yosinski, Jeff Clune, Yoshua Bengio, and Hod Lipson, “How trans-ferable are features in deep neural networks?,” in Advances in neural in-formation processing systems, 2014, pp. 3320–3328.
[11] Kristof Sch¨utt, Pieter-Jan Kindermans, Huziel Enoc Sauceda Felix, Stefan Chmiela, Alexandre Tkatchenko, and Klaus-Robert M¨uller, “Schnet: A continuous-filter convolutional neural network for modeling quantum in-teractions,” in Advances in Neural Information Processing Systems, 2017, pp. 991–1001.
[12] Kristof T Sch¨utt, Huziel E Sauceda, P-J Kindermans, Alexandre Tkatchenko, and K-R M¨uller, “Schnet–a deep learning architecture for molecules and materials,” The Journal of Chemical Physics, vol. 148, no. 24, pp. 241722, 2018.
[13] Michael W. Gaultois, Taylor D. Sparks, Christopher K.H. Borg, Ram Se-shadri, William D. Bonificio, and David R. Clarke, “Data-driven review of thermoelectric materials: Performance and resource onsiderations,” Chemistry of Materials, vol. 25, no. 15, pp. 2911–2920, 2013.
[14] Chi Chen, Weike Ye, Yunxing Zuo, Chen Zheng, and Shyue Ping Ong, “Graph networks as a universal machine learning framework for molecules and crystals,” Chemistry of Materials, vol. 31, no. 9, pp. 3564–3572, 2019. [15] Yoshua Bengio, “Deep learning of representations for unsupervised and transfer learning,” in Proceedings of ICML workshop on unsupervised and transfer learning, 2012, pp. 17–36.
[16] David A Broido, Michael Malorny, Gerd Birner, Natalio Mingo, and DA Stewart, “Intrinsic lattice thermal conductivity of semiconductors from first principles,” Applied Physics Letters, vol. 91, no. 23, pp. 231922, 2007.
[17] Jivtesh Garg, Nicola Bonini, Boris Kozinsky, and Nicola Marzari, “Role of disorder and anharmonicity in the thermal conductivity of silicon-germanium alloys: A first-principles study,” Physical review letters, vol. 106, no. 4, pp. 045901, 2011.
[18] Tian Xie and Jeffrey C Grossman, “Crystal graph convolutional neural net-works for an accurate and interpretable prediction of material properties,” Physical review letters, vol. 120, no. 14, pp. 145301, 2018.
[19] Kamal Choudhary, Kevin Garrity, and Francesca Tavazza, “Data-driven Discovery of 3D and 2D Thermoelectric Materials,” pp. 1–24, 2019. [20] David J Pearce, “An improved algorithm for finding the strongly connected
components of a directed graph,” Victoria University, Wellington, NZ, Tech. Rep, 2005.
[21] G Jeffrey Snyder and Eric S Toberer, “Complex thermoelectric materials,” in materials for sustainable energy: a collection of peer-reviewed research and review articles from Nature Publishing Group, pp. 101–110. World Scientific, 2011.
[22] Michael A McGuire, Thomas J Scheidemantel, John V Badding, and Fran-cis J DiSalvo, “Tl2axte4 (a= cd, hg, mn; x= ge, sn): crystal structure, elec-tronic structure, and thermoelectric properties,” Chemistry of materials, vol. 17, no. 24, pp. 6186–6191, 2005.
Contents
Preface i Copyright agreement ii Overview iii Extended Abstract iv Table of contents xList of abbreviations xiv
List of symbols xv
1 Introduction 1
1.1 Simulation of material properties . . . 2
1.2 From DFT to machine learning . . . 3
1.3 Goal of this work . . . 3
1.4 Structure of this work . . . 4
2 The physics of thermoelectric materials 5 2.1 The thermoelectric effect . . . 5
2.2 Thermoelectric materials . . . 7
2.3 Thermoelectric properties of metals and semiconductors . . . 7
2.3.1 The Wiedemann-Franz law . . . 7
2.3.2 The Seebeck coefficient . . . 8
2.4 Material stability . . . 10
2.5 Band gap . . . 12
3 High-throughput computing 13 3.1 Materials screening . . . 13
3.2 Materials Project . . . 14
3.2.1 Materials Project methodologies . . . 15
3.2.2 Corrections . . . 15
CONTENTS xi
3.2.3 Content . . . 16
3.3 Transport properties . . . 16
3.4 Screening for thermoelectric materials . . . 17
3.5 Thermoelectric dataset . . . 19
3.6 Quaternary materials . . . 20
4 Machine learning: accelerating screening 21 4.1 Efforts for thermoelectric materials . . . 21
4.2 Energy predictions . . . 23
4.3 The SchNet model . . . 24
4.3.1 Material representation . . . 25
4.3.2 Atomwise layers . . . 25
4.3.3 Continuous filter convolutional layer . . . 27
4.3.4 Filter generating network . . . 29
4.3.5 Interactions blocks . . . 32
4.3.6 Wrap-up and output module . . . 32
4.3.7 Model training . . . 33
4.4 Band gap predictions . . . 34
4.5 Transfer learning . . . 35
4.5.1 Transfer learning in computer vision . . . 36
4.5.2 Transfer learning in natural language processing . . . 37
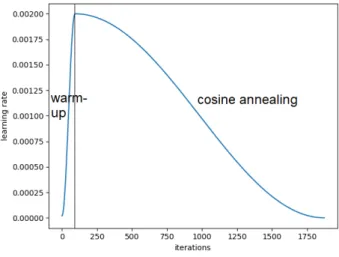
5 Methodology 40 5.1 Overview . . . 40 5.2 General considerations . . . 41 5.2.1 Learning rate . . . 41 5.2.2 Loss function . . . 42 5.2.3 Optimizer . . . 42 5.2.4 Splits . . . 45 5.2.5 Cut-off radius . . . 45 5.2.6 Aggregation method . . . 45 5.3 Model architecture . . . 45
5.4 The number of parameters . . . 46
5.5 Memory and time constraints . . . 48
5.6 Regularization . . . 48
6 Stability predictions 50 6.1 Formation energy . . . 50
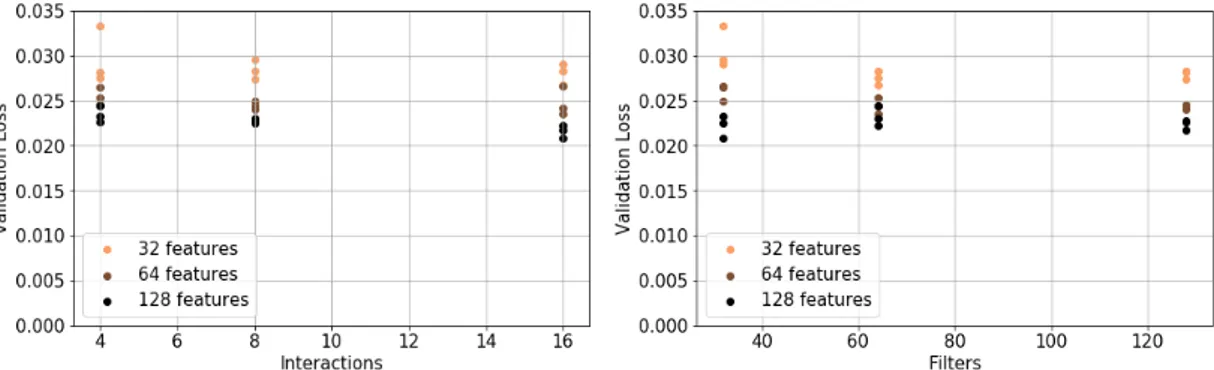
6.2 Sweeping the model parameters . . . 51
6.3 Inspecting the errors . . . 51
6.4 The effect of Batch Normalization . . . 57
6.5 Ensembles . . . 59
6.6 The convex hull energy . . . 60
CONTENTS xii
7 Band gap predictions 64
7.1 Sweeping the model parameters . . . 64
7.2 Including domain knowledge . . . 65
7.3 Transfer learning properties . . . 66
7.4 Transfer learning on the full Materials Project . . . 70
7.5 Analysis of results . . . 71
7.6 Classification . . . 72
8 Thermoelectric predictions 75 8.1 Thermoelectric data . . . 75
8.2 Sweeping the model parameters . . . 76
8.3 Transfer learning . . . 77
8.4 Discriminative learning rates and gradual unfreezing . . . 79
8.5 Analysis of results . . . 81
8.6 Comparison with previous attempts . . . 82
9 Thermoelectric discovery 84 9.1 Dataset recap . . . 84
9.2 Evaluation of MP models . . . 85
9.3 Ensemble predictions . . . 86
9.4 Model training . . . 87
9.5 Screening for thermoelectric properties . . . 89
9.5.1 Validation: reproduction of band gap trends . . . 89
9.5.2 Analysis of the discovered candidate materials . . . 90
9.6 Conclusion . . . 93
10 Conclusion and outlook 94 10.1 Conclusion . . . 94
10.2 Outlook . . . 95
A Materials Project: training data visualization 97 A.1 Energy, band gap and magnetization . . . 97
A.2 Structural properties . . . 98
A.3 Chemical elements and functional . . . 99
B Thermoelectrics and quaternaries 100 B.1 Convex hull energy and band gap . . . 100
B.2 Number of atoms, disconnected components and material dimensions . . . 101
B.3 Number of chemical elements, functionals and power factor . . . 102
B.4 Chemical elements . . . 103
C Formation energy model 104 C.1 Energy, band gap and magnetization . . . 104
CONTENTS xiii
D Energy above the convex hull model 106
D.1 Energy, band gap and magnetization . . . 106
D.2 Structural properties and functional . . . 107
E Band gap model 108 E.1 Energy, band gap and magnetization . . . 108
E.2 Structural properties and functional . . . 109
F Power factor model 110 F.1 Energy, band gap and magnetization . . . 110
F.2 Structural properties and functional . . . 111
G Application on the quaternary material dataset 112 G.1 Chemical elements . . . 112
G.2 Top 99 . . . 113
G.3 Evaluation Ehull model from MP . . . 114
G.4 Evaluation Eg model from MP . . . 115
List of abbreviations
API Application programming interface
CGCNN Crystal graph convolutional neural network CMM Center for Molecular Modelling
CV Computer vision
DFT Density Functional Theory DTNN Deep Tensor Neural Network
FLOPS Floating point operations per second
GD Gradient Descent
GGA Generalized Gradient Approximation GPU Graphics processing unit
HHI Herfindahl Hirschman Index HOMO Highest occupied molecular orbital
HT High-throughput
ICSD Inorganic Crystal Structure Database
KS Kohn-Sham
LARS Layer-wise adaptive rate scaling
LM Language model
LUMO Lowest unoccupied molecular orbital MAE Mean absolute error
MD Molecular Dynamics
MP Materials Project
NLP Natural language processing PAW Projector Augmented Wave PBE Perdew-Burke-Enzerhof
RANGERLARS RAdam + LARS + Lookahead ROC Receiver operating characteristic Stlr Slanted triangular learning rates Std Standard deviation
VASP Vienna Ab Initio Simulation Package
List of symbols
α Learning rate b Bias vector d Distance E Absolute energy Ef Formation energy Eg Band gapE[X] Expectation value of a random variable F Atomic force vector
g Gradient k Wave vector
κ Thermal conductivity
κe Electronic thermal conductivity κl Lattice thermal conductivity l Lorenz number
L Loss function m First moment
P F Thermoelectric power factor r Location vector S Seebeck coefficient σ Electrical conductivity T Temperature τ Relaxation time θ Model parameters v Second moment W Weight matrix
χ Set of inputs for the activation function in a mini-batch zT Thermoelectric figure of merit
Z Atomic number
Chapter 1
Introduction
By the year 2030, our global energy demand is expected to grow by another 50%[1]. By 2050, the EU aims to be completely climate neutral. What will it take for science and engineering to reach these incredible goals?
One thing is clear, to sustain such a tremendous increase in energy production whilst not saturating the air with our large-scale carbon emission, new reliable energy sources are needed. Scientific research is responding and a lot of potential solutions are on the rise. Solar, wind, hydropower, biomass and hydrogen are only a few of the renewable energy resources that will need to be combined in order to satisfy the demands. Even nuclear fusion to produce energy inspired by the processes occurring inside the sun itself, is coming closer. Or is it scheduled for another half a century?
In the past, creative solutions have already been necessary when ordinary techniques to harvest energy did not suffice. For more than 50 years, the NASA has been sending space missions throughout all regions of the solar system with only two methods to produce electricity. Solar power is excellent for Earth-orbiting spacecraft. However, for some of the coldest and darkest locations in the solar system, not enough sunlight and natural heat is available for use. Under these circumstances, the only reliable alternative comes from heat provided by multiple kilograms of radiative decaying plutonium on board. To convert this to electricity, thermoelectric materials are found that are able to naturally produce an electric potential from a temperature difference. This way, the constantly decaying plutonium is able to continuously provide electricity.
About 2/3 of the energy we generate on Earth is inevitably lost as waste heat[2]. What if we are able to recover some of this by making use of the same thermoelectric materials from before? Besides these possibilities, thermoelectric generators contain no moving parts and only solid-state components which makes them very attractive. To provide enough energy under normal consequences, the generator’s efficiency needs a boost. Even though different device architectures have been studied, the major challenge remains to discover the optimal performing material for the task[3].
CHAPTER 1. INTRODUCTION 2
1.1
Simulation of material properties
How do we find the optimal material for our purposes? Material design has been guided by experimental testing in the past. Preparation and measurement of the samples is a very time-consuming method concerning a lot of trial and error. Meanwhile, the Schr¨odinger equation that explains how a material behaves has been known but apart from some simple toy problems, it is very hard to solve analytically. Nowadays, com-puters are able to solve these problems very well thanks to the advent of computational methods, but require tremendous resources on supercomputing clusters. Density Func-tional Theory (DFT) has proven to be very successful in the prediction of material properties since the 1970s. It is an ab initio (from first principles) method that is nowa-days used to model quantum mechanical interactions of up to thousands of atoms. It is based on the founding Hohenberg-Kohn theorems[4] that allow for a direct mapping between the electron density and the total energy. That reduces the many-boy problem of N electrons with 3N spatial coordinates to the three spatial coordinates of the electron density. Further contributions from Walter Kohn and Lu Jeu converted the intractable many-body problem of interacting electrons to a tractable problem of non-interacting particles moving in an effective potential. Practically, it only remains to solve N one-electron equations known as the Kohn-Sham (KS) equations[5]. However, there is a catch. Writing down the exact KS equations requires to know the functional that maps the electron density to the exchange-correlation contribution of the effective potential. An explicit form of this functional is until this day not known, and we have no choice but to use well-chosen estimates. Throughout this thesis, the Perdew-Burke-Enzerhof (PBE) functional[6] within the Generalized-Gradient Approximation[7, 8, 9] (GGA) is used. It is based on the assumption that the contribution to the local effective potential is only based on the local density and its gradient. Implementation in common com-puter software such as Vienna Ab Initio Simulation Package (VASP)[10] requires some additional input settings mostly related to the description of different entities in the finite memory of the computer. By default, these computer programmes calculate the material properties at 0 K without external pressure.
Material structures can also be determined with DFT by finding the atomic positions that minimize the energy of a given configuration. By monitoring the stresses (or forces) on the atoms for a certain time, the material will change shape and structural properties can be derived. Similarly, also dynamical properties (such as diffusion coefficients) can be derived. Simulations like these are performed by a powerful methodology called Molecular Dynamics (MD). This way, also different temperatures and external pressures can be studied.
To find optimal candidate materials for thermoelectric applications, we would usually ap-ply large-scale calculations on a database of material structures and experimentally verify the ones with the most promising properties. This approach is called high-throughput (HT) screening.
CHAPTER 1. INTRODUCTION 3
1.2
From DFT to machine learning
The tremendous experimental and computational efforts have led us to what is called ‘the fourth paradigm of science’: data-driven discovery. Within this point of view, the variety of available data can be bundled to allow the extraction of knowledge. Driven by previous results from large-scale operations, we can derive new computational methods able to discover similar interesting cases and retrieve new insights without the use of our own physical intuition.
In recent years, big data applications arose in a wide variety of domains such as computer vision (CV) and natural language processing (NLP). Lately, applications for material science has seen an increase of interest as well. As a result, new analytical techniques are being improved at an ever-increasing pace. Originally, their purpose was to detect patterns from the typically high-dimensional data in order to build predictive models and optimize outcomes. All these methods are considered to be part of machine learning. Such algorithms construct a mathematical model based on training data to make similar predictions on unseen input. Different types of machine learning tasks exist but we will focus on supervised learning: modelling a relationship for which both examples of input and output are available. When the desired output (label) is continuous, a regression model is constructed. For discrete labels, a classification model is used.
With increasing data availability and computing power, the machine learning models are continuously growing in size. When at least thousands of data samples are available and the task of finding the optimal mapping between the inputs and the outputs is sufficiently complex, deep neural networks have become standard practice. Neural networks contain massively parallel computation graphs inspired by the information processing in the brain. The term ‘deep’ reflects the large number of layers used to progressively extract more informative features from the raw input. Tensors representing image pixels or material unit cell structures are only a couple of possibilities to be given as raw input. Deep learning eliminates the need for man-made feature extraction techniques that are common in more traditional machine learning approaches.
This approach has already been successful for material science applications in the past. At this time, Summit (the fastest supercomputer in the world) is even pushing the limits of MD from first principles by simulating over 100 million atoms for one nanosecond per day[11] with machine learning methods. Such successes are opening doors to model the quantum mechanical interactions in realistic materials with the same ab initio accuracy.
1.3
Goal of this work
In this thesis, we will construct machine learning models that are able to screen material databases for candidate materials in the area of thermoelectric applications. The physical relationship between material structures and their thermoelectric performance is rather complex. It requires a combination of calculations to determine the interplay of different
CHAPTER 1. INTRODUCTION 4
properties. Nevertheless, we implicitly assume there exists an unknown and complex mapping between these crystal structures and their thermoelectric performance. It are these relations that we will describe with deep learning architectures.
Many boxes should be checked at the same time for an optimal material. We will first devise models to asses the stability of the material. This problem has already been studied thoroughly. With similar techniques, we will then be able to discern metals from non-metals and finally asses the thermoelectric performance of the remaining can-didates. Along the way, different machine learning techniques will be tested for their use in materials science circumstances. By analysing their effect, new challenges and opportunities will arise for future work.
1.4
Structure of this work
• Chapter 2: gives an introduction on the relevant concepts to understand the physics of thermoelectric materials
• Chapter 3: covers the computational methods to derive thermoelectric properties from first principles at a large scale. Also the different material datasets used in the following chapters are discussed.
• Chapter 4: discussion of the previous work that has been done to provide ma-chine learning models for accelerated material screening. The SchNet network, our machine learning architecture of choice, is discussed in detail.
• Chapter 5: gives an overview of the methods we used for the tuning and training of machine learning models.
• Chapters 6, 7 and 8: discuss the models constructed to predict the stability, band gap and thermoelectric power factor of a material. Along the way, relevant techniques are studied to improve results.
• Chapter 9: application of the models on an in-house dataset that contains can-didate materials of interest.
• Chapter 10: gives a summary of the most important findings and provides pos-sible leads for future research
• Appendices A and B: contain the data analysis of the material databases we use throughout this thesis.
• Appendices C-F: Provide the results of our machine learning models and gives a data analysis to uncover trends in their performance regarding different materials properties
• Appendix G: Contains results from the application of our material screening to the unseen dataset of quaternary materials.
Chapter 2
The physics of thermoelectric
materials
In 1821, the German physicist Thomas Johann Seebeck made a closed loop of two different metals that were joined in two places[12]. Between the two junctions, he applied a temperature difference. In the different metals, the electron energies shifted differently and as a result a potential difference appeared between the junctions.
200 years later we call this the thermoelectric (or Seebeck) effect. The principle is ex-ploited to produce energy and aid in the transition to a low-carbon economy. According to an energy analysis by the Lawrence Livermore National Laboratory, more than 66% of the energy we generate, is lost because of energy dissipation in the form of heat.[2] The thermoelectric effect is one solution to recover some of the energy loss. A lot of materials research can still be done to increase the efficiency of generators. First, we will go into the basics of what to look for in a material.
2.1
The thermoelectric effect
Thermoelectric materials have the promising ability to generate an electrical current from a temperature gradient. That is possible since charge carriers at the atomic scale diffuse along a temperature gradient. Lattice phonons do the same, but in these materials their movement is hindered. This way, heat could be recovered as electrical energy in future applications. In situations where efficient energy harvesting is crucial, thermoelectric generators already play an important role. For example on the mars rover Curiosity, radioisotope thermoelectric generators are installed to convert the heat from decaying plutonium into electricity.[13, 14] Another reason for their popularity in space missions, is their reliability. As there are no moving parts in the generator, it does not easily break.
The thermoelectric effect is present in all materials, but in most it is too small to be useful. The maximum efficiency of a thermoelectric material can be defined by the
CHAPTER 2. THE PHYSICS OF THERMOELECTRIC MATERIALS 6
dimensionless figure of merit zT [15]:
zT = σS 2T
κ , (2.1)
with the electrical conductivity σ, the Seebeck coefficient S, the temperature T and the thermal conductivity κ. The performance depends both on the temperature and the doping level.
The Seebeck coefficient (units V/K) empirically accounts for the induced voltage by a temperature difference. Physically, the Seebeck coeffecient can be understood as the flow of entropy “dragged along” per unit of charge carried by electrical currents in the material[16]. The sign of the Seebeck coefficient depends on the sign of the charge carrier. The thermal conductivity consists of an electronic part κe and a phonon part κl that contains contributions from the lattice:
κ = κe+ κl (2.2)
This will turn out to be an important distinction, as the lattice contribution is a very hard property to predict with ab initio methods. The σS2 part in the numerator is often referred to as the power factor.
P F = σS2 (2.3)
All contributions in the figure of merit have their own purpose in the material design: • A large Seebeck coefficient allows the material to provide a large open-circuit
volt-age for a given temperature difference.
• A low thermal conductivity ensures the temperature difference to be maintained over a long period of time.
• A high electrical conductivity reduces Joule heating from the electric current to prevent energy losses and a drop in the temperature difference.
The three individual properties S, σ and κ are strongly correlated. Improving the elec-trical conductivity typically causes the thermal conductivity to increase as well. Such inevitable consequences often make it hard to improve the figure of merit. An example of the mutually opposing properties will be given by the Wiedemann-Franz law in Section 2.3.1. It confirms the intuition that a good conducting metal is also a great conductor of heat. The best performing materials found so far have a figure of merit zT of 2 and higher. This corresponds to a conversion from heat to electricity of 15-20%. If a figure of merit of zT =4 is achieved, thermoelectric generators are likely to become useful for global-scale production.
CHAPTER 2. THE PHYSICS OF THERMOELECTRIC MATERIALS 7
2.2
Thermoelectric materials
In this thesis I looked for an efficient way of screening materials for interesting ther-moelectric properties. For finding good candidate materials, we will not be guided by our own physical intuition. Machine learning algorithms will extract all the necessary physics automatically from the available datasets. Nevertheless it is interesting to note what we would typically look for in a material.
For thermoelectric applications, we look for materials with both a high power factor (P F = σS2) and a low thermal conductivity κ. To find solutions with such conflicting properties, various complex materials are under study. In the ideal case, we should opt for a so-called ‘phonon glass’ (bad thermal conductor) while maintaining the ‘electron crystal’ (good electrical conductor). There are three common ways of reducing the thermal lattice conductivity[17]:
1. Phonons can be scattered inside the unit cell by means of disordered structures. That can be achieved with e.g. point defects or alloying[18]
2. Some complex crystal structures can separate the ‘electron crystal’ from the ‘phonon glass’. E.g. in micro- or nanoporous materials[19] the phonons can be blocked without disturbing the crystallinity of the electron transport region.
3. Scattering phonons at interfaces is common in 2D materials or multiphase composites[20].
These strategies teach us where to look for potential candidate materials. In our case, they motivate our search for complex unit cell structures.
2.3
Thermoelectric properties of metals and
semiconduc-tors
In general, interesting thermoelectric materials turn out to be semiconductors for which the Fermi energy lies close to the edge of either the valence or the conduction band. Nowadays, the research is fully focussed on doped semiconductors. To understand the reasons for this, we will have to take into account the full figure of merit[21]. Only when all included properties are taken into account can we fully understand why certain materials are preferred over others.
2.3.1 The Wiedemann-Franz law
Gustav Wiedemann and Rudolph Franz[22] obtained an empirical law that relates the electrical conductivity and the total thermal conductivity for metals. It states that the thermal conductivity, divided by the electrical conductivity is proportional to the tem-perature with a proportionality constant l = κ/(σT ) that is independent of the specific metal[21]. l is called the Lorenz number. It later became known as the Wiedemann-Franz law and is visualized in Figure 2.1.
CHAPTER 2. THE PHYSICS OF THERMOELECTRIC MATERIALS 8
Figure 2.1: High-throughput screening results from Ricci et al.[23] used to fit the Wiedemann-Franz law for metals.
This is an example of the opposing properties of the thermoelectric figure of merit, since an increase of σ typically implies an increase of κ. Theoretically, this can be verified within the approximation of a metal by an electron gas. However, in general the thermal conductivity has contributions both from the the electrons (κe) and the lattice phonons (κl). For metals, the electronic thermal conductivity is usually much larger than the lattice contribution. In semiconductors, the opposite is true since the thermal conduc-tivity is dominated by phonons. As a result, the Wiedeman-Franz law does not apply to semiconductors since it would underestimate κ because of its phonon contribution. The relation for the electronic contribution in semiconductors is nevertheless very similar. From this analysis, metals seem to take the upper hand.
2.3.2 The Seebeck coefficient
To discuss the thermoelectric performance, the full figure of merit should be taken into account. So far, the Seebeck coefficient has not been considered. It has been empirically found that the Seebeck coefficient for semiconductors (non-zero band gap) is orders of magnitude larger than for metals (no band gap). The effect is shown in Figure 2.2. To have a better understanding of the reasons for this behaviour, consider a temperature difference is applied on both ends of a material with no voltage difference. According to Fermi-Dirac statistics, charge carriers at the hot side are distributed over a larger set of energies than at the cold side. As a result, more high-energy states are occupied at the hot sides and these charge carriers will diffuse towards the colder side. That produces entropy. However, since low-energy states are less occupied in the hot region, they are
CHAPTER 2. THE PHYSICS OF THERMOELECTRIC MATERIALS 9
drawn back in the other direction resulting in a competing process. A net current will only flow when hot carriers are more conductive than low carriers. In semiconductors, the conductivity is a result of both electron and hole contributions. As these represent the hot and cold carriers with a different sign in the Seebeck coefficient, their contributions oppose each other. In an intrinsic semiconductor, the concentrations of electrons and holes are by definition equal and therefore the Seebeck coefficient is always lower than the partial contributions of both carriers. When one type of carrier is injected through doping, the opposing contributions are reduced, making it the dominant charge carrier. Furthermore, doping increases the conductivity.
Figure 2.2: High-throughput results from Choudhary et al.[24] that show low Seebeck coeffi-cients for low band gap materials
For metals, the Fermi energy level lies inside the conduction band. As a result, the state density of occupied states of conductive electrons is not able to reduce the opposing currents as efficiently as a doped semiconductor because it does not have the same level of asymmetry. It causes a low net drag of entropy. Therefore, virtually all studies are performed on extrinsic semiconductors of the n- or p-type[25].
We have seen that the performance of the figure of merit zT depends both on the temperature and on doping. Typically, for every temperature range there is a different set of best-performing materials for which the doping is optimized. In the past, this demanded a lot of experimental work.
CHAPTER 2. THE PHYSICS OF THERMOELECTRIC MATERIALS 10
2.4
Material stability
When studying the stability of a material, energy plays an important role. Energy will decrease thanks to the formation of chemical bonds and the eventual crystal formation. Different crystal structures can exist, but only one structure will have the lowest energy for a given chemical formula thanks to the optimal bonding procedure. Materials that are energetically unfavourable compared to another crystal structure or different con-stituents, will eventually decompose. In this section, we briefly discuss some important measures of energy based stability.
Absolute energy
When solving the Schr¨odinger equation, we derive the absolute energy. That is the energy of the solid with respect to the independent particles (electrons and nuclei) at infinite distances. A negative energy implies that the system is stable with respect to these independent particles. Unfortunately, this is no guarantee for the material to be thermodynamically stable with respect to the other possible crystal structures. Also the separation in different materials with another stoichiometry could lower the energy.
Formation energy
The elemental formation energy is defined as the difference in energy between the mate-rial and that of the pure elemental phases of its components. If the formation energy is negative, the material will be thermodynamically stable with respect to those products. This is also not sufficient to determine whether a material is truly stable: for the same chemical composition, another crystal structure or combination of materials may be able to lower the energy.
Energy above the convex hull and material stability
For a material to be metastable, it should only contain normal modes with real frequen-cies and the formation energy should be negative. As this is equivalent to positioning the compound on a local minimum of the potential energy surface, it ensures dynamic stability. These are minimum requirements, but do not imply thermodynamic stability. A different crystal structure might still lower its energy. If we connect the most stable configurations, as a function of the concentrations of the present chemical elements, we obtain a so-called convex hull plot.
CHAPTER 2. THE PHYSICS OF THERMOELECTRIC MATERIALS 11
Figure 2.3: The convex hull diagram for Al + Fe alloys. Stable compounds are indicated with blue dots and black text labels. Image constructed with data from the Materials Project API.
To derive this, we would have to compare the formation energies from the material in all possible crystal structures. Ideal for a full description of stability is the energy distance of the compound to the convex hull. The energy above it is the energy of the system with respect to the thermodynamically most stable material of all decomposition channels. In other words, for a given chemical composition, we should refer our energy to the material with the most stable crystal structure. For stable compounds, the energy above the hull is zero as they are lying on the hull. The larger the energy above the hull, the less stable it will be as compared to the other crystal structures. An example is given in Figure 2.3. This diagram is constructed with formation energies given by the Materials Project. We can take the AlFe2 compounds with varying crystal structures as an example. They do not lie on the convex hull and hence are not stable materials. When we vertically project these on the hull, we do not find a stable material with the exact same fraction of Al. Instead, it will decompose in a combination of AlFe and AlFe3 which are the closest materials on the convex hull. The convex hull is in fact a phase diagram, as it is the 0 K component of the full Fe-Al phase diagram. An exact calculation with DFT is of course not tractable since our knowledge of the hull is incomplete without doing an infinite number of calculations. As more and more stable materials get discovered, this becomes less of a problem. This is our most interesting energy property, but still we should be aware that most first-principle energy calculations are done at zero temperature and zero pressure. This way, we neglect kinetic effects on the stability. Also the entropy contribution given at finite temperature could stabilize the compound. A minor thermodynamic instability at 0 K does not necessarily imply the material can not exist. Diamond is such a metastable material which is of great practical purpose in applications. To bypass the problem, either experimental data could be used, or we could define a minimal threshold on the convex hull energy.
![Figure 2.1: High-throughput screening results from Ricci et al.[23] used to fit the Wiedemann- Wiedemann-Franz law for metals.](https://thumb-eu.123doks.com/thumbv2/5doknet/3281838.21658/25.892.250.645.154.500/figure-throughput-screening-results-ricci-wiedemann-wiedemann-franz.webp)
![Figure 2.4: Band structures of (a) Si and (b) Ge, calculated within a tight-binding approximation.[26]](https://thumb-eu.123doks.com/thumbv2/5doknet/3281838.21658/29.892.227.658.308.527/figure-band-structures-si-calculated-tight-binding-approximation.webp)
![Figure 3.1: The relation between the Seebeck coefficient and the electron conductivity (divided by the relaxation time τ ), as found by Ricci et al.[23] The power factor is shown in color and the band gap is shown using the circle size](https://thumb-eu.123doks.com/thumbv2/5doknet/3281838.21658/35.892.269.617.469.774/figure-relation-seebeck-coefficient-electron-conductivity-divided-relaxation.webp)
![Figure 4.1: Validation results on classification from the paper by Gaultois[62] for the four properties they investigated](https://thumb-eu.123doks.com/thumbv2/5doknet/3281838.21658/39.892.220.672.331.629/figure-validation-results-classification-paper-gaultois-properties-investigated.webp)
![Figure 4.2: The ROC curve that depicts the results from Choudhary et al.[24] for the n-doped power factor predictions](https://thumb-eu.123doks.com/thumbv2/5doknet/3281838.21658/40.892.241.643.349.609/figure-curve-depicts-results-choudhary-doped-factor-predictions.webp)
![Figure 4.9: The results from the experiment by Yosinki et al.[84]. The x-axis denotes the different numbers of transferred layers](https://thumb-eu.123doks.com/thumbv2/5doknet/3281838.21658/53.892.185.722.653.938/figure-results-experiment-yosinki-denotes-different-numbers-transferred.webp)
![Figure 4.10: Slanted triangular learning rate as a function of the number of training iterations[89].](https://thumb-eu.123doks.com/thumbv2/5doknet/3281838.21658/56.892.271.630.157.416/figure-slanted-triangular-learning-function-number-training-iterations.webp)