ROUTES FOR A-SLUDGE
Bob Fosco
Promotors: Prof. Dr. Ramon Ganigué and Dr. Ir. Jo De Vrieze Tutor: Ir. Kevin Van de Merlen
Master Thesis submitted in fulfilment of the requirements for the degree of Master of Science in Bioscience Engineering: Environmental Technology.
Deze pagina is niet beschikbaar omdat ze persoonsgegevens bevat.
Universiteitsbibliotheek Gent, 2021.
This page is not available because it contains personal information.
Ghent University, Library, 2021.
This preamble was drawn up after consultation between the student and the supervisor and is approved by both.
Due to COVID-19, following experiments couldn’t be performed/completed: • An anaerobic digestion test with A-sludge provided by PureBlue
• Ultrasonic pre-treatment of the A-sludge provided by PureBlue and subsequent anaerobic digestion test
The first experiment is replaced with values from literature. The second experiment isn’t replaced.
Het was intens. Dag in en dag uit werken, denken, redeneren zonder enige vorm van sociaal contact ten gevolge van COVID-19. Desondanks en bovenal was het een fantastische kans om mij een volledig jaar te verdiepen in twee onderwerpen die met zekerheid gaan terug keren in mijn toekomstige loopbaan: waterzuivering en district heating.
Deze thesis zou hoe dan ook niet mogelijk geweest zijn zonder de hulp van de volgende mensen die ik dan ook zeer graag bedank:
Eerst en vooral wil ik mijn promotor Jo De Vrieze bedanken. U haalde door uw aanpak het beste in mij naar boven. Ik kreeg de vrijheid om creatief aan de slag te gaan en mijn eigen weg te banen. U stond steeds klaar met ideeën en feedback. Geen meeting of vraag was u ooit te veel en daarboven was u een rustpunt tijdens het maken van deze thesis die door COVID-19 niet altijd even gemakkelijk was. U draagt studenten zeer hoog in het vaandel, wat zeker en vast een positief effect heeft gehad op de ontwikkeling van deze thesis. Ik wens u zeer veel succes in uw toekomstige carrière als professor aan de KU Leuven!
I also want to thank my promotor Ramon Ganigué for the opportunity to work on this topic. Your input during the feedback moments and on the preliminary versions was really valuable and has certainly increased the quality of my thesis. Furthermore, I also have to thank Kevin Van de Merlen, for providing me with A-sludge and for the interesting discussions. Additionally, it was certainly an added value for my thesis to have a tutor from the industry. I also have to thank to professor Svend Svendsen and postdoctoral researcher Michele Tunzi from the Danish technical university for the way they gave the course: Sustainable District Heating. This was by far the most interesting course I ever followed. It gave me a new interest on which I was fortunate to work on in this thesis. Additionally, I want to thank Michele Tunzi for his help with the district heating calculations.
Als laatste wil ik mijn gezin, oma en vriendin bedanken. Oma bedankt voor ons wekelijkse etentje. Dit is een moment waar ik steeds erg van geniet. Bovendien wil ik jou ook bedanken voor het heerlijke eten en de goede zorgen die de blokperiodes veel aangenamer maakten. Mama, papa en broer bedankt om mij volop te steunen tijdens mijn studies en steeds de ideale studieomgeving en warme thuissfeer te scheppen. Bovendien gaven jullie mij de kans om op kot te gaan en een fantastische vriendengroep te maken, dankuwel! Linde, het maakt mij enorm gelukkig dat we allebei onze studies met veel toewijding en succes hebben kunnen volgen. Samen zijn met iemand met zoveel passie en talent voor haar vak zijnde architectuur is een privilege, bovendien bedankt om deze thesis esthetisch te verfijnen!
The goal of the EU is to transform into a zero-carbon economy by 2050 and, therefore, to reduce greenhouse gas (GHG) emissions by 80-90% and having a minimum of two-thirds of the energy originating from renewable resources. In the European Union (EU), the building sector has with a share of 38.1%, the largest contribution in the total energy consumption. Big efforts are needed in this sector and, currently, policy-making is mainly focusing on energy savings on a building level. On the other hand, district heating is identified by multiple studies as the most effective technology for many cities to be climate-resilient by improving energy efficiency and using higher shares of renewable energy sources. However, it is still an unused technology in Belgium.
There is a discrepancy between the current treatment and management of wastewater and treatment and management of wastewater supporting sustainable development. In this transition, AB-systems can have a pivotal role and, consequently, more and more research and applications are focusing on it. In this thesis, a possible valorisation route for decentralised produced A-sludge was investigated. The objective of this thesis was to investigate the potential of biogas produced from co-digestion of decentralised produced A-sludge and kitchen waste as a heat source in a low-temperature district heating network. The potential is investigated as the total fraction of the heat energy consumption it can cover but also as the additional operational value biogas can give in a low-temperature district heating network.
A low-temperature district heating network was designed for districts with the same characteristics as the district Brugse Poort-Rooiegem located in Ghent, on a scale of 500, 1000 and 5000 inhabitants. In each district, the A-sludge is produced in the corresponding decentralised AB system and kitchen waste is collected via a vacuum grinder system installed in the sinks of the inhabitants. The potential production of heat in a heating boiler of the biogas produced during co-digestion of both A-sludge and kitchen waste (KW) was calculated. Additionally, mesophilic and thermophilic digestion operation were compared and the effect of scale and COD captured in the A-stage of the AB-system was investigated. It was found that biogas produced from co-digestion of decentralised produced A-sludge and KW could, when converted to heat in a heating boiler, provide between 0.8-1.8%, 0.9-1.9% and 1.0-2.0% of the total heat energy needed in the LTDH network of the district with 500, 1000 and 5000 inhabitants, respectively. These fractions are not high enough to provide a substantial part of the base load or intermediate load needed in a district heating network.
However, biogas heating boilers have the required characteristics to provide peak load, which is identified as the bottleneck of district heating networks. Peak load is difficult to provide by renewable energy sources, due to the required flexibility in the operation of peak load supply plants. Consequently, in practice peak load is still provided by heating boilers that use oil, gas, coal or electricity. From the peak load co-digestion of A-sludge and KW could cover between 13.3-60%, 15.0-63.3% and 16.67-66.7% of the annual peak load in the district with 500, 1000 and 5000 inhabitants, respectively. Therefore it could be concluded that anaerobic co-digestion can provide operational flexibility in a LTDH network and can have a pivotal role to exclude the use of fossil fuels in LTDH networks.
Het doel van de Europese Unie (EU) is om in 2050 te transformeren naar een koolstofloze economie en hierdoor de emissies van broeikasgassen te verlagen met 80-90% en om twee-derde van de energie uit hernieuwbare energiebronnen te halen. De gebouwen sector is in de EU met een aandeel van 38.1% de grootste bijdrager in de totale energie consumptie. Stevige inspanningen zijn dan ook nodig in deze sector waar op dit moment door de beleidsmakers voornamelijk gefocust wordt op energiebesparingen op het niveau van gebouwen. Warmtenetten, aan de andere kant, zijn door meerdere studies reeds aangeduid als de meest effectieve technologie om vele steden klimatologisch veerkrachtig te maken, dit door de energie efficiëntie te verhogen en door de integratie van een hoger aandeel hernieuwbare energie bronnen. Desondanks zijn warmtenetten nog steeds een onbenutte technologie in België.
Er is discrepantie tussen de huidige behandeling en management van afvalwater en een behandeling en management dat duurzame ontwikkeling ondersteunt. In deze overgang kunnen AB systemen mogelijks een cruciale rol spelen en bijgevolg zijn er meer en meer studies en applicaties die zich op dit onderwerp focussen. In deze thesis zal een mogelijke valorisatie route van A-slib worden onderzocht. Het doel van deze thesis is om te onderzoeken wat het potentieel is van biogas geproduceerd door de co-vergisting van decentraal geproduceerd A-slib en keukenafval als warmtebron in een laag-temperatuur warmtenet. Het potentieel wordt onderzocht als de fractie van de totale warmte consumptie in het laag-temperatuur warmtenet die het kan voorzien, maar eveneens als de toegevoegde operationele waarde voor het laag-temperatuur warmtenet.
Een laag-temperatuur warmtenet werd ontworpen voor wijken met dezelfde karakteristieken als de Brugse Poort-Rooigem op een schaal van 500, 1000 en 5000 inwoners. In elke wijk wordt het A-slib in het corresponderende AB-systeem geproduceerd en het keukenafval verzameld door middel van een vacuüm grinder systeem. De potentiele productie van warmte in een boiler van het biogas geproduceerd door de de co-vergisting van A-slib en keukenafval is dan berekend. Bijkomstig is ook thermofiele en mesofiele vergisting operatie met elkaar vergeleken en is het effect van schaalgrootte en van de COD gecapteerd in de A-stap onderzocht.
Er werd gevonden dat het biogas geproduceerd uit de co-vergisting van decentraal geproduceerd A-slib en keukenafval slechts tussen 0.8-1.8%, 0.9-1.9% en 1.0-2.0% van de totale warmte energie consumptie in het warmetnet kan voorzien in een wijk met 500, 1000 en 5000 inwoners. Deze fracties zijn te klein om een substantieel deel van de base load of intermediate load te voorzien in de operatie van een laag-temperatuur warmtenet.
Echter hebben biogas boilers wel de noodzakelijke eigenschappen om de peak load te voorzien in een warmtenet wat net het knelpunt is van laag-temperatuur warmtenetten doordat ze voorlopig door de vereiste eigenschappen van piek leveringsinstallaties moeilijk kunnen voorzien worden door hernieuwbare energie bronnen. Van deze piek lading kan co-vergisting van A-slib en keukenafval respectievelijk tussen de 13.3-60%, 15.0-63.0% en 16.67-66% van de jaarlijkse piek lading voorzien in de wijken met 500, 1000 en 5000 inwoners. Daardoor kan er geconcludeerd worden dat anaerobe co-vergisting operationele flexibiliteit kan geven aan een laag-temperatuur warmtenet een cruciale rol kan spelen om fossiele brandstoffen uit de operatie van laag-temperatuur warmtenetten te verwijderen.
ΔPhod Holding pressure
ΔPm Maximum pressure drop that pipes can withstand
ΔPr Return pipe pressure drop
ΔPsbstton Substation pressure drop
ΔPs Supply pipe pressure drop
ΔT Temperature drop ˙
m Mass flow rate
˙
V Volumetric flow rate η Pump efficiency λ Friction factor ν Kinematic viscosity ϵ Pipe effective roughness
cp,K W Kitchen waste specific heat capacity
cp,sdge Sludge specific heat capacity
mb−p By-pass flow
Mn,sdge Incoming sludge mass flow
MK W Incoming KW mass flow
Pdesgn Design heat load
Qby-pass Annual heat consumption by-pass flow
QDHW,peak load domestic hot water peak load
QDHW Annual domestic hot water heat consumption
Qheat loss Annual heat loss in district heating pipes
QSH, peak load Space heating peak load
q,sm Summer period steady-state heat loss in pipe segment i
q,n Winter period steady-state heat loss in pipe segment i
Qn,hetng Total heat required to heat inflow to the required temperature
Qoss,en Total heat losses from digester to environment
Tr Return temperature
Ts Supply temperature
Tmb Ambient temperature
Tdgester Temperature digester
Tn,K W Temperature incoming KW
Tn,sdge Temperature incoming A-sludge
Tso Temperature soil
4GDH 4thgeneration district heating.
AD anaerobic digestion.
BOD biological oxygen demand. CAPEX capital expenditure.
CAS conventional activated sludge. CHP combined heat and power. COD chemical oxygen demand. DHW domestic hot water. DO dissolved oxygen.
EBPR enhanced biological phosphorus removal. EU European Union.
GHG greenhouse gas.
HiCAS high-rate conventional activated sludge. HiCS high-rate contact stabilization.
HRAS high-rate activated sludge. HRT hydraulic retention time.
IHEU instantaneous heat exchanger unit. KW kitchen waste.
LTDH low-temperature district heating. OPEX operating expenditure.
PAHs polycyclic aromatic hydrocarbons. PAO phosphorus accumulating organisms. PCM pyrogenic carbonaceous material. PHB polyhydroxybutyrate.
SH space heating.
SRT sludge retention time. VFA volatile fatty acids.
Preamble i
Dankwoord iii
Summary v
Nederlandse Samenvatting vii
Contents xvii
1 Literature Study 1
1.1 Wastewater: from waste to resource . . . 1
1.2 Wastewater treatment systems . . . 3
1.2.1 The conventional activated sludge wastewater treatment . . . 3
1.2.1.1 General description . . . 3
1.2.1.2 Additions secondary treatment process . . . 4
1.2.2 AB systems . . . 6
1.2.2.1 General description . . . 6
1.2.2.2 AB systems in reality . . . 7
1.2.2.3 CAS systems versus AB systems . . . 8
1.3 Sludge valorisation . . . 10
1.3.1 Anaerobic digestion of sludge . . . 10
1.3.1.1 General description . . . 10
1.3.1.2 Biogas potential . . . 11
1.3.1.3 Important parameters . . . 11
1.3.1.4 Advantages and disadvantages . . . 14
1.3.2 Volatile fatty acids (VFA) production . . . 14
1.3.2.1 Carboxylate platform . . . 14
1.3.2.2 VFA fermentation from A-sludge . . . 15
1.3.2.3 Challenges . . . 15
1.3.3 Dewatering and drying . . . 16
1.3.4.1 General description . . . 17
1.3.4.2 Sludge incineration . . . 17
1.3.4.3 Advantages and disadvantages . . . 18
1.3.5 Pyrolysis . . . 18
1.3.5.1 General description . . . 18
1.3.5.2 Char . . . 19
1.3.5.3 Bio-oil and gas . . . 20
1.3.5.4 Potential A-sludge . . . 20
1.3.5.5 Advantages and disadvantages . . . 21
1.3.6 Gasification . . . 21
1.3.6.1 General description . . . 21
1.3.6.2 Products and results for sludge gasification . . . 22
1.3.6.3 Advantages and disadvantages . . . 22
1.4 Nutrient recovery . . . 23
2 Objectives 25 3 Material and Methods 27 3.1 Low-temperature district heating network . . . 27
3.1.1 District design . . . 27
3.1.2 Low-temperature district heating network design . . . 28
3.1.2.1 General . . . 28
3.1.2.2 District heating pipes . . . 28
3.1.2.3 Substation . . . 31
3.1.3 Hydraulic design . . . 32
3.1.3.1 Design heat load . . . 32
3.1.3.2 Design pressure drop . . . 34
3.1.3.3 Design pipe diameter . . . 35
3.1.3.4 Choosing commercial pipe diameter . . . 36
3.1.4 Energy analysis . . . 37
3.1.4.1 Winter versus summer period . . . 37
3.1.4.2 Total energy consumption . . . 38
3.2 Anaerobic digestion . . . 41
3.2.1.2 Kitchen waste . . . 41
3.2.2 Dimensions anaerobic digester . . . 42
3.2.3 Heat requirements . . . 43
3.2.3.1 Heat loss from digester to environment . . . 43
3.2.3.2 Heating requirement incoming flow . . . 44
3.2.3.3 Heat recovery through heat exchanger . . . 45
3.2.4 Biogas production and potential . . . 45
3.2.5 Comparison . . . 46
4 Results 47 4.1 Low-temperature district heating network . . . 47
4.1.1 District design . . . 47
4.1.2 Low-temperature district heating network design and hydraulic design . . . 49
4.1.2.1 Connection pipes . . . 50 4.1.2.2 Service pipes . . . 50 4.1.2.3 Street pipes . . . 50 4.1.2.4 Branch pipe . . . 51 4.1.2.5 Distribution pipe . . . 51 4.1.2.6 Pressure drop . . . 51 4.1.3 Energy analysis . . . 53
4.1.3.1 District with 500 inhabitants . . . 55
4.1.3.2 District with 1000 inhabitants . . . 55
4.1.3.3 District with 5000 inhabitants . . . 56
4.2 Anaerobic digestion . . . 56
4.2.1 Anaerobic digestion inflow characteristics . . . 56
4.2.2 Heat requirements . . . 57
4.2.2.1 District with 500 inhabitants . . . 58
4.2.2.2 District with 1000 inhabitants . . . 58
4.2.2.3 District with 5000 inhabitants . . . 59
4.2.3 Biogas production and potential . . . 59
4.2.3.1 District with 500 inhabitants . . . 60
4.2.3.2 District with 1000 inhabitants . . . 60
4.2.3.3 District with 5000 inhabitants . . . 61
5 Discussion 65
5.1 District heating . . . 65
5.1.1 Why district heating? . . . 65
5.1.1.1 Energy-efficient and economies of scale . . . 65
5.1.1.2 Economically . . . 66
5.1.1.3 Challenges . . . 67
5.1.2 Potential of the district Brugse Poort-Rooiegem to implement low-temperature district heating . . . 67
5.1.2.1 Linear heat density . . . 67
5.1.2.2 Heat losses . . . 68
5.1.2.3 Scale and diversity . . . 70
5.1.2.4 Are the current energy goals sufficient? . . . 70
5.1.2.5 General findings . . . 71
5.2 Anaerobic digestion . . . 71
5.2.1 Heat losses . . . 71
5.2.2 Heat exchanger recovery . . . 73
5.3 Comparison . . . 74
5.3.1 Thermophilic versus mesophilic digestion . . . 74
5.3.1.1 41% of the COD is captured in the A-stage . . . 74
5.3.1.2 65% of the COD is captured in the A-stage . . . 75
5.3.1.3 General findings . . . 75
5.3.2 Integrating biogas in a district heating . . . 76
6 Future Research 79 7 Conclusion 81 8 Appendix 83 8.1 Low-temperature district heating network . . . 83
8.1.1 District design . . . 83 8.1.2 Hydraulic design . . . 89 8.1.2.1 Connection pipes . . . 89 8.1.2.2 Service pipe . . . 90 8.1.2.3 Street pipes . . . 91 8.1.2.4 Branch pipes . . . 102
8.1.3 Energy analysis . . . 107
8.1.3.1 Heat loss coefficients . . . 107
8.1.3.2 Connection pipes . . . 108 8.1.3.3 Service pipes . . . 109 8.1.3.4 Street pipes . . . 110 8.1.3.5 Branch pipes . . . 113 8.1.3.6 Distribution pipes . . . 114 8.2 Anaerobic digestion . . . 114 8.2.1 Heat losses . . . 114 Bibliografie 118
Literature Study
1.1
Wastewater: from waste to resource
In 2050, a population increase to 9.7 billion people is expected. Coupled with global warming, prospects are that, by 2050, 52% of the global population will live in water-stressed areas (Schlosser et al., 2014; Alcamo et al., 2007). At the same time, FAO et al. (2011) expect an increase in demand of 50%, 82% and 102% for protein, dairy and meat products, respectively. To achieve this, artificial soil fertilisers will play an even more pivotal role in the future (Manning, 2015). The most crucial nutrients in these artificial fertilisers are nitrogen, which is mainly derived from fossil fuel, and phosphate a non-renewable resource derived from phosphate rock mining. Contrarily, predictions are that phosphate could be depleted within 50 to 100 years, and will undoubtedly undergo a drastic price increase (Cordell et al., 2009; Galloway et al., 2017). For both phosphate as nitrogen the safe operating space for humanity, i.e., within the planetary boundaries is already exceeded to a great extent (Steffen et al., 2015; Verstraete et al., 2016).
The Brundtland commission defined sustainable development (Brundtland et al., 1987) as "Sustainable development is development that meets the needs of the present without compromising the ability of future generations to meet their own needs."
According to this definition, it is clear that there is a discrepancy between the current treatment and management of wastewater and treatment and management of wastewater supporting sustainable development. Three necessary shifts/measures are outlined in the development to sustainable wastewater treatment and management. Nevertheless, this list is without doubt, not exhaustive.
• Energy consumer to energy source: Domestic wastewater has, on average, a
potential energy content of 8100 kJ/m3. Contrarily, the energy consumption of conventional activated sludge (CAS) wastewater treatment plants is on average, 1620 kJ per m3. Despite this five times higher energy potential, a CAS wastewater treatment plant (WWTP) is only able to recover at maximum 50% of its energy consumption with current operation and control (Wan et al., 2016; McCarty et al., 2011). If wastewater treatment wants to achieve energy self-sufficiency or even become an energy source, shifts to treatment systems capable of minimising organic carbon oxidation losses are presumably inevitable. These systems maximise the energy recovery potential through redirection of the organic carbon to sludge. Examples are AB-systems and high-rate contact stabilization (HiCS) systems (Jimenez et al., 2015). Additionally, development and optimisation of sludge energy recovery technologies and implementation of new sludge valorisation routes are necessary.
1.1. WASTEWATER: FROM WASTE TO RESOURCE
• Focus from removal to recovery: In Flanders, each year, a total load of about 23.98
kton nitrogen and 3.53 kton phosphorus is sent to wastewater treatment plants (Coppens et al., 2013). Taken into account the mentioned current and future stress on nutrient availability, a shift from a WWTP capable of removing nutrients to a WWTP focusing on nutrient recovery is a necessity. In Figure 1.1, the average yearly sludge fluxes and the corresponding nitrogen and phosphorus fluxes in Flanders are illustrated. The indicated percentages (on the arrows) are based on sludge dry weight. In Flanders, septic sludge is also anaerobically digested and is therefore included in these fluxes. From this figure, it is clear that in Flanders still a significant part of the sludge is landfilled or incinerated without prior anaerobic digestion.
Figure 1.1: The average yearly sludge fluxes and the corresponding nitrogen and phosphorus fluxes in Flanders are illustrated on the figure. The indicated percentages (on the arrows) are based on sludge dry weight. In Flanders, septic sludge is also anaerobically digested and is therefore included in these fluxes, values adapted from Coppens et al. (2016, 2013)
• Reevaluating and rethinking central wastewater treatment and management:
Central wastewater treatment and management is the norm in developed countries. Although, in the context of sustainable development and to provide everyone with access to clean water, a reevaluation and comparison against decentral wastewater treatment and management is necessary. In a centralised WWTP, water is usually transported over long distances and, therefore, associated with large infrastructure investments. Generally, centralised treatment and management are associated with high operation and investment costs, and have shown to be less cost-effective and difficult to implement in developing countries and low density areas (Massoud et al., 2009; Libralato et al., 2012). Decentralised wastewater treatment is more flexible in operation, in contrast to centralized wastewater treatment systems that have shown to struggle with rapid expansion of cities (Nanninga et al., 2012).
1.2
Wastewater treatment systems
1.2.1
The conventional activated sludge wastewater treatment
1.2.1.1 General description
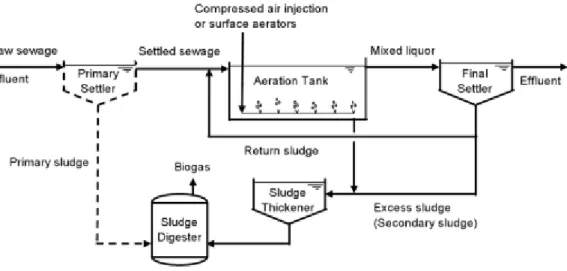
The activated sludge process, developed in 1914 by Lockett and Ardern, is still by far the most commonly used process for treating domestic and industrial wastewater (Hreiz et al., 2015). The basic activated process (Figure 1.2) consists of three components: (1) an aerated reactor, (2) a liquid-solid separator, and (3) a sludge recycle system to make decoupling of hydraulic retention time (HRT) and sludge retention time (SRT) possible (Tchobanoglous et al., 2003; Van Haandel and Van Der Lubbe, 2007). In the aerated reactor, microorganisms oxidise the biological oxygen demand (BOD) into carbon dioxide and water, and assimilate a fraction of the organics, due to coupled microbial growth. (Modin et al., 2016). Roughly, bacteria remove 50% of the chemical oxygen demand (COD) through assimilation and 50% through conversion to CO2(Verstraete and Vlaeminck, 2011).
Figure 1.2: Representation of the conventional activated sludge process in a basic wastewater treatment plant configuration, adapted from Van Haandel and Van Der Lubbe (2007)
Additional to the activated sludge process, which is a secondary treatment process, a preliminary, primary or tertiary treatment process is regularly included in a WWTP configuration.
The goal of preliminary treatment is to remove rags, floatables, grit and grease that can cause operational or maintenance problems. A primary treatment (Figure 1.2), on the other hand, is mostly a gravitational settler, aiming to remove already a part of the suspended solids and organic matter. However, primary treatment is often not present in current systems, because it removes a part of the COD that could be needed for denitrification (Tchobanoglous et al., 2003; Gupta et al., 2012). A final cleaning process, i.e., tertiary treatment, can be added to achieve the required organic, suspended solids, nutrient and disinfection levels in the effluent (Sonune and Ghate, 2004). Examples of tertiary treatments processes are sand filters, activated carbon adsorption and ozonation.
1.2. WASTEWATER TREATMENT SYSTEMS
The current operation of a CAS WWTP (with the additions described in the following section) consumes, on average, 0.45 kWh per m3 treated wastewater (Wan et al., 2016). A significant contributor is the energy-intensive aeration consuming between 45% and 75% of the total plant energy expenditure (Rosso et al., 2008; Zessner et al., 2010). A study in 2010 found that the total annual cost for a CAS WWTP, for 9 European countries along the river Danube, vary between 30e and 40 e per population equivalent (p.e.) for small plants (10,000-50,000 p.e.) and 17e to 30 e per p.e. for large plants (100,000 p.e.) (Zessner et al., 2010).
1.2.1.2 Additions secondary treatment process
The secondary treatment configuration in Figure 1.2 is not a representation of the current CAS WWTP operation. Due to more stringent effluent requirements, mainly for nitrogen and phosphorus, new configurations and treatments were developed. These additions can be categorised according to their focus on nitrogen or phosphorus removal.
Nitrogen
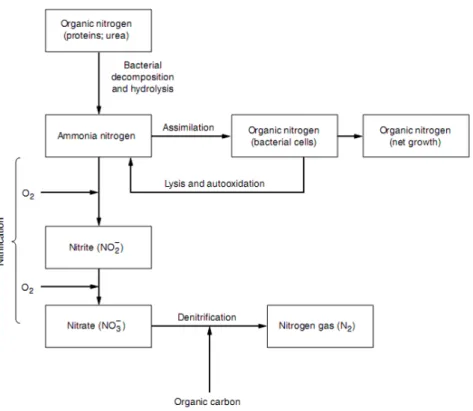
Figure 1.3 shows that biological removal of nitrogen is possible through conversion to N2 or through assimilation of nitrogen in the sludge biomass (Sedlak, 2018). In Flanders, municipal WWTPs receive a total nitrogen load of 4 kg nitrogen per capita per year from which, on average, 79% is removed by the WWTPs. Thereof, on average, 80% is converted to N2 and 20% is assimilated in the activated sludge (Coppens et al., 2016).
Figure 1.3: Nitrogen conversions and biological reactions during the wastewater treatment process, adapted from Sedlak (2018)
Different configurations exist to control nitrogen removal. The most commonly used configurations, combine nitrification and denitrification, which require different conditions, with as most crucial difference aerobic conditions for nitrification and anoxic conditions for denitrification.
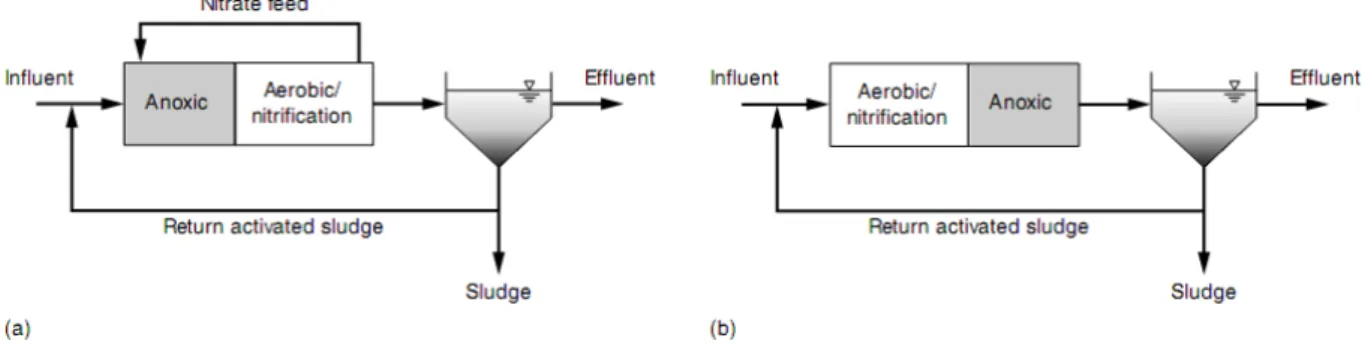
Therefore, the reactions are separated in time or space (within a floc, different zones/tanks) (Vandekerckhove, 2018). Two possible configurations exist (Figure 1.4). The first configuration ((b) on Figure 1.4) is a post-anoxic denitrification system where the aerobic tank/zone for nitrification is placed before the anoxic denitrification tank/zone. Second ((a) on Figure 1.4), a pre-anoxic denitrification system can be used, where the order is reversed, and a recycling loop is implemented to recycle the nitrate produced in the aerobic tank/zone to the anoxic tank (Tchobanoglous et al., 2003).
Figure 1.4: Representation of (a) a pre-anoxic denitrification configuration and (b) a post-anoxic denitrification configuration, adapted from Van Haandel and Van Der Lubbe (2007)
Nevertheless, if WWTPs want a lower operation cost and energy consumption, nitrogen removal configurations requiring less energy and COD are needed.
An alternative is short-cut nitrification/denitrification, where partial nitrification to nitrite is followed by denitrification of nitrite to N2. This process profits from the fact that there is less aeration needed to obtain nitrite (compared to nitrate) and the lower organic carbon use during denitrification. This is due to the fact that nitrite is already an intermediary product in the denitrification reaction of nitrate and, consequently, fewer reaction steps are needed. This process showed 25% less oxygen consumption, 40% less COD consumption and 33-35% and 55% lower sludge production during nitrification and denitrification, respectively (Peng and Zhu, 2006; Fux and Siegrist, 2004; Du et al., 2019). Another emerging nitrogen removal process is combining short-cut nitrification with anammox bacteria. Anammox bacteria are slow-growing bacteria using CO2 as a carbon source. Consequently, there is no need for organic carbon in this process. Anammox bacteria form N2 by simultaneously oxidising ammonium and reducing nitrite (Kartal et al., 2010, 2011). Therefore, less aeration is needed, because ammonium is oxidised to nitrite (instead of nitrate), and because of the anammox reaction, only half of the ammonium needs to be oxidised. The process showed 65% less oxygen consumption, 100% less organic carbon consumption and 90% less sludge production (Vlaeminck et al., 2012).
Phosphorus
In Flanders, municipal WWTPs receive a total phosphorus load of 0.58 kg phosphorus per capita per year from which, on average, 85% is removed in the WWTPs. Thereof, on average, and depending on the system, 65% is removed through assimilation in the activated sludge, 26% via chemical precipitation and 8% via enhanced biological phosphorus removal (Coppens et al., 2016). During chemical precipitation, a divalent or trivalent metal salt is added that forms an insoluble metal salt with soluble phosphate. This precipitate settles and is removed as sludge. The most suitable metal salts are iron and aluminium chlorides or sulphates.
1.2. WASTEWATER TREATMENT SYSTEMS
Chemical precipitation is flexible and can be applied during primary, secondary and even tertiary treatment (Parsons and Smith, 2008; Morse et al., 1998). Biological phosphorus removal is possible through stoichiometric coupling to microbial growth or enhanced biological phosphorus removal (EBPR) (Mino et al., 1998). The EBPR is possible through phosphorus accumulating organisms (PAO). The PAO can take up more phosphorus than required for their cellular growth and store phosphorus as polyphosphate (Urdalen, 2013). To obtain EBPR, PAO need a competitive advantage over other bacteria (Tchobanoglous et al., 2003). This is achieved, by implementing a configuration were the influent first flows through an anaerobic zone. In the anaerobic zone, PAO use energy from the stored polyphosphates (and as a consequence orthophosphate is released) to produce intracellular polyhydroxybutyrate (PHB) through assimilation of mainly acetate and VFA. In the subsequent aerobic zone, PAO use energy by oxidation of the stored PHB. This energy is used for cell growth and polyphoshate production and, as a consequence, orthophosphate is removed from the wastewater. In this configuration, intern recycling is necessary to circulate PAO and provide acetate and VFA in the anaerobic tank. In the end, phosphate is removed from the system by removing a fraction of the PAO after the aerobic tank (Goel and Mohaghegh Motlagh, 2013; Parsons and Smith, 2008).
1.2.2
AB systems
1.2.2.1 General description
The CAS process is a mature technology that has been established as a reliable technology in meeting effluent requirements and protecting human health. Nevertheless, CAS systems are significant energy consumers, and have a low potential to be even close to energy self-sufficiency in the future. A reason for this is that pollutants are primarily removed through bio-oxidation with an excessive amount of air (Guven et al., 2019). Aeration is energy-intensive and, additionally, oxidation of organics to CO2and water is a loss of potential energy present in wastewater (Modin et al., 2016; Jimenez et al., 2015). If wastewater treatment wants to achieve energy self-sufficiency, it is necessary to redirect organic carbon and lower the energy consumption (Batstone et al., 2015; Jimenez et al., 2015).
In the search for alternative treatment methods, the AB process or Adsorption-Bio-oxidation process that was already developed in the early seventies by Prof. Dr. Ing. Botho Boehnke, is getting much attention.
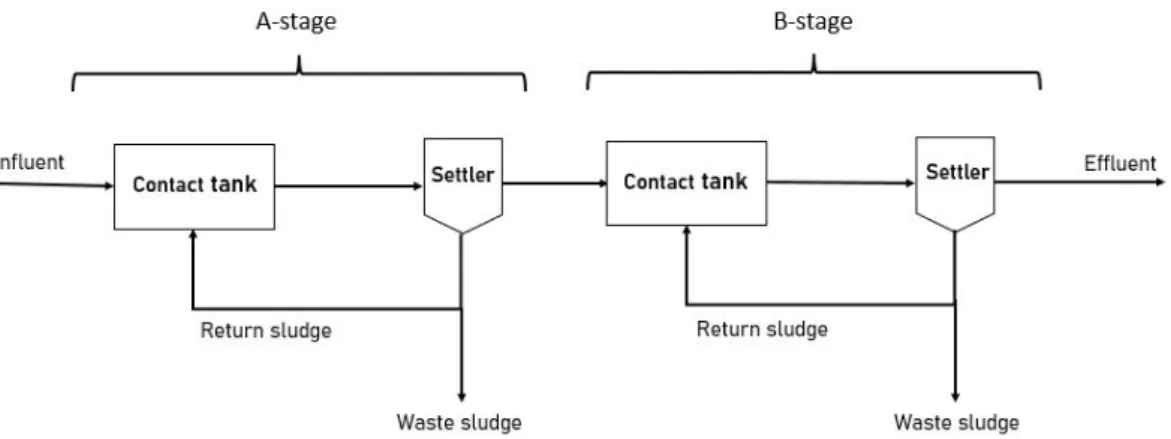
The AB process consists of two stages, a high-rate activated sludge (HRAS) process (Adsorption or A-stage) and a conventional low-rate system (Bio-oxidation or B-stage). The A-stage has a high food-to-microorganism (F/M) ratio ranging between 2-10 g BOD g VSS−1 day−1, a HRT in the order of 30 min or less and a SRT shorter than one day. The effluent of the A-stage is the influent of the B-stage. The B-stage has operating conditions similar to a CAS system. In the B-stage, a high SRT and sludge loadings of 0.1 g BOD g VSS−1 day−1or less are applied. The B-stage is responsible for obtaining the required effluent standards. It does the final carbon polishing, nitrification and often the denitrification step and phosphorus removal (Versprille et al., 1985; Boehnke and Diering, 1997; Boehnke et al., 1997).
The A-stage configuration is similar to a basic CAS system configuration. It consists of a contact tank where the return sludge is mixed with the influent, a liquid-solid separator and a sludge recycling stream. Therefore, the A-stage is often named high-rate conventional activated sludge (HiCAS) (Meerburg et al., 2015). A basic representation of the AB process is illustrated in Figure 1.5.
Figure 1.5: Representation of the basic AB process configuration
The main objective of the A-stage is to recover organic carbon through biosorption and minimise losses due to bio-oxidation. In other words, it is redirecting organic carbon to the sludge and, consequently, increasing the energy recovery potential of the wastewater treatment plant (Jimenez et al., 2013). The low SRT in the A-stage selects fast-growing microorganisms. This avoids the loss of sludge mass through endogenous respiration which is, in a CAS WWTP, responsible for a loss of organic carbon stored in microorganisms. A low HRT, on the other hand, limits the degradation of dissolved and particulate organics and, therefore, stimulates the removal through biosorption (Meerburg et al., 2016; Meerburg, 2016). Biosorption processes do not require oxygen, although a limited concentration is needed for cell maintenance and regeneration (Salomé, 1997).
Nevertheless, because of the limited knowledge about the A-stage mechanisms, choosing the exact operational conditions is one of AB systems biggest challenges (Rahman et al., 2019). Generally, lowering the SRT and dissolved oxygen (DO) leads to lower fractions of organic carbon removed through bio-oxidation. However, a low SRT also leads to poor bioflocculation and, therefore, less removal of particulate COD and limited settling (Jimenez et al., 2015; Ge et al., 2013). Hence, choosing the SRT is a difficult trade-off in the A-stage between minimising the losses due to carbon oxidation and achieving enough bioflocculation to remove particulate COD and reduce wash-out of A-sludge (Modin et al., 2016; Meerburg et al., 2016).
1.2.2.2 AB systems in reality
Little information about full-scale AB systems performance is available. Therefore, Stowa decided to make an inventory of the four operational AB systems in the Netherlands (STOWA, 2012; de Graaff et al., 2016). In the following, the results for the AB system Nieuwveer located in Breda, Dokhaven located in Rotterdam and the AB system in Utrecht are summarised. The AB system Garmerwolde located in Groningen is not mentioned, because of incomplete measurements.
1.2. WASTEWATER TREATMENT SYSTEMS
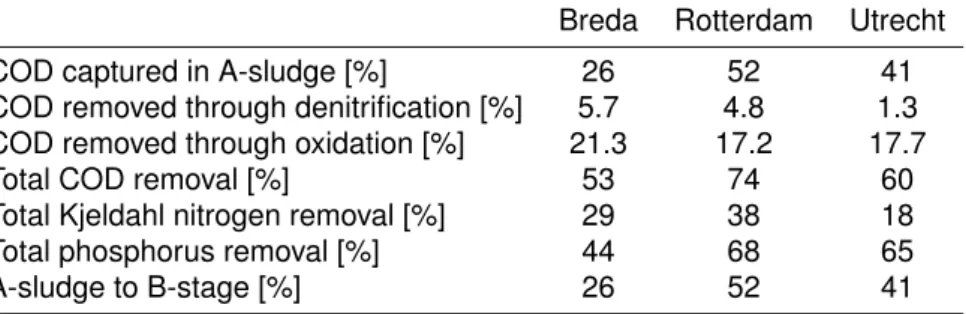
Nieuwveer, Dokhaven and the AB system in Utrecht have a HRT of 23, 34 and 51 minutes, respectively, and a SRT of 0.65, 0.27 and 0.30 days, respectively. To meet the nitrogen effluent requirements, all three systems recirculate the effluent to the A-stage. Nieuwveer and Utrecht have denitrification in the A-stage and B-stage, Dokhaven has only denitrification in the A-stage. In all systems, iron salts are added in the A-stage to remove phosphorus chemically. Table 1.1 shows the removal efficiencies in the A-stage and the fraction of the A-sludge that did not settle and was found in the overflow (A-sludge to B-stage). Stowa stated that further processing of the A-sludge needed attention because the flocs formed in the A-stage were weak and sensitive to anaerobic conditions and shear, due to pumping.
Table 1.1: The calculated average removal efficiencies in 2010 in the A-stage calculated by STOWA (2012)
Breda Rotterdam Utrecht
COD captured in A-sludge [%] 26 52 41
COD removed through denitrification [%] 5.7 4.8 1.3
COD removed through oxidation [%] 21.3 17.2 17.7
Total COD removal [%] 53 74 60
Total Kjeldahl nitrogen removal [%] 29 38 18
Total phosphorus removal [%] 44 68 65
A-sludge to B-stage [%] 26 52 41
A more promising full-scale example is the municipal WWTP in Strass. In this case, the SRT is approximately 12 hours in the A-stage and 10 days in the B-stage. The A-stage removes between 55-65% of the organic carbon loading. The B-stage removes nitrogen with a pre-denitrification configuration, obtaining a nitrogen removal efficiency of 80%. Between 1996 and 2005, the WWTP took measures to become energy self-sufficient. First, eight combined heat and power (CHP) units with higher electrical efficiency were installed. Another important measure was to change the technology treating the nitrogen rich reject liquor from the digested sludge dewatering. Until 2004, this was performed by a sequencing batch reactor strategy combining nitrification and denitrification. This method uses excess A-sludge as a carbon source. In 2005, a combination of short-cut nitrification and anammox was installed. This method needs less aeration (and therefore less energy) and no A-sludge for denitrification. Therefore, as a consequence, a higher portion of A-sludge was available in the digester. Other measures were implementing a more efficient aeration system and reducing the sludge dewatering cost. Ultimately, the measures were successful, and the WWTP went from an energy self-sufficiency of 49% in 1996 to 108% in 2005 (Wett et al., 2007, 2013).
1.2.2.3 CAS systems versus AB systems
Wastewater management needs a holistic approach. Therefore, the advantages and disadvantages of an AB system, which focuses on recovery, compared to a CAS system, which focuses on removal, are listed.
The AB systems have some definite advantages compared to CAS systems:
• AB systems have, in contrast to CAS systems, a high potential to be energy self-sufficient. Good practice of AB-systems, such as the WWTP plant in Strass, can remove around 65% of the COD entering the A-stage. As indicated in Table 1.2, the
average COD conversion efficiencies to methane are significantly higher for A-sludge compared to secondary CAS sludge, leading to higher methane production. Additionally, AB systems have a lower energy consumption, due to a lower aeration need.
• The A-stage provides buffering protection to the B-stage. It was found that the COD removal efficiency in the A-stage increases with higher COD concentrations in the influent. Consequently, COD fluctuations are counteracted, leading to more uniform COD concentrations in the B-stage then would be the case for a CAS system. The A-stage also showed to provide buffering protection against pH fluctuations and toxic loading. Moreover, A-stage microorganisms showed fast recovery from toxicity, due to their fast growth (Boehnke et al., 1997).
• Rahman et al. (2019) stated that high-rate activated sludge systems have the potential to play a crucial role in redirecting nitrogen and phosphorus. Because contrary to physicochemical primary treatment systems, they remove not only particulate nitrogen and phosphorus but also soluble nitrogen and phosphorus through microbial growth. However, little research is performed, and additional research is needed to define their potential.
• Due to the short hydraulic retention time and high sludge loading rate, AB systems need less space compared to CAS systems (Boehnke et al., 1997).
Nevertheless, AB systems have also drawbacks compared to CAS systems:
• Because of the high COD removal in the A-stage, there is a low denitrification potential in the B-stage (de Graaff et al., 2016). Therefore, in the past, AB systems struggled to meet stricter effluent requirements, ultimately leading to the conversion of AB systems to CAS systems or the implementation of an effluent retour flow. A retour flow allows denitrification in the A-stage, but, as a consequence, the hydraulic load on the settlers of both stages increases.
However, the development of short-cut nitrification/denitrification and short-cut nitrification combined with anammox bacteria makes AB-systems again a promising option. This is especially the case, because the emerging nitrogen removal processes do not only require less oxygen, but also lower COD/N ratios compared to the combination of denitrification and nitrification (Hoekstra et al., 2019; de Graaff et al., 2016).
• In contrast to the mature, well known CAS system, the AB process is still an immature technology. Only a small amount of fundamental literature about A-stage processes is available. Consequently, at this moment, there is a limited understanding of A-stage mechanisms and crucial optimising design parameters (Rahman et al., 2019).
• The A-stage struggles with floc formation limitations and poor floc strengths, causing, as already mentioned, a difficult trade-off in operational conditions (Van Winckel et al., 2019).
1.3. SLUDGE VALORISATION
1.3
Sludge valorisation
1.3.1
Anaerobic digestion of sludge
1.3.1.1 General description
Sludge disposal is responsible for 30-50% of the municipal wastewater operational costs (Yuan and Zhu, 2016; Zessner et al., 2010). Anaerobic digestion (AD) lowers this cost by reducing the volume of sludge needing disposal and additionally producing biogas; a source of usable energy (Dohányos et al., 2004; Turovskiy and Mathai, 2006).
During AD, obligate anaerobic and facultative microbes break down organic substrates into biogas in the absence of oxygen (Parkin and Owen, 1986; Tyagi et al., 2019). Biogas usually consists out of 60-70% CH4, 30-40% CO2 and trace amounts of gases like NH3 (<1%), H2S (10-2000 ppm) and water vapour (Osorio and Torres, 2009).
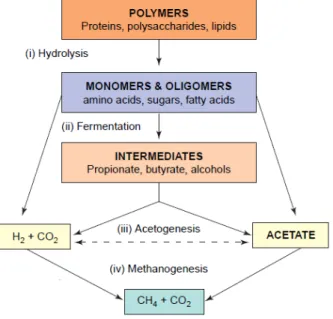
Four stages can be distinguished in the anaerobic digestion process (Figure 1.6):
Figure 1.6: Representation of the four stages in the anaerobic digestion process, adapted from Angenent et al. (2004)
(i) Hydrolysis: During hydrolysis, high molecular weight compounds and insoluble organic
materials are degraded into soluble organic compounds, such as proteins via (poly)peptides to amino acids, carbohydrates into soluble sugars (mono and disaccharides) and lipids to long chain fatty acids and glycerine. For hydrolysis, exo-enzymes excreted by fermentative bacteria are required (Appels et al., 2008; Van Haandel and Van Der Lubbe, 2007). Hydrolysis is commonly the rate-limiting step during AD (Tyagi et al., 2019). Therefore, most research efforts and pre-treatments steps focus on accelerating hydrolysis to improve biogas production (Bolzonella et al., 2012; Kim et al., 2003).
(ii) Acidogenesis/fermentation: In this stage, the simple soluble organic compounds, such
as amino acids, soluble sugars and long chain fatty acids, are converted into mainly VFA (propionic, formic, lactic, butyric and succinic acid), alcohols, ketones, CO2 and H2 (Appels et al., 2008; Tyagi et al., 2019).
(iii) Acetogenesis: In this third step, acetogenic bacteria convert the products of the
acidogenesis into mainly acetic acid (CH3COOH), CO2 and H2 (Van Haandel et al., 1994; Ørtenblad, 2000).
(iv) Methanogenesis: Methanogenesis is the last step in the anaerobic digestion process.
For this last step, mainly two different groups of methanogens, i.e., acetotrophic and hydrogenotrophic methanogens, who belong to the domain of archaea, are responsible. This is in contrast with the previous three steps that were performed mainly by bacteria. Acetotrophic methanogens convert acetic acid into CH4 and CO2, and hydrogenotrophic methanogens use CO2as an electron acceptor and H2as an electron donor to generate CH4 (Van Haandel et al., 1994; Ørtenblad, 2000; Tyagi et al., 2019). Additionally, also the less important methylotrophic pathway occurs where methylotrophic methanogens convert methylated compounds such as methylamines and methanol, to CH4 and CO2 (Ellis et al., 2012).
1.3.1.2 Biogas potential
De Vrieze et al. (2016) reported the COD conversion efficiency ranges (%) based on the methane yield per gram of sludge COD fed for primary, waste activated and A-sludge. For all types of sludge, the COD conversion efficiency is, on average, higher for thermophilic than mesophilic digestion (Table 1.2). Noticeable is also the low conversion efficiencies of waste activated sludge in comparison with A-sludge and primary sludge.
Table 1.2: COD conversion efficiency ranges (%) based on the methane yield per gram of sludge COD fed adapted from De Vrieze et al. (2016)
Sludge type Mesophilic Thermophilic
Primary sludge 42-73 80-90
Waste activated sludge 21-69 35-46
A-sludge 51-77 85-90
Biogas is primarily used for heat and electricity production or as a transport fuel (Venkatesh and Elmi, 2013). In a WWTP, CHP technology is often used to simultaneously produce electricity and heat from biogas. If biogas contains 70% methane and a CHP with an electric efficiency of 40% is considered, 1 m3 of biogas can produce 2.6 kWh electricity (Jenicek et al., 2012).
1.3.1.3 Important parameters pH
Methanogens are very sensitive to pH changes, and can only produce methane at a high rate when the pH is in the neutral range (pH 6.5-7.2) (Tyagi et al., 2019; Zhang et al., 2014; Van Haandel and Van Der Lubbe, 2007). Fermentative bacteria are less sensitive, and can function in a pH range between 4.0-8.5 (Zhang et al., 2014).
1.3. SLUDGE VALORISATION
Therefore, low or high pH values can inhibit methanogenesis. Horiuchi et al. (1999) also showed that the produced VFA composition during acidogenesis alters with the pH in the digester. Butyric acid was the main product at pH 6.0, while acetic and propionic acid prevailed at pH 8.0.
Nitrogen and Sulphur
Despite the fact that nitrogen and sulphur are both essential nutrients for the AD microorganisms, they can also inhibit the process (Yuan and Zhu, 2016; Chen et al., 2008). During AD, ammonia that has two principal forms, i.e., free ammonia (NH3) and ammonium (NH4), is produced from proteins and N-rich organics (Chen et al., 2008). Free ammonia is the most toxic form, because it can pass through the cell membrane and diffuse passively into the cell, causing proton imbalance and/or potassium deficiency (Chen et al., 2008; Appels et al., 2008). The free ammonium concentration from which inhibition start depends on different parameters, such as initial TAN concentrations, process temperature, pH, organic loading rate and acclimation of inoculum. Free ammonia concentrations between 55-1450 mg/L have already shown to inhibit methanogenesis (Yenigün and Demirel, 2013). Inhibition is primarily due to the methanogens that are the least tolerant (Yuan and Zhu, 2016; Chen et al., 2008).
Sulphate, on the other hand, is reduced during AD by sulphate reducing bacteria (SRB) to sulphide. Inhibition occurs due to competition of SRB with the methanogenic archaea and acetogenic and fermentative bacteria for substrate and the toxicity of non-dissociated hydrogen sulphide (Appels et al., 2008; Jeong et al., 2008). The H2S is also an unwanted trace component in biogas and needs to be removed prior to biogas combustion, because it converts to highly corrosive, unhealthy and environmentally hazardous sulfur dioxide (SO2) and sulfuric acid (H2SO4) during burning of the biogas (Abatzoglou and Boivin, 2009).
Temperature
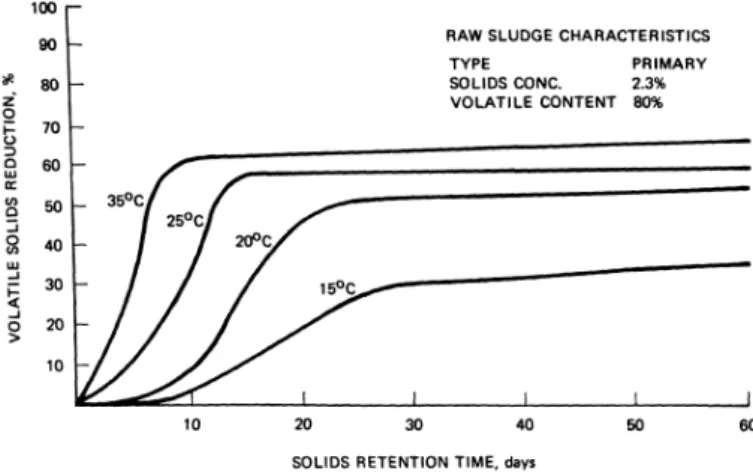
Depending on the optimum temperature and the temperature span in which species grow and metabolise, microorganisms are classified into temperature classes (Lettinga et al., 2001). Most anaerobic digesters have a constant operating temperature near 35◦C, which is the optimal temperature for mesophilic microorganisms. Thermophilic digesters also prevail, and mostly have a constant operating temperature near 55◦C, i.e., the optimal temperature for thermophilic microorganisms (Turovskiy and Mathai, 2006; STOWA, 2011).
Ge et al. (2011) found that the hydrolysis step, which is the rate-limiting step in AD, is strongly influenced by the temperature, and is substantially faster at thermophilic compared to mesophilic conditions. Thermophilic digestion has a higher conversion rate, which permits lower retention times. Another advantage of thermophilic digestion compared to mesophilic digestion is the increased pathogen destruction. The biggest disadvantages, on the other hand, are the higher energy requirements and the lower process stability (Transfer et al., 1979; Gebreeyessus and Jenicek, 2016).
At lower temperatures, the conversion rates decreases rapidly, although at 25 and 20◦C the volatile solids reduction difference can be minimized if high SRTs are applied (Figure 1.7). This is not the case at 15◦C where the volatile solids reduction at a SRT of 60 days is approximately 50% lower than at 35◦C (Transfer et al., 1979).
Figure 1.7: Effect of sludge retention time and temperature on volatile solids reduction (%) of primary sludge in a laboratory scale anaerobic digester, adapted from Transfer et al. (1979)
The microorganisms involved in AD and especially methanogens are also affected by frequent and sharp temperature fluctuations. Temperature changes higher than 1◦C/day can already cause process failure. Therefore, it is recommended to avoid temperature changes higher than 0.6◦C/day. (Turovskiy and Mathai, 2006).
Sludge retention time (SRT) and hydraulic retention time (HRT)
Depending on the type of digester tank, HRT and SRT are coupled during AD. For example, in a continuous stirred tank reactor the reactor and the outflow are in theory perfectly mixed. Consequently, the retention of both sludge and water are identical, the HRT and SRT are thus coupled. An upflow anaerobic sludge blanket reactor, on the other hand, has an uncoupled HRT and SRT because biomass is retained as granules in the reactor. The SRT during digestion must be high enough to ensure that microorganisms can double and metabolise the different substrates (Parkin and Owen, 1986; Turovskiy and Mathai, 2006). A minimum SRT of 12 days is recommended, due to the slow growing methanogens. If SRTs lower than 10 days are applied, significant washout of methanogens can occur, leading to lower conversions and process failure (Gerardi, 2003; STOWA, 2011). The HRT, on the other hand, needs to be high enough to allow sufficient conversion. Higher HRT and SRT values lead to higher conversion efficiencies, but also to the need of larger digestion tanks (STOWA, 2011).
VFA
The VFA produced during the acidogenesis step tend to reduce the pH, but are under stable anaerobic digestion conditions transformed into CH4 and CO2 during the methanogenesis step (Zhang et al., 2014). The degradation step performed during AD by bacteria is, however, strongly connected to methane formation by the archaea. An imbalance between those communities causes VFA accumulation and, therefore, a pH decrease in the reactor. Consequently, there is a decline in reactor performance and even toxic conditions can occur (Franke-Whittle et al., 2014; Akuzawa et al., 2011). The VFA accumulation is therefore an important indicator of process imbalance, and reflects a kinetic uncoupling between the acid consumers and producers (Ahring et al., 1995). An possible consequence of the kinetic uncoupling between the acid consumers and producers is the acidification of the digester in the case of overload.
1.3. SLUDGE VALORISATION
1.3.1.4 Advantages and disadvantages
The key advantage of AD is the production of biogas a source of energy and heat, that can potentially cover part the WWTP electricity consumption. Methane is poorly soluble in water and can easily be separated from the digestate. Therefore, limited or no downstream processing is needed before introducing the biogas in a CHP (Kleerebezem et al., 2015). The main disadvantages are:
• The costs of anaerobic digestion are high. De Vrieze et al. (2019) stated maintenance costs of 0.10 euro per ton manure processed for both mesophilic and thermophilic digestion and capital expenditure (CAPEX) cost of 120 and 150 euro per ton manure capacity per year.
• Microorganisms responsible for AD are sensitive to inhibitors (e.g., NH3 and H2S) and variations in operation conditions, which can lead to process failure (Yenigün and Demirel, 2013; Mao et al., 2015). Co-digestion can lead to more favourable and stable levels of moisture, alkalinity, organic loading, micronutrients and carbon:nitrogen ratios (Bond et al., 2012). It can also avoid inhibition through dilution by mixing two or more complementary organic waste streams (De Vrieze et al., 2015). For kitchen waste, for example, co-digestion with sludge has shown to cause a more stable digestion than when digested as a single substrate (De Vrieze et al., 2015).
• CO2 and trace components (H2S, siloxanes, NH3) need to be removed from the biogas before introduction in the natural gas grid. This is necessary to obtain a higher energy content, avoid corrosion of equipment and avoid the release of unhealthy and environmentally hazardous compounds (Abatzoglou and Boivin, 2009; Bachmann et al., 2015).
1.3.2
VFA production
1.3.2.1 Carboxylate platform
The conversion of sludge into biogas is not the only possible valorisation route through anaerobic digestion. Anaerobic digestion is also included in the carboxylate platform, due to its intermediary production of VFA.
This carboxylate platform is a bio-refinery platform, whereby organic feedstocks are hydrolysed and fermented by an undefined mixed culture to short-chain carboxylates. The VFA are the acid conjugates of the short-chain carboxylates, which are dissociated organic acids with minimum one carboxyl group (Vanwonterghem et al., 2015; Agler et al., 2011). They have a wide range of applications and market prices, varying depending on the type of VFA, between 770 and 2200 euro per ton (Zacharof and Lovitt, 2013). VFA are chemical building blocks and can be used as bulk chemical or as a carbon source for phosphorus and nitrogen removal or when upgraded for the production of bioplastics and esters (Zheng et al., 2010; Mengmeng et al., 2009; Lee et al., 2014). Conventionally, VFA are produced through petrochemical processing. Consequently, implementing this recovery technology is a direct substitution of fossil carbon (Morgan-Sagastume et al., 2011; Zacharof and Lovitt, 2013).
1.3.2.2 VFA fermentation from A-sludge
The VFA, produced through acidogenic fermentation, can accumulate in the broth through inhibition of the slow growing and sensitive methanogens (see 1.6 step (iv)) (Tamis et al., 2015). Different strategies can be applied:
(i) As mentioned before, fermentative bacteria can in contrast to the methanogens, function in a wide pH range between 4.0-8.5. The methanogens contrarily can only produce methane at a high rate when the pH is in the neutral range, i.e., pH values between 6.5-7.2 (Tyagi et al., 2019; Zhang et al., 2014; Van Haandel and Van Der Lubbe, 2007). Consequently, applying acidic or alkaline conditions in the reactor inhibits methanogenesis and favours VFA production.
(ii) Due to the slow growth of methanogens, a low SRT can also inhibit methanogenesis. Miron et al. (2000) found that during the digestion of primary sludge, no biogas was produced and acidogenic conditions prevail when the SRT was lower than 8 days. If the SRT was higher than 10 days methanogenic conditions prevailed.
(iii) Methanogenesis can also be effectively inhibited due to the addition of a chemical inhibitor. Examples are 2-bromoethanesulfonate (BES) and 2-chloroethanesulfonate (CES) (Liu et al., 2011)
It is not only essential to inhibit methanogenesis, but also to find and optimise the key parameters affecting the fermentation. A couple of studies are available for primary and waste activated sludge, but only one article from Cagnetta et al. (2016) investigated the critical parameters and potential of A-sludge fermentation. Cagnetta et al. (2016) found that the optimal conditions were at 35◦C, pH = 7 and a retention time of 7 days. Under these conditions, there was no methane production, and the highest VFA production occurred. Table 1.3 shows the VFA yield for the three AB systems that were discussed in the previous section. In this experiment, the yielded VFA composition was dominated by acetate and propionate ranging between 44-58% and 29-33%, respectively, of the total VFA. Smaller amounts of iso-butyrate, butryrate, iso-valerate and valerate were also present in the broth.
Table 1.3: The VFA yield expressed as mg COD g−1 CODƒ ed and for A-sludge originated from three
AB-systems calculations made by Cagnetta (2017)
VFA yield [g COD/g CODƒ ed] Nieuwveer (Breda) 157 +/- 5 Dokhaven (Rotterdam) 146 +/- 4 Utrecht 210 +/- 2 1.3.2.3 Challenges
Despite the much higher economic potential of VFA compared to CH4, production needs to overcome multiple challenges before viable commercial implementation.
First, the VFA yield has to increase cost-effectively. To achieve higher VFA yields, different studies investigated pre-treatment steps. Those pre-treatment steps focus on accelerating the
1.3. SLUDGE VALORISATION
rate-limiting step in the fermentation, i.e., hydrolysis. Yan et al. (2010) investigated the effect of ultrasonic pre-treatment on the VFA production from secondary activated sludge. They found that, by applying optimal ultrasonic energy density, the VFA concentration increased with a factor 1.81. The maximum VFA concentration was reached after 72 hours instead of 144 hours. Another study (Morgan-Sagastume et al., 2011), found that applying high-pressure thermal hydrolysis as pre-treament step on secondary activated sludge gives a 5-fold increase in VFA-yield. At last, Cagnetta et al. (2017) showed that using forward-osmosis as pre-treatment gives a 4.4 fold increase in VFA-yield for the A-sludge from Nieuwveer. Cagnetta et al. (2017) stated that the increased hydrolysis and consequently VFA production was mainly due to the chemical action of ions leaking from the draw solution and the physical effect caused by air scouring and recirculation of the stream.
From these results, it seems that pre-treatment will play a pivotal role to increase the VFA yield. However, as stated by Alloul et al. (2018), no significant conclusions can be taken from single studies, and future research for each pre-treatment technology is necessary.
Another critical challenge is the downstream processing of the VFA broth. A wide range of recovery technologies are already investigated such as distillation, adsorption, liquid-liquid extraction and electrolytic membrane extraction (Andersen et al., 2016; Zacharof and Lovitt, 2013; Andersen et al., 2016). None of these techniques is currently economically viable primarily because of the high energy requirements and capital cost. Additionally, these recovery techniques have shown poor performances at the low VFA concentrations present in the broth. Therefore, there is a need to develop an economically viable recovery technology that can achieve high VFA concentrations (Cagnetta, 2017).
1.3.3
Dewatering and drying
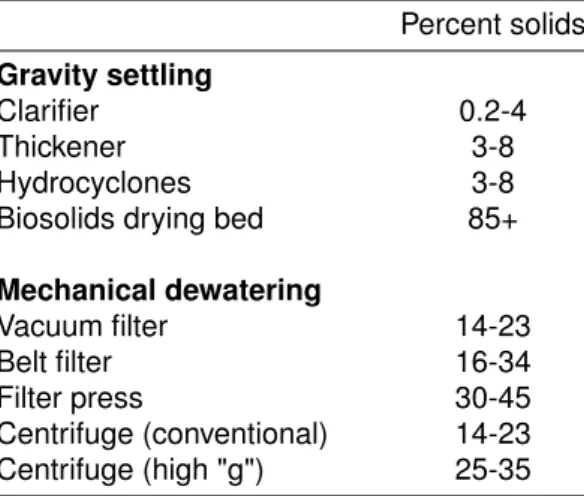
In a sludge valorisation route, a dewatering and/or drying step is often present. The water content of sludge is even a decisive factor in the economic viability of (thermal) sludge treatment technologies, due to the high heat of absorption needed for water evaporation and the increase of transport costs due to a higher water content. Consequently, the cost and performance of dewatering technologies is a critical factor in the techno-economical evaluation of (thermal) sludge treatment technologies (Niessen, 2010). Table 1.4 shows conventional dewatering technologies and their average obtained dry solids percentages.
Table 1.4: Typical biosolids dewatering effectiveness levels, adapted from Niessen (2010) Percent solids
Gravity settling
Clarifier 0.2-4
Thickener 3-8
Hydrocyclones 3-8
Biosolids drying bed 85+
Mechanical dewatering Vacuum filter 14-23 Belt filter 16-34 Filter press 30-45 Centrifuge (conventional) 14-23 Centrifuge (high "g") 25-35
Drying, on the other hand, can also reduce the water content. Although, Flaga (2007) reported that drying consumes on average 25-30 times more energy than mechanical dewatering. This highlights the importance of a low-value waste heat source, to make drying economically viable (STOWA, 2013).
1.3.4
Incineration
1.3.4.1 General description
During incineration, sludge is heated and combusted in a furnace with an excess amount of oxygen to achieve complete oxidation of the organic fraction. This exothermic oxidation process produces flue gas that mainly contains carbon dioxide and water, and inert ash is left behind in the furnace (Raheem et al., 2018; Tyagi and Lo, 2013).
Sludge incineration technologies can be categorised in two classes (Liu et al., 2012; Dangtran et al., 2000; Niessen, 2010):
• Multiple hearth furnaces: Multiple hearth furnaces have multiple zones for heating and
combustion and typically operate around 950◦C, only continuous operation is possible, due to the high energy requirements for start-up.
• Fluidized-bed furnaces Fluidized-bed furnaces have only one zone for heating and
combustion and typically operate around 850◦C. Since the seventies, the fluidized-bed furnace is the most commonly used sludge incineration technology. This is because of the lower auxiliary fuel utilisation, reduced maintenance cost and lower NO, CO and
total hydrocarbon formation, compared to multiple hearth furnaces.
An incineration configuration generally consists of a sludge dryer before the furnace and an air pollution control system and energy recovery system after the furnace. The energy recovery system is a heat-exchanger where a cooling fluid, typically water, cools down the flue gas. Subsequently, the formed steam can be used for heating purposes or is sent to a turbine followed by a generator, to produce electricity (Guibelin, 2004).
1.3.4.2 Sludge incineration
Two important sludge incineration parameters are the lower heating value or calorific value and water content of the sludge.
The lower heating value is defined as the total heat released due to the combustion of one unit mass of sludge excluding the latent heat of water vaporisation (Basu, 2010; Bilgen et al., 2012). Activated sludge generally has lower heating values between 3.12-16.5 MJ per kg wet sludge (Komilis et al., 2014).
Water content, on the other hand, extracts energy for evaporation and drying is necessary to have an auto-thermal combustion, i.e., no additional fuel needed during sludge incineration (Flaga, 2007). McCarty et al. (2011) stated that when the sludge water content is higher or equal to 30%, less energy is produced through sludge combustion than required for sludge incineration.
1.3. SLUDGE VALORISATION
To lower the need for drying and because incineration is usually performed on a large scale, co-incineration of sludge with waste streams such as domestic refuse or coal is an often applied alternative for mono-incineration (Fonts et al., 2012). The ashes that are left behind in the furnace are often landfilled. However, technologies to recover phosphate from the incineration ash exist (Donatello and Cheeseman, 2013).
1.3.4.3 Advantages and disadvantages
The most important advantages are the achieved sludge volume reduction of, on average, 90%, thermal destruction of the toxic compounds and minimum odour generation (Fytili and Zabaniotou, 2008). In general, incineration is a well-known and reliable technology (Raheem et al., 2018).
A disadvantages of incineration is that the ash contains heavy metals and is, therefore, potentially hazardous (Samolada and Zabaniotou, 2014). Furthermore, the emissions of heavy metals, mercury, dioxins, furans, acid gases, as well as NOx and N2O are a concern (Werther and Ogada, 1999). Consequently, the needed air pollution controls systems significantly increase the cost of incineration, and make incineration only economically feasible in a highly centralised way (Fonts et al., 2012).
1.3.5
Pyrolysis
1.3.5.1 General description
An alternative, emerging technology for both anaerobic digested as non-digested sludge is pyrolysis (Cao and Pawłowski, 2012). During pyrolysis, sludge is thermochemically decomposed in an inert atmosphere (absence of oxygen), producing condensable vapours (bio-oil), non-condensable gases, and a solid product (char) (Fonts et al., 2012; Bridgwater, 2012; Werther and Ogada, 1999).
Before entering the pyrolysis reactor, sludge is dewatered and dried at temperatures lower than 200◦C. The physical processes and chemical reactions during pyrolysis are complex and depend on the nature of the biomass and the process conditions (Laird et al., 2009). However, generally during pyrolysis, biomass is heated by an external heat source to a maximum temperature at a specified rate known as the heating rate. Two types of reactions can be differentiated. For these two reactions, the mentioned temperatures are depended on many parameters and are only presented to give an indication (Nachenius et al., 2013; Basu, 2010; Oladejo et al., 2019):
• Primary pyrolysis reactions: Between 200-700◦C, sludge starts to decompose into condensable vapours and non-condensable gases leaving behind a char with high fixed carbon content and low volatile carbon content.
• Secondary pyrolysis reactions: From temperatures around 600◦C or lower, if the condensable gases are not removed immediately, condensable gases with a high molecular weight crack producing secondary char and non-condensable gases. Consequently, secondary pyrolysis reactions lower the bio-oil yield.
Bio-oil, char and gasses are always produced during pyrolysis. In function of the applied operational condition and feed, pyrolysis installations can aim at producing mainly char, bio-oil or gas (Fonts et al., 2012; Bridgwater, 2012). It is primarily the nature of the biomass, maximum applied temperature, retention time and heating rate that affect the product composition and product distribution (Onay and Kockar, 2003).
Generally, two different pyrolysis technologies are differentiated:
• Fast pyrolysis: The operational conditions during fast pyrolysis aim to achieve the
highest possible bio-oil yield. During fast pyrolysis, sludge is rapidly heated to temperatures around 500◦C. The retention time for the produced hot vapours is short (typically < 2 seconds) and the produced char that can be a catalyst for cracking is removed continuously. This is to prevent (1) secondary thermal and catalytic cracking reactions to small non-condensable gas molecules and (2) polymerisation of condensable vapours to char (Bridgwater, 2012; Venderbosch and Prins, 2010).
• Slow pyrolysis: The operational conditions during slow pyrolysis aim to achieve the
highest possible char yield. During slow pyrolysis, sludge is heated to temperatures between 300 and 600◦C with a low heating rate ranging between 1 and 30◦C min−1 (Ronsse et al., 2013; Venderbosch and Prins, 2010).
1.3.5.2 Char
In the past, char was considered a low value waste product. The low calorific value of char produced from sewage sludge (around 5 MJ kg−1) and the high treatment cost of the flue gas, due to the high heavy metal concentration in the char, makes it unattractive for incineration (Samolada and Zabaniotou, 2014). Consequently, almost all research focused on selecting process conditions minimising the char yield (Sohi et al., 2010).
However, recently new emerging char applications received attention, e.g., slow-release phosphorus fertiliser, gas adsorbent and secondary prime material for activated carbon production. At present, most of them are still in an experimental stadium (Callegari and Capodaglio, 2018). The application with the highest economical potential is to use char as a slow release phosphorus fertiliser. This is possible due to the pyrolysis temperatures that ensure that phosphorus is concentrated in the char. Phosphorus in biochar has shown higher bio-availability than in incineration ash and a limited risk of metal release, due to the fixation of heavy metals in the carbonaceous matrix (Glaser and Lehr, 2019; Gao et al., 2017). An extra benefit of adding char to the soil is that it has a climate-mitigation potential. Biochar can reduce the atmospheric CO2 concentration. This is primarily because carbon is stored in a recalcitrant form with a half-life time of over 1000 years (Ronsse et al., 2013; Woolf et al., 2010).
Nevertheless, STOWA (2015) stated that, due to the high metal concentration, char cannot be used as fertiliser in the Netherlands and the produced char has to be exported to countries with a less strict regulation. The bioavailability of phosphorus and the heavy metal stability in relation to process conditions aren’t completely known, and require additional research.