RIVM, P.O. Box 1, 3720 BA Bilthoven, telephone: +31 302749111; fax: +31 302742971
Correspondence: Mark H.M.M. Montforts Expert Centre for Substances
mark.montforts@rivm.nl RIVM report 601500002/2005
The trigger values in the environmental risk assessment for (veterinary) medicines in the European Union: a critical appraisal
M.H.M.M. Montforts
This investigation has been performed by the Expert Centre for Substances of the RIVM by order and for the account of the Ministry of Spatial Planning, Housing and the Environment within the framework of project M/601500, Consultancy on (veterinary) medicines and (natural) hormones.
Het rapport in het kort
De drempelwaarden in de milieurisicobeoordeling voor (dier)geneesmiddelen in de Europese Unie: een kritische beschouwing
Een kritische beschouwing van de wetenschappelijke onderbouwing van bestaande drempelwaarden voor blootstelling aan humane geneesmiddelen in water en diergeneesmiddelen in bodem leidt tot de aanbeveling deze waarden te herzien.
Het gebruik van drempelwaarden is opgenomen in de (concept) richtsnoeren voor de milieurisicobeoordeling als onderdeel van de Europees geharmoniseerde registratie van (dier)geneesmiddelen. Op basis van het overschrijden van deze drempelwaarden wordt besloten of een risicobeoordeling voor het milieu noodzakelijk is. In de opinie van het Europese Wetenschappelijk Comité voor Toxicologie, Ecotoxicologie en het Milieu is de bestaande waarde voor water (10 ng/l) wetenschappelijk ondeugdelijk. Volgens de Europese Wetenschappelijke Stuurgroep is de bestaande waarde voor bodem (100 µg/kg) evenmin wetenschappelijk onderbouwd. De kritische beschouwing van de gebruikte gegevens en de toegepaste beoordeling, met inachtneming van gegevens uit de openbare literatuur, leidt tot beduidend lagere drempelwaarden van 0,4 ng/L voor water en 1 µg/kg voor bodem.
Abstract
The trigger values in the environmental risk assessment for (veterinary) medicines in the European Union: a critical appraisal
A critical appraisal of the data used for the establishment of the trigger values for the exposure of the aquatic environment to human medicines and the terrestrial environment to veterinary medicines leads to the recommendation to change these values.
The (draft) technical guidance documents in support of the European registration procedure for human and veterinary medicines demand no risk assessment for substances with an exposure level below a certain trigger value for water (10 ng/L) and soil (100 µg/kg), respectively. However, the EU Scientific Committee on Toxicity, Ecotoxicity and the Environment did not consider the proposed number of the aquatic trigger to be scientifically valid. The EU Scientific Steering Committee also considered the soil trigger value as non-scientific. The critical appraisal of available data and methodology, complemented with readily available public information, leads to considerably lower trigger values of 0.4 ng/L for the water compartment and 1 µg/kg for the soil compartment.
Contents
Summary 7
1 Introduction 9
2 The water concentration trigger value 11
2.1 Reflection of the ecosystem and of the substances of interest 15
2.2 Data selection 16
2.3 Aquatic effect assessment 17
2.4 Extending data selections 19
2.5 The position of the trigger in the risk assessment framework 20
3 The soil concentration trigger value 21
3.1 Reflection of the ecosystem 22
3.2 Data selection 23
3.3 Terrestrial effect assessment: a critical appraisal 24
3.3.1 Bioavailability in soil 24
3.3.2 Functional redundancy 25
3.3.3 Mitigation by degradation 26
3.3.4 Conclusions on the safety factors 26
3.4 The position in the risk assessment framework 27
3.4.1 Standardisation to risk model conditions 27
3.4.2 Differentiation between routes of emission 27
3.4.3 Harmonisation between compartments 28
3.5 Conclusions on the scientific evaluation of the dataset 28
3.6 Extending data selections and interpretations 28
3.6.1 Data selection 28
3.6.2 Partitioning calculations 29
3.6.3 Statistical analysis 30
3.6.4 The hazard of resistance development 33
4 Extrapolation to other substances 35
5 Conclusions 37
Summary
The technical guidance documents that have been developed in support of the registration procedure for medicines foresee no risk-based assessment for substances with a presumed negligible emission and exposure level. However, the EU Scientific Committee on Toxicity, Ecotoxicity and the Environment (CSTEE) opinion on the draft EMEA Guideline for the Environmental Risk Assessment of Human Medicines did not consider the proposed value of the aquatic trigger to be scientifically valid. The EU Scientific Steering Committee also considered the soil trigger value for veterinary medicines as non-scientific. The purpose of this report is to re-evaluate the data that were originally published, including the original assessments made, together with readily available new information, with the objective to set an alternative trigger value, if this is deemed applicable.
A number of conclusions on the original data and arguments to support a concentration trigger were drawn in the present study:
A. Both original datasets for the aquatic and terrestrial trigger were not very comprehensive in number of substances and types of endpoints. The currently used trigger values for soil and water are not satisfactory and have no scientific basis.
B. For the water concentration trigger, most importantly, the absence of chronic data in the original data set hampers a scientifically well underpinned trigger. Using readily available information on pharmaceuticals and other biologically active substances, the trigger is proposed at 0.4 ng/L for the water compartment.
C. For the soil concentration trigger, most importantly, the argumentation on the use of assessment factors did not comply with the EU-guidance given in the frameworks of new and existing substances, pesticides and biocides. It was demonstrated that further considerations of the given arguments for a soil threshold concentration provide strong arguments to set a threshold at no higher than 1 µg/kg.
1 Introduction
Risk management of pharmaceutical products is one of the tasks of EU governance (Di Fabio, 1994). The EU directives 2001/82/EC and 2001/83/EC, as amended, on the registration of medicinal products, call for an environmental risk assessment (Anonymous, 2001a) (Anonymous, 2001b). It has been considered that the registration process, and the risk models used, should reduce the costs to society in terms of environmental and economic damage, and the assessment process itself should neither hamper product development nor timely action (Cranor, 1997). An exposure trigger that controls the onset of risk assessment can be a powerful tool in realising these objectives. A scientific analysis of data can strengthen the choice of the numerical value. The technical guidance documents that have been developed in support of the registration procedure foresee no risk-based assessment for substances with a presumed negligible emission and exposure level (VICH, 2000; EMEA, 2000; VICH, 2000). Science has been called in to back up the numerical value of the exposure triggers, with a retrospective assessment of a dataset of several drug substances. Concepts and methods developed in ecotoxicology, environmental chemistry and risk assessment were introduced and applied to data which led to the recommendation that the lowest toxicity value in the available dataset should provide an acceptable measure of safety to protect the environment (AHI, 1997) (FDA, 1996).
However, the EU Scientific Committee on Toxicity, Ecotoxicity and the Environment (CSTEE) opinion on the draft EMEA Guideline did not consider the proposed number of the aquatic trigger to be scientifically valid, because examples of pharmaceuticals are available that show higher toxicity (thus lower endpoint values) than used in the FDA dataset (CSTEE, 2001). The EU Scientific Steering Committee considered the use of the soil trigger value as non-scientific (SSC, 2003).
The purpose of this report is to re-evaluate the data that were originally published, including the original assessments, together with new information, with the objective to set an alternative trigger value, if this is deemed applicable.
A concentration trigger decides if a risk assessment is needed. It is an exposure trigger that is based on effect data. Effect data for a given substance can be used to derive a safe exposure level for this substance, provided that several assumptions are made and that necessary conditions have been fulfilled. Some sections below relate to data selection and interpretation, and some relate to the context of the trigger value within the risk assessment scheme:
• Are the data representative for the ecosystem of interest, • Are the data representative for the substances,
• Are the data complete or have other data been neglected or overlooked, • Have the data been assessed correctly with respect to the risk model1
,
• Is the trigger value standardised to the conditions specified in the risk model, and
1
The risk model describes the integral process of risk assessment at registration, including the exposure and effect models, the protection goals, and the conventions applied to the data interpretation, the modelling, and the decision making.
• Does the trigger have influence on the assessment of other compartments in the risk assessment scheme?
In the conclusions a proposal for an alternative trigger (if applicable) is made. The case studies of the aquatic and the terrestrial trigger values are treated separately, since the aquatic trigger is used in the technical guidance for human medicines, and the terrestrial trigger in de technical guidance for veterinary medicines.
2 The water concentration trigger value
The water concentration trigger value was based on a retrospective review of ecotoxicity data submitted in environmental assessment for public display, prepared by the U.S. Food and Drug Authority (FDA) in 1996 (FDA, 1996). The distribution of all results was analysed to reach the conclusion that 1 µg/L represented the lowest concentration where a No Observed Effect Concentration (NOEC) was found (see Table 1). This value was considered suitable by the FDA for triggering further assessment of all (future) pharmaceuticals.
Table 1. Overview of the FDA dataset (FDA, 1996). For every test only one endpoint is presented.
Substance Metabolite species duration effect <> value unit
midazolam (MGI) MIC 20 ppm
midazolam Daphnia acute EC50 0.2 ppm
flumazenil Daphnia acute EC50 > 500 ppm
nicotine D. pulex acute EC50 0.2 ppm
nicotine D. pulex chronic LOEClength 0.07 ppm
nicotine D. magna acute EC50 3 ppm
nicotine Fathead minnow acute LC50 20 ppm
nicotine Rainbow trout acute LC50 7 ppm
nicotine Goldfish acute LC50 13 ppm
nicotine Midges acute EC50 > 27 ppm
nicotine Crayfish acute LC50 > 38 ppm
nicotine Snail acute LC50 > 38 ppm
tramadol HCl (ASRIT) MIC > 150 ppm
tramadol HCl Daphnia acute EC50 73 ppm
tramadol HCl Fish acute LC50 130 ppm
tramadol HCl Worm acute NOEC 330 ppm
unknown 1 (ASRIT) EC50 > 10 ppm
unknown 1 Daphnia acute EC50 4 ppm
unknown 1 Bluegill acute LC50 > 4 ppm
flosequinan (MGI) ≥ 100 ppm
flosequinan BTS53554 (MGI) ≥ 250 ppm
perindopil erbumine (MGI) NOEC ≥ 1000 ppm
perindopil erbumine Daphnia acute EC50 > 1000 ppm
perindopil erbumine Bluegill acute LC50 > 990 ppm
dobutamine (ASRIT) NOEC 60 ppm
spirapril HCl (MGI) MIC > 1000 ppm
spirapril HCl Daphnia acute EC50 > 930 ppm
spirapril HCl Bluegill acute LC50 > 970 ppm
carvedilol (ASRIT) EC50 98 ppm
carvedilol Daphnia acute EC50 > 3 ppm
carvedilol Fish acute LC50 1 ppm
moexipril HCl prodrug (MGI) ≥ 400 ppm
moexipril HCl prodrug Daphnia acute EC50 800 ppm
moexipril HCl moexiprilat (MGI) ≥ 400 ppm
moexipril HCl moexiprilat Daphnia acute EC50 > 1000 ppm
milrinone lactate (ASRIT) MIC > 220 ppm
milrinone lactate Daphnia acute EC50 414 ppm
nisoldipine (ASRIT) EC50 > 10000 ppm
nisoldipine Daphnia acute EC50 33 ppm
Substance Metabolite species duration effect <> value unit
losartan K (MGI) MIC > 1000 ppm
losartan K (ASRIT) NOEC ≥ 1000 ppm
losartan K Daphnia acute EC50 331 ppm
losartan K Rainbow trout acute LC50 > 929 ppm
losartan K Fathead minnow acute LC50 > 1000 ppm
losartan K green algae chronic NOEC 143 ppm
losartan K bluegreen algae chronic NOEC 556 ppm
unknown 2 (ASRIT) EC50 885 ppm
unknown 2 Daphnia acute LC50 22 ppm
unknown 2 Fathead minnow acute LC50 13 ppm
unknown 3 (ASRIT) EC50 ≥ 1000 ppm
unknown 3 Daphnia acute EC50 346 ppm
unknown 3 Fathead minnow acute LC50 > 1000 ppm
unknown 4 (MGI) MIC ≥ 4 ppm
unknown 4 Daphnia acute EC50 0.56 ppm
paroxetine HCl (ASRIT) EC50 25 ppm
paroxetine HCl Daphnia acute LC50 3 ppm
paroxetine HCl Bluegill acute LC50 2 ppm
paroxetine HCl BR 36610A (ASRIT) EC50 80 ppm
paroxetine HCl BR 36610A Daphnia acute LC50 35 ppm
sumatriptan succinate (ASRIT) EC50 > 720 ppm
sumatriptan succinate Daphnia acute LC50 290 ppm
unknown 5 (ASRIT) EC50 > 100 ppm
unknown 5 Daphnia acute EC50 113 ppm
unknown 5 Rainbow trout acute LC50 > 100 ppm
unknown 5 green algae acute NOEC 11 ppm
venlafaxine HCl (ASRIT) EC50 > 50 ppm
nefazodone HCl (ASRIT) EC50 348 ppm
nefazodone HCl Daphnia EC50 7 ppm
fluoxetine HCl (MGI) MIC ≥ 57 ppm
fluoxetine HCl Daphnia acute EC50 0.49 ppm
fluoxetine HCl Rainbow trout acute LC50 2 ppm
fluoxetine HCl green algae chronic EC50 0.031 ppm fluoxetine HCl green algae chronic NOEC 0.001 ppm
gabapentin (MGI) MIC > 1000 ppm
gabapentin Daphnia acute NOEC 1100 ppm
lamotrigine (MGI) MIC > 185 ppm
lamotrigine (ASRIT) EC50 > 1000 ppm
fluvoxamine maleate Bacteria MIC 500 ppm
fluvoxamine maleate Algae NOEC 31 ppm
risperidone (MGI) MIC > 100 ppm
risperidone Daphnia acute EC50 6 ppm
risperidone Bluegill acute LC50 6 ppm
risperidone green algae chronic effects 10 ppm
risperidone bluegreen algae chronic effects 100 ppm
unknown 6 prodrug (MGI) MIC > 1000 ppm
unknown 6 prodrug Daphnia acute EC50 170 ppm
unknown 6 active metabolite (MGI) MIC > 1000 ppm
unknown 6 active metabolite Daphnia acute EC50 > 39 ppm
unknown 6 further metabolite (MGI) MIC > 1000 ppm
unknown 6 further metabolite Daphnia acute NOEC 28 ppm
thiotepa (MGI) MIC ≥ 1000 ppm
thiotepa Daphnia acute EC50 546 ppm
Substance Metabolite species duration effect <> value unit
paclitaxel (ASRIT) EC50 > 1000 ppm
paclitaxel Daphnia acute EC50 > 0.74 ppm
vinorelbine tartrate (MGI) MIC 1000 ppm
porfirmer Na (MGI) MIC > 1000 ppm
porfirmer Na Daphnia acute EC50 > 994 ppm
cetirizine HCl (MGI) MIC ≥ 60 ppm
cetirizine HCl Daphnia acute EC50 330 ppm
fluticasone propionate (ASRIT) EC50 > 1000 ppm
fluticasone propionate Daphnia acute EC50 0.55 ppm
fluticasone propionate Worm acute LC50 > 1000 ppm
budesonide Daphnia acute LC50 20 ppm
budesonide Fish acute LC50 > 19 ppm
budesonide green algae acute NOEC 10 ppm
salmeterol (ASRIT) EC50 688 ppm
salmeterol Daphnia acute EC50 20 ppm
ipratropium bromide (MGI) MIC > 1000 ppm
unknown 7 (MGI) NOEC ≥ 90 ppm
unknown 7 Daphnia acute EC50 56 ppm
unknown 7 Fish acute EC50 > 19 ppm
iopromide (MGI) MIC > 1000 ppm
iopromide Daphnia acute EC50 > 1016 ppm
iopromide Rainbow trout acute NOEC > 962 ppm
iopromide Bluegill acute LC50 > 973 ppm
iopromide green algae acute NOEC 68 ppm
bicisate diHCl (MGI) MIC 1000 ppm
ranitidine HCl (ASRIT) EC50 > 893 ppm
ranitidine HCl Daphnia acute EC50 650 ppm
omeprazole Daphnia acute LC50 88 ppm
ondansetron HCl (ASRIT) EC50 > 802 ppm
ondansetron HCl Daphnia acute EC50 28 ppm
cisapride (MGI) MIC > 100 ppm
cisapride Daphnia acute EC50 > 1000 ppm
cisapride Bluegill acute LC50 > 1000 ppm
cisapride green algae chronic effects 320 ppm
cisapride bluegreen algae chronic effects 100 ppm
cimetidine (ASRIT) EC50 > 1000 ppm
cimetidine Daphnia acute EC50 740 ppm
cimetidine Bluegill acute NOEC 1000 ppm
cimetidine cimetadine sulfoxide (ASRIT) EC50 > 1650 ppm
cimetidine cimetadine sulfoxide Daphnia acute EC50 > 980 ppm
aprotinin (ASRIT) NOEC > 1000 ppm
aprotinin Fish acute NOEC > 1000 ppm
famotidine (ASRIT) NOEC 68 ppm
famotidine Daphnia acute LC50 398 ppm
famotidine Fathead minnow acute LC50 > 680 ppm
lansoprazole (MGI) NOEC ≥ 60 ppm
lansoprazole Daphnia acute NOEC > 22 ppm
lansoprazole Rainbow trout acute LC50 18 ppm
finasteride Microorganisms ≥ 50 ppm
finasteride Daphnia acute LC50 21 ppm
finasteride Rainbow trout acute LC50 20 ppm
finasteride green algae chronic NOEC ≥ 49 ppm
metformin HCl (MGI) MIC ≥ 100 ppm
Substance Metabolite species duration effect <> value unit
metformin HCl Bluegill acute NOEC 982 ppm
acarbose (MGI) MIC > 1000 ppm
acarbose Daphnia acute NOEC > 1000 ppm
acarbose Fish acute NOEC > 1000 ppm
bicalutamide Daphnia acute EC50 > 5 ppm
bicalutamide Daphnia chronic NOEC 6 ppm
bicalutamide green algae acute NOEC 1 ppm
bicalutamide bluegreen algae acute NOEC 1 ppm
alendronate sodium (MGI) MIC > 100 ppm
alendronate sodium (ASRIT) NOEC 4320 ppm
alendronate sodium Daphnia acute LC50 22 ppm
alendronate sodium Rainbow trout acute LC50 > 1000 ppm
alendronate sodium Fathead minnow acute LC50 1450 ppm
alendronate sodium green algae chronic NOEC 0.5 ppm
lomefloxacin Daphnia acute EC50 130 ppm
lomefloxacin Rainbow trout acute LC50 170 ppm
lomefloxacin green algae acute NOEC 2 ppm
unknown 8 (MGI) MIC ≥ 0.28 ppm
unknown 8 (ASRIT) EC50 > 243 ppm
unknown 8 Daphnia acute LC50 84 ppm
cefprozil Daphnia acute > 642 ppm
loracarbef Daphnia acute EC50 > 963 ppm
loracarbef green algae chronic NOEC 13 ppm
azithromycin (MGI) MIC ≥ 0.4 ppm
azithromycin (ASRIT) EC50 269 ppm
azithromycin Daphnia acute EC50 120 ppm
azithromycin Amphipod acute LC50 > 120 ppm
azithromycin Worm acute NOEC 1000 ppm
dirithromycin Daphnia acute NOEC 48 ppm
dirithromycin Rainbow trout acute NOEC 2880 ppm
dirithromycin green algae chronic NOEC 0.07 ppm
tazobacarntarn Na/piperacillin Na
Microorganism MIC ≥ 250 ppm
ceftibuten (MGI) MIC ≥ 0.2 ppm
ceftibuten Daphnia acute EC50 > 600 ppm
ceftibuten Amphipod acute LC50 > 520 ppm
foscarnet Na (ASRIT) EC50 > 1000 ppm
didanosine Daphnia acute EC50 > 1021 ppm
zalcitabine (MGI) MIC > 1000 ppm
zalcitabine (ASRIT) EC50 > 1000 ppm
zalcitabine Daphnia acute EC50 > 1790 ppm
famciclovir (ASRIT) EC50 1230 ppm
famciclovir Daphnia acute LC50 820 ppm
famciclovir Bluegill acute LC50 > 986 ppm
stavudine (ASRIT) EC50 > 1000 ppm
stavudine Daphnia acute NOEC 980 ppm
cyclosporine (ASRIT) EC50 > 100 ppm
cyclosporine (ASRIT) NOEC 100 ppm
cyclosporine Daphnia acute EC50 20 ppm
cyclosporine Rainbow trout acute LC50 > 100 ppm
dorzolamide HCl (ASRIT) MIC > 800 ppm
dorzolamide HCl Daphnia acute EC50 699 ppm
dorzolamide HCl Fathead minnow acute LC50 > 1000 ppm
For the purpose of the guidance for the environmental risk assessment of the European Medicines Agency (EMEA) this value of 1 µg/L was downsized to 10 ng/L, thus ‘taking chronic exposure (a factor of 10) and dilution between sewage treatment discharge and surface water into account (a factor of 10)’2 (EMEA, 1994). The EMEA trigger is hence based on the same dataset, but with some further consideration of the data and the risk model. The dataset and the assessment approach are further discussed below.
2.1 Reflection of the ecosystem and of the substances of interest
Where there is a need to assess the potential impact of substances entering waters, any hazard or risk assessment should ideally be based upon data generated using a range of ecologically relevant species (for example algae, invertebrates and fish). There are also circumstances, however, where the special conditions existing in a particular environment give rise to a reduced or limited species diversity and/or specific stresses such as low or variable salinity. In such circumstances of low species diversity, adverse impacts in individual species can have devastating impacts on the specialized ecosystem. Thus, while high species diversity may lead to a wide sensitivity distribution, but also considerable functional overlap, low species diversity may result in a lower sensitivity distribution but increase the ecosystem function dependency on individual keystone species. In both cases, the effects assessment must use, where possible, data relevant to the environmental compartment that is considered (EC, 2003). The degree to which the range of species in the data set represents the range of taxa in the ecosystem is an important issue that may influence the outcome to a great extent. The relative importance of autotrophic and heterotrophic species, detrivores, producers, and predators should be reflected in the test model selection.
Effect data on micro-organisms, algae, daphnids, fish, and some other invertebrates have been reported (Table 1). Not all species and test durations were identified, stressing that data quality is poor. Two types of tests with micro-organisms are reported: microbial growth inhibition tests and activated sludge respiration inhibition tests. If algae, daphnids and fish have been tested, this gives a base set of information (EC, 2003).
However, the data reported focus on test endpoints that are not the most sensitive regarding the substances under consideration (pharmaceuticals) and regarding the aquatic environment. The major problem is the acute nature of the exposure in the test systems, in combination with the effect endpoints: lethal effects for invertebrates and fish, growth rate for algae. Conceptually, based on the specific mode of actions of pharmaceuticals, i.e. modulation of receptors at sub-toxic levels, a large discrepancy between chronic effects on reproduction or individual growth, and acute effects, i.e. based on mortality or population growth rate, are to be expected. Also it must be considered that exposure will be continuous, not necessarily due to the persistent nature of the substances, but due to the continuous emission.
With respect to the microbial growth inhibition tests, the relation between the Minimum Inhibitory Concentration (MIC) in agar, and the desired level of protection in water, is unclear. Firstly, the MIC is the lowest concentration that completely inhibits the growth and this value contains no information on the dose-response curve. Secondly, complete inhibition may occur at a very different concentration in water than in agar. The bioavailability in agar
2
plates during MIC studies can be much lower, since growth media contain a higher amount of organic compounds and complexing agents than most porewater (Van Dijck and Van de Voorde, 1976; Lunestad and Goksøyr, 1990; Griebler, 2001). Thirdly, species were not identified, so it is unclear if the reported value relates to a bacterium isolated from water-related bacterial communities, or to ascomycetes, moulds or algae. Bacteria communities consist of amongst others gram-negative and gram-positive bacteria, with different sensitivities to contaminants (Rönnpagel et al., 1998). Lack of identification hampers the interpretation of the results.
With respect to the activated sludge respiration inhibition test it should be noted that the test is designed to detect a community level response to a relative straightforward and redundant function of the bacterial community: substrate respiration. Considering the functioning of sewage water treatment plants, this endpoint is very relevant. At the same time it is less discriminative towards the desired protection of freshwater bacterial communities, which is not entirely based on removal of biological oxygen demand.
Also the anticipated mode of action of the substances of interest is to be observed in connection to the effect models employed. For example, substances with a high specificity for (certain) insects should be represented not just by invertebrate crustaceans and fish, but also by aquatic insects. If a specific mode of action is known, this information adds to the interpretation of the relevance of the available data. Missing data on demonstrably insensitive species are not a drawback in those cases. However, the results for these substances do not imply that other substances, targeting other receptors, will not be more potent. Still, the validity of the whole dataset with respect to trigger setting will be discussed separately below.
2.2 Data selection
The data set used for the derivation of the trigger value consists of 199 tests on eight taxonomic/trophic groups with 76 substances (Table 1). The test results originally presented include both acute E(L)C50 values (concentrations that cause (lethal) response in 50% of the individuals, or induce a 50% change in a parameter like growth or mobility) and acute NOEC values (no observed effect concentrations) derived from the same acute test, giving in total 276 ‘results’. The substances were not tagged by their mode of action and were further treated indifferently. The lowest value was selected without argumentation on the use of, or refraining from, assessment factors.
• There are 14 substances with only one endpoint; nine on bacteria, five on Daphnia. • Forty-eight substances have been tested on 126 endpoints covering six
taxonomic/trophic groups. Excluding the bacteria, for each substance at most two taxa have been tested.
• Two substances have been tested with species representing four trophic levels: bacteria, daphnids, fish and worms in the former case, and bacteria, daphnids, amphipods and worms in the latter case.
• Three substances, including two antibiotics, were tested on algae, daphnids and fish, but notably not on bacteria.
Only a small group of substances had been tested with a representative range of organisms consisting of at least algae, daphnids, and fish, next to bacteria. Including nicotine, an undisputed neurotoxin, only 9 out of 76 substances can be considered relatively well
characterised with 50 endpoints. However, the only chronic data (algae excluded) are available for nicotine, for which a chronic crustacean LOEC (lowest observed effect concentrations) is available. The reliable and comprehensive information provided in the original data set is presented in Table 2
.
The data for ioprimide are excluded, since this inert substance caused no effects in the tests. For sake of clarity, the test results of nicotine on snails and midges are omitted, since the results for the daphnids are the most critical.Still, the general validity of such a small set of data may easily be refuted if new information is generated. Alternative data on drug substances available in public literature had not been included. A critical evaluation of the sensitivity of the selected effect models had not been attempted. The nature of the compounds compared to the possible range of compounds had not been debated. New data may provide information to lower the trigger without changing the original assessment approach. The CSTEE opinion on the draft EMEA Guideline mentioned before considered the proposed number of the aquatic trigger to be scientifically invalid, because examples of pharmaceuticals were already available that showed higher toxicity (thus lower endpoint values) that used in the FDA dataset (CSTEE, 2001).
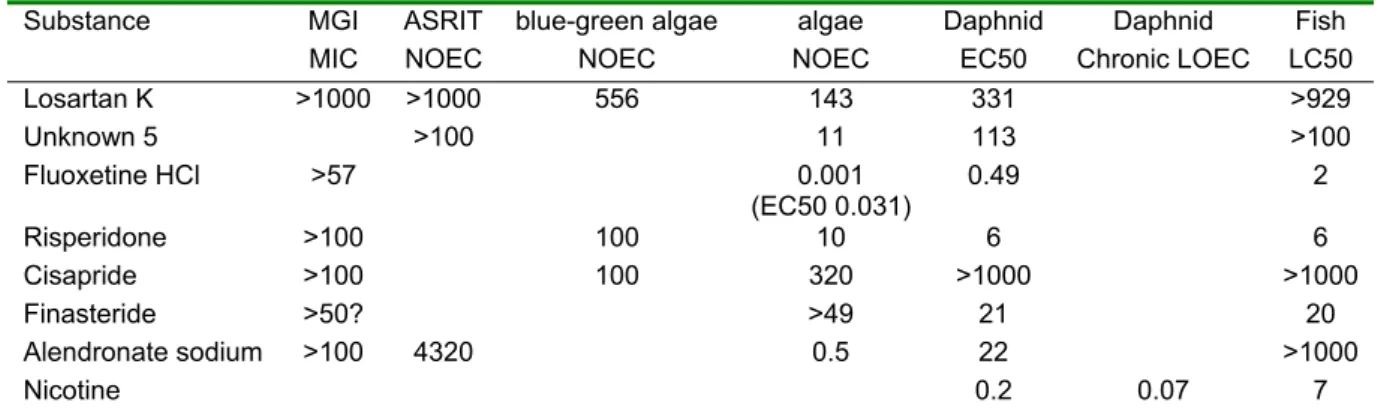
Table 2. Condensed presentation of the the FDA dataset in Table 1: the substances tested on (at least) bacteria, algae, daphnids and fish. All results in mg/L.
Substance MGI ASRIT blue-green algae algae Daphnid Daphnid Fish
MIC NOEC NOEC NOEC EC50 Chronic LOEC LC50
Losartan K >1000 >1000 556 143 331 >929 Unknown 5 >100 11 113 >100 Fluoxetine HCl >57 0.001 (EC50 0.031) 0.49 2 Risperidone >100 100 10 6 6 Cisapride >100 100 320 >1000 >1000 Finasteride >50? >49 21 20 Alendronate sodium >100 4320 0.5 22 >1000 Nicotine 0.2 0.07 7
MGI = microbial growth inhibition; ASRIT = activated sludge respiration inhibition test
2.3 Aquatic effect assessment
For the aquatic environment, a Predicted No Effect Concentration (PNEC) can be derived that, if not exceeded, ensures an overall protection of the environment (EC, 2003). Certain assumptions are made concerning the aquatic environment which allow an extrapolation to be made from single-species short-term toxicity data to ecosystem effects. It is assumed that:
• ecosystem sensitivity depends on the most sensitive species, and • protecting ecosystem structure protects community function.
These two assumptions have important consequences. By establishing which species is the most sensitive to the toxic effects of a chemical in the laboratory, extrapolation can subsequently be based on the data from that species. Furthermore, the functioning of any ecosystem in which that species exists is protected provided the structure is not sufficiently distorted as to cause an imbalance. It is generally accepted that protection of the most sensitive species should protect structure, and hence function. For most substances, the pool
of data from which to predict ecosystem effects is very limited as, in general, only short-term toxicity data are available. In these circumstances, it is recognised that, while not having a strong scientific validity, empirically derived assessment factors must be used. In applying such factors, the intention is to predict a concentration below which an unacceptable effect will most likely not occur. It is not intended to be a level below which the chemical is considered to be safe. However, again, it is likely that an unacceptable effect will not occur. In establishing the size of these assessment factors, a number of uncertainties must be addressed to extrapolate from single-species laboratory data to a multi-species ecosystem. These areas have been adequately discussed in the TGD (EC, 2003), and may best be summarised under the following headings:
• intra- and inter-laboratory variation of toxicity data; • intra- and inter-species variations (biological variance); • short-term to long-term toxicity extrapolation;
• laboratory data to field impact extrapolation (additive, synergistic and antagonistic effects from the presence of other substances may also play a role here).
The size of the assessment factor depends on the confidence with which a PNECwater can be derived from the available data. This confidence increases if data are available on the toxicity to organisms at a number of trophic levels, taxonomic groups and with lifestyles representing various feeding strategies. Thus lower assessment factors can be used with larger and more relevant datasets than the base-set data (Table 3). If a large data set from long-term tests for different taxonomic groups is available statistical extrapolation methods may be used to derive a PNEC (EC, 2003).
The algal growth inhibition test of the base-set is, in principle, a multigeneration test. However, for the purposes of applying the appropriate assessment factors, the EC50 is treated as a short-term toxicity value. The NOEC from this test may be used as an additional NOEC when other long-term data are available. In general, an algal NOEC should not be used unsupported by long-term NOECs of species of other trophic levels. However, if the short-term algal toxicity test is the most sensitive of the short-short-term tests, the NOEC from this test should be supported by the result of a test on a second species of algae. Micro organisms, representing a further trophic level may only be used if non-adapted pure cultures were tested. The investigations with bacteria (e.g. growth tests) are regarded as short-term tests. Additionally, blue-green algae should be counted among the primary producers due to their autotrophic nutrition (EC, 2003).
The reliable and comprehensive information provided in the original data set is presented in Table 2
.
This table contains the lowest data available in the whole FDA dataset. Using the effect assessment approach as consolidated in the Technical Guidance Documents for new and existing substances and biocides in the EU (EC, 2003), the lowest PNEC would be for fluoxetine HCl at 0.031/1000 = 0.031 µg/L (note that the lowest value is for algae and that fluoxetine is a serotonin uptake inhibitor).Table 3. EU TGD table 16 on assessment factors to derive a PNEC from a small dataset. Footnotes in the table have not been copied here.
2.4 Extending data selections
Some data on pharmaceuticals are (and were) readily available. The EC50 for ivermectin on
Daphnia magna is 25 ng/L (Halley et al., 1989). Webb (2001) reports a previously published
NOEC for ethynil estradiol in fish of 1 ng/L. Fong (1998) found that 20% of male mussels responded with spawning within one hour at a concentration of 0.017 mg/L fluoxetine (0.02 mg/l as fluoxetine HCl), with an acute NOEC at 0.004 mg/L as fluoxetine HCl. When exposed to fluvoxamine, this rate of 20% was found at 0.04 µg/L, with an acute NOEC at 0.004 µg/L.
Considering the microbial growth inhibition tests, data from other publications are available in various antibiotics. The reported MIC values range from 0.03 to 500 mg/L. See Table 4 and Table 8 below for information. A test on growth inhibition of Nitrosomonas europaea yielded EC50 values ranging from 16 µg/l to >100 mg/l; using the pour plate method the EC50 values for four selected antibiotics ranged from 0.002 to 0.460 mg/l (Halling-Sørensen, 2001).
Invertebrates (C. dubia, D. magna and H. azteca) were exposed to atenolol, metoprolol, nadolol and propranolol, and average 48h LC50 values ranged from 0.85-29.8 mg/L. Reproduction of H. azteca after a 27 days exposure was impacted at sublethal levels of propranolol with a NOEC of 0.001 and a LOEC of 0.1 mg/L. C. dubia reproduction NOEC and LOEC were 0.125 and 0.250 mg/L (Huggett et al., 2002). The acute-to-chronic ratios (ACR) for these compounds is at least 850.
ACR were calculated by Webb (2001): clofibrate 1428 in D. magna, etidronic acid 44 in D.
magna; nicotine 43 in D. pulex, and the metabolite salicilic acid 6 in D. magna. The ACR for
endocrine disrupting agents may be orders of magnitude: for diethylstilbestrol and ethnyl estradiol in D. magna 17.6 and 570, but in fish the ACR for ethinyl estradiol is 800,000. These limited data substantiate rather than refute the hypothesis that applying assessment factors on acute data will not be protective for pharmaceuticals. Ferrari et al. (2004) recently reached the same conclusion based on similar data.
This short overview of newer data leads to the following conclusions:
• acute data are not useful for risk assessment or trigger setting of pharmaceuticals; • the pharmacological mode of action in mammals may not be the same in different
environmental receptors;
• examples of lower endpoint values are available, and at least two registered pharmaceuticals have chronic or acute NOEC values at the level of 1 and 4 ng/L, respectively.
Trigger values would have to be set in the range of 1 to 0.04 ng/L depending on the evaluation of the specificity and conclusiveness of the available data. However, this level of detail is not further investigated at this stage.
2.5 The position of the trigger in the risk assessment framework
Does the context of the risk assessment framework call for further considerations of the applicability of the water trigger value? It is important to note that the water trigger decides on the further assessment of the risk to soil, surface water, sediment, and also groundwater. The environmental compartments soil, water, groundwater, air, and sediment are connected and substances may be transported between compartments. The trigger value in water should protect sediment and soil as well. Thus, next to the applicability of the range of test systems vis-à-vis the aquatic ecosystem, exposure and protection of the sediment and soil compartment should be considered.
In the event the exposure of the water phase and sediment phase are treated separately in the exposure assessment, it may be worthwhile to consider the effects on the sediment phase, using sediment spiked test systems. For example, early first instar larvae of Chironomus sp. are predominantly planktonic and generally confined to the surface layer, but only in contrast to the three later instar larvae that live in deeper sediment and feed on sediment particles). Therefore, it maybe reasonable to assess exposure of this particular first instar organism on the basis of initial concentrations in the water column. For real sediment-dwelling organisms, however, the exposure situation is more complicated as also noted by Streloke and Köpp (1995). They state that for persistent substances with high adsorptive potential, exposure and effects depend on the logKow value of the substances, on one hand and, on the feeding behaviour of the benthic organisms on the other hand. The OPPTS (Office of Prevention Pesticides and Toxic Substances, U.S. EPA) has drafted general criteria that trigger sediment testing, that take into account the environmental chemistry and the toxicity properties of the pesticides as follows: solubility ≤ 0.1 mg/L, Koc > 50,000 L/kg, Kd ≥ 1000, DT50 ≥ 10 days, or the concentration in the pore water is equivalent to concentrations known to be toxic in the water column (ECOFRAM, 1999). For those substances where these triggers apply, the information derived from water spiked test systems (commonly without sediments) is useless. A surface water trigger thus cannot function as a prioritisation tool for sediment risk. The same argument is valid for soil and the terrestrial ecosystem.
3 The soil concentration trigger value
The soil concentration trigger value was based on a retrospective review of ecotoxicity data submitted to the US FDA from 1973 to 1997 (Table 4). Concepts and methods developed in ecotoxicology, environmental chemistry and risk assessment were introduced and applied to data which lead to the recommendation that the lowest toxicity value (100 µg/kg) in the available dataset should provide an acceptable measure of safety to protect the environment (AHI, 1997).
Table 4. Tabulation of the Lowest Environmental Assessment Endpoints from Environmental Assessment Reports Submitted to the US FDA/CVM from 1973 to 1997 (AHI, 1997). Units were originally presented as ppb.
Name of Drug Molar mass Class of Drug Earthworm
NOEC (ppb) Microbe MIC (agar) or NOEC (soil) (ppb) Plant NOEC (ppb) PNEC** (ppb) Sarafloxacin 385 Antibacterial 1,000,000 30 1,300 3
Sarafloxacin 385 Antibacterial 300,000 with
sediments Tilmicosin 869 Antibacterial 918,000 100,000 1000 Ceftiofur 546 Antibacterial 250 2.5 Florfenicol 358 Antibacterial 400 4 Pirlimycin 465 Antibacterial 1,000,000 130 400 13 Lincomycin 461 Antibacterial 1,000,000 780 7.8 Tiamulin 610 Antibacterial 500,000 5000 Apramycin 785 Antibacterial 100,000 100 160,000 10 Semduramicin 894 Anticoccidial 100,000 310 3.1 Maduramicin 934 Anticoccidial 250 100 1 Halofuginone 496 Anticoccidial 200,000 24,000 240 Salinomycin 773 Anticoccidial, Perf.enhancer 780 400 4 Narasin 765 Anticoccidial 500 100 150 10 Oxfendazole 315 Antiparasitic 971,000 9,000 900 90 Fenbendazole 299 Antiparasitic 56,000 1,000,000 36,000 3600 Ivermectin 861 Antiparasitic 12,000 560 5.6 Doramectin 899 Antiparasitic 2,000 40,000 1,600 160 Eprinomectin 913 Anthelmintic 295,000 1,000,000 2950 Clorsulon 381 Antiparasitic 2,000 20 Efrotomycin 1145 Perf.enhancer 1,000,000 20,000 400 40 Morantel 370 Perf.enhancer 50,000 500 Virginiamycin 535-823 Perf.enhancer 10,000 100 Lasalocid 613 Perf.enhancer 200 2,000 2 Monensin 693 Perf.enhancer 10,000 150 1.5 Laidlomycin 792 Perf.enhancer 400 160 1.6 Bacitracin 1421 Perf.enhancer 10,000 100 Melengestrol Acetate 397 Perf.enhancer 1,800 2,000 18 DrugA 1000* Anticoccidial 900,000 10,000 10,000 1000 DrugB 1000* Antibacterial 1,000 130 1.3 DrugC 1000* Perf.enhancer 8,110 64,000 7,500 750 * estimate
** calculated in this report only, based on assessment factors according to (EC, 2003) and accepting the MIC as a relevant value. Values in bold were used for the derivation of the PNEC.
3.1 Reflection of the ecosystem
The degree to which the data set represents the ecosystem is an important issue that may influence the outcome of the trigger assessment to a great extent. The relative importance of autotrophic and heterotrophic species, detrivores, producers, and predators should be reflected in the dataset. However, the studies reported focus on endpoints that are not the most sensitive regarding population growth: chronic effects on micro-organisms, but mostly tested in agar; sub-acute effects on Oligochaeta (Eisenia sp.) in artificial soil, but not on reproduction; and long-term effects on plants, tested in quartz sand (Table 4).
With respect to the micro organisms, the relation between the Minimum Inhibitory Concentration (MIC) in agar, and the desired level of protection in soil, is unclear. Firstly, the MIC is the lowest concentration that completely inhibits the growth and this value contains no information on the dose-response curve. Secondly, complete inhibition may occur at a very different concentration in soil than in agar. The bioavailability in agar plates during MIC studies can be much lower than in soils, since growth media contain a higher amount of organic compounds and complexing agents than most pore water (Van Dijck and Van de Voorde, 1976; Lunestad and Goksøyr, 1990; Griebler, 2001). Thirdly, species were not identified in Table 4, so it is unclear if the lowest value relates to a bacterium isolated from soil-related bacterial communities, or to ascomycetes, moulds or algae, as explained in AHI (1997). Soil bacteria communities consist of a/o. gram-negative and gram-positive bacteria, with different sensitivities to contaminants (Rönnpagel et al., 1998). Fourthly, there are indications that the nitrifying organisms that can be cultured may not be representative of natural populations. Studies using 16S rDNA profiles have shown that Nitrosomonas
europaea, which is readily isolated from most soils by classical methods, is not dominant
before enrichment due to the high NH4+ concentration classically used to isolate nitrifying bacteria (Hiorns et al., 1995). This does not compromise the suitability of N. europaea as a model species, but does emphasise the gap between effect model results and impacts on ecosystem functioning in the field.
The acute toxicity testing on earthworms did not take reproduction into account. The consequences can be illustrated with the data on Oramec R (0.08% ivermectin w/v) on earthworms (Gunn and Sadd, 1994). An EC50 (acute) of 15.8 mg/kg was accompanied by a
NOEC at 2 mg/kg because 27% reduction in fecundity (note that the hatching of the cocoons was not investigated), found in the next lower dose, was statistically not significant. This result is not satisfying and with log-logistic regression analysis, the EC10 would be 0.5 mg/kg,
30 times below the EC50 based on acute effects (Laskowski, 1995; Van der Hoeven et al.,
1997). The assessment based on acute data would be underprotective for fecundity, because the assessment factors (AF) on acute and reproduction endpoints differ only a factor of 10 (EC, 2003).
Plants are tested on germination and growth, which can be considered as relevant endpoints
provided they were determined in soil. Phytotoxicity of antibiotics differs between species (Jjemba, 2002). However, it is unclear what species of monocotyles and/or dicotyles were tested and whether leguminose species were included.
Effects of antibiotics in soil on worms or on insects are not expected at the low levels already toxic to bacteria. Effects on soil-dwelling Collembola and Enchytraeids, on the leaf-dwelling
found in the range of 70-500 mg/kg substrate (soil or artificial food). The effects were probably due to interference with gut microflora (Bass and Barnes, 1969; Baguer et al., 2000; Arijs et al., 2002; Jensen et al., 2003). Toxicity of anthelmintics and antiparasitics on these groups might be quite the opposite.
In conclusion, the terrestrial ecosystem was not investigated in great detail, both with respect to the representation of test species and with respect to the selection of testing conditions and endpoints.
3.2 Data selection
The data set used for the trigger value presented in Table 4 consists of 64 test results on three taxonomic/trophic groups with 30 substances: three are anonymous (anticoccidial, antibacterial, and a performance enhancer), one hormone, 18 antibiotics/coccidiostats, three anthelmintics, three anthelmintics/antiparasitics, and one antiparasitic.
For ten substances data are presented on three taxonomic/trophic groups; for seven substances one value is available. The reliable and comprehensive information provided in the original data set is presented in Table 5. The general validity of such a small set of data may easily be refuted if new information is generated.
Alternative data on drug substances available in public literature have not been included. A critical evaluation of the sensitivity of the selected effect models has not been attempted. Not all information that was available was presented, since only the lowest of the available endpoints were listed, and species names and test conditions were not identified. This may hamper further interpretation of the results.
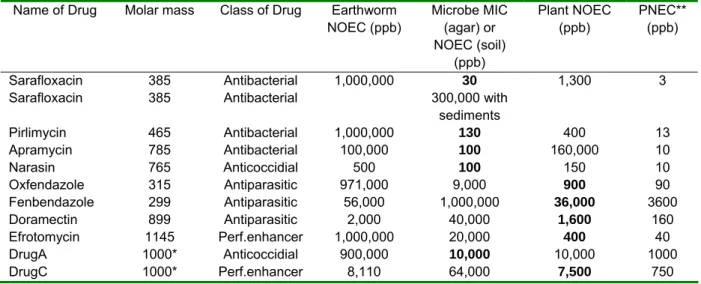
Table 5. Condensed presentation of the AHI dataset in Table 4: the 10 substances tested on bacteria, earthworms and plants.
Name of Drug Molar mass Class of Drug Earthworm
NOEC (ppb) Microbe MIC (agar) or NOEC (soil) (ppb) Plant NOEC (ppb) PNEC** (ppb) Sarafloxacin 385 Antibacterial 1,000,000 30 1,300 3
Sarafloxacin 385 Antibacterial 300,000 with
sediments Pirlimycin 465 Antibacterial 1,000,000 130 400 13 Apramycin 785 Antibacterial 100,000 100 160,000 10 Narasin 765 Anticoccidial 500 100 150 10 Oxfendazole 315 Antiparasitic 971,000 9,000 900 90 Fenbendazole 299 Antiparasitic 56,000 1,000,000 36,000 3600 Doramectin 899 Antiparasitic 2,000 40,000 1,600 160 Efrotomycin 1145 Perf.enhancer 1,000,000 20,000 400 40 DrugA 1000* Anticoccidial 900,000 10,000 10,000 1000 DrugC 1000* Perf.enhancer 8,110 64,000 7,500 750 * estimate
** calculated in this report only, based on assessment factors according to (EC, 2003) and accepting the MIC as a relevant value. Values in bold were used for the derivation of the PNEC.
3.3 Terrestrial effect assessment: a critical appraisal
Three arguments were presented in the original assessment to justify the redundancy of assessment factors: the (low) bio-availability of substances in the presence of soil; the functional redundancy of microbes in soil; and the influence of degradation in soil (AHI, 1997). These arguments will be discussed to a greater extent below.
3.3.1 Bioavailability in soil
It was stated in the original assessment that due to sorption of the substances to soil matrix the availability will be reduced and thus the toxicity would be reduced compared to tests performed in quartz sand or agar. Binding of complex molecules to soil depends on many factors, thus the partitioning of medicines cannot be generalised, although soil toxicity of several organic pollutants to earthworms has been correlated to pore water concentrations (Van Gestel and Ma, 1990; Tolls, 2001). An effect like mutagenesis is not necessarily diminished by sorption and, even though the contribution of this particular effect to reproduction and population growth rate is limited, it indicates that sorption and bioavailability are not mutual exclusive phenomena (Würgler and Kramers, 1992; Fretwurst and Ahlf, 1996). The argumentation on bioavailability provided in the original assessment is not used in a proper way to eliminate an assessment factor (AF). The AF intends to cover the uncertainty in the sensitivity of species, endpoints and exposure times, not the uncertainty in exposure concentrations. The latter uncertainty should be accounted for in the harmonisation between exposure calculations and effect assessment. The example of sarafloxacin in the original assessment is used here to demonstrate the effect of sorption. The EU-approach is followed as a model for calculation of concentrations in pore water (EC, 2003). The pore water concentration, representing the available fraction, depends on the concentration in the soil and the capacity of the substance to adsorb to the organic material in the soil.
1000
⋅
⋅
=
−water soilK
RHOsoil
PECsoil
er
PECporewat
RHOsolid
Koc
Foc
Fsolid
Fwater
K
Fair
K
soil−water=
soil⋅
air−water+
soil+
soil⋅
soil⋅
⋅
1000
Default settings and input parameters for this model are explained in Table 6. The reported logKoc of sarafloxacin amounts to 6 L/kg. This sorption coefficient is in agreement with logKoc reported for related fluoroquinolones (Nowara et al., 1997). Assuming that no sarafloxacin partitions into air (Fairsoil*Kair-water = 0), Ksoil-water equals 30000 and the relation
between soil and porewater is described by:
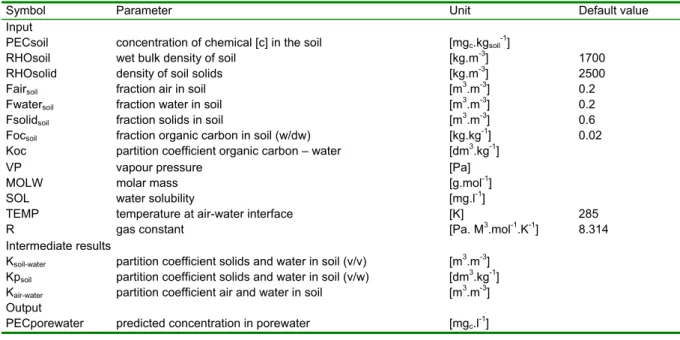
Table 6. Input and output parameters for the equilibrium partitioning model.
Symbol Parameter Unit Default value
Input
PECsoil concentration of chemical [c] in the soil [mgc.kgsoil-1]
RHOsoil wet bulk density of soil [kg.m-3] 1700
RHOsolid density of soil solids [kg.m-3] 2500
Fairsoil fraction air in soil [m3.m-3] 0.2
Fwatersoil fraction water in soil [m3.m-3] 0.2
Fsolidsoil fraction solids in soil [m3.m-3] 0.6
Focsoil fraction organic carbon in soil (w/dw) [kg.kg-1] 0.02
Koc partition coefficient organic carbon – water [dm3.kg-1]
VP vapour pressure [Pa]
MOLW molar mass [g.mol-1]
SOL water solubility [mg.l-1]
TEMP temperature at air-water interface [K] 285
R gas constant [Pa. M3.mol-1.K-1] 8.314
Intermediate results
Ksoil-water partition coefficient solids and water in soil (v/v) [m3.m-3]
Kpsoil partition coefficient solids and water in soil (v/w) [dm3.kg-1]
Kair-water partition coefficient air and water in soil [m3.m-3]
Output
PECporewater predicted concentration in porewater [mgc.l-1]
The reported MICagar was 30 µg/L. If the concentration in porewater equals 30 µg/L, MICsoil
equals 530 mg/kg. In the original assessment no attention was paid to the differences in volume fractions of solids, air, water, or binding places in soil compared to agar. The reported MICagar was 30 µg/L, the reported NOECsoil (with unknown organic carbon content) was 300
mg/kg, and here the newly calculated MICsoil equals 530 mg/kg. Taking into account that a
MIC is expected at higher concentrations than the NOEC, and that most soil bacteria are not freely dispersed but associated with particulate matter, just like the compound, the difference between the agar result and soil result is not inconsistent with the partitioning theory (Griebler, 2001). the result of MIC 30 µg/L in agar is not refuted by the test result with soil, and this MIC value remains the lowest representative endpoint in agar.
One can also assume that compounds that are hydrophilic (weak adsorption), are concentrated in the pore water and may thus be able to exert toxic effects at lower soil concentrations. A discussion on the implications of this argument for highly water-soluble compounds will be continued below.
3.3.2 Functional redundancy
The ecological concept of functional redundancy was brought forward in the original assessment. This concept states that the loss of a few vulnerable species will not affect system functionality (quoted from Van Straalen and Van Gestel (1993)). This concept was used as an argument for omitting an assessment factor. However, a different reasoning is given elsewhere: though redundant species may not have to be protected, safety factors to extrapolate from tested species to more sensitive – yet not redundant – species are still required (Forbes and Calow, 2002). There are arguments against this application of the concept of functional redundancy:
• Not all microbes in soil are part of the same system: nitrifiers will not replace nitrogen fixers.
• Once redundant species are gone, the system remains more vulnerable to future impacts.
• Each species has its own function in the ecosystem and the replacement of microbial species by more resistant ones may have severe ecological consequences (Van Beelen and Doelman, 1997; Van Beelen and Fleuren-Kemilä, 1999).
The original assessment contained predominantly single strain tests. Although it was argued that some species may be lost, the assessment did not indicate how many species exactly would not be protected due to the fact that a safety factor was not applied. This emphasises the insuperability of assessing soil community functionality with endpoints for single strains, a problem that was also addressed in the quoted literature source of Van Straalen and Van Gestel (1993).
3.3.3 Mitigation by degradation
Degradation in soil is presented in the original assessment as a factor that will reduce the effects in soil (AHI, 1997). This is undoubtedly true for some substances and climatic conditions, but offers no reason to abandon assessment factors. Firstly, if the test substance degraded in the test system, this is reflected upon in the endpoint value. Secondly, an effect that is caused by the initial concentration in the test system may very well become apparent in the field as well. Thirdly, one uncertainty in the exposure-effect relationship in the field is the time-to-effect. Dissipation in the test system may be faster than in the field, which may give rise to an under protective assessment. However, these considerations should be addressed, rather than obscured, in the effect assessment.
Other uncertainties in the exposure-effect relationship in the field were not considered, such as the fact that degradation may also generate metabolites that need to be assessed separately for fate and effects. Also the other side of the medal, persistency, was not addressed. Substances may be very recalcitrant to degradation and give rise to long-term exposure and effects in other compartments, or trophic levels, than covered in the test systems.
3.3.4 Conclusions on the safety factors
It is common practice to use assessment factors on collections of endpoint values to derive predicted no effect concentrations (PNEC) (CSTEE, 2000; Crommentuijn et al., 2000; EC, 2003). The argumentation on the reduced availability due to sorption and degradation was substantiated only with examples that were representative for the argument. The exact exposure-effect relationships between agar and soil remain unsettled taking into account that most microbes in soil and sub-soil are associated with particles and are not dispersed in the pore water and that bio-availability in agar and nutrient broth may also be limited. The argumentation on the functional redundancy of micro organisms does not overcome the problems of assessing soil community functionality with endpoints for single strains.
If we accept the MIC in agar as a NOEC, proper use of assessment factors would result in a PNEC of 1 µg/kg (see Table 1). This PNEC would serve only for the terrestrial ecosystem and only for the substances within the dataset.
3.4 The position in the risk assessment framework
Does the context of the risk assessment framework call for further considerations of the applicability of the soil trigger value? Standardisation to the conditions specified for the risk model, differentiation between emission routes, and harmonisation between environmental compartments are considered here.
3.4.1 Standardisation to risk model conditions
The reference dataset yielded a threshold value derived from a specific effect study. The study conditions may very well be different from the generic conditions within the risk model or the specific conditions in the field. For example, in agricultural soils with moderate organic matter contents (0.7-4.1% o.c.) the substances will be more available than e.g. in artificial soil for earthworms testing, containing typically 10% organic matter, equivalent to approximately 6% o.c.) (FOCUS, 2001). Within the frameworks of pesticide registration and quality standard setting, toxicity results are corrected based on the organic carbon and clay content, provided the substance is hydrophobic (logKow >2) (Crommentuijn et al., 2000). Such standardisation cannot be performed with the data in Table 4, because the matrix properties are not given.
3.4.2 Differentiation between routes of emission
In the original assessment it was acknowledged that the dataset, containing plants, earthworms and microbes, does neither represent all mode of actions nor all species. It was therefore recommended that ‘ecto- and/or endoparasiticides used in pasture should advance directly to Phase II to address specific areas of concern, e.g. dung fauna’ (VICH, 2000). The original assessment already considered the fact that different routes of emission, in combination with the anticipated nature of the substances, called for a differentiation in the use of the trigger. The assessment of the risk caused by emission through dung in pastures should not be triggered by a soil concentration trigger.
Nevertheless, the same parasiticides, hormones, and other compounds that were not well represented in the dataset (Table 1), but are also are administered to stabled animals (not on pasture), will be subjected to the trigger. Although the nature of the trigger connects to the emission route, the information on relevant substances within the dataset was considered insufficient. Since this was the main argument to exclude parasiticides from the trigger, it also holds for these substances when spread with slurry.
Table 7. Properties and Environmental Quality Standards (EQS) of some substances used as pesticides and as veterinary medicines (Crommentuijn et al., 2000).
Substance LogKoc Lowest soil NOEC in µg/kg
Species EQS soil (normalised to 10% o.m. and 25% clay) in µg/kg
Dichlorvos 1.83 75000 Lampito mauritii 0.0028*
Cypermethrin 4.87 - - 0.39*
Diazinon 2.64 350 Folsomia candida 6.2
3.4.3 Harmonisation between compartments
It is important to note that the soil trigger decides on the further assessment of the risk to soil, surface water, and also groundwater. The environmental compartments soil, water, air, and sediment are connected and substances may be transported between compartments. Several veterinary substances are used as pesticides as well, for which in European legislation standards have been set to water, groundwater and drinking water contamination (Anonymous, 1976; Anonymous, 1979; Anonymous, 1998; Anonymous, 2000a). The Netherlands Health Council advised the Ministers to treat medicines in a way comparable to ‘pesticides and biocides’ because they are pharmacologically active, are spread continuously, and little is known on their effects (Health Council, 2001). This scientific opinion sides veterinary medicines with ‘pesticides’ and ‘biocides’ in the environmental legislation. A soil trigger that is not harmonised might result in violation of these water quality standards. The trigger value in soil should thus protect water and sediment as well. Residues in soil may be transported to surface water through equilibrium partitioning to pore water, followed by drainage. The equilibrium-partitioning method has been applied to harmonise environmental quality standards (Crommentuijn et al., 2000; EC, 2003). The examples in Table 7 illustrate that a safe level in soil does not necessarily protect surface water or groundwater.
3.5 Conclusions on the scientific evaluation of the dataset
The conclusion of this section is that the potential of the scientific tools to assess the data has not been exhausted and the argumentation to discard assessment factors did not come up to the mark. The selection of species and test endpoints for establishing a trigger value was not optimal. A further correction of the reference data before the assessment, together with a harmonisation between terrestrial and aquatic compartments, based on agreements on boundary conditions within the risk model, was required.
3.6 Extending data selections and interpretations
Several tools from ecotoxicology, environmental chemistry and risk assessment can be used to improve the underpinning of a trigger value: partitioning calculations, statistical analysis of all data, additional hazard identification, and harmonisation between compartments. These tools are examined below.
3.6.1 Data selection
New data provide information to lower the trigger without changing the original assessment approach. Here two literature sources are given.
Twenty substances were tested on effect against Vibrio fischeri. The EC90 values, that can be considered indicative of the MIC, ranged from 30 µg/l to 388 mg/L. The EC10 values, indicative of the NOEC, ranged from 4 µg/l to 90 mg/l (Backhaus and Grimme, 1999). In
another research, eleven substances were tested on growth inhibition of sludge bacteria, both in a batch system and in a pour-plate system, where individual cells are exposed. EC50 values ranged from 100 µg/l to >100 mg/L in the batch test, but from 28 µg/l to 449 mg/l in the pour-plate method. A test on growth inhibition of Nitrosomonas europaea yielded EC50 values ranging from 16 µg/l to >100 mg/l; using the pour plate method the EC50 values for four selected compounds ranged from 2 to 460 µg/l (Halling-Sørensen, 2001).
These data provide the following ‘critical values’: for a single strain (V. fischeri) the EC90 was 30 µg/l, the corresponding EC10 was 4 µg/l (ofloxacin). The lowest EC50 was 2 µg/l (chlortetracycline on N. europaea pour plate method). For a community process the lowest EC50 value was 28 µg/l (chlortetracycline pour plate method). These last two results were obtained from a pour-plate method with low microbial density. Low seeding densities are regarded to yield sensitive indicators of in situ effects. For the protection of the gastro-intestinal micro flora, the Joint Expert Committee on Food Additives (JECFA) selects not just the lowest MIC, but selects MIC values from all relevant sensitive species, and corrects test endpoint values for the higher microbial density in the gut (AHI, 1997). For the soil system, the desired level of protection in soil should guide the selection of species and assessment factors and it is not straightforward to downsize effects in order to correct for hypothetical different microbial densities in soil. Potentially, the trigger can be based on the results of 30, 28, 16, 4, or 2 µg/L, depending on the preference for a given community process, a particular single species, a certain inoculum density, or specific endpoint.
3.6.2 Partitioning calculations
The concept of partitioning has been addressed above for effects on microbes mediated through agar or soil. For a substance with low partitioning to organic matter, the MICsoil will
actually be much lower than for a hydrophobic substance. Thus, what would be the result if the endpoint in agar for the hydrophobic compound was also to protect the soil for a potential hydrophilic substance? This is demonstrated here with the example of a hydrophilic substance (metronidazole) and the lowest MIC-value of 30 µg/L established for sarafloxacin (molar mass 385 g/mol) in Table 4. Both the partitioning in the soil system, aiming at effective concentrations in the water phase, and the influence of differences in molar mass are accounted for in this example.
Based on molar equivalents, this lowest MIC in agar amounts to 30/385 = 0.078 µmol/L. The substance metronidazole has a molar mass (M) of 171 g/mol and a sorption coefficient Koc of 40 L/kg (Rabølle and Spliid, 2000). For this substance the threshold would be 11 µg/kg soil dw, based on effective concentrations in the pore water calculated with the formulas in section 3.3.1. This value is (expectedly) much lower than both the predicted and validated values (530 and 300 mg/kg soil) for sarafloxacin, and is below the proposed trigger as well.
This partitioning approach can also be applied to a small hypothetical molecule with a Koc equal to 0 L/kg. For this completely dissolved substance the trigger would be 0.01 mmol/kg. Would this worst-case hydrophilic behaviour apply to a small molecule with M = 100 g/mol, the trigger equals 1 µg/kg; in case of the highest molar mass in Table 1 of 1457 g/mol, the result is 15 µg/kg.
If we accept the value of 2 µg/l as determined by Halling-Sørensen (2001) as the reference for the trigger, instead of the MIC of 30 µg/L for sarafloxacin, the result would be approximately an order of magnitude lower. In conclusion, following the line of reasoning on the influence
of sorption, introduced in the original assessment, the trigger value should be between 0.1 and 1 µg/kg soil.
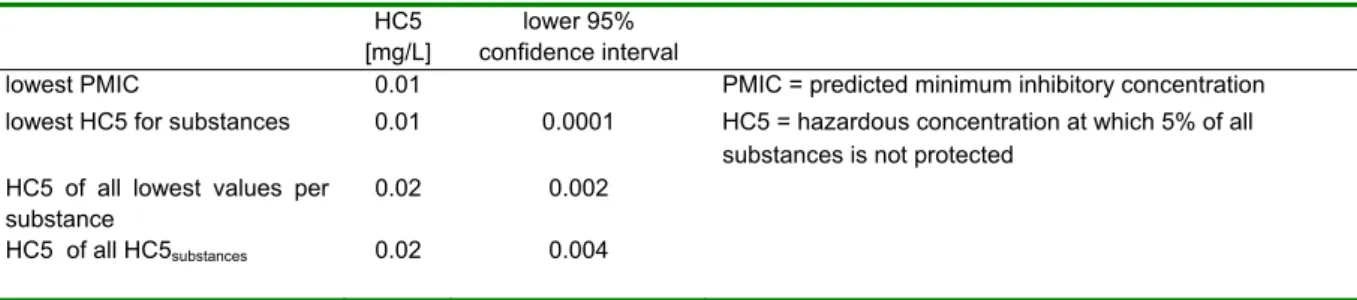
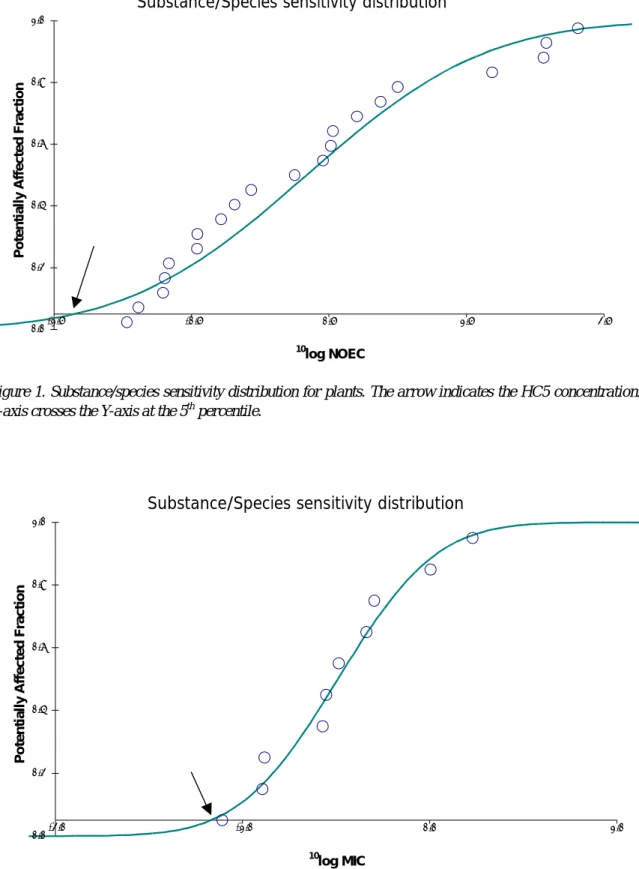
3.6.3 Statistical analysis
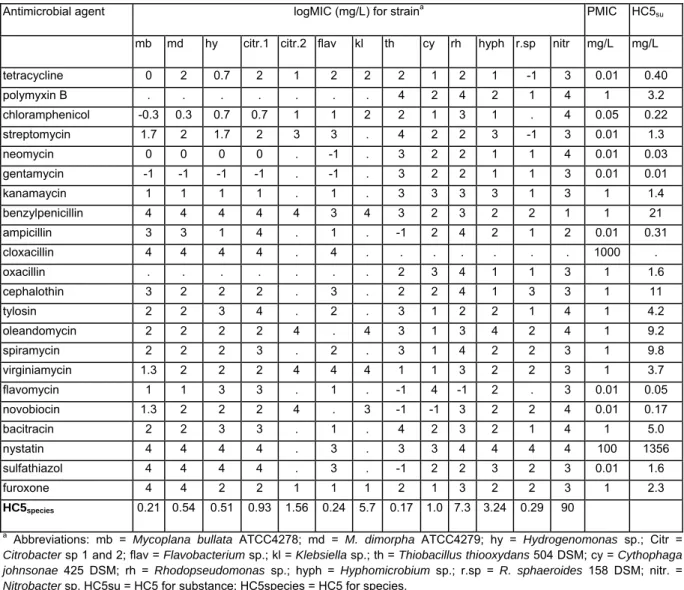
A collection of data can statistically be assessed to generate information on its distribution. This distribution reveals the potentially affected fraction of species at a given exposure concentration. One could assume that the data of interest are representative of a (log-)normal distribution. If all endpoints for all species had been listed, the distribution could be fitted on the data resulting in a threshold value at a chosen level (e.g. 5th percentile) with a chosen confidence level (e.g. 95%) (Aldenberg and Jaworska, 2000). This technique is widely applied in standard setting and risk assessment (Van Beelen and Doelman, 1997; Posthuma et al., 2002). This Species Sensitivity Distribution (SSD) approach will be examined with the assumption that all substances that are present in the dataset have a similar distribution of effects. However, the dataset in Table 1 presumably does not show all available test results, Table 8. Sensitivity of environmental micro-organisms to antimicrobial agents (Van Dijck and Van de Voorde, 1976). All results >1000 mg/L are transformed to logMIC = 4 and all results <1 mg/L are transferred to logMIC = –1. PMIC and HC5 are not log-transformed.
Antimicrobial agent logMIC (mg/L) for straina PMIC HC5
su
mb md hy citr.1 citr.2 flav kl th cy rh hyph r.sp nitr mg/L mg/L
tetracycline 0 2 0.7 2 1 2 2 2 1 2 1 -1 3 0.01 0.40 polymyxin B . . . . . 4 2 4 2 1 4 1 3.2 chloramphenicol -0.3 0.3 0.7 0.7 1 1 2 2 1 3 1 . 4 0.05 0.22 streptomycin 1.7 2 1.7 2 3 3 . 4 2 2 3 -1 3 0.01 1.3 neomycin 0 0 0 0 . -1 . 3 2 2 1 1 4 0.01 0.03 gentamycin -1 -1 -1 -1 . -1 . 3 2 2 1 1 3 0.01 0.01 kanamaycin 1 1 1 1 . 1 . 3 3 3 3 1 3 1 1.4 benzylpenicillin 4 4 4 4 4 3 4 3 2 3 2 2 1 1 21 ampicillin 3 3 1 4 . 1 . -1 2 4 2 1 2 0.01 0.31 cloxacillin 4 4 4 4 . 4 . . . . . 1000 . oxacillin . . . . . 2 3 4 1 1 3 1 1.6 cephalothin 3 2 2 2 . 3 . 2 2 4 1 3 3 1 11 tylosin 2 2 3 4 . 2 . 3 1 2 2 1 4 1 4.2 oleandomycin 2 2 2 2 4 . 4 3 1 3 4 2 4 1 9.2 spiramycin 2 2 2 3 . 2 . 3 1 4 2 2 3 1 9.8 virginiamycin 1.3 2 2 2 4 4 4 1 1 3 2 2 3 1 3.7 flavomycin 1 1 3 3 . 1 . -1 4 -1 2 . 3 0.01 0.05 novobiocin 1.3 2 2 2 4 . 3 -1 -1 3 2 2 4 0.01 0.17 bacitracin 2 2 3 3 . 1 . 4 2 3 2 1 4 1 5.0 nystatin 4 4 4 4 . 3 . 3 3 4 4 4 4 100 1356 sulfathiazol 4 4 4 4 . 3 . -1 2 2 3 2 3 0.01 1.6 furoxone 4 4 2 2 1 1 1 2 1 3 2 2 3 1 2.3 HC5species 0.21 0.54 0.51 0.93 1.56 0.24 5.7 0.17 1.0 7.3 3.24 0.29 90
a Abbreviations: mb = Mycoplana bullata ATCC4278; md = M. dimorpha ATCC4279; hy = Hydrogenomonas sp.; Citr =
Citrobacter sp 1 and 2; flav = Flavobacterium sp.; kl = Klebsiella sp.; th = Thiobacillus thiooxydans 504 DSM; cy = Cythophaga
johnsonae 425 DSM; rh = Rhodopseudomonas sp.; hyph = Hyphomicrobium sp.; r.sp = R. sphaeroides 158 DSM; nitr. =