CFD MODELLING OF BIOMASS
CONVERSION IN AN ANALYTICAL
PYROLYSIS INSTRUMENT
Sander De Wachter
Student number: 01806078
Promotor: Prof. dr. Frederik Ronsse
Tutor: Przemyslaw Maziarka
Master’s Dissertation submitted to Ghent University in partial fulfilment of the requirements for the degree of Master of Science in Bioscience Engineering: Chemistry and Bioprocess Technology
3
Acknowledgements
My deepest appreciation goes to my tutor Maziarka Przemyslaw, who was always available to help me with any question regarding the modelling or writing. He gave me good advice to make the thesis a nice and interesting scientific work. I would also like to thank my promotor Prof Dr. Ir. Ronsse F. to give me the opportunity to work on this subject and for the advice and accompaniment during this master thesis.
Finally, I want to thank my parents for their continuous support throughout my years of study. They have always encouraged me to keep going.
4
Preface
The main subject of this Thesis is the thermochemical conversion of biomass. The subject has high relevance in current times and it is gaining interest, mainly because of global warming and the search for alternatives for fossil fuels. The main focus in the Thesis is put on the investigation of the process of fast pyrolysis of biomass. Among techniques of biomass conversion, the fast pyrolysis process allows for the maximisation of the production of bio-oil – the liquid mixture of compounds. This product has the broadest applicability, therefore it represents the most valuable product from the conversion of biomass. The applications of bio-oil can be found in several areas like direct use as a heat source through combustion, a raw material for gasoline grade fuels for automotive transportation or as a source of chemical compounds which in consequence can serve as sustainable platform chemicals. Despite that the production of bio-oil is already available on the market, there is still a vast area in which the process can be optimised, due to incomplete knowledge about the mechanisms occurring during the formation of bio-oil as well as the lack in detailed, quantitative relationships between the product quality and process parameters. The Thesis presents the investigation of the subject of fast pyrolysis of biomass not by the classical experimental approach, but by the numerical modelling one, which constitutes its novelty in approach to the problem. The modelling is conducted using Computation Fluid Dynamics, which allows not only to obtain the quantitative relations between process parameters and products properties but also can reveal the mechanisms and phenomena that were not possible to be observed in an experimental approach.
Computation Fluid Dynamics modelling found a variety of applications in the industry where engineers use it to perform analyses on, for example, hydrodynamics, aerodynamics or reactor design. The area does not belong to the simplest, because it combines fluid dynamics, mass and heat transfer along with chemical engineering and computer science via higher mathematical descriptions. During the education of Master in bio-engineering sciences, in the Author’s opinion, not enough attention was given to CFD modelling, despite the fact that such skill is and will be valuable on the market after finishing education. Therefore, the use of CFD in this master Thesis’s research allowed me to gain important skills, which definitely will be beneficial in the near future.
5
Preamble corona
The situation related to the corona measures, whose role was to stop the outburst of the pandemic, unfortunately, had an influence on the course of the presented Master Thesis. In general, it needs to be stated that the Thesis is modelling based, therefore the negative impact was not as severe as on the fully experimental investigations. Nevertheless, the corona measures did not allow to conduct all the work that was initially planned, which in consequence led to a not as comprehensive and valuable Thesis as could be obtained without the measures.
The first problem that occurred due to the corona measures was the access to the numerical software in which the construction of the CFD model was conducted. The computer on which the software is installed has to have a connection to the client-server located on the PC within the UGent network. Since the access to the office space was restricted for Master Students, the author lost the possibility to connect to the client-server and continue the work, due to the firewall between network inside and outside UGent. It took almost two weeks to obtain the connection and continue work, which was considered as a significant drawback, especially in the situation that the literature review was finished. The most important, the second problem was the validation of the model with experimental data. Without the validation results obtained from the simulation, the model cannot be assessed in an absolute manner. Therefore any conclusion regarding the model’s reliability as well as its accuracy cannot be made. It is a large disadvantage for the presented Thesis, which could easily be extended with the validation data and consecutive elaboration if not the pandemic outburst and corona measures. It needs to be noted that the Thesis contains some experimental data that was necessary to build the model. It comes from experimental measurements conducted by the co-supervisor of this Thesis after some loosening of the corona measures (permission for the PhD students to enter the laboratories if the work was deemed essential).
Besides these two major problems, a minor problem like the lack of direct contact with the main and co-supervisor also took place, which was to some point related with a reduction in motivation and dynamics of the work. The online meetings after the lockdown were scheduled regularly as well as short discussions, if needed, and to some point these fulfilled the purpose of providing feedback, but still a direct conversation would be much more preferable.
This preamble was drawn up after consultation between the student and the supervisor and is approved by both.
6
Table of content
Acknowledgements ... 3 Preface ... 4 Preamble corona ... 5 1. Chapter: Introduction ... 81.1. General introduction to the subject ... 8
1.2. Research problem ... 8
2. Chapter: Theoretical overview ... 10
2.1. Biomass ... 10 2.1.1. General information ... 10 2.1.2. Cellulose ... 11 2.1.3. Hemicellulose ... 12 2.1.4. Lignin ... 12 2.1.5. Extractives ... 13 2.1.6. Mineral matter ... 13 2.2. Thermochemical conversion ... 13
2.2.1. Overview of the thermochemical processes ... 13
2.2.2. Fast pyrolysis – principles and basics ... 15
2.2.3. Thermal degradation of cellulose and secondary reactions ... 17
2.3. Modelling of degradation of cellulose ... 19
2.3.1. Levels of models and their aims... 19
2.3.2. Mass loss kinetic models ... 20
2.3.3. Lumped kinetic models ... 20
2.3.4. Network kinetic models ... 21
2.3.5. Mechanistic kinetic models ... 22
2.4. Measurement techniques of the compound’s degradation ... 22
2.4.1. Basics and influential parameters ... 22
2.4.2. TGA systems ... 22
2.4.3. Py-GC/MS systems ... 23
2.4.4. Pulse-Heated Analysis of Solid Reaction (PHASR) systems ... 23
2.5. Reactor modelling with CFD ... 23
2.5.1. Basics of CFD ... 23
2.5.2. Geometry, meshing, nodes ... 24
2.5.3. Governing equations ... 25
2.5.4. Initial and boundary conditions ... 25
2.5.5. CFD models of micro-pyrolysis reactors ... 26
3. Chapter: Modelling study ... 27
7
3.1.1. System’s behaviour with validation ... 27
3.1.2. Real system – Py-GC/MS reactor ... 27
3.2. Temperature experiments ... 28
3.2.1. Aim of reactor temperature distribution measurement ... 28
3.2.2. Equipment used and measurement procedure ... 28
3.2.3. Data processing and experimental results ... 29
3.3. Modelled system ... 30
3.3.1. Selected CFD software and its properties ... 30
3.3.2. Modelled system... 31
3.3.3. Implemented geometry (reactor, cup and sample) ... 31
3.3.4. Initial formation of mesh on the model’s geometry ... 34
3.3.5. Description and implementation of cup’s falling and automatic remeshing during fall... 35
3.3.6. Solver settings ... 36
3.4. Parameters of models ... 37
3.4.1. Parameters of governing equations and domains selection ... 37
3.4.2. Initial and boundary conditions ... 37
3.5. Implemented kinetics and heat of reactions ... 39
3.5.1. Differences between applied degradation kinetics of cellulose ... 39
3.5.2. Three component model ... 39
3.5.3. Ranzi scheme ... 40
3.5.4. Secondary reaction scheme ... 40
4. Chapter: Results and discussion ... 41
4.1. Inspection on the model performance ... 41
4.1.1. Reactor temperature distribution ... 41
4.1.2. Temperature distribution of cup during falling ... 42
4.1.3. Mass balance – flux accuracy ... 46
4.2. Simplified model including conversion ... 47
4.3. The three component model with Di Blasi kinetics ... 50
4.4. Differences in conversion between kinetic models ... 53
4.5. Influence of secondary reactions on volatiles composition ... 58
4.5.1. Difference in fluxes between models ... 58
4.5.2. Detailed yields of compounds ... 61
5. Chapter: Conclusions ... 63
8
1.
Chapter: Introduction
1.1. General introduction to the subject
The presented study is situated in the domain of the thermochemical conversion of biomass. The conversion of biomass into more attractive products (fuels, chemicals and materials) has gained much interest in the past years due to the rise of the ecological awareness of society. Especially the development of new technologies and the optimisation of existing ones is currently the main subject being under research and development in the field. Out of plenty of possibilities of converting biomass, one which through its relative simplicity and profitable process outcome has drawn the attention of researchers is the pyrolysis process. From a variety of options of conversion through pyrolysis, fast pyrolysis of biomass gained most of the interest. The latter process is based on converting biomass in a high temperature, non-oxidising, gaseous environment in a reactor and it aims at the maximisation of the liquid product (bio-oil) yield. Those products are the most valuable due to the possibility of their direct use as well as a further upgrading to sustainable equivalents of transport fuels or platform chemicals.
Most of the research actions that are taken are experimentally based. In this presented dissertation research, the investigation was based on a different aspect. The main focus of this study was to establish a novel tool, which would allow to fully explore the data obtained otherwise experimentally and obtain better insights into the process by means of modelling. For its development a Computational Fluid Dynamics approach was applied, which is based on the fundamental theories from the areas of fluid dynamics, heat and mass transfer and chemical engineering. With the use of CFD, a tool in the form of a numerical model was constructed which covered all relevant and influential phenomena that occur in the pyrolysis reactor environment. Such model allowed for an in-depth investigation into pyrolytic biomass conversion under different conditions and reveals information that is not available during typical experimental studies.
1.2. Research problem
The main objective of the presented study is an investigation of the micro-reactor developed for conducting analytical, fast pyrolysis. When conducting experiments in the pyrolysis reactor, some parameters like reactor set temperature, can be chosen. Nevertheless, the actual temperature distribution in the reactor, as well as the sample’s time-temperature profile, is unknown to the researcher. On the other hand, their values have a great effect on the outcome of an experiment. Therefore, it is an important aspect to know the exact temperature distribution inside the reactor, especially if the interest lays in the investigation of the process mechanism, hence process optimisation. To measure the exact, real-time values of temperature, several probes would need to be used, which is very challenging due to the small size of the reactor as well as due to its construction (the reactor is a drop tube in which a sample cup is allowed to freely fall). Moreover, specifics of the fast pyrolysis process (rapid evolution of the vapours) do not allow for any experimental measurements of the vapours distribution and their transport behaviour in the reactor system. The use of predictions by numerical modelling seems like the only possibility that is able to overcome such problems and provide to the researcher information of interest. Therefore, to reveal the process behaviour in biomass fast pyrolysis, a CFD model was constructed, whose aim was to simulate the fast pyrolysis process that occurs in the analytical pyrolysis micro-reactor. One of the greatest problems
9 that currently existed in the already developed models was that they do not cover the movement of the sample cup during its fall, which is a relevant part of the experimental measurement. Therefore, it was not possible to obtain a full picture of the conversion, hence assign in detail (quantitatively) the influence and relation between process parameters.
The novelty in the approach of this study allowed a full investigation of the process covering not only the moment when the sample cup has dropped. The simulations of the CFD model also made it possible to express the results in a graphically detailed way, so every phenomenon that occurs in the reactor could be animated or displayed. Such ability of the tool allowed to display data that were never presented before as such, and it accelerated explanations of a specific behaviour of the system.
10
2.
Chapter: Theoretical overview
2.1. Biomass
2.1.1. General information
Biomass is a material produced primarily or secondarily (manures) by photosynthesis from plants or plant-derived materials. Examples are wood, crops and animal waste. In the photosynthesis process, plants absorb energy from the sun and store it in chemical bonds. It is estimated that the annual production of biomass is approximately 100 billion metric tons per year.
The replacement of fossil fuels by biomass originated fuels and offering them on the market as a sustainable alternative is the essential driver of the current-day biomass conversion research [Tumuluru et al. (2011)]. Biomass is available in different forms but can be divided into four categories, namely: woody plants, herbaceous plants, aquatic biomass and residues like manure. Because of its own characteristics, every type of biomass has a most suitable conversion process. Especially those types which have an initial low moisture content are favourably chosen for commercial activities [Mckendry (2002)]. Biomass has gained much interest as a renewable energy source. Especially the use of by-products from agriculture and biomass residues drives the current interest. The main reasons behind the growing attention for biomass as an energy source are the climate change, the shrinking crude oil stock and the foreseen gap between energy supply and demand [Mafakheri et al. (2014)]. People used biomass for thousands of years as an energy source to heat their homes and to cook food [Need (2018)]. Despite the direct application in combustion, biomass can be converted in various processes, and its products can be used as an energy source in more convenient and advantageous ways (gas-liquid burners, gas turbines). One of the most promising ways of biomass processing is its conversion into liquid fuels, for which demand is high and growing annually. Among varieties of liquid products that can be obtained from biomass conversion, a direct liquid from thermochemical conversion via pyrolysis (bio-oil) shows high potential. Especially because biomass fuels are recognised as CO2 neutral and have a very low sulphur content [Biagini et al. (2006)]. The high viscosity, coking and corrosiveness are the most challenging disadvantages of liquid products from pyrolysis (bio-oil) which have limited its use so far. The variability of the feedstock, which results in differences in physical and chemical properties of the product, is a major drawback for large scale applications [Czernik et al. (2004)]. Bio-oil products can be upgraded to gasoline grade fuel via hydrotreatments (e.g. HDO – hydrodeoxygenation) to improve their properties and bring their quality closer to conventional fuels. Besides the application as fuel, bio-oils are rich in compounds that can be used as platform chemicals for material or chemical production without fossil feedstock involvement. Currently, it is one of the most novel research paths, which gains more and more interest every year.
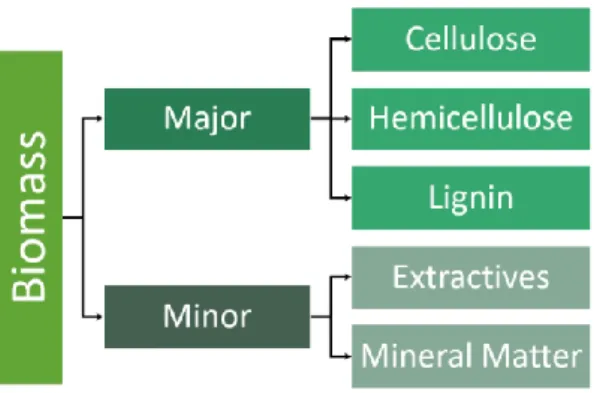
The most suitable feedstock for the production of bio-oil via the pyrolysis process is lignocellulosic biomass which consists of the biomasses originated from trees, grasses, forestry and agricultural wastes [Welch (2009)]. Lignocellulosic biomass is majorly composed of cellulose, hemicellulose and lignin with some small amounts of mineral matter and extractives. Figure 1 presents a simplified division of the constituents in biomass.
11
Figure 1. Scheme of the simplified division of lignocellulosic biomass constituents.
The distribution of the three major fractions in biomass depends strongly on the type of biomass. Summary of the composition of some biomass groups can be found in table 1. As it is stated by various researchers, the bio-composition of biomass, even for the same type and species, is very inhomogeneous. This translates to significant, quasi-randomly distributed variation in the biomass composition, which corresponds to technical problems in its conversion and difficulties in obtaining homogeneous conversion products [Vassilev et al. (2012)].
Table 1. Biomass composition [Vassilev et al. (2012)], values on dry mass basis.
Type of biomass Cellulose (wt. %) Hemicellulose ( wt. %) Lignin ( wt. %)
Softwood 43.3 27.4 29.3
Hardwood 46.8 30.4 22.8
Herbaceous biomass 46.1 30.2 23.7
Fibers 58.8 24 17.2
2.1.2. Cellulose
Woody biomass contains about 40 wt. % cellulose, while more herbaceous plants have a slightly higher content, on average 45 wt. %. Also, extremes exist like the cotton flower, which can reach up to 95 wt. % cellulose content or on the opposite end of the spectrum, tree bark with a cellulose content in the range of 10-15 wt. % ([Vassilev et al. (2012)].
Cellulose is a linear polysaccharide that consists of glucose units linked via β−1,4-glycosidic bonds. It is the most abundant organic polysaccharide on earth [Kim et al. (2013)]. Cellulose consists of microfibrils with crystalline domains embedded within an amorphous domain [Kulasinski et al. (2014)]. Via X-ray diffraction, it can be seen that not glucose, but cellobiose is the basic unit of a cellulose polymer. Cellulose’s monomer is highly soluble in water, and its high-molecular polymer is insoluble. This insolubility is the result of the crystallisation of cellulose chains during its formation. Therefore, the crystalline structure and its degree of polymerisation are important to understand the mechanical and chemical properties, for example, its insolubility in water and its thermal stability. The degree of polymerisation, the number of monomeric units in a macromolecule, for cellulose in wood fibers is normally between 9000 and 15000. The bonds linking the glucose units are not strong and tend to cleave under acid or high-temperature conditions [Wang et al. (2017)]. Plant species, environment and plant growth stage all have a drastic impact on the deposition and the production of cellulose [Kim et al. (2013)].
12
Figure 2. Schematic representation of cellulose monomer [Chromatos (2020)].
2.1.3. Hemicellulose
The content of hemicellulose in woody biomass, in general, is between 10 wt. % and 30 wt. %. Because of the differences in hemicellulose structure, its chemical properties vary significantly [Saha (2003)]. Most hemicellulose can easily be extracted with water when they are present outside of a cell wall. In the cell wall, the polysaccharides are covalently linked to lignin. Therefore strong reagents like alkali are necessary to exclude the hemicellulose from the cell wall [Pauly et al. (2013)].
In contrast to cellulose, hemicellulose is a short-chain heteropolysaccharide with an amorphous and branched structure. The degree of polymerisation is on average 200. The monosaccharide units are hexoses, pentoses and other saccharides, like glucose, xylose and arabinose [Rivas et al. (2013)]. In the hemicellulose structure next to the saccharides, some other groups like acetyl or uronic acid can be present. Each type of hemicellulose has its own chemical properties like backbone structure, degree of polymerisation and the type of linkage. This all has an effect on the behaviour during its pyrolytic conversion. The degradation of hemicellulose is dependent on the building blocks, and therefore the investigation of the degradation chemistry from the monosaccharides can give insight into the behaviour of hemicellulose in pyrolysis.
2.1.4. Lignin
Lignin content of woody biomass is around 30 wt. % [Gani et al. (2007)]. Lignin, in comparison to cellulose and hemicellulose, has no carbohydrate structure and is built of an aromatic matrix. Lignin’s role in the plant is to maintain the strength and the rigidity of its cell walls.
Lignin is a three-dimensional polymer composed of three basic units, namely p-coumaryl, sinapyl and coniferyl alcohol. The difference of the basic units is the number of methoxy groups attached to the aromatic ring. Every plant species has its own proportion of the three basic units. Various linkages and different functional groups make lignin a very complex structure [Novaes et al. (2010)]. Because of its unregular structure lignin is a physically and chemically heterogeneous material. Various combinations of side-chain structures increase the diversity of lignin [Hatakeyama et al. (2009)].
13 2.1.5. Extractives
Apart from the three main components, the extractives are present in biomass in much smaller amounts. They usually count for less than 10 wt. % of the total weight. Extractives are organic compounds obtained via their removal with the use of inert solvents (e.g. alcohol, benzene or acetone) from the biomass material. The product of extraction contains resins, fats, waxes, pigments, … depending on the biomass[Guo et al. (2010)].
Due to their great variety in composition, structure and function, it is hard to make a detailed classification of extractives that occur in biomass. A general classification can be done based on water solubility. Therefore, based on the solvent polarity the extractives are usually divided into: the hydrophilic (soluble in polar solvents), and the hydrophobic (soluble in non-polar solvents) ones. Typically, the hydrophobic ones are mostly triglycerides with a high presence of linoleic acid. The hydrophilic ones are usually phenolic compounds with antioxidant properties [Debiagi et al. (2015)]. 2.1.6. Mineral matter
Different kinds of biomass contain mineral matter in various amounts, which also varies in its chemical composition. In general, wood contains less than 1 wt. %, whereas straw can contain up to 25 wt. %. The main constituents of biomass mineral matter are elements like Si, K, Na, Ca and Mg, with smaller amounts of P, Mn, Fe and Al. These elements are present in the form of chlorides, oxides, phosphates, silicates, carbonates or sulphates [Raveendran et al. (1995)].
Minerals can have effects by acting as catalysts during thermal degradation of organic molecules in the pyrolysis process. Both beneficial and disadvantageous activity of the mineral matter, depending on the aim of the conversion process have been reported [Akhtar et al. (2012), Gonzalez et al. (2008)]. The removal of minerals leads to higher yields of condensable volatiles and therefore, lower yields of char and non-condensable gases [Rodriguez-Machin et al. (2018)]. Moreover, if they are in large abundance in the bio-based product, they can cause technological problems such as corrosion enhancement or fouling during combustion, e.g. in power generation plants. [Vamkuva et al. (2006)].
2.2. Thermochemical conversion
2.2.1. Overview of the thermochemical processes
The general division of the biomass conversion processes distinguishes two main routes of conversion: thermochemical and biochemical.
The biochemical processes are based on the application of microorganisms or enzymes to convert organic compounds contained in biomass into various products, out of which the most abundant side products are water and CO2. Typical processes in biochemical conversion are anaerobic digestion and fermentation. The fermentation in an aerobic environment (with oxygen present) leads to the formation of solid compost, carbon dioxide and water. Anaerobic fermentation (without oxygen) leads to digestate, water, carbon dioxide and methane (both in a mixture referred to as biogas), which can be used for energy generation. Another type of anaerobic fermentation is the alcoholic fermentation, which focuses on the production of ethanol and carbon dioxide as a by-product [Kucuk et al. (1997)]. It needs to be mentioned that despite the favourable low temperatures of these processes, biochemical conversions are characterised by a long conversion time and in general, low energy recovery and high by-product yields.
14 Thermochemical processes are processes in which the degradation of biomass polymers is driven by cleavage of their bonds due to high temperature and/or reaction with other compounds. Thermochemical processes are usually employed for converting biomass into higher heating value fuels. Thermal conversion routes include direct combustion (full combustion), gasification (partial combustion), pyrolysis (no oxygen, gas inert atmosphere of conversion) and hydrothermal conversion (no oxygen, water or liquid solvent environment) as can be seen in figure 3.
Figure 3. Overview of different thermochemical processes [Gielo-Klepacz et al. (2017)].
Gasification is considered as a partial combustion process, because of the presence of oxidising compounds in the reactor environment (e.g. O2, CO2, H2O or their mixtures). In comparison to combustion, the purpose of gasification is to create valuable gaseous products and not heat. The gasification takes place at high temperatures around 800 °C, and its aim is to achieve high gas yields of combustible gases, like H2, CO and CH4. The product of gasification, sometimes referred as syngas, can be used as: a source of hydrogen, as fuel gas for turbines or as a feedstock for the synthesis of chemical compounds (e.g. in Fischer-Tropsch process) [Kirubakaran et al. (2009), Zhang et al. (2010)]. Typical levels of moisture of industrial biomass are around 50 wt. %, and moisture content lower than 10 wt. % and low ash content is required for conversion via gasification. To tackle this problem, novel gasification technologies are under development. The hydrothermal gasification, which is performed in a pressurised water environment, can cope with the high moisture content as well as with the high ash content of biomass [Elliott (2008)]. In general, the gasification in the form of dispersed, stand-alone systems is seen as a good alternative for direct combustion. It reduces the storage and transport costs of biomass by the use of a small and efficient gasifier, and it has the capacity of recovering energy from low-value biomass as a feedstock [Hernandez et al. (2010)].
Pyrolysis is the conversion of biomass without access to oxygen in temperatures between 300 °C and 700 °C (a typical range that can be found in literature). Below that range of temperatures the process of conversion is named torrefaction, sometimes referred to as mild pyrolysis. At temperatures
15 between 230 °C and 300 °C, only the hemicellulose fraction of biomass undergoes decomposition which results in the formation of torrefied wood and volatiles. The general aim of torrefaction is to reduce the O/C ratio of biomass and increase its energy content and its stability, hence the torrefied biomass’ storage time. Torrefied biomass is used as a renewable solid fuel for combustion or gasification [Phanphanich et al. (2011) Prins et al. (2006)].
During the pyrolysis process, all biomass constituents undergo conversion. The pyrolysis products are divided into solid (char), condensable gases (bio-oil + water) and non-condensable gases. The distribution strongly depends on the reaction conditions, reaction temperature and residence time [Wang et al. (2017)]. Therefore, the most common division of pyrolysis processes is in fast, intermediate and slow pyrolysis in regard to the residence time of volatiles formed in the process. Slow and intermediate pyrolysis with a low heating rate and a long vapour residence time are used to produce charcoal (fuel purpose) or biochar (agricultural and industrial purpose). Typically, a temperature of around 400°C is used in slow and intermediate pyrolysis. The target product is char but is always accompanied by the formation of liquid and gas products. Biochar consists mainly out of carbon and can be used in the soil or as a carbon sequestration possibility [Yan et al. (2014)]. Traditional processes involve some direct combustion of the biomass as a heat source, and liquid and gases were often not collected. Nowadays, these products are recovered or re-used to provide process heat [Bridgwater (2012)]. If the conditions are changed to high heating rates and short vapour residence times, the formation of liquids will be favoured, and the formation of char inhibited. The process is then called fast pyrolysis. Suitable temperatures are in the range of 450 °C to 550 °C [Scott et al. (1988), Zhang et al. (2010)]. In the process of fast pyrolysis, the light fragments of polymers that are formed in the process do not re-polymerise immediately after formation but are quickly quenched after the reactor outlet. Due to the low thermal stability of the volatile compounds, it is essential to swiftly remove them from the reaction zone to minimise secondary reactions like cracking. Overview of the thermochemical conversion processes in the gaseous environment is presented in table 2.
Table 2. Different thermochemical processes [Bridgwater (2012)] (VRT-volatiles residence time).
2.2.2. Fast pyrolysis – principles and basics
The fast pyrolysis process aims in obtaining the highest yield of oil. In order to maximise the bio-oil yield, different factors have to be considered. Among many, the most influential parameters include heating rate, final temperature, the retention time of the volatiles, pressure, presence of inorganics and atmosphere [Anca-Couce (2016)]. Various reports indicate that the peak for the bio-oil yield is usually obtained between 450 °C and 550 °C [Heo et al. (2010)]. At higher temperatures, secondary cracking reactions start to take place, which leads to degradation of the condensable compounds and results in a lower bio-oil yield.
Mode Conditions liquid yield (%) solid yield (%) gas yield (%)
torrefaction around 290 °C, VRT 10-60 min 0 80 20
slow around 400 °C, VRT days 30 35 35
intermediate around 500 °C, VRT 10-30s 50 25 25
fast around 500 °C, VRT 1s 75 12 13
16 Along with temperature, the heating rate is the determining process parameter of the fast pyrolysis. High heating rates applied in fast pyrolysis favour a quick fragmentation of polymers and reduces the occurrence of charring reactions leading to excessive formation of char. Salehi et al. (2009) observed an 8 wt. % increase in bio-oil yield when the heating rate increased from 8.3 °C/s to 11.7 °C/s with the corresponding reduction of the char and non-condensable gas yield. A further increase to 16.7 °C/s did not show a further rise of the bio-oil yield.
The residence time has a major effect on the bio-oil yield. Very short residence times result in incomplete depolymerisation of lignin due to random bond cleavage and inter-reaction in the lignin macromolecule resulting in a less homogenous product. Longer residence times cause secondary cracking that lowers the yield and affects the bio-oil properties. These secondary reactions are limited at temperatures below 650 °C and residence times shorter than 2 seconds [Bridgwater et al. (1999) Van de Velden et al. (2010)]. Scott et al. (1999) observed a decrease in the bio-oil yield from 75 to 57 wt. % when the residence time increased from 0.2 to 0.9 s. As can be noticed, with the high heating rate, the rapid removal of the evolved vapours (short residence time) is necessary for the fast pyrolysis process. Its role is to prevent the occurrence of secondary reactions of vapours [Seo et al. (2010), Kan et al. (2016)].
Another parameter, with no such straightforward influence, is the particle size. With simplification can be stated that the thermal degradation of biomass can occur under two regimes: a chemically controlled or a heat transfer controlled regime. The regime determines which process has the most influence on the rate of conversion. In the first case, the heat transfer rate limits the conversion, which in theory could happen faster if thermal boundaries would be removed. When the heat transfer rate inside of the particle is lower, strong temperature gradients are leading to non-homogeneous particle's conversion [Di Blasi (1994)]. On the opposite, the kinetic regime is purely driven by kinetic degradation, without any thermal limitations. In the situation when a conversion occurs in the heat transfer regime, it can be expected that heating rates are much lower, so the formation of char is favoured instead of bio-oil. To optimize fast pyrolysis, the process has to occur in the kinetic regime, and this is strictly related to the particle size. Smaller particles do not show significant thermal gradients, so their heating is not hindered by heat transport. In general, it can be stated that the reduction of the particle size has a positive influence on the bio-oil yield in the fast pyrolysis process. Usually, particle sizes can be in the range from µm to mm, depending on the used technology. It is commonly known that the size reduction becomes more expensive when smaller sizes have to be achieved.
In general, for the fluidised bed pyrolysis particle sizes smaller than 1 mm, heating rates higher than 200 °C/s and vapour residence times lower than 4 s are favourable [Bridgwater (2012)]. A fast pyrolysis system, seen in figure 4, is a series of operations starting with a feedstock. It is possible to start with a dried feed such as straw, but drying is usually essential to avoid excess water in the end product. The water in the bio-oil reduces its quality by reduction of the heating value.
In industrial solutions, usually low-grade process heat (e.g. flue gases from by-product combustion) is used for biomass drying prior to the pyrolysis process. After the drying, the biomass is ground to achieve small and evenly distributed particles. As it was indicated in the section above, the grinding is necessary to get rapid heating and to achieve high liquid yields. Depending on the type of reactor, the particle size is specified.
17 Next, the particles go to the reactor to be converted in the fast pyrolysis process. In the case of the fluidised bed process (fig. 4), the bed is initially filled with sand, heated to the reaction temperature. The role of the sand bed is maintaining an appropriate heat transfer from the reactor wall to the biomass particles (fine char). Residual solid matter from the pyrolysis process (char) stays in the bed. Vapours and fine particles evolved in the process are removed from the reactor zone with a swift purge of fluidising gas. Then they are directed into the cyclone to separate the particulate matter from the vapours. Next, the vapours enter the condenser, where the separation between the condensable (bio-oil, water) and non-condensable gases (CO2, CO, CH4) takes place. Condensed bio-oil is then stored in tanks, with temperatures between 10 °C (bellow, pumping problem due to high viscosity) and 40 °C (above, ageing due to excessive re-polymerisation). The main product (bio-oil), is produced with yields of up to 80 wt. %, from which about 25 wt. % is water and the rest are organic compounds [Alvarez et al. (2014)].
Depending on industrial systems, solid residue (char) or gases can be used to provide heat to the fast pyrolysis process. In such a solution, the process is thermally balanced via allothermal heating through burning one of the side-products, so there is no need for an additional heat source from outside the system to keep the overall heat balance of the process.
Figure 4. Scheme of a fast pyrolysis process. [Bridgwater et al. (2000)].
2.2.3. Thermal degradation of cellulose and secondary reactions
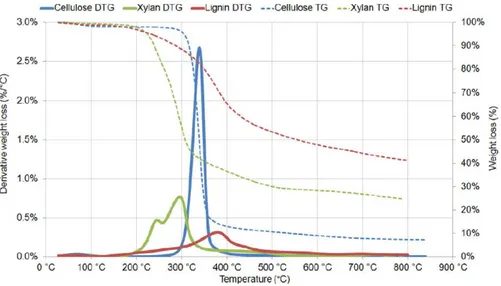
It was observed that cellulose starts to degrade at a temperature around 300 °C and its degradation is finished around 400 °C. Depending on the cellulose structure, so the share of the crystalline and amorphous fractions in the overall structure, the peak of cellulose conversion can be located at a slightly different temperature. When more amorphous cellulose is present, the temperature at which the thermal degradation peak is located decreases. Nevertheless, the amount of amorphous cellulose does not affect the peak height of the DTG curve. The blue curve in figure 5 shows the weight loss for cellulose during a TGA experiment.
18
Figure 5. Weight loss and derivative weight loss for cellulose and other bio-constituents [Stefanidis et al. (2014)].
Without deviation on the form of the cellulose, its decomposition is usually represented by the Waterloo-mechanism seen in figure 6 [Piskorz et al. (1989)]. The mechanism represents the reaction pathway and defines the expected products and the effect of temperature and heating rate.
Figure 6. Decomposition of cellulose via the Waterloo-mechanism [Piskorz et al. (1989)].
This mechanism consists of three competitive, primary reactions:
• the fragmentation to hydroxyacetaldehyde and other carbonyls, acids and alcohols, • the depolymerisation to levoglucosan and other anhydrosugars
• the dehydration to char, gases and water.
Depending on the temperature and heating rate, one of the three reactions dominates [Van de Velden et al. (2010)]. The reaction from cellulose to active cellulose is a depolymerisation without the release of any volatiles [Anca-Couce (2016)]. This step is a scission of the glycosidic bonds by a transglycosylation [Mamleev et al. (2007)]. The result of this intramolecular transglycosylation is the formation of chain ends with levoglucosan. For the transglycosylation to proceed there is no need of a catalyst, but a high temperature is required, and this is characterised by the high activation energy of 200 kJ/mol for this reaction [Mamleev et al. (2009)].
19 It is assumed that whole levoglucosan retained in cellulose exists in the form of chain ends. The elimination of these ends to form levoglucosan occurs with the rate of the transglycosylation reaction. The liquid levoglucosan decomposes at much lower temperatures than cellulose, around 280 °C. It means that in order to enhance the levoglucosan yield, the chain ends should be protected [Mamleev et al. (2009)].
To understand the pyrolysis mechanism of cellulose, studies on the chemistry of glucose are useful. The most abundant product of glucose thermal degradation is levoglucosan, but also other anhydrosugars can be formed e.g., levoglucosenone. A molecule of glucose can be directly dehydrated at the C1 or C6 position, but the loss of the hydroxyl group at C1 is thermodynamically favoured. Levoglucosan can then be decomposed via three mechanisms:
• C-O bond scission, • C-C bond scission
• levoglucosan dehydration.
In the glucose pyrolysis study, the glycosidic bond (one that occurs in cellulose) cannot be investigated. Thus model compounds such as cellobiose or cellotriose are used in common practice. In case of application of dimers or trimers, the formation begins with the cleavage of the glycosidic bond, like in case of cellulose. The cleavage mechanism itself is still unclear. In the literature, three mechanisms propositions can be found: the homolytic, heterolytic and concerted mechanism. Zhang et al. (2011) found that the homolytic cleavage was preferred because of the lower bond dissociation energy. A study by Hosoya et al. (2009) proved that the cleavage more likely occurred through a concerted reaction (all bond breaking occurs in a single step). The studies are based on the assumption that cellulose is only one chain, ignoring the interchain hydrogen bonds [Wang et al. (2017)].
At temperatures higher than 500 °C occurrence of cracking and re-polymerisation of primary volatiles (like levoglucosan) is favoured (secondary reactions). When these reactions occur in the gas phase, they are called homogenous. The occurrence of secondary reactions, is indicated by the increase of the non-condensable gas yield. The most distinctive product of the secondary reactions is CO, which in extreme cases can account for two-thirds (wt.) of the loss in bio-oil. Literature sources indicate that char is an active catalyst for secondary cracking reactions. Therefore, the separation of char from volatiles prior to bio-oil condensation is important for the process [Gilbert et al. (2009)].
2.3. Modelling of degradation of cellulose
2.3.1. Levels of models and their aimsA model for the conversion of cellulose can be divided into three categories according to the scale in which the covered processes take place. The study of each sub-model, combined or separately, can give insight into the biomass conversion processes. Comprehensive modelling, which is an attempt to merge models with different time and length scales is necessary because modelling thermochemical conversion is considered as a multi-scale problem. The aim of multi-scale modelling of the thermochemical conversion of biomass is to combine all phenomena occurring at different scales to describe the conversion process with the highest possible accuracy.
The smallest scale is covered by the molecular model. It describes the primary and secondary reactions of the organic compounds and also the catalytic effects of the inorganic compounds. The surface
20 processes are part of the molecular level. For cellulose pyrolysis, the principles of theoretical chemistry are applied to develop a molecular mechanism to be further incorporated into the model. In this scale, simulations can be done with a low computational cost.
The role of the particle model is to cover the conversion of a single particle of the material. At this level, the kinetics from the molecular level have to be combined with transport mechanisms. Also, the physical change of the particle shape is part of the single particle model. All mentioned phenomena have an influence on each other and in the end on the yield and the composition of the product, so they have to be considered simultaneously (coupled) in the model. In general, it means that the following phenomena have to be coupled with each other: chemical reactions, transport of energy, transport of mass and momentum and change in the physical structure of the particle. In this scale, simulations can be done with a moderate computational cost.
The reactor model covers all processes inside the reactor, where the material is thermochemically converted. It also combines the biomass particles with the gas phase environment and its relation to it. The reactor model usually is the most complex one and the most difficult to implement among other scales. It needs to be stressed that in the reactor model, the dimensions usually starts from centimetres to even metres. In general, this level uses the information from the smaller scale models (particle and molecular level) and expands them by all phenomena occurring in the reactor zone. It describes the mass, momentum, and energy transport, and this is done via computational fluid dynamics [Maziarka et al. (2019), Anca-Couce (2016)]. In this scale, simulations can be done with a very high computational cost.
2.3.2. Mass loss kinetic models
Mass loss models are straightforward mathematical models used for the prediction of mass loss during pyrolysis. Their focus lies on the degradation reaction rate, which is a function of the time of conversion. Determining the kinetic parameters for this model is usually done via TGA. Pyrolysis of pure cellulose can be described with a first-order reaction model with the activation energy around 200 kJ/mol. In this way, the pyrolysis can be represented as one simple reaction without any other experimental data. Nevertheless, the low accuracy of such an approach led to the employment of more complex models with more reactions and different activation energies. To obtain kinetic parameters, two approaches are used to analyse the data. The model-free approach calculates the activation energy at fixed conversions. In this way, the activation energy is only dependent on the temperature. The model-based approach assumes that the reactions follow a reaction model. Here the most appropriated reaction model is chosen, and the Arrhenius parameters are evaluated with this model [Anca-Couce (2016)].
2.3.3. Lumped kinetic models
The simplest lumped kinetic model is the single-component competitive model. Such models aim to predict the three main products of the pyrolysis process: char, bio-oil and gas. It means that only the primary reactions are theoretically considered, and this has an influence on the prediction accuracy. Primary pyrolysis is described as the stage during which the competition between the formation of char, bio-oil and gas occurs. An example of a simple lumped model is the model proposed by [Agrawal(1988)]. In that model, three reactions occur in parallel directly from cellulose [Serbanescu (2014)]. It is important to know that running a simulation with different competitive schemes will differ
21 significantly in the resulting outcome. Those models are strongly related to the data on which they were developed, so they should be applied only to simulate the process in similar conditions.
When more detailed information about the product composition at different conditions is required, more advanced models have to be used. One of the first more advanced schemes is the one proposed by [Ranzi et al. (2008)] based on the Waterloo mechanism.
Figure 7. Ranzi kinetic scheme [Ranzi et al. (2008)].
In the Ranzi model, the pyrolysis of cellulose starts with the formation of an intermediate product, active cellulose. This active cellulose decomposes via two competitive reactions: a reaction releasing levoglucosan and decomposition to form char and gases. Next to these main reactions, a side charring reaction is considered. The levoglucosan formation is the main reaction at lower temperatures. At high temperatures, above 500 °C the decomposition reaction prevails. In the Ranzi scheme, the levoglucosan is formed by mechanism of a chain-end depolymerisation reaction of the active cellulose. Besides the formation of levoglucosan also other products are formed from the intermediate (via decomposition), like: hydroxy-acetaldehyde, glyoxal and hydroxymethyl-furfural. All these decomposition products are formed by -scission reactions and successive molecular and radical reactions. All kinetic parameters of this model can be found in the publication by Ranzi et al. (2008). Over the years, the kinetic model has been continuously upgraded with new experimental data. In the latest revision done by Debiagi et al. (2018) more attention is paid to the yields and timing of the released species and to the heat of reaction. The use of experimental data from temperature profiles in particles allowed a better understanding of the endothermic release of tars and the exothermicity of the formation of char. In this work, it was chosen to use the revision from Debiagi et al. (2015). The Ranzi scheme simplifies the complex nature and concerted mechanism of cellulose degradation and is therefore, suitable to predict the mass loss evolution. Also, the product characterisation is included in detail with different species. Notwithstanding, this scheme also has some limitations, like the influence of inorganics is not included. These inorganics affect the char yield but can also catalyse the fragmentation reactions. Next to the secondary cracking reactions (above 500 °C), the secondary charring reactions (low heating rate) can play a crucial role, and they are not included in the scheme. These secondary charring reactions occur at the same time as primary pyrolysis reactions, and it is seen that char is mainly a secondary product [Anca-Couce (2016)].
2.3.4. Network kinetic models
Network models, also known as structural models, consider the structural changes of polymers during pyrolysis. For cellulose pyrolysis it means that the model starts from its macromolecular structure from which several consecutive reactions occur. Pyrolysis is seen as a devolatilization which considers reactions as depolymerisation and re-polymerisation. These reactions are divided into four stages: depolymerisation, re-polymerisation, external transport and internal transport. For a network model,
22 the structure of cellulose is based on statistical techniques like the Monte Carlo technique. A typical structure consists of monomers connected through cross-links. The calculation of the yield is based on the structural properties like the molecular weight of the monomers and the number of cross-links [Samreen et al. (2019)].
2.3.5. Mechanistic kinetic models
Mechanistic models reveal the actual mechanism of pyrolysis, including the reaction paths and the formed components. In these models, the physical and chemical reactions are simulated from which the elementary reactions can be understood. One mechanistic model proposed by Vinu and Broadbelt (2012) involves two steps for the formation of levoglucosan from glucose-based carbohydrates: a mid-chain glycosidic bond cleavage and an unzipping from the mid-chain-ends. These mechanistic models are able to provide the chemistry of reactions in the presence of inorganics, which can act as a catalyst. Classical kinetic models are unable to cover such catalytic effect. Therefore, mechanistic models contribute significantly to unravel the pyrolysis of a model compound [Hameed et al. (2019)].
2.4. Measurement techniques of the compound’s degradation
2.4.1. Basics and influential parametersThe examination of the kinetic schemes and the estimation of its parameters included in them have to be validated by experimental measurements. Different analysis techniques can be used from which three are the most commonly used: TGA, Py-GC/MS and PHASR, and these ones are explained in this work with more detail. It needs to be stressed that the experimental conditions related to the applied setup can have an influence on the obtained kinetic parameters. Therefore the understanding of the technical boundaries of the experimental setups is important.
2.4.2. TGA systems
The most commonly used technique for the characterisation of pyrolysis kinetics is thermogravimetric analysis. In a thermobalance, the change of a sample mass is recorded in function of time in an inert atmosphere [Anca-Couce et al. (2014)]. A sample is exposed to heating rates lower than 1.7 °C/s, typically around 0.1 °C/s. During the heating program, the weight loss is recorded. The heating program can be done in isothermal or non-isothermal conditions. When isothermal conditions are applied, it is assumed that the temperature inside the system does not change with the time and conversion takes place in the set temperature. These methods require long time scales to obtain reproducible results. Also, it needs to be taken into account that during heating up of the TGA to the final temperature, the sample is already in the heating zone. Therefore, some conversion occurs prior to obtaining the isothermal conditions. With non-isothermal conditions, it is possible to perform high-resolution experiments in a shorter time. To obtain kinetic parameters, the measurements have to be repeated with different initial heating rates [Cheng et al. (2012)]. The TGA data can be analysed with several different methods. The model-free methods allow obtaining the kinetic parameters without making any assumptions of the kinetic model. In this way, the reliability and correctness of the kinetic model is excluded. The model-fitting method puts the achieved data into a kinetic model in the best suitable statistic form [Mishra et al. (2018)]. TGA experiments can only be executed at low and medium heating rates due to the technical limitations of setup. At these lower heating rates, the different reactions from cellulose merge into one, and the outcome will be different than from setups that allow for higher heating rates [Anca-Couce (2016)]. A coupling of the TGA to a mass-spectrometer and an infrared spectrometer is used to detect and analyse the released gases. The mass spectrometer is used for the
23 detection and distribution of the volatiles and is more a qualitative technology while the infrared spectrometer measures the amount of volatiles and is a quantitative method [Asadieraghie et al. (2015)].
2.4.3. Py-GC/MS systems
Py-GC/MS is an analytical setup which performs a simultaneous separation and identification of compounds in the condensable gas range after pyrolysis [Mullen et al. (2010)]. In brief, a biomass sample is loaded into the micro-reactor in which it undergoes a rapid conversion. Then the vapours are loaded into the GC/MS system [Moldoveanu (2001)]. In comparison to a TGA system, the conditions in a Py-GC/MS system allows for an approach, that is closer to a real fast pyrolysis process. Heating rates in the range of 2000°C/s are used. With the use of a simple GC/MS system, it is not possible to do a quantitative analysis of the released vapours, because of the complexity of the products and the lack of available standards [Lu et al. (2011)]. When quantitative data are desired, the use of a FID detector is necessary. The concentration of components is proportional to the strength of the current between the electrodes in the FID, and the different components in bio-oil can be measured [Butler et al. (2013)].
2.4.4. Pulse-Heated Analysis of Solid Reaction (PHASR) systems
A recently developed experimental technique is the Pulse-Heated Analysis of Solid Reactor. In this technique, biomass samples are rapidly heated and cooled in pulses for a very short time in the range of milliseconds. The reactor consists of two parts: an upper chamber with the sample, a heating element, a temperature measuring device and a gas flow. The lower chamber has a continuous flow of coolant, so the sample's temperature of 3 °C can be maintained. The inert sweep gas flows through the chamber over the biomass sample to a gas chromatograph. The analysis of the vapours is done via two different detectors. The identification of the species with mass spectrometry and the quantification by a QCD-FID detection method. This is a quantitative carbon detector coupled with a flame ionisation detector. With this method, the conversion of carbon into volatile organics can be calculated [Maduskar et al. (2018), Krumm et al. (2016)].
2.5. Reactor modelling with CFD
2.5.1. Basics of CFDSince the cellulose for measurement purpose does not occur in the form of large particles but rather as a powder, the modelling of the particle scale is irrelevant for the investigated process. Therefore, after the selection of the process kinetics, the next step of the comprehensive investigation is the modelling of the experimental setup, which is equal to the reactor model. To conduct the investigation at this scale, more sophisticated tools are needed, such as computational fluid dynamics (CFD). CFD modelling is a design and analysis tool that uses the power of computers to simulate the flow of fluids, heat and mass transfer, chemical reactions, interactions and other fluid flow phenomena. The results obtained by the simulation of a model can give insight into the process without doing experiments, some of which are difficult to make, or if even possible. CFD not only overcomes some of the problems in experimental work, but it is also a cost-saving and safe method. Also its convenience lays in the ease of performing a sensitivity analysis or scaling-up [Wang et al. (2008)].
24 A CFD program consists of three main elements: a pre-processor, a solver and a post-processor. The pre-processor consists of all the input for solving a problem. This is mainly done by an operator-friendly interface. This involves defining the geometry and grid generation, which is the division of the computational domain into smaller elements. This step is necessary for the solver to be able to compute all equations in each element. Surface phenomena are implemented by boundary conditions, and an initial guess of the solution is made. Then the solver calculates the different equations for every element in the domain. This happens by a numerical algorithm which has the following steps: integration of the governing equations, discretisation and solution by an iterative method. In the post-processing step, the results are processed and are most commonly displayed in a graphical way. Most of the CFD packages have these data visualisation tools in their software [Versteeg et al. (2007)].
Figure 8. CFD analysis framework [Manya (2019)].
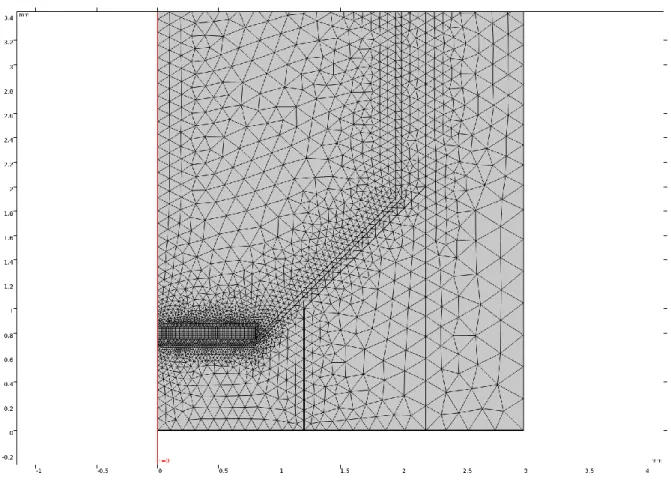
2.5.2. Geometry, meshing, nodes
The first step in a CFD analysis is the creation of a computational domain for the calculations. The geometry can be considered as a three-dimensional domain or can be simplified to a two- or one-dimensional domain if some dimensions are not relevant for the investigated case. Once the geometry is implemented, on its basis a mesh can be created. Meshing is the process of the division of the domain into a finite number of smaller, non-overlapping sub-domains. These sub-domains are called cells. In each cell of the mesh, the solver indicates a node to which it assigns all discrete values like the flow properties, velocity, pressure and temperature. The accuracy of a solution is partly determined by the number of sub-domains. In general, increasing the number of cells will increase the accuracy of a solution, but only until the point in which the solution is grid-independent. From that point, a further increment of the number of cells (refining of the mesh) will not lead to better accuracy. Excess of not needed cells will also influence the computational time, and therefore there should be a balance between them. An independent grid allows for an accurate computation with the least number of cells and therefore, the shortest computational time [Tu et al. (2013)].
25 2.5.3. Governing equations
The foundation of CFD are the governing equations of fluid dynamics, which are the continuity, momentum and energy equations [Anderson (2009)].
This part summarises all used equations in the setup of a CFD model for systems such as a micro-pyrolysis reactor. The main parts of the CFD model are the heat transfer and fluid flow. The governing equation for heat transfer (eq. 1) is derived from the energy conservation law and Fourier’s law for conduction.
𝜌𝐶𝑝
𝜕𝑇
𝜕𝑡+ 𝜌𝐶𝑝𝑢∇𝑇 + ∇𝑇(−𝑘∇𝑇) = 𝑄 (eq.1)
Where 𝜌 [𝑚𝑘𝑔3] is the density; 𝐶𝑝 [
𝐽
𝑘𝑔∗ 𝐾] is the heat capacity at constant pressure; 𝑢 [ 𝑚
𝑠]stand for the
velocity of the gas phase: 𝑘 [ 𝑊
𝑚2∗𝐾] is the heat transfer coefficient; 𝑄 [
𝑊
𝑚3] is the heat source term. The
first part of this equation represents the energy storage, which is the change in internal heat energy. The second part represents the change in energy by convection, which is the net energy transport due to bulk flow. The third part is the change in energy by conduction. 𝑄 stands here for the rate of heat generation [Cheric (2016), Shi (2017)].
The equation for the fluid flow is the Navier-Stokes equation given by:
𝜌𝜕𝑢
𝜕𝑡 + 𝜌(𝑢∇)𝑢 = ∇(−𝜌𝐼 + 𝐾) + 𝐹 (eq. 2)
Where 𝐹 [𝑚𝑁2] stand for the external forces, like gravity, applied to the fluid. The left-hand side of the
equation corresponds to the inertial forces. On the right-hand side, the first term are the pressure forces (−𝜌𝐼) andthe second term the viscous forces (𝐾) [Comsol (2017)]. The pressure term prevents motion due to normal stresses. The fluid presses against itself and keeps it from shrinking in volume. The viscous forces are the terms which cause motion due to horizontal friction and shear stress. The external forces are all the forces which act on every single fluid particle [Gibiansky (2011)].
By adding the kinetics to the model, new species are introduced which are transported through the system. For this transport following equation (eq. 3) is used:
𝜌𝜕𝜔𝑖
𝜕𝑡 + ∇𝐽𝑖+ 𝜌(𝑢∇)𝜔𝑖 = 𝑅𝑖 (eq. 3)
Where 𝜔𝑖 is the mass fraction of the 𝑖𝑡ℎ species in the gas phase; 𝐽𝑖 stands for the surface diffusion;
and 𝑅𝑖 is the net flux of compound 𝑖.
2.5.4. Initial and boundary conditions
The previously mentioned governing equations describe the flow, heat and mass transfer in the fluid phase. However, these are the same for different setups: like flow in a narrow channel and the flow over a high building. The differences in the setups lie in the specification of the domain as well as the boundary conditions.
26 A first physical boundary condition is the no-slip condition. The fluid immediately next to a solid surface has a relative velocity of zero. If the surface is stationary, the absolute velocity is zero for all components as in eq. 4.
𝑢 = 𝑣 = 𝑤 = 0 (eq. 4)
For fluid flow in a channel, the inflow and outflow boundary conditions are provided. The inflow boundary condition is given by the Dirichlet boundary condition on the velocity given by eq. 5.
𝑢 = 𝑓 𝑎𝑛𝑑 𝑣 = 𝑤 = 0 (eq. 5)
Where 𝑓 is specified as a constant value or as a velocity profile. In a Dirichlet condition, the dependent variable is not changing during the simulation.
The outflow condition is known as the Neumann boundary condition given by eq. 6. 𝜕𝑢 𝜕𝑥 = 𝜕𝑣 𝜕𝑥 = 𝜕𝑤 𝜕𝑥 = 0 (eq. 6)
With 𝑥 here the direction normal to the outflow surface. This equation states that the shear forces along the surface are zero. The Neumann boundary condition is applied when the value of the dependent variable changes with time.
For the heat transfer, a Dirichlet boundary condition is used, which is an analogue to the no-slip condition for the fluid flow. If the wall temperature is denoted as 𝑇𝑤𝑎𝑙𝑙 then the fluid immediately at
the surface has the same temperature. This condition is given by eq. 7.
𝑇 = 𝑇𝑤𝑎𝑙𝑙 𝑎𝑡 𝑡ℎ𝑒 𝑤𝑎𝑙𝑙 (eq. 7)
2.5.5. CFD models of micro-pyrolysis reactors
The use of a CFD model to simulate the experiment in a micro-pyrolysis reactor has rarely been reported in the literature. One of the few developed models is the one from [Proano-Aviles et al. (2013), Proano-Aviles et al. (2016)]. Proano-Aviles et al. (2016) presented the results of a simulation of gas transport through a micro-pyrolyzer and looked at the temperature profile and the heating rates of the biomass particles. For a wall temperature of 400 °C, convection and radiation have a comparable influence on the heat transfer. Radiation dominates when the wall temperature is as high as 1000 °C. They conclude that for a free-fall reactor, both the heat transfer effects have to be included. They also investigated the use of different kinds of sample cups and determined that diffusion of the released vapours limits the mass transfer [Proano-Aviles et al. (2013); Proano-Aviles et al. (2016)]. They did not include the kinetics of cellulose pyrolysis. So the effect of the limiting mass transfer on the chemical decomposition reaction has not been investigated.
27
3.
Chapter: Modelling study
3.1. General aim of the modelling study
3.1.1. System’s behaviour with validationAn important aspect of the pyrolysis process is the reactor temperature, its heating rate and the vapour residence time. Whether analytical devices like the micro-pyrolyzer meet the expected fast heating rates and short residence times have not been verified. The manufacturers claim heating rates of 1000 °C/s [Proano-Aviles et al. (2016)]. High heating rates are crucial to ensure that the reactions that produce volatiles dominate. Once the vapours are formed, they have to be transported away from the reaction zone to avoid secondary cracking reactions which lower the yield [Proano-Aviles et al. (2016)]. For these reasons, it is essential to know the exact values of the heating rate and residence time. Obtaining data from experimental work regarding mentioned phenomena is time-consuming and not easily executed, if even possible. An alternative for such experimental work is obtaining a model, which would resemble the reality and allow to investigate phenomena in a critical manner. Simulations with different experimental conditions can easily be executed once a reliable working model is constructed. To check if a model behaves like the reality, validation of the model has to be performed. It is an important aspect, and this can only be done by comparing the numerical results of the model with parameters obtained experimentally on the setup, which is reflected by the model.
Due to the Corona crisis, experiments needed for the validation of the model have not been conducted. Therefore, only the construction of the model is done within this work. Nevertheless, the model is ready to be validated.
3.1.2. Real system – Py-GC/MS reactor
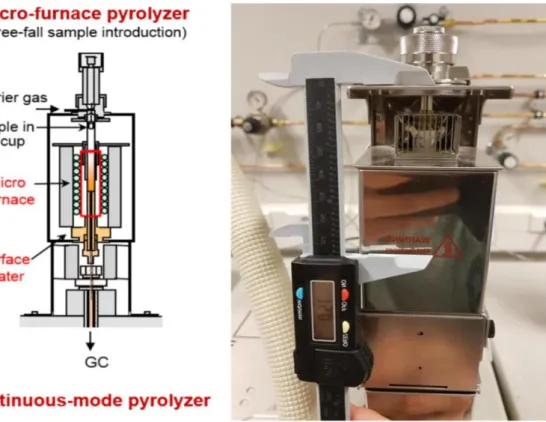
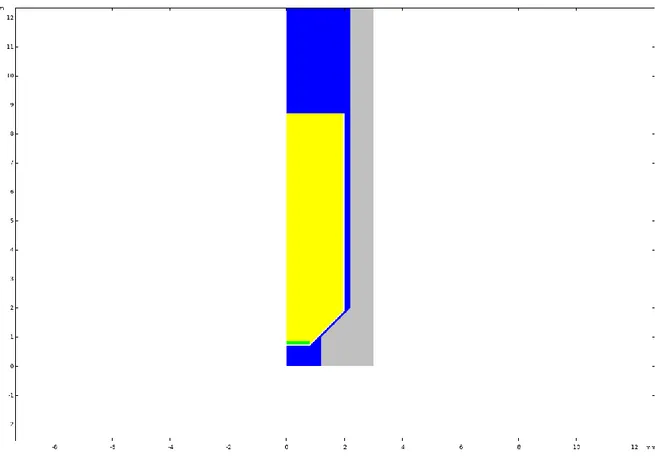
Figure 9 provides a schematic overview of the multi-shot Frontier 3030D micro-pyrolyzer on which the CFD model is based along with a photo of the setup. The pyrolyzer consists of a pyrolysis tube partly covered by a ceramic heater, and its top part is continuously cooled by a fan to keep the sample injector at room temperature. The ceramic heater quickly heats the pyrolysis tube, and its temperature is swiftly reduced by a rapid flow of room-temperature nitrogen if it is needed. The pyrolyzer is directly coupled via the interface to the injector of the GC (gas chromatography column). The temperature of the interface is controlled and usually set at 280 °C. The GC oven temperature is held at 250 °C. Evolved gases in the reactor zone are immediately introduced into the MS (mass spectrometer) with the flow of the inert carrier gas, so monitoring happens in real-time [Tank (2016)].
The typical procedure of the measurement starts with the preparation of a sample cup with 0.2-0.5 mg cellulose on the bottom of it. On top of the sample, a layer of quartz wool is added. This layer prevents the solids move out of the cup. Next, a hook is attached to the sample cup and then grabbed by the sample dropper via the hook mounted to the cup. Once the furnace is heated to the desired temperature, the sample is released by the pushing button on the sample dropper. After the release, the sample cup free-falls into the furnace and stops at the sample cup dropped position (narrowing of the reactor tube). The cup remains at this position for the duration of the experiment. From the top of the reactor tube, the carrier gas flows into the tube. In a usual experimental procedure, helium is used as the carrier gas. During the pyrolysis experiment vapours are formed, and they are carried away by the helium into the analytical instrument (e.g. GC/MS) [Proano-Aviles et al. (2016)].
28
Figure 9. Micro-pyrolyzer in schematic view (left) and photo of the real setup at the laboratory of the TCCB research group, UGent (right).
3.2. Temperature experiments
3.2.1. Aim of reactor temperature distribution measurement
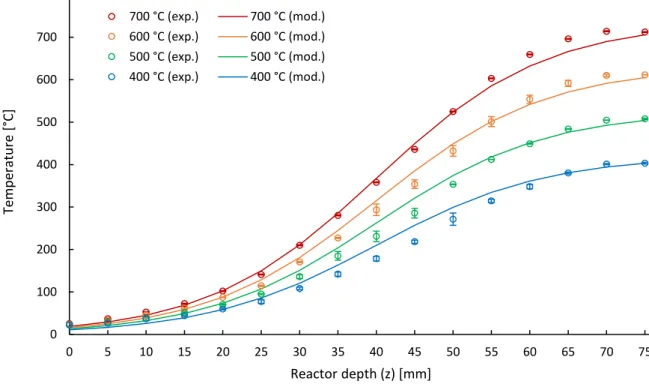
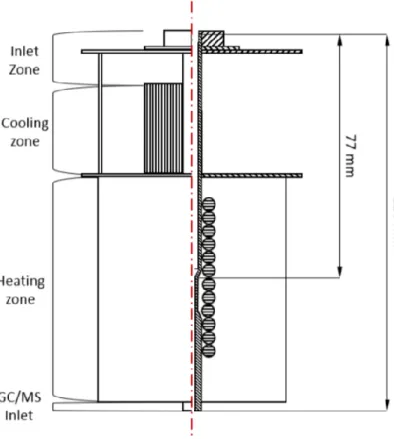
To obtain a reliable boundary condition in the CFD model, the temperature distribution along the reactor tube had to be verified experimentally. In the specification of the py-GC/MS setup, there is no indication what the effective heat transfer parameters in the reactor tube are. Moreover, sections of cooling and heating are also not indicated along with their length. Therefore, with a lack of other options, the measurement of the tube wall temperature had to be conducted experimentally. The measurement did not aim at assessing of the heating/cooling section lengths of the reactor. Instead, it aimed at obtaining the full reactor wall temperature profile that afterwards can be implemented as a boundary condition into the model. The pre-tests indicated that the inert gas flow has an insignificant influence on the temperature distribution in the reactor. Therefore, its influence was neglected in the experimental procedure.
3.2.2. Equipment used and measurement procedure
The temperatures are measured with a RS 1314 thermometer coupled with thermocouple RS PRO type K (L 150 mm and Ø 1 mm), working in the temperature range between -100 °C and 750 °C. The measurement accuracy, according to ITS-90 is 0.05 % of reading or +/- 0.5 °C.
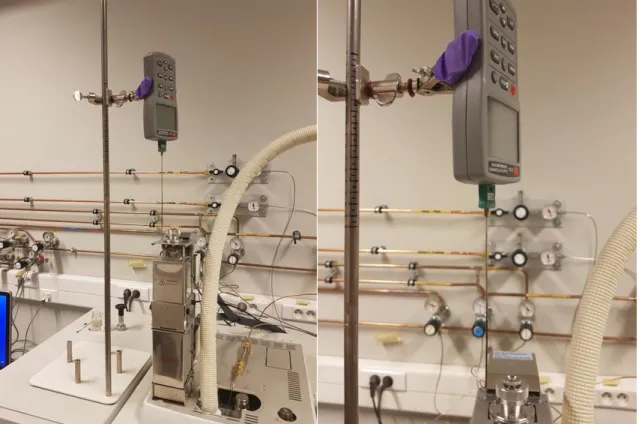
The thermometer with thermocouple was mounted to a laboratory stand via a utility clamp. The grip of the clamp was tight enough to prevent rotation or uncontrolled movement of the measuring device. A length scale was marked on the lab stand with a black marker. The precision of the marked scale was 5 mm, which was sufficient to accurately assess the depth at which the thermocouple measured the wall temperature in the vertical reactor tube. The thermocouple was vertically aligned with the lab stand prior to measurement. The setup is depicted in figure 10.
![Figure 3. Overview of different thermochemical processes [Gielo-Klepacz et al. (2017)]](https://thumb-eu.123doks.com/thumbv2/5doknet/3279217.21566/14.892.114.769.253.650/figure-overview-different-thermochemical-processes-gielo-klepacz-et.webp)
![Figure 8. CFD analysis framework [Manya (2019)].](https://thumb-eu.123doks.com/thumbv2/5doknet/3279217.21566/24.892.115.780.354.666/figure-cfd-analysis-framework-manya.webp)