Contact:
Talitha Feenstra
Department of Prevention and Health Services Research Talitha.Feenstra@rivm.nl
RIVM report 260601003/2005
Cost-effectiveness of interventions to reduce tobacco smoking in the Netherlands. An
application of the RIVM Chronic Disease Model TL Feenstra, PHM van Baal, RT Hoogenveen, SMC Vijgen, E Stolk, WJE Bemelmans
This investigation has been performed by order and for the account of the Dutch Ministry of Health, Welfare and Sport, within the framework of project 260601, “Potential health and economic gains of policy for smoking reduction”.
Rapport in het kort
Kosteneffectiviteit van tabaksontmoedigingsbeleid in Nederland. Een toepassing van het RIVM Chronische Ziekten Model.
Accijnsverhogingen, massamediale campagnes en individuele ondersteuning bij stoppen met roken zijn alle doelmatige vormen van preventie. Een accijnsverhoging is de meest
doelmatige maatregel vanuit het gezondheidszorgperspectief. Deze maatregel levert veel gezondheidswinst op tegen relatief lage kosten voor de gezondheidszorg.
Roken is in Nederland de belangrijkste risicofactor voor voortijdige sterfte en leidt tot veel gezondheidsverlies. Het Ministerie van VWS streeft daarom naar minder rokers. Bij
volwassenen richt het beleid zich vooral op de bevordering van het stoppen met roken. Bij jongeren is preventie belangrijk. Dit rapport biedt inzicht in de kosteneffectiviteit van diverse effectieve interventiemogelijkheden bij volwassenen.
Iemand die stopt met roken loopt minder risico op een aan roken gerelateerde ziekte, en zal gemiddeld genomen langer leven. De gezondheidswinst van stoppen met roken is gemeten in zogeheten Quality Adjusted Life Years (QALYs), voor kwaliteit van leven gecorrigeerde levensjaren. Een winst van 1 QALY staat gelijk aan een extra jaar leven in goede gezondheid. In de extra levensjaren zullen ook zorgkosten optreden. Om de doelmatigheid van het
tabaksontmoedigingsbeleid te beoordelen vanuit het gezondheidszorg perspectief zijn deze kosten en de kosten van verschillende beleidsmaatregelen afgezet tegen de besparingen bij rookgerelateerde ziektes en de gezondheidswinst.
De kosteneffectiviteit van massamediale campagnes ligt dan beneden de 10.000 per QALY en voor een accijnsverhoging rond de 5000 per QALY. Een gestructureerd advies door de huisarts is de doelmatigste vorm van individuele hulp bij stoppen met roken en kost
ongeveer 9000 per QALY. Zonder kosten in gewonnen levensjaren mee te rekenen zijn deze interventies kostenbesparend.
De conclusie is dat maatregelen om het stoppen met roken te bevorderen bij volwassenen doelmatige vormen van preventie zijn, met een gunstige kosteneffectiviteit, zelfs als de kosten in gewonnen levensjaren zijn meegeteld.
Trefwoorden: kosteneffectiviteitsanalyse; tabaksontmoediging; roken; modellering; primaire preventie
Abstract
Cost-effectiveness of interventions to reduce tobacco smoking in the Netherlands. An application of the RIVM Chronic Disease Model.
Introduction Smoking is the most important single risk factor for mortality in the
Netherlands and has been related to 12% of the burden of disease in Western Europe. Hence the Dutch Ministry of Health has asked to assess the cost-effectiveness of interventions to enhance smoking cessation in adults.
Objective To evaluate eight interventions for smoking cessation, namely increased tobacco taxes, mass media campaigns, minimal counseling, GP support, telephone counseling, minimal counseling plus nicotine replacement therapy, intensive counseling plus nicotine replacement therapy and intensive counseling plus bupropion.
Methods Costs per smoker were estimated based on bottom-up cost analysis. Combined with effectiveness data from meta-analyses and Dutch trials this gave us costs per quitter. To estimate costs per quality adjusted life year (QALY) gained, scenarios for each intervention were compared to current practice in the Netherlands. A dynamic population model, the RIVM Chronic Disease Model, was used to project future health gains and effects on health care costs. This model allows the repetitive application of increased cessation rates to a population with a changing demographic and risk factor mix, and accounts for risks of relapse and incidence of smoking related diseases that depend on time since cessation. Sensitivity analyses were performed for variations in costs, effects, time horizon, program size and discount rates.
Results: A tax increase was the most efficient intervention with zero intervention costs from the health care perspective. Additional tax revenues resulting from a 20% tax increase were about 5 billion euro. Costs per smoker for a mass media campaign were relatively low ( 3,-), and costs per QALY were below 10.000. The effectiveness of these two population
measures was uncertain. Costs per smoker for individual cessation support varied from 5 to almost 400. Although all individual interventions had proven effectiveness, the cheapest intervention had an effect that did not differ significantly from current practice cessation rates. Compared to current practice, cost-effectiveness ratios varied between about 8,800 for structured GP stop-advice (H-MIS) to 21,500 for telephone counseling for implementation periods of 5 years.
Discussion and conclusions: All smoking cessation interventions were cost-effective compared to current practice. Comparison of interventions is difficult, especially for population and individual interventions, because they are often applied in combination. Taking that into account, taxes seem to provide most value for money, especially since additional tax revenues outweigh the health care costs in life years gained.
Keywords: cost-effectiveness analysis; tobacco control; smoking; modelling; primary prevention
Voorwoord
Het RIVM heeft voor het Ministerie van Volksgezondheid, Welzijn en Sport de kosteneffectiviteit van het tabaksontmoedigingsbeleid geëvalueerd. Daarvoor zijn de gezondheidswinst en de effecten op de kosten van zorg van verschillende interventies
geraamd met het RIVM Chronische Ziekten Model, en gecombineerd met schattingen van de interventiekosten. Dit rapport beschrijft de kosteneffectiviteit van maatregelen om stoppen met roken bij volwassenen te bevorderen. In het bijbehorende rapport ‘Potential health benefits and cost effectiveness of tobacco tax increases and school intervention programs targeted at adolescents in the Netherlands’ door van Baal en co-auteurs, eveneens verschenen in 2005 (RIVM rapport 260601002) staan de resultaten voor maatregelen bij jongeren. De twee rapporten samen vormen het antwoord op de kennisvraag ‘Potentiële gezondheids- en economische winst bij het realiseren van de huidige en toekomstige beleidsdoelstellingen op het terrein van tabaksontmoediging’ (no 2.04-05.4), onderdeel van het RIVM
onderzoeksprogramma ‘Beleidsondersteuning Volksgezondheid en Zorg’.
Diverse mensen binnen en buiten het RIVM hebben een belangrijke bijdrage geleverd aan het tot stand komen van dit rapport. We willen als eerste onze dank uitspreken aan de mensen die hebben geparticipeerd in het expertpanel. Voor een aantal maatregelen voor individuele ondersteuning bij stoppen met roken hebben we voortgebouwd op onze eerdere berekeningen voor het Partnership Stoppen met Roken. Maureen Rutten en Heleen Hamberg zijn co-auteurs van dat onderzoek. Tevens willen we Monique Jacobs, Monique Verschuren, Claartje Aarts en de mensen van Bureau Rapporten Registratie van het RIVM bedanken voor het kritisch lezen en becommentariëren van dit rapport.
Contents
Samenvatting 9
1. Introduction 21
2. Methods 23
2.1 Selection of interventions 23
2.2 Effectiveness in terms of increased cessation 24
2.3 Intervention costs 25
2.4 Long term effects in the RIVM Chronic Disease Model 25
2.5 Cost Effectiveness 28
3. Age specific effects of cessation on health gains for three example scenarios 29
4. Results 33
4.1 Short term effects of interventions 33
4.2 Costs of interventions 34
4.3 Long term effects of interventions, the CDM outcomes 34
4.4 Cost effectiveness 38
5. Discussion and conclusions 43
5.1 Main findings 43
5.2 Comparing the effectiveness of the different interventions 44
5.3 Methodological issues 45
5.4 Comparison to other studies 45
5.5 Policy implications 46
References 49
Appendix A Selection of interventions 55
Appendix B Cost estimates 57
Appendix C Current Practice Scenario 59
Samenvatting
InleidingAccijnsverhogingen, massamediale campagnes en individuele ondersteuning bij stoppen met roken kosten allemaal minder dan 20.000 per gewonnen (voor kwaliteit van leven
gecorrigeerd) levensjaar en zijn daarmee doelmatige vormen van preventie. Alle maatregelen leiden tot minder ziekte en een langere levensverwachting. De levensverwachting neemt toe met de intensiteit en duur van de maatregel.
Roken is in Nederland de belangrijkste risicofactor voor voortijdige sterfte en leidt tot veel gezondheidsverlies. In West-Europa is roken de belangrijkste risicofactor in termen van ziektelast. Roken is gerelateerd aan 12% van de ziektelast in West-Europa. Het Ministerie van VWS streeft naar een verdere daling van het percentage rokers in Nederland tot 25% eind 2007. Bij volwassenen kan dat door stoppen met roken te bevorderen. Inzicht in de
kosteneffectiviteit van diverse effectieve interventiemogelijkheden kan VWS ondersteunen in haar tabaksbeleid. De kosteneffectiviteit is geschat voor acht interventies:
• accijnsverhoging,
• massamediale campagnes, • kort stopadvies,
• stopadvies volgens protocol door de huisarts (H-MIS), • telefonische counseling,
• kort stopadvies met nicotinekauwgum of –pleisters, • intensieve counseling met nicotinekauwgum of –pleisters, • intensive counseling met bupropion.
Daarvoor zijn de gezondheidswinst en de effecten op de kosten van zorg van verschillende interventies geraamd met het RIVM Chronische Ziekten Model (CZM), en gecombineerd met schattingen van de interventiekosten.
Tabel A.1 in Appendix A geeft een overzicht van onderzochte interventies om stoppen met roken te bevorderen die in Nederland beschikbaar zijn. De effectiviteit van deze acht interventies was bewezen. Andere interventies waren niet bewezen effectief na 12 maanden of de effectiviteit was zo laag dat er in modelanalyses geen effect was ten opzichte van het referentiescenario. Hierbij moet wel worden aangetekend dat voor accijnsverhogingen en massamediale campagnes (de interventies op bevolkingsniveau) lagere eisen zijn gesteld aan de zwaarte van het bewijs van effectiviteit. Voor deze interventies is onderzoek met een controlegroep niet mogelijk en is effectiviteit geschat uit internationale tijdreeksanalyses voor accijnzen en een combinatie van tijdsreeksen met gegevens uit Amerikaanse studies voor massamediale campagnes (zie ook Appendix A).
Dat betekent dat voorzichtigheid geboden is bij het vergelijken van resultaten voor
maatregelen op bevolkingsniveau en individuele stopondersteuning. Een extra reden daarvoor is dat in werkelijkheid maatregelen meestal in combinatie voorkomen, terwijl ze hier apart
zijn doorgerekend. Het evalueren van combinatiepakketten is daarom een interessant onderwerp voor vervolgonderzoek. Het huidige onderzoek geeft nuttige informatie voor de samenstelling van zulke pakketten met meerdere maatregelen.
Effectiviteit en kosten van de interventies
De kosten per roker voor de maatregelen varieerden van 0 (accijnsverhogingen zijn gratis vanuit het perspectief van de gezondheidszorg) tot bijna 400. De effectiviteit van de maatregelen voor individuele stopondersteuning is geschat bij gebruik door 25% van de rokers, dat is het percentage wat aangeeft te overwegen om te stoppen. De resultaten op populatieniveau varieerden van maximaal 10.000 minder rokers in een jaar voor een kort stopadvies, tot bijna 300.000 minder rokers voor intensieve individuele stopondersteuning. Voor de maatregelen op bevolkingsniveau was in de meest optimistische schatting een zelfde daling van ongeveer 300.000 rokers haalbaar, maar die kon ook beperkt blijven tot 25.000 rokers voor massamediale campagnes en 100.000 voor een accijnsverhoging.
Tabel 1 presenteert de effectiviteit, kosten en inhoud van de interventies, zoals gebruikt in de scenarioanalyses. Op basis hiervan zijn de kosten per stopper te berekenen (zie Tabel 2). Het effect van massamediale campagnes op het aantal rokers dat stopt is lastig vast te stellen. De effecten zijn veelal indirect, bijvoorbeeld via het beïnvloeden van de sociale norm. Het lijkt het meest waarschijnlijk om voor het effect van massamediale campagnes uit te gaan van een daling van het percentage rokers tussen de 0,5 en 1,0 procentpunt. Vanwege de onzekerheid bij het bepalen van het precieze effect van massamediale campagnes is de effectrange uitgebreid tot een daling tussen 0,2 procentpunt en 2,1 procentpunt (voor meer details zie paragraaf 2.2 en Appendix A).
Omschrijving en discussie van de scenario’s
Voor elke interventie is een zogenaamd ‘best guess’ scenario opgesteld en doorgerekend met het Chronische Ziekten Model (CZM). In deze ‘best guess’ scenario’s worden de individuele interventies voor een periode van 5 jaar toegepast bij 25% van de rokers. Voor de
massamediale campagne (MMC) is geen ‘best guess’ scenario opgesteld, maar zijn de resultaten berekend voor een mogelijke daling in het percentage rokers tussen de 0,2 en 2,1 procentpunt.
Voor de accijnzen is het ‘best guess’ scenario als volgt: een éénmalige accijnsverhoging van 20% veroorzaakt in het eerste jaar een daling van de prevalentie van roken van
1,2 procentpunt door een toename van het aantal stoppers. In de volgende jaren neemt het effect van de prijsverhoging op rookgedrag langzaam af. Naarmate rokers langer zijn gewend aan de verhoogde prijs, wordt hun kans om te stoppen minder beïnvloed door de prijsstijging. Voor de individuele ondersteuning gaat het ‘best guess’ scenario uit van de gemiddelde toename van de stopkans. Die hogere stopkans leidt 5 jaar lang tot meer stoppers, daarna is de stopkans weer als in het referentiescenario.
Tabel 1: Geëvalueerde maatregelen, effectiviteit en kosten per roker
Naam (afkorting) Effectiviteit (% stoppers na 12 maanden in de interventiegroep.) Kosten per Roker Inhoud
Maatregelen op individueel en groepsniveau
Kort stopadvies (MC) 4,4% (2,5 – 6,2) 5 Kort eenmalig stopadvies door huisarts of assistent, 1 tot 12 minuten.
Minimaal advies door de
huisarts (H-MIS) 7,9% (4,7 – 15) 26 Advies door huisarts en/of assistent, in 1 of 2 consulten, volgens protocol met 5 stappen. Telefonische Counseling
(TC) 9% (5,8 –12) 130 Intakegesprek van 30 minuten en 2 tot 8 vervolgtelefoontjes van 15 minuten elk. Gebaseerd op computergestuurde vragenlijst. Verzorgd door STIVORO.
H-MIS met nicotine vervangende middelen (NRT)
13,5% (8,9 – 18) 180 Kort stopadvies gevolgd door
nicotinekauwgum of –pleisters gedurende gemiddeld 8 weken.
Intensieve counseling
(IC)+NRT 22% (17 – 27) 390 Intensieve ondersteuning (40-110 minuten in totaal) door een speciaal hiervoor opgeleide counselor in combinatie met
nicotinekauwgum of –pleisters gedurende gemiddeld 12 weken.1 2
IC+Bupropion (BU) 17% (13 – 20) 370 Intensieve counseling in combinatie met het antidepressivum bupropion gedurende gemiddeld 9 weken.
Maatregelen op bevolkingsniveau Massamediaal: Nederland
start met stoppen/Dat kan ik ook. (MMC)
Prevalentiedaling van 0,2 tot 2,1 procentpunt na 1 jaar, daarna geen effect op stopkansen.
3 Brede media-aandacht via televisie, kranten, brochures en aanplakborden in abri’s. Verwijzing naar diverse vormen van ondersteuning.
Accijnsverhoging Prevalentiedaling van 3 tot 10% in jaar na
accijnsverhoging, daarna langzaam uitdoven effect.
0 Accijnsverhoging op tabaksproducten.
Tabel 2: Kosten per stopper
Maatregel (zie Tabel 1 voor afkortingen)
Kosten per stopper (‘best guess’ scenarios) MC 1.000 H-MIS 600 TC 4.300 H-MIS+ NRT 2.200 IC+NRT 3.000 IC+BU 3.000 MMC 25 - 280 Accijns 0
Voor de accijnsverhogingen en massamediale campagnes is de effectiviteit op korte termijn, in termen van lagere aantallen rokers, omgeven door veel onzekerheid. Bij de individuele interventies is de effectiviteit in termen van stopkansen minder onzeker. Bij die interventies ontstaat onzekerheid bij het overzetten van de stopkansen uit de internationale literatuur naar de Nederlandse situatie voor de scenarioberekeningen.
Uiteindelijk zijn voor alle interventies meerdere scenario’s geformuleerd die verschillen in de grootte van het veronderstelde effect op het aantal rokers. Die zijn te vinden in de hoofdtekst van het rapport. In de tabellen in deze samenvatting zijn de onzekerheidsranges alleen aangeven voor de belangrijkste resultaten.
Het RIVM Chronische Ziekten Model is een dynamisch populatiemodel dat voor een langere periode de incidentie van 14 aan roken gerelateerde ziektes berekent aan de hand van
leeftijds- en geslachtsspecifieke rookcijfers en de ontwikkelingen daarin. Daarmee schat het model de prevalentie van ziektes, de gemiddelde kwaliteit van leven, de sterfte en de kosten van zorg. Projecties met het CZM leveren ramingen van de gezondheidswinst per jaar in termen van gewonnen, voor kwaliteit van leven gecorrigeerde, levensjaren (QALYs),a én ramingen van de effecten op de kosten van zorg. Deze zijn geschat door de uitkomsten van het CZM te vergelijken met een referentiescenario waarin geen aanpassingen zijn gemaakt. Voor deze kennisvraag is het CZM verbeterd, zodat de kans op terugval na stoppen en de risico’s op rookgerelateerde aandoeningen bij ex-rokers nu langzaam afnemen in de tijd. Ook zijn alle belangrijke invoergegevens herzien. Meer uitleg over het model staat in Appendix C.
Als basis voor de ramingen dient een referentiescenario dat is geschat op basis van recente NIPO cijfers (zie Figuur 1). De gemiddelde stopkans bij volwassenen was 5%. Dat is in dezelfde orde van grootte als in de literatuur is te vinden voor de kans op succes bij een stoppoging zonder verdere ondersteuning. Het huidige aanbod van de meeste maatregelen is veel lager dan in de interventiescenario’s, die uitgaan van een aanbod aan 25% van de rokers. Gegevens over het huidige gebruik van maatregelen zijn lastig te vinden. In een eerdere analyse werd dit geschat op minder dan 1,5% van de rokers. Dat geldt uiteraard niet voor accijnsverhogingen en massamediale campagnes. Beide zijn in het recente verleden
toegepast. Hoewel het referentiescenario is gebaseerd op gegevens over de jaren 2001, 2002 en 2003 kunnen we toch niet uitsluiten dat daarin effecten doorwerken van de campagnes in 1999/2000 en in 2003/2004 en van de accijnsverhoging in februari 2004. Daarnaast was er andere regelgeving. Dit zou kunnen betekenen dat ons referentiescenario aan de optimistische kant is. Dat heeft verder weinig invloed op de basisramingen van de kosteneffectiviteit en op de geschatte gezondheidswinsten, omdat die uitgaan van verschillen tussen
interventiescenario’s en het referentiescenario.
aQALYs staan voor het aantal levensjaren die zijn gewogen voor de kwaliteit van leven (QALYs: Quality Adjusted Life Years). Een QALY gewicht van 0 is gelijk aan dood en 1 aan volledig gezond. Waarden van een QALY tussen 0 en 1 betekenen dat een levensjaar is doorgebracht in onvolledige gezondheid. Het totaal aantal gewonnen QALYs is een maat voor de winst in zowel kwaliteit als kwantiteit van leven.
2020 2040 2060 2080 Jaar 0.2 0.4 0.6 0.8 1 Fracties Ex rokers Rokers Nooit rokers
Figuur 1: Modelprojecties van het referentiescenario: nooit-rokers, rokers en ex-rokers als fractie van de populatie van 15 jaar en ouder
Resultaten en discussie van de uitkomsten
Alle maatregelen hebben een kosteneffectiviteit beneden de 20.000 per QALY. De
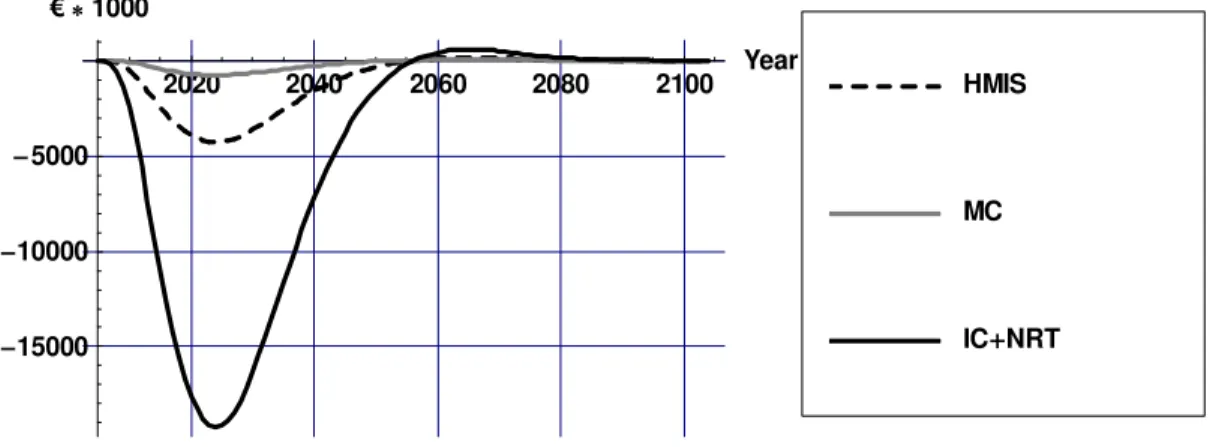
doelmatigheid is voorzichtig geschat. In de resultaten zijn de effectenop alle kosten van zorg meegenomen, inclusief de extra kosten voor ziektes die ontstaan in de gewonnen levensjaren. Figuur 2 geeft de verschillen in het aantal rokers weer tussen het referentiescenario en het ‘best guess’ scenario voor ‘minimal counseling’ (MC, kort stopadvies), gestructureerd stopadvies door de huisarts (H-MIS), en intensieve counseling in combinatie met nicotine vervangende middelen (IC+NRT).
2020 2040 2060 2080 2100 Year 300000 250000 200000 150000 100000 50000
Verschil in aantal rokers
IC NRT MC HMIS
Figuur 2: Verschillen in het aantal rokers voor ‘best guess’ scenario’s vergeleken met het referentiescenario
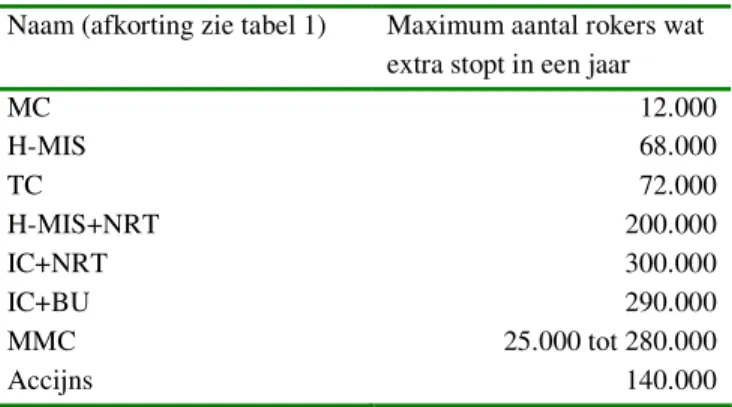
Het aantal rokers daalt door de interventies. Na afloop van de interventies neemt het verschil in het aantal rokers langzaam af, doordat gestopte rokers weer opnieuw beginnen en nieuwe rokers bijkomen. Voor de andere interventies is er een vergelijkbaar verloop in het aantal rokers. In Tabel 3 staat het maximale verschil in het aantal rokers per maatregel, zoals geraamd door het Chronische Ziekten Model.
Tabel 3: Maximum jaarlijks verschil in rokers tussen interventiescenario en referentiescenario
Naam (afkorting zie tabel 1) Maximum aantal rokers wat extra stopt in een jaar
MC 12.000 H-MIS 68.000 TC 72.000 H-MIS+NRT 200.000 IC+NRT 300.000 IC+BU 290.000 MMC 25.000 tot 280.000 Accijns 140.000
De gezondheidswinst van de maatregelen is geschat door het aantal levensjaren/QALYs in het referentiescenario af te trekken van het aantal levensjaren/QALYs in het ‘best guess’ scenario. Figuur 3 geeft weer hoe de gezondheidswinst verdeeld is over de tijd voor de H-MIS (gestructureerd stopadvies door de huisarts) en voor intensieve counseling met nicotine vervangende middelen (IC+NRT).b Door de interventies daalt het aantal rokers, dit zorgt voor een daling in rookgerelateerde ziekten na een aantal jaren. De kwaliteit van leven en de levensverwachting nemen toe . Voor alle andere interventies vertoont de
gezondheidswinst een vergelijkbaar verloop, met de grootste winst na ongeveer 30 jaar. De hoogte van de maximale gezondheidswinst varieert. Het meeste resultaat is uiteraard zichtbaar bij effectievere maatregelen. Op korte termijn wordt winst in kwaliteit van leven geboekt door het vermijden van rookgerelateerde ziekten: mensen worden niet ziek. Dat vertaalt zich pas op iets langere termijn in een winst in levensjaren: mensen overlijden later. De winst in levensjaren is op langere termijn hoger dan de winst in kwaliteit van leven, omdat op oudere leeftijd de kwaliteit van leven afneemt, door het optreden van vervangende ziektes.
Figuur 4 toont het verschil in zorgkosten van rookgerelateerde ziekten ten opzichte van het referentiescenario. Voor alle kosten rekenen we in euro’s, met het prijsniveau van 2004. Voor de andere interventies vertoont de hoogte van de kosten een vergelijkbaar tijdsverloop. De daling in rookgerelateerde ziekten zorgt voor een daling in de zorgkosten daarvan. Omdat sommige rookgerelateerde ziekten (bijvoorbeeld hart en vaatziekten) ook sterk van de leeftijd afhangen, is er na ongeveer 60 jaar een kleine toename in de kosten.
bIn de figuren 3 tot en met 7 zijn effecten die optreden in de toekomst met 4% per jaar gedisconteerd.
Disconteren houdt in dat kosten en effecten in de toekomst minder worden gewaardeerd dan kosten en effecten in het heden.
2020 2040 2060 2080 2100 Year 1000 2000 3000 4000 gezondheidswinstper jaar IC NRT LYG IC NRT QALY HMIS LYG HMIS QALY
Figuur 3: Gezondheidswinst in LYG en QALYs voor ‘best guess’ scenario’s vergeleken met het referentiescenario 2020 2040 2060 2080 2100 Year 15000 10000 5000 1000 IC NRT MC HMIS
Figuur 4: Verschil in kosten van rookgerelateerde ziekten in ‘best guess’ scenario’ s vergeleken met het referentiescenario
Figuur 5 toont het verschil in totale zorgkosten. Tot ongeveer 25 jaar na implementatie van de interventies zijn de totale zorgkosten lager in het interventiescenario vergeleken met het referentiescenario. Uiteindelijk overheersen de kosten van niet aan roken gerelateerde ziekten in gewonnen levensjaren. Dat komt dan vooral door hoge kosten in de verre toekomst. De interventiekosten voor MMC en voor de individuele stopondersteuning gedurende de looptijd (1 of 5 jaar) zijn niet in de figuren ingetekend. Ze staan wel in Tabel 4 die een overzicht geeft van de totale effecten op kosten en gezondheid. Deze totalen zijn berekend door de gedisconteerde kosten en effecten in alle jaren bij elkaar op te tellen.
2020 2040 2060 2080 2100 Year 10000 5000 5000 10000 15000 20000 25000 1000 IC NRT MC HMIS
Figuur 5: Verschil in totale zorgkosten in ‘best guess’ scenario’ s vergeleken met het referentiescenario (exclusief interventiekosten
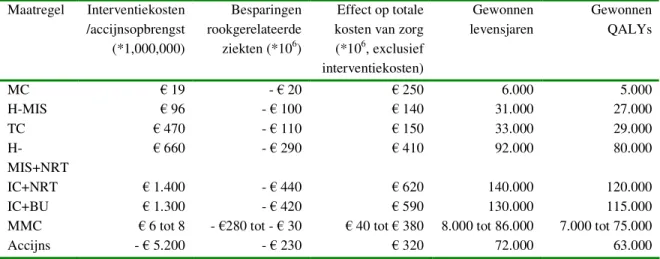
Tabel 4: Totale effecten op gezondheid en kosten (netto contante waarde, over 100 jaar, 4% disconto, prijsniveau 2004) Maatregel Interventiekosten /accijnsopbrengst (*1,000,000) Besparingen rookgerelateerde ziekten (*106) Effect op totale kosten van zorg (*106, exclusief interventiekosten) Gewonnen levensjaren Gewonnen QALYs MC 19 - 20 250 6.000 5.000 H-MIS 96 - 100 140 31.000 27.000 TC 470 - 110 150 33.000 29.000 H-MIS+NRT 660 - 290 410 92.000 80.000 IC+NRT 1.400 - 440 620 140.000 120.000 IC+BU 1.300 - 420 590 130.000 115.000
MMC 6 tot 8 - 280 tot - 30 40 tot 380 8.000 tot 86.000 7.000 tot 75.000
Accijns - 5.200 - 230 320 72.000 63.000
Door deze gegevens met elkaar te combineren zijn de kosten per gewonnen levensjaar en per gewonnen QALY geschat. In Tabel 5 staan de kosten per gewonnen QALY voor ‘best guess’ scenario’ s. Meer details zijn te vinden in de hoofdtekst en de appendices. De uiteindelijke doelmatigheid is voorzichtig geschat door in de resultaten de effecten op alle kosten van zorg mee te nemen, inclusief extra kosten voor ziektes die ontstaan in de gewonnen levensjaren.
Tabel 5: Kosteneffectiviteitsratio’ s voor de lange termijn (100 jaar, 4% disconto, prijsniveau 2004) Maatregel (afkortingen zie tabel 1) Interventie- kosten per QALY
Interventiekosten minus besparingen in zorgkosten voor rookgerelateerde ziekten per QALY
Interventiekosten plus totale zorgkosten per QALY
MC 3.900 200 9.100
H-MIS 3.600 Kosten besparend 8.800
TC 16.000 12.600 21.500
H-MIS+NRT 8.200 4.500 13.400
IC+NRT 11.000 7.700 16.600
IC+BU 11.000 7.700 16.600
MMC 25 tot 280 Kosten besparend 5.200 tot 6.100
Accijns 0 Kosten besparend 5.100
In gevoeligheidsanalyses is bekeken of de resultaten gevoelig zijn voor aannames in de ‘best guess’ scenario’ s. Figuur 6 toont de kosten per gewonnen QALY voor massamediale
campagnes, uitgezet tegen mogelijke effecten van een campagne op het aantal rokers in het jaar na de campagne.
0.25 0.5 0.75 1 1.25 1.5 1.75 2 Daling rokers in procentpunten
2500 5000 7500 10000 12500 15000 17500 20000 re p YL A Q
Figuur 6: Kosteneffectiviteit van massamediale campagnes als functie van het effect op het aantal rokers
Al bij een relatief klein effect ligt de kosteneffectiviteit van een massamediale campagne beneden de 10.000 per gewonnen QALY. De doelmatigheid is dan redelijk groot, omdat de kosten van een campagne in termen van kosten per roker tamelijk laag zijn (rond de 3). Alleen als campagnes nauwelijks effect zouden hebben schiet de kosteneffectiviteitsratio omhoog want dan wordt het geld voor niets uitgegeven. In tegenstelling tot de
kosteneffectiviteit is de totale gezondheidswinst in de bevolking uiteraard wél afhankelijk van het effect van een massamediale campagne. Het maximale aantal gewonnen QALYs varieert tussen de 7.100 en 75.000 (zie Tabel 4), bij een daling van de rokersprevalentie van respectievelijk 0,2 en 2,1 procentpunten.
Figuur 7 presenteert de ramingen van de totale kosten en gezondheidseffecten in een figuur met op de horizontale as de cumulatieve gezondheidswinst en op de verticale de extra kosten ten opzichte van het referentiescenario. De ‘best guess’ schattingen staan hierin samen met een onzekerheidsmarge. Hoe meer een maatregel rechts-onderin staat, hoe doelmatiger hij is (meer effecten en minder kosten). De twee lijnen duiden de kosteneffectiviteitswaarden aan van 10.000 per QALY (de doorgetrokken lijn) en 20.000 per QALY (de stippellijn). De figuur laat zien dat de verschillen in de kosteneffectiviteit van de verschillende maatregelen niet heel groot zijn en dat de onzekerheidsmarges elkaar deels overlappen. De
onzekerheidsmarges in de effecten van de populatiemaatregelen zijn groot. De goedkoopste maatregelen (accijnzen, MMC, MC en H-MIS) lijken tevens het meest doelmatig, met in het algemeen waarden beneden de 10.000 per QALY. De intensievere vormen van individuele ondersteuning bij stoppen met roken (TC, MC+NRT, IC+NRT en IC+BU) hebben waarden tussen de 10.000 en 20.000 euro per QALY. De verschillen zijn echter klein, zeker als de onzekerheid in acht wordt genomen.
0 25000 50000 75000 100000 125000 150000 175000 Effecten QALYs 0 5 108 1 109 1.5 109 2 109 2.5 109 3 109 3.5 109 net so K ni or ue MMC Accijnzen TC IC BU IC NRT MC NRT H MIS MC 20,000 per QALY 10,000 per QALY
Figuur 7: Cumulatieve kosten en effecten met onzekerheidsmarges
Om de uitkomsten in perspectief te plaatsen geeft Tabel 6 een overzicht van resultaten uit de literatuur voor andere preventiemaatregelen waarvoor Nederlandse gegevens beschikbaar waren. Deze kunnen het beste worden vergeleken met de middelste kolom van Tabel 5, omdat kosten in gewonnen levensjaren meestal niet zijn meegerekend. Ook dan is voorzichtigheid altijd geboden bij het vergelijken van verschillende
kosteneffectiviteitsratio’ s, omdat er grote verschillen kunnen zijn in tijdstip en methode van berekeningen. Daarnaast moet de onzekerheid rond de schattingen niet vergeten worden. Het is daarom beter om te denken in ordes van grootte, dan te kijken naar kleine verschillen in de kosteneffectiviteit.
Tabel 6: Kosteneffectiviteit voor enkele preventiemaatregelen
Preventiemaatregel Kosteneffectiviteit Bron en opmerkingen
Laag intensieve ondersteuning stoppen met
roken <0 tot 10.000 Dit rapport
Intensieve ondersteuning stoppen met roken 10.000 tot 30.000 Dit rapport Maatregelen op bevolkinsniveau tegen roken <0 tot 1000 Dit rapport Behandeling hoge bloeddruk met bèta-blokkers en
anti-diuretica in laag-gemiddeld risico 1000-10.000
3
Idem met ACE remmers 10.000-100.000 3
Rijksvaccinatieprogramma <0 3
Griep-vaccinatie bij ouderen 1.000-10.000 4 56
Pneumokokken vaccinatie ouderen 10.000-100.000 4 7
Cholesterol test plus dieet advies 1000-10.000 3
Statines bij HVZ-patiënten 10.000-100.000 3
Statines voor primaire preventie 15.000-25.000 Volgens oude richtlijn, met merkmedicatie.8
Borstkankerscreening 1.000-10.000 3
HPV- bij baarmoederhalskankerscreening 5.000-50.000 5 9
Defribillator bij brandweer en politie 10.000-50.000 5 10
Conclusie
In dit rapport hebben we de gezondheidswinst en kosteneffectiviteit geschat van acht maatregelen om stoppen met roken bij volwassenen te bevorderen. Met het CZM waren niet alleen de kortetermijneffecten op het aantal rokers te bepalen, maar ook de langetermijn-gezondheidswinst en -effecten op de kosten van zorg. Daarmee was de kosteneffectiviteit van de maatregelen in euro’s per gewonnen levensjaar en QALY te bepalen.
Alle maatregelen hebben kosten per QALY beneden de 20.000. De verschillen in
doelmatigheid tussen de maatregelen zijn klein (zie Figuur 7). Een accijnsverhogingen is de doelmatigste maatregel. Deze maatregel is gratis vanuit het gezondheidszorgperspectief. De kosteneffectiviteit van accijnsverhogingen is ongeveer 5.100 per gewonnen QALY. Dit is inclusief medische kosten in gewonnen levensjaren en exclusief een eventuele toename in accijnsopbrengsten. De geschatte additionele accijnsopbrengsten als gevolg van een prijsverhoging compenseren ruimschoots de medische kosten in gewonnen levensjaren. Daarnaast kunnen de opbrengsten gebruikt worden om andere stoppen-met-roken
maatregelen te financieren. De kosteneffectiviteit van massamediale campagnes ligt beneden de 10.000 per gewonnen QALY. De kosten van een campagne, ongeveer 7,5 miljoen euro, zijn per roker tamelijk laag (rond de 3). De kosten van de individuele stopondersteunende maatregelen lopen uiteen van 5 per roker voor een kort stopadvies tot bijna 400 voor intensieve counseling met nicotinevervangers of bupropion. De basisschattingen voor de kosten per gewonnen QALY voor kort stopadvies (MC), gestructureerd stopadvies door de huisarts (H-MIS), telefonische counseling (TC), MC met nicotinevervangende middelen, intensieve counseling (IC) met nicotinevervangende middelen en IC met bupropion zijn achtereenvolgens 9.100, 8.800, 21.500, 13.400, 16.600 en
16.600. Daarmee zijn de twee goedkoopste maatregelen, MC en H-MIS, ook de doelmatigste individuele interventies, maar de verschillen in doelmatigheid zijn klein.
1. Introduction
Smoking is a leading cause of preventable morbidity and mortality in terms of increased risks of many diseases, loss of quality of life and loss of life-years. In the Netherlands, smoking is the single determinant with the highest burden of disease, being related to about 15% of mortality and morbidity.3 The World Bank estimated that 6% to 15% of total health care costs were attributable to smoking in high income countries. 11
For many smokers, it is hard to quit smoking on will power alone. Only 3-7% of the smokers who attempt to stop smoking on will power are still abstinent after one year.12-14 A wide range of policy measures and therapies is available to increase this rate, varying from price increases by taxation, media campaigns, or self-help manuals, to intensive individual counseling combined with pharmaceutical therapies.14 The percentage of sustained quitters ranges from 4% up to 22%, while the additional percentages of quitters compared to a ‘do-nothing’ option range from 0.5% to 13%.15-19
Tobacco control potentially decreases the burden of disease substantially. Tobacco control policy will aim to reduce the number of smokers, either by increasing smoking cessation or by decreasing the initiation of smoking. Most smokers start when they are young. The majority of smokers have started before age 20. Tobacco control targeting at adults will hence focus on smoking cessation. This will be the topic of the current report. Tobacco control targeting at adolescents has been evaluated in Van Baal et al.20
In addition to the health advantages of smoking cessation, policy makers will also be
interested in intervention costs and effects on the costs of care, both for the various measures in comparison to each other and for tobacco control in general in comparison to other
prevention policies.
The present report aims to examine cost-effectiveness of smoking cessation interventions at the individual level, for instance counseling and nicotine gum, and those targeting all adults, for instance tobacco tax increases. Extra attention was paid to effects on healthcare costs. Different cessation interventions were compared to current practice to report incremental cost-effectiveness ratios. The purpose of the study was to support the Dutch Ministry of Health in its tobacco control policy. A computer simulation model, the RIVM Chronic Disease Model (CDM), was used to project the future gains in life-years, QALYs, and the savings in healthcare costs that result from a decrease in the incidence of smoking-related diseases, as well as the increases in the costs of care as a result of reduced mortality. The strength of the model is that it is dynamic, which allowed us to apply increased cessation rates on a repetitive basis to a population whose mix of age, gender and smoking prevalence changed annually. The model accounts for relapse, and assumes this depends on time since cessation. Smokers as well as former smokers run an increased risk for smoking related diseases, with the risks of former smokers depending on time since cessation.
Chapter 2 describes the cessation interventions and the methods used. Chapter 3 describes how smoking cessation for different age groups results in health gains and affects costs of care. Chapter 4 presents the results in terms of health gains, costs and cost-effectiveness. Finally, chapter 5 concludes with a discussion of our results.
2. Methods
2.1 Selection of interventions
The selection of interventions was based on current availability in the Netherlands and presence of sufficient evidence for effectiveness and costs. We started with a list of available smoking cessation programs. Then we did a literature review, searching for Dutch trials and international meta-analyses, especially Cochrane reviews, to find out whether evidence of effectiveness existed. We excluded all interventions with effectiveness rates below 3% of continuous abstinence at 12 months, since this is below the quit rate on will power alone. In the literature this rate varied between 3-7%.12-14 Finally, we presented our list to an expert panel, asking them to indicate missing interventions, and adjusted our selection accordingly. Appendix A presents a full description of the interventions selected, together with an overview of interventions mentioned by experts that were excluded and the reasons why. Table 2.1 below lists the selected interventions.
Table 2.1: Selected interventions
Intervention Abbreviation Short description Individual cessation support
Minimal counseling ‘kort
stopadvies’ MC Short counselling by GP or assistant, in a single consult, 1 to 12 minutes duration GP counseling as in the
‘H-MIS’ H-MIS Counselling by GP and/or assistant, in 1 to 2 consults, following 5 steps from a protocol Telephone counselling TC An intake call of 30 minutes and 2 to 8 follow-up calls of
each 15 minutes, based on a (computerized) questionnaire completed by the potential quitters.1 2
Minimal counselling +
nicotine replacement therapy MC+NRT Short counselling followed by nicotine gum or patches for a period of on average eight weeks. Intensive counselling +
nicotine replacement therapy IC+NRT Intensive counselling (40-110 minutes in total) by a trained counselor (for instance lung nurse) combined with NRT for a period of on average 12 weeks.
Intensive counselling +
bupropion IC+BU Intensive counselling in combination with Bupropion for a period of on average 9 weeks Interventions at the population level
Mass media campaign MMC Publicity via television, radio and newspapers, broad provision of leaflets, billboards and educational messages. Tax increase TI A tax increase on tobacco products that translates into a price
increase.
Interventions can be divided into interventions at the population level and individual
cessation support. The former refer to mass media campaigns, regulations and tax increases, implemented at a countrywide scale and targeting all adult smokers. Theoretically, individual cessation support could also be implemented countrywide, but these interventions use a personalized approach, and they can also be used on a much smaller scale. Furthermore, they may be tailored to specific groups of smokers, for instance, heavily addicted smokers, or smokers with a chronic disease.
Interventions of both types cannot be compared without taking into account a number of caveats. The effectiveness of interventions at the population level is harder to estimate and surrounded by more uncertainty. Individual cessation support interventions can be evaluated in clinical trials, but in lack of a control group that is not possible for interventions at the
population level. For interventions at the population level, the size of the target group is clear. In contrast, for individual cessation support, the target group and how to reach them is not always clear. Costs to engage the target group or for training counselors are not usually included in the intervention costs. Finally, both types of interventions are often applied in combination. For instance, mass media campaigns are used to refer smokers to telephone counseling that is offered at the same time. In this report we did not look at combination policies, but evaluated the interventions separately. The costs and effects of combination policies will be the topic of further research.
2.2 Effectiveness in terms of increased cessation
Effectiveness of the interventions was estimated from Dutch and international literature. Individual cessation support
We used Cochrane reviews, other meta-analyses and Dutch trial data to estimate 12 month continuous abstinence rates for the interventions at the individual level. We updated our earlier estimates,21 including more recent studies. If we used a Cochrane review, we only included data from studies with 12 months continuous abstinence rates. Therefore, we recalculated the pooled effectiveness estimates, using a random effects model. We computed both the average cessation rate in the intervention groups and the average difference between the intervention and the control group. We also computed 95% confidence intervals. All estimates were presented to a panel of experts asking for comments.
Interventions at the population level
For interventions at the population level, we estimated effects on the percentage of smokers in a year.
For mass media campaigns, we combined national prevalence data with an estimate of the net effect of mass media campaigns based on international literature, to estimate baseline values and an uncertainty range for the effects of mass media campaigns. Finally, we presented these to experts, and asked their opinion about the effectiveness of mass media campaigns.
By increasing tobacco taxes, the prices of cigarettes will rise (provided that tobacco
producers do not decrease their selling price). Increasing tobacco prices may affect smoking behavior in three different ways (see Figure 2.1)
• current smokers decrease the quantity of cigarettes consumed; • more current smokers quit smoking;
• less non-smokers start smoking.
Less initiation More quitting
Change in prevalence of smoking Change in tobacco quantity consumed by smokers Change in tobacco sales
Historical time series of smoking behavior have been related to price developments. To estimate the health effects of price increases, effects on the prevalence of smoking are needed. The price elasticity of the demand for tobacco equals the relative change in the demand for tobacco divided by the relative change in the price of tobacco. As long as this elasticity is below 1, it implies that tax revenues will increase if taxes increase, since any 10% increase in prices leads to a less than 10% decrease in the demand for tobacco. Total price elasticity was decomposed into effects on the amount of cigarettes smoked per person and effects on smoking prevalence. For adults, we focused on the effects of tax increases on smoking cessation.22-27Again, the resulting estimates were presented to experts for comments.
2.3 Intervention costs
The costs of the different smoking cessation interventions were evaluated from the health care perspective and measured in euros. We used consumer price indices to adjust all cost to a 2004 price level. In addition, costs and savings in all years after year 1 of the intervention were discounted at 4%.28
Individual cessation support
Intervention costs were based on bottom up estimates of real resource use and costs per unit. We updated our earlier cost estimates and added estimates for minimal counseling.21
Resource use was estimated from a description of the interventions as found in practice guidelines. For pharmacotherapy, we based resource use on the compliance data in the original trials selected from the Cochrane reviews, so that they matched with the
effectiveness estimates. Resource use was then multiplied with unit costs to find intervention costs. Further details can be found in Appendix B.
Interventions at the population level
The annual accounts of STIVORO and their report about the ‘Dat kan ik ook’ campaign were the main sources for data on the costs of the two mass media campaigns. Full details can be found in Appendix B.
We assumed that tax measures imposed no costs from the health care perspective. Possible costs related to tobacco taxes are costs of regulation and control. These costs will be born by the Ministry of Finance. They are usually more than matched by tax revenues. Tax revenues of the year 2004 (1.94 billion euro)29 were used to project differences in tax revenues due to price increases.
2.4 Long term effects in the RIVM Chronic Disease Model
To extrapolate from additional quitters to effects on health care costs, life years gained and QALYs gained, the RIVM Chronic Disease Model (CDM) was used (see Figure 2.2).30 The model simulated the long term effects of increased smoking cessation rates on smoking prevalence and incidence, prevalence, mortality and costs of fourteen smoking-related diseases, i.e. coronary heart disease (myocardial infarction and other coronary heart disease), chronic heart failure, stroke, COPD, diabetes, lung cancer, stomach cancer, larynx cancer, oral cavity cancer, esophagus cancer, pancreas cancer, bladder cancer and kidney cancer, as well as on total mortality, morbidity and health care costs. The start year of the simulations was 2005. More details on the model can be found in Appendix C and in several background reports.31-37 The model has been applied in several other analyses of smoking policy.21 38-43 As a reference scenario, the CDM was used for projections with constant rates of smoking initiation, cessation, and relapse for each age and gender category. These projections may beinterpreted as the result of current practice (see Figure 2.3). We estimated the age- and gender specific prevalence of smokers, former smokers and never smokers in the population from the NIPO data over 2004.44 Cessation, initiation and relapse rates were estimated from the NIPO data over 2002 and 2003.45 46 We excluded 2004 from these estimates, since in this year a tax increase, a mass media campaign, and new regulations on smoking at work and in public transport were introduced.
2020 2040 2060 2080 Year 0.2 0.4 0.6 0.8 1 Fractions Former Current Never
Figure 2.3: Model projections for the percentage of smokers, former smokers and never smokers in the current practice scenario (population of 15 year and older)
To evaluate the long term effects of cessation policy, intervention scenarios were compared to the current practice scenario. Intervention scenarios assumed that starting from the base year (2005) an intervention was implemented for periods of either 1, 5, or 10 years.
smokers
former-smokers Other diseases or no
diseases Smoking related diseases
COPD CVD Lung cancer incidence mortality mortality Quit relapse
Individual cessation support
The individual interventions were assumed to reach 5%, 10%, 25%, of the smokers each year. The interventions by assumption increased cessation rates during the implementation period, resulting in a decrease of current smokers and an increase of former smokers. Two variants were compared. The first used the pooled absolute cessation rates from the intervention groups and divided these by the weighted average over age and gender of current practice cessation rates (weights were the number of smokers in each age and gender category), to find an intervention specific factor. This factor was then used to multiply the age and gender specific cessation rates for all smokers aged 20 years and over. In the second variant, the pooled difference in cessation rates between the intervention and control groups in the trials was used. We assumed an additive effect and applied this to the age specific cessation rates in the CDM.
Interventions at the population level
For the population interventions, effects were estimated in terms of prevalence rates of current smokers. For the intervention scenarios, smoking cessation rates were increased in the base year to fit to the assumed reduction in the percentage of current smokers. In the
intervention scenarios we added a constant to current practice cessation rates. By doing this, it was assumed that the relative decrease in the percentage of smokers is equal in all age groups. Start, and relapse rates were kept at their current practice levels. For mass media campaigns, for all years after the base year, cessation rates were assumed to return
immediately to their current practice levels. For tax increases, cessation rates were assumed to return slowly to their current practice levels, with a delay factor. The delay factor
determines how fast cessation rates return to current practice level. In the scenarios presented in the main text the delay factor equals 0.5 which implies that every year the difference in cessation rate between current practice and intervention scenario is halved.c In sensitivity analyses the delay factor is varied. Model outcomes were the numbers and percentages of current smokers, never smokers and former smokers, prevalence of diseases, and population numbers.
Comparing population numbers in the intervention scenarios and current practice scenarios, results in yearly differences in the number of persons alive, or in other words, the number of life years gained. Combining disease prevalence with data from the Dutch Burden of Disease Study47 and taking account of comorbidity, the model also projects the yearly amount of QALYs lived, that is, the life years corrected for quality of life losses as a result of disease. Comparison of intervention and current practice scenarios results in QALYs gained. The details of the computations, and especially how we took account of comorbidity were described in a background report.48
Average cost of care per patient were estimated based on a comprehensive overview, the Dutch Cost of Illness Study,49 that assigned all expenditures in Dutch health care of different providers and sectors (General practitioners, hospitals, nursing homes, ambulance costs, etcetera) to different diseases or disease categories. The Cost of Illness study presented totals per disease, not per patient. We combined these with prevalence data to estimate age and gender specific costs per patient for each smoking related disease.
Finally, average total age and gender specific costs were corrected for these diseases, to find average age and gender specific costs for all remaining diseases.48 This allowed us to present effects on the costs of smoking related diseases, the costs of all other diseases and, adding these, on total health care costs.
cFor instance, if the first year after the tax increase the cessation rate in the intervention scenario equals 0.1 and in the current practice scenario 0.05, the second year the cessation rate in the intervention scenario equals 0.075, the third year 0.0625 etc.
2.5 Cost Effectiveness
Finally, different short and long term cost-effectiveness ratios were estimated.
To find short term cost-effectiveness ratios, the intervention costs were divided by the short term effects in terms of additional quitters, or a reduced number of smokers. The outcomes are costs per quitter, and costs per avoided smoker. These ratios could be estimated without the CDM.
To find long term cost-effectiveness ratios, the differences in model outcomes between intervention and current practice scenarios, that is life years gained (LYG), QALYs gained, and effects on health care costs, were added over all years within the time horizon to find incremental net present values. Net present values of total intervention costs were computed, applying costs per smoker to the smokers that had an intervention during the implementation period. Different long term cost-effectiveness ratios could be formulated: first, intervention costs per LYG or QALY gained, second intervention costs minus savings in smoking related diseases per LYG or QALY gained, and third intervention costs plus total effects on health care costs per LYG or QALY gained. Future costs and effects were discounted at the Dutch standard annual percentage of 4%.28 The time horizon was 100 years. All cost data were presented in euro, for price level of 2004.
Sensitivity analyses
The cost-effectiveness ratios, especially the long term variants were the result of complicated computations, requiring a number of assumptions and combining data from different sources with varying degrees of certainty. As a result, formal confidence intervals, like those
presented in clinical trials, or even in meta-analyses, can not be computed for our cost-effectiveness ratios. Nevertheless, we tried to give insight into the uncertainty of our results. For the individual cessation support, we had 95% confidence intervals for their short term effectiveness, and we estimated minimum and maximum values for the intervention costs per smoker. For the population interventions, we estimated ‘best case’ and ‘worst case’ scenarios, based on minimum and maximum effects.
We also did a series of one way sensitivity analyses to test the effects of several
methodological assumptions, varying discount rates, time horizon, the number of participants in individual interventions, additive or multiplicative effects for individual interventions, the implementation period, the decay rate of tax increase, and the age groups targeted (see Table 4.6).
3. Age specific effects of cessation on health gains for
three example scenarios
This section is intended as an intermezzo, to help understand the results that will be presented in section 4. The projections of the Chronic Disease Model will be presented for three
example scenarios, explaining how additional quitters lead to health gains and how this affects the costs of care, for different age groups.
To demonstrate the effects of smoking cessation intervention, we will present outcomes of three example scenarios:
1. 1,000 extra quitters in the year 2005 compared to current practice aged 20-44;
2. 1,000 extra quitters in the year 2005 compared to current practice aged 45-64;
3. 1,000 extra quitters in the year 2005 compared to current practice aged 65+.
Figure 3.1 displays difference in the number of smokers of these three scenarios compared to the current practice scenario. In all scenarios approximately half of the 1,000 extra quitters relapse within a year. However, after one year differences between the scenarios emerge: in the scenarios targeted at older smokers more of the extra quitters die.
2020 2040 2060 2080 2100 Year 1000 800 600 400 200 Difference # smokers 65 45 64 20 44
Figure 3.1: Differences in number of smokers for example scenarios 1, 2 and 3 compared to current practice
Figures 3.2 and 3.3 display the life years and QALYs gained over time. In contrast to other figures in this report, in these figures future effects have not been discounted, to accentuate differences. The reduction in the number of smokers results in a decrease in the incidence of smoking related diseases which causes a gain in life years and QALYs compared to current practice. For the quitters aged 20-44 health gains occur later than for the older age groups since relative risks for most smoking related disease are highest between ages 50-65. The smallest effects occur for the scenarios that resulted in more quitters aged 65+. This is because some of the quitters already have died and because relative risks on smoking related diseases decrease with older ages. Furthermore, health gains for younger cohorts are stretched over a longer period. The health gains approach zero as the cohorts that quit smoking become extinct. The timing of this is of course different for the different age groups. Comparing
Figures 3.2 and 3.3 shows that in the beginning there is more gain in quality of life than length of life caused by the reduced incidence of smoking related diseases. However, in the long run the gain in life years is larger than the gain in QALYs as a result of substitute diseases that decrease quality of life in life years gained.
2020 2040 2060 2080 2100 Year 10 20 30 40 50
Life years gained
65 45 64 20 44
Figure 3.2: life years gained over time (life years not discounted)
2020 2040 2060 2080 2100 Year 10 20 30 40 50 QALYs gained 65 45 64 20 44
Figure 3.3: QALYs gained over time (QALYS not discounted)
Figures 3.4 and 3.5 display the difference in health care costs of smoking related diseases and of diseases not related to smoking, respectively. The decrease in the incidence of diseases causally related to smoking results in a decrease in health care costs of those diseases.
However, the gain in life years causes an increase in the prevalence of all diseases, both those related to smoking and those not related to smoking.
2020 2040 2060 2080 2100 Year 60000 40000 20000 1000 65 45 64 20 44
Figure 3.4: difference in health care costs of smoking related diseases over time (4% discount rate) 2020 2040 2060 2080 2100 Year 20000 40000 60000 80000 100000 120000 1000 65 45 64 20 44
Figure 3.5: Difference in health care costs of diseases not related to smoking over time (4%
discount rate)
Figure 3.6 displays the total difference in health care costs over time. From this figure it can be seen that the savings in health care costs of smoking related diseases are outweighed by increases in the health care costs of diseases not related to smoking in life years gained. This is mainly due to high costs at the end of the time horizon. Cost savings were obtained over the first 10, 25, and 40 years respectively, from a reduction in smoking related diseases. The period of cost savings is longer for younger age groups, since more health gains can be obtained if people stop earlier. However, if smokers live longer they have a higher lifetime chance to develop chronic, expensive, not lethal diseases like dementia. This effect is more pronounced for cessation at older ages. Furthermore, the additional health care costs in life years gained occur further away in the future for younger quitters than for older quitters and therefore these costs are more heavily discounted and have less effects, as can be seen from the shifts and decreases in the tops in Figure 3.5.
2020 2040 2060 2080 2100 Year 25000 25000 50000 75000 100000 125000 1000 65 45 64 20 44
Figure 3.6: Difference in total health care costs over time (intervention costs not included, discount
rate 4%)
Table 3.1 displays a summary of the results expressed per additional quitter for the three example scenarios. Taking into account relapse, quitting at a younger age (20-44) results in the highest gain in life expectancy (1.25 years). Therefore, most health gains can be achieved by targeting 20-64 aged. Causing old smokers (65+) to quit results in the smallest gain in life expectancy (0.30 years). Furthermore, the gain in quality of life compared to gain in life years is least favorable for old ages (0.15/0.30 for 65+ compared to 1.00/1.25 for 20-44). The highest savings in healthcare costs of smoking related diseases can be obtained by
encouraging middle aged smokers (45-64) to quit smokers. However, they will also cause the highest increase in medical costs for diseases unrelated to smoking. Differences in health care costs divided by gain in the number of QALYs or life years gained shows that leaving
interventions costs aside smoking cessation interventions targeted at younger smokers are most cost-effective.
Table 3.1: Results per additional quitter in different age groups
Age group 20-44 45-64 65+
Gain in life expectancy 1.25 1.15 0.30
Gain in health adjusted life expectancy 1.00 0.80 0.15 Difference in health care costs of smoking
related diseases a - 1,000 - 1,100 - 200
Difference in health care costs of all other
diseases a + 1,700 + 3,200 + 1,700
Difference in total health care costs a + 700 + 2,100 + 1,500
per LYG a b 2,800 5,300 10,600
per QALY gained a b 2,900 6,300 16,900
a Discounted at 4% b Difference in total healthcare costs divided by gain in discounted (health adjusted) life
4. Results
4.1 Short term effects of interventions
Individual cessation supportTable 4.1 below presents the effectiveness of the individual interventions and their sources.
Table 4.1: Effectiveness of interventions for individual smokers
Intervention (abbreviations see Table 2.1) cessation rate in intervention group (95% confidence interval) difference in cessation rates between intervention and control group (95% confidence interval) Intervention in
control group Source
MC 4.4% (2.5 – 6.2) 0.9% (0.3 – 2.2) No advice 10 RCTs15 H-MIS 7.9% (4.2 – 15) 4.8% (1.1 – 12) No advice Dutch trial16
TC 9% (5.8 – 12) 2.4% (1.1 – 3.7) Minimal intervention 11 RCTs 19 MC+NRT 14% (8.9 – 18) 4.6% (2.5 – 6.7) MC + placebo 17 RCTs17 IC+NRT 22% (17 – 27) 6.3% (4.0 – 8.5) IC + placebo 26 RCTs17 IC+BU 17% (13 – 20) 7.3% (3.9 – 11) IC + placebo 9 RCTs18
Interventions at the population level
For mass media campaigns, based on US data, the net effect of mass media campaigns was estimated as 0.5 to 0.7 times the observed effect in time series (see Appendix A). In the Netherlands, smoking prevalence rate decreased during the period 97-99 to 00-01 with 2.2 percentage points (from 33.7% to 31.5%) and during the period 2001-03 to 2004 with 2.0 percentage points (from 30% to 28%). Correction leads to an estimated net effect of 1.0-1.4 percentage points for the Dutch MMC. The absolute net effect in the USA was between 0.4 and 0.7 percentage point a year. The ‘most probable effect’ range of a MMC was then assumed to be between 0.5 and 1.0 percentage point. A (theoretical) minimum effect was established by multiplying the estimated effect in the Dutch situation (1.0 percentage point) by 0.2, based on Hu and co-authors.50 A (theoretical) maximum may be the gross decrease of 2.1 percentage points, which occurred during the campaign years in the Netherlands. To stress the uncertainty of these estimates results were computed over the whole range of effectiveness.
For tobacco taxes, major reports concluded that at least half of the decrease in tobacco sales could be explained by a decrease in smoking prevalence.11 Since most smokers are adults, this will mainly be a result of more quitting.22-27 We assumed that the total price elasticity of demand for tobacco was between –0.3 and –0.511,51 and that the effect was largest
immediately after the price increase, with cessation rates gradually returning to their old level (see Appendix A). Furthermore, we assumed that smokers of all ages were equally responsive to prices. A price increase of 20% was used, since this is roughly the price increase of
cigarettes in the Netherlands in the beginning of 2004. Three different scenarios were formulated:
• ‘best case’ scenario: total price elasticity of demand for tobacco equals - 0.5 and is
completely caused by a drop in the prevalence of smoking. The amount of cigarettes smoked by those who continue smoking does not change. Thus, the price increase of 20% leads to decrease in the prevalence of smoking of 10% (about 2.8 percentage points).
• ‘best guess’ scenario: price elasticity equals - 0.4 and is for 50% caused by a drop in
smoking prevalence. The remaining 50% of the decrease in tobacco sales is caused by less consumption by continuing smokers. Thus, the price increase of 20% leads to decrease in the prevalence of 4% (approximately 1.2 percentage points).
• ‘worst case’ scenario: price elasticity equals - 0.3 and is for 50% caused by a drop in
prevalence. The remaining 50% is the result of less consumption by continuing smokers. Thus, the price increase of 20% leads to decrease in prevalence of 3% (approximately 0.9 percentage point).
4.2 Costs of interventions
Interventions at the individual levelTable 4.2 presents the baseline estimates for the costs of the interventions. Details, together with minimum and maximum values can be found in Appendix B.
Interventions at the population level
The total STIVORO costs of the campaigns ‘Dat kan ik ook’ and ‘Nederland start met stoppen’ were estimated at 6.3 and 6.4 million, respectively. Details can be found in Appendix B. In both campaigns, the largest part of the budget was used for media coverage and publicity (83%). The additional budget was used for measures to support individuals in their quit attempt.
For tobacco taxes, we used zero interventions costs. Costs of regulation and control fall outside the health care perspective and will be more than covered by tax revenues.
4.3 Long term effects of interventions, the CDM outcomes
This section presents the scenarios’ long term effects as projected by the RIVM Chronic Disease Model (CDM). Subsequently, the following outcomes will be discussed: effects on the number of smokers, the amount of life years gained (LYG), the amount of quality adjusted life years gained (QALYs), the savings in healthcare costs that result from adecrease in the incidence of smoking-related diseases, and effects on the total costs of care as a result of reduced mortality.
Effects on smokers
Figure 4.1 illustrates the difference in the number of smokers for a 5 year implementation of three types of individual cessation support compared to the reference scenario. For all individual interventions, the maximum decrease in the number of smokers ranged between 12,000 for MC to over 300,000 for IC+NRT (the total number of smoking adults is about 4,000,000). For mass media campaigns effects varied from 25,000 to 280,000 and for tobacco taxes from 100,000 to 340,000. All these numbers refer to baseline scenarios.
Table 4.2: Resource use, unit costs and costs per smoker for interventions at the individual level (euro, price level 2004)
2020 2040 2060 2080 2100 Year 300000 250000 200000 150000 100000 50000
Difference in the number of smokers
IC NRT MC H MIS
Figure 4.1: Differences in number of smokers for 5 year implementation of minimal counseling, H-MIS and intensive counseling combined with nicotine replacement therapy compared to current practice
Intervention (abbreviations see Table 2.1) Units Unit price Costs MC GP time (minutes) 2 2.04 4 Material (brochures) 1 1.07 1 Total 5 GP counseling (H-MIS) GP time (minutes) 12 2.04 25 Material (brochures) 1 1.07 1 Total 26 TC
Counsellor time (minutes) 120 1.07 128
Total 128 MC+ NRT GP time (minutes) 12 2.04 25 Material (brochure) 1 1.07 1 Medication (DDD) 65 2.42 157 Total 183 IC+NRT
Physician time (minutes) 2 3.70 7
Counselor time (minutes) 90 0.81 73
Medication (DDD) 80 2.42 193
Material 1 1.07 1
Overhead consults (per minute) 90 1.26 113
Total 388
IC+BU
Physician time (minutes) 2 3.70 7
Counselor time (minutes) 90 0.81 73
Medication (DDD) 63 2.81 177
Material 1 1.07 1
Overhead consults (per minute) 90 1.26 113