Methodology for the
calculation of emissions from
product usage by consumers,
construction and services
RIVM Report 2018-0011
B.I. Jansen | J.A.J. Meesters |
M.M. Nijkamp
Methodology for the calculation of
emissions from product usage by
consumers, construction and services.
Colophon
© RIVM 2018
Parts of this publication may be reproduced, provided acknowledgement is given to: National Institute for Public Health and the Environment, along with the title and year of publication.
DOI 10.21945/RIVM-2018-0011
B.I. Jansen (Auteur), TNO J.A.J. Meesters (Auteur), RIVM M.M. Nijkamp (Auteur), RIVM Contact:
J. A. J. Meesters CPV
joris.meesters@rivm.nl
This report has been compiled by order and for the account of the
Directorate-General for the Environment and International Affairs, within the framework of the project Emission Registration M/240107,
‘Netherlands Pollutant Release & Transfer Register’.
This is a publication of:
National Institute for Public Health and the Environment
P.O. Box 1 | 3720 BA Bilthoven The Netherlands
Synopsis
Methodology for the calculation of emissions from product usage by consumers, construction and services.
This report describes the methods used to calculate emissions from product usage by consumers, construction and services by the Dutch PRTR for reporting greenhouse gas (GHG) emissions under UNFCCC, Kyoto Protocol, EU Monitoring Mechanism Regulation (MMR) and EU Effort Sharing Decision (ESD), and for international reporting obligations of other pollutants under CLRTAP and the NEC Directive.
Publiekssamenvatting
Methodiekrapport om emissies door productgebruik te berekenen.
Het RIVM heeft beschreven hoe de Nederlandse Emissieregistratie de uitstoot berekent van verontreinigende stoffen door het gebruik van producten.
Nederland is vanwege internationale verdragen, zoals het Kyoto-protocol, de EU-Emissieplafonds (NEC-Directive) en de Convention on Long-range Transboundary Air Pollution (CLRTAP), verplicht om jaarlijks volgens de meest actuele wetenschappelijk inzichten te rapporteren over de uitstoot van broeikasgassen, verzurende stoffen en stoffen die gerelateerd zijn aan grootschalige luchtverontreiniging. De
gerapporteerde uitstoot door productgebruik wordt met de methoden beschreven in dit rapport onderbouwd.
Deze rapportage is bedoeld voor de (internationale) reviewers die de Nederlandse rapportages aan de EU en VN valideren.
Kernwoorden: emissie, productgebruik, broeikasgassen, luchtverontreiniging
Contents
1 Introduction — 13
2 General assurance and quality control (QA/QC) — 15
3 Emissions of greenhouse gases — 17
4 Emissions of air pollutants — 19
5 Aerosol cans (CRF 2.G.3.b) — 25
5.1 Description emission source — 25 5.2 Calculation — 25
5.3 Uncertainty and Quality checks — 25 5.4 Spatial allocation — 26
5.5 References — 26
5.6 Version, dates and sources — 26
6 Air Fresheners — 27
6.1 Description of emission source — 27 6.2 Calculation — 27
6.3 Uncertainty — 30 6.4 Spatial allocation — 30 6.5 References — 30
6.6 Version, dates and sources — 30
6.7 Annex I: Emission rates derived from air freshener product information data — 31
6.8 Annex II EPHECT Survey data — 32
7 Adhesive products — 35
7.1 Description of the emission source — 35 7.2 Calculation — 35
7.3 Uncertainty and Quality — 37 7.4 Spatial allocation — 37 7.5 References — 37
7.6 Version, data and sources — 37
8 Anaesthesia (CRF 2.G.3.a) — 39
8.1 Description emission source — 39 8.2 Calculation — 39
8.3 Uncertainty and Quality checks — 40 8.4 Spatial allocation — 40
8.5 References — 40
8.6 Version, dates and sources — 40
9 Burning Candles (CRF 2.D.2) — 41
9.1 Description emission source — 41 9.2 Calculation — 41
10 Car Products — 45
10.1 Description of emission source — 45 10.2 Calculation — 45
10.3 Uncertainty — 47 10.4 Spatial allocation — 48 10.5 References — 48
10.6 Version, dates and sources — 48
11 Carbolineum treated wood — 50
11.1 Description of the emission source — 50 11.2 Calculation — 50
11.3 Uncertainty — 51 11.4 Spatial allocation — 51 11.5 References — 51
11.6 Version, date, sources — 51
12 CFCs from refrigerators and freezers — 52
12.1 Description emission source — 52 12.2 Calculation — 52
12.3 Uncertainty — 53 12.4 Spatial allocation — 53 12.5 References — 54
12.6 Version, dates and sources — 54
13 Cleaning Products — 55
13.1 Description of the emission source — 55 13.2 Calculation — 55
13.3 Uncertainty and Quality — 59 13.4 Spatial allocation — 59 13.5 References — 59
13.6 Version, data, sources — 59
14 Construction sites — 61
14.1 Description of emission sources — 61 14.2 Calculation — 61
14.3 Uncertainty — 62 14.4 Spatial allocation — 62 14.5 References — 62
14.6 Versions, dates and sources — 62
15 Cosmetics for personal care — 63
15.1 Description emission source — 63 15.2 Calculation — 63
15.3 Uncertainty — 64 15.4 Spatial allocation — 64 15.5 References — 64
15.6 Version, dates and sources — 64
16 Crematoria — 65
16.1 Description emission source — 65 16.2 Calculation — 65
16.3 Quality codes — 68 16.4 Spatial allocation — 68
16.6 Version, dates and sources — 68
17 Degassing of groundwater (CRF 2.G.4) — 69
17.1 Description emission source — 69 17.2 Calculation — 69
17.3 Uncertainty and Quality checks — 70 17.4 Spatial allocation — 70
17.5 References — 70
17.6 Version, dates and sources — 70
18 Fireworks (CRF 2.G.4) — 71
18.1 Description emission source — 71 18.2 Calculation — 71
18.3 Uncertainty and Quality checks — 74 18.4 Spatial allocation — 75
18.5 References — 75
18.6 Version, dates and sources — 75
19 Human ammonia emissions from transpiration and
breathing — 77
19.1 Description emission source — 77 19.2 Calculation — 77
19.3 Uncertainty and Quality checks — 79 19.4 Spatial allocation — 79
19.5 References — 79
19.6 Version, dates and sources — 80
20 Leather maintenance products and office supplies — 81
20.1 Description emission source — 81 20.2 Calculation — 81
20.3 Quality codes — 81 20.4 Spatial allocation — 81 20.5 References — 82
20.6 Version, dates and sources — 82
21 Meat preparation and charcoal use (CRF 1.A.4.b) — 83
21.1 Description emission source — 83 21.2 Calculation — 83
21.3 Uncertainty and Quality checks — 84 21.4 Spatial allocation — 85
21.5 References — 85
21.6 Version, dates and sources — 85
22 Paint — 87
22.1 Description emission source — 87 22.2 Calculation — 87
22.3 Uncertainty — 89 22.4 Spatial allocation — 89 22.5 References — 89
23.3 Uncertainty — 91 23.4 Spatial allocation — 92 23.5 References — 92
23.6 Version, dates and sources — 92
24 Petrol stations — 93
24.1 Description emission source — 93 24.2 Calculation — 93
24.3 Uncertainty — 95 24.4 Spatial allocation — 95 24.5 References — 95
24.6 Version, dates and sources — 95
25 Residential combustion, Wood stoves and Fireplaces
(CRF 1.A.4.b) — 97
25.1 Description emission source — 97 25.2 Calculation — 97
25.3 Uncertainty and Quality checks — 98 25.4 Spatial allocation — 98
25.5 References — 99
25.6 Version, dates and sources — 99
26 Shooting — 101
26.1 Description emission source — 101 26.2 Calculation — 101
26.3 Quality codes — 101 26.4 Spatial allocation — 101 26.5 References — 101
26.6 Version, dates and sources — 102
27 Wholesale Business in fuel and remaining mineral oil
products — 103
27.1 Description emission source — 103 27.2 Calculation — 103
27.3 Uncertainty — 104 27.4 Spatial allocation — 104 27.5 References — 104
27.6 Version, dates and sources — 104
28 Smoking of cigarettes and cigars — 105
28.1 Description emission source — 105 28.2 Calculation — 105
28.3 Uncertainty — 107 28.4 Spatial allocation — 107 28.5 Reference — 107
28.6 Version, dates and sources — 107
29 Service stations, anti-corrosive treatment — 109
29.1 Description emission source — 109 29.2 Calculation — 109
29.3 Uncertainty — 110 29.4 Spatial allocation — 110 29.5 Reference — 110
30 Manure from Domestic animals — 111
30.1 Description emission source — 111 30.2 Calculation — 111
30.3 Uncertainty and Quality checks — 112 30.4 Spatial allocation — 112
30.5 References — 112
30.6 Version, dates and sources — 113
31 Pesticides, domestic and non-agricultural use — 115
31.1 Description emission source — 115 31.2 Calculation — 115
31.3 Uncertainty — 116 31.4 Spatial allocation — 116 31.5 References — 116
31.6 Version, dates and sources — 116
32 Dry cleaning of clothing and textiles — 117
32.1 Description emission source — 117 32.2 Calculation — 117
32.3 Uncertainty — 118 32.4 Spatial allocation — 118 32.5 References — 118
32.6 Version, dates and sources — 118
33 Industrial cleaning of clothing and textiles — 121
33.1 Description emission source — 121 33.2 Calculation — 121
33.3 Uncertainty — 122 33.4 Spatial allocation — 122 33.5 References — 122
33.6 Version, dates and sources — 122
34 Fumigation of transports — 123
34.1 Description emission source — 123 34.2 Calculation — 123
34.3 Uncertainty — 123 34.4 Spatial allocation — 124 34.5 References — 124
34.6 Version, dates and sources — 124
35 Preserved wood — 125
35.1 Description emission source — 125 35.2 Calculation — 125
35.3 Uncertainty — 132 35.4 Spatial allocation — 132 35.5 References — 132
35.6 Version, date and sources — 133
36 Refrigerator foam — 135
36.6 Version, dates and sources — 136
37 Tanker truck cleaning — 137
37.1 Description emission source — 137 37.2 Calculation — 137
37.3 Uncertainty — 137 37.4 Spatial allocation — 137 37.5 References — 137
37.6 Version, date and sources — 138
38 Accidental fires — 139
38.1 Description emission source — 139 38.2 Calculation — 139
38.3 Uncertainty and quality checks — 140 38.4 Spatial allocation — 141
38.5 References — 141
38.6 Version, dates and sources — 141
39 Degreasing new vehicles — 143
39.1 Description emission source — 143 39.2 Calculation — 143
39.3 Uncertainty — 143 39.4 Spatial allocation — 143 39.5 References — 144
39.6 Version, dates and sources — 144
1
Introduction
This document reports on the methods of calculating emissions caused by consumers and some small trade and service companies within the taskforce WESP (Taskforce on product usage by consumers,
construction and services). Both greenhouse gas (GHG) and air pollutant emissions are calculated with these methods.
This document is only available online and is updated yearly if necessary. The emissions described in this document are part of the Dutch emission inventory (Dutch PRTR).
For more information, please check the website
http://www.emissieregistratie.nl/ERPUBLIEK/bumper.en.aspx.
The emissions calculated by the WESP taskforce are largely caused by product uses which are mainly emitted to air. The emissions to the compartment water are calculated by the MEWAT taskforce. The emissions caused by industrial production, waste management and energy production are reported by the ENINA taskforce.
This document describes the background of the process causing the emissions as well as the method of data collection, the source of the emission factors and other important information. It is important to give a description of the method because, in some cases, the calculation is based on a single measurement or data from a single year. The base year needs to be corrected or interpreted to arrive at an estimation method for the total period.
One of the purposes of this document is to provide information on emission estimations. The WESP only calculates direct emissions caused by the process or product use; these are included in this report.
Environmental effects such as acidification, greenhouse gas effect or ozone layer depletion are not considered. The waste produced, the amount of energy used, and the resources needed for production or the described process are not also included. Waste management and energy used are calculated on a country scale by the ENINA taskforce. The emissions caused by the production of the products used are calculated in other parts of the Dutch emission inventory, but only if production occurs in the Netherlands.
In the method description, we also explain how the spatial allocation occurs; this describes how the emissions are geographically distributed throughout the Netherlands. This is based on the location were the emissions are assumed to take place. For example, if a product is mainly used by consumers, the distribution is based on the number of people living in a certain area. The spatially distributed emissions are used as input for the (air quality) models calculating the concentrations of the substances in the environment. This is then used to get an estimation of the environmental quality in the Netherlands.
2
General assurance and quality control (QA/QC)
In accordance with the basic work agreements within the Dutch
emission registration, the responsible work package leader checks that: 1. the basic data are well documented and adopted (check for
typing errors, use of the correct units, and correct conversion factors);
2. the calculations have been implemented correctly;
3. assumptions are consistent and specific parameters (e.g. activity data) are used consistently;
4. complete and consistent data sets have been supplied.
Any actions that result from these checks are noted on an ‘action list’ by the ER secretary. The work package leaders carry out these actions and they communicate by e-mail regarding these QC checks, actions and results with the ER secretary. When adding a new emission year, the task forces perform a trend analysis in which data from the new year are compared with data from the previous year. The work package leader provides an explanation if the increase or decrease of emissions exceeds the minimum level of 5% at target group level, or 0.5% at national level. These explanations are also sent by e-mail to the ER secretary by the work package leaders The ER secretary keeps a logbook of all these QC checks and trend explanations and archives all relevant e-mails. This shows explicitly that the required checks and corrections have been carried out.
Based on the results of the trend analysis and the feedback on the control and correction process (‘action list’), the Working Group on Emissions Monitoring (WEM) advises the institute representatives (Deltares on behalf of Rijkswaterstaat, Statistics Netherlands (CBS) and Netherlands Environmental Assessment Agency (PBL)) to approve the dataset. The ER project leader at RIVM formally approves the dataset on receipt of an e-mail by the institute representatives in which they give their approval. Furthermore, all changes of emissions in the whole time series as a result of recalculations are documented in CRF table 8(b).
3
Emissions of greenhouse gases
This report also provides the methodology descriptions of greenhouse gas emissions reported in the national greenhouse gas inventory. The relevant emission sources are presented in the following table, including a reference to the chapter and the CRF code.
CRF Chapter ES code Emission source
(English) Emission source (Dutch)
1.A.4.b 21 0801801 Charcoal use for
barbecuing Houtskoolverbruik door consumenten: barbecuen
25 T012200 Residential
combustion, wood stoves and fire places
Vuurhaarden consumenten, sfeerverwarming woning
2.D.2 0 0801000 Burning candles Branden van kaarsen 2.G.3.a 8 9310100
Solvent and other product use: anaesthesia Oplosmiddel- en ander productgebruik: anesthesie, narcosegas 2.G.3.b 0 0811301 Solvent and other
product use: sprays Oplosmiddel- en ander productgebruik: spuitbussen,
drijfgas/oplosmiddel, consumenten
2.G.4 18 0801700 Fireworks at New
Year’s Eve Afsteken vuurwerk 17 0850000 Degassing of
groundwater,
production of drinking water
Ontgassen drinkwater
Emissions from the use of compost by consumers are described in the methodology report for agriculture (Vonk et al, 2018: Methodology for estimating emissions from agriculture in the Netherlands)
In the next table, an overview is provided on the Tier used to calculate the emissions and the source of the emission factor.
GREENHOUSE GAS SOURCE AND SINK CATEGORIES
CO2 CH4 N2O
Method
applied Emission factor Method applied Emission factor Method applied Emission factor
1. Energy
A. Fuel combustion
4. Other sectors T1 D T1 D T1 D
2. Industrial processes
D. Non-energy products
from fuels and solvent use T1 D G. Other product
manufacture and use T1 CS T1 CS T1 CS, D D = default emission factors from the guidebook;
CS = Country specific emission factor; T1 = Tier 1 methodology;
4
Emissions of air pollutants
This report provides the methodology descriptions of air pollutant emissions reported under the LRTAP convention in the Informative Inventory Report (IIR). The relevant emission sources are presented in the following table, including a reference to the chapter and the NFR code.
NFR Chapter ES code Emission source
(English) Emission source (Dutch)
1A4bi 21 0801800 Barbecuing Vleesbereiden: Bakken, braden en barbecuen 21 0801801 Charcoal use for
barbecuing Houtskoolverbruik door consumenten: barbecuen
25 T012200 Residential
combustion, wood stoves and fire places Vuurhaarden consumenten, sfeerverwarming woning 1B2aiv 24 8920900 NACE 47.3: gas stations, spills tank refill SBI 47.3: Benzinestations, lekverliezen vullen autotank 24 8920901 NACE 47.3: gas stations, vapour expel - tank refill
SBI 47.3: Benzinestations, verdrijvingsverliezen - autotanks 24 8920902 NACE 47.3: gas stations, vapour expel - storage tanks SBI 47.3: Benzinestations, verdrijvingsverliezen - opslagtanks 27 8921100 NACE 46.71: wholesale trade in fuels and other mineral oil products SBI 46.71: Groothandel in brandstoffen en overige minerale olieproducten 2D3a 15 0801100 Solvent and other
product use: cosmetics Oplosmiddel- en ander productgebruik: Cosmetica en artikelen voor persoonlijke verzorging. consumenten 10 0802300 Solvent and other
product use: car products
Oplosmiddel- en ander productgebruik:
Autoproducten, consumenten 31 0802400 Solvent and other
NFR Chapter ES code Emission source
(English) Emission source (Dutch)
product use: leather maintenance
products
productgebruik: Leer- en meubelonderhoud 7 0802901 Solvent and other
product use: glues Oplosmiddel- en ander productgebruik: Lijmen, consumenten
13 0803000 Solvent and other product use: detergents Oplosmiddel- en ander productgebruik: Schoonmaakmiddelen, consumenten
20 0820600 Solvent and other product use: office products
Oplosmiddel- en ander productgebruik:
kantoorartikelen, consumenten 36 0890401 Solvent and other
product use: foam, applied in residential refrigerators Oplosmiddel- en ander productgebruik: diffusie isolatieschuim koelkast/diepvriezer consumenten
2D3d 0 0119800 Solvent and other product use: road-paint rural areas
Oplosmiddel- en ander productgebruik:
Wegenverf buiten bebouwde kom 0 0129800 Solvent and other
product use: road-paint urban areas
Oplosmiddel- en ander productgebruik:
Wegenverf binnen bebouwde kom 0 0802200 Solvent and other
product use: paint in construction
Oplosmiddel- en ander productgebruik:
Verfgebruik bouw 0 0802201 Solvent and other
product use: paint by consumers
Oplosmiddel- en ander productgebruik:
Verfgebruik consumenten 6 0803100 Solvent and other
product use: air fresheners Oplosmiddel- en ander productgebruik: Luchtverfrissers, consumenten 0 8920800 NACE 45.2: specialised restoration of cars (painting and lacquering) SBI 45.2: Gespecialiseerde reparatie van auto's (verven en lakken) 2D3f 33 8922100 NACE 96.012:
washing and (dry-) cleaning and dye-works (> 10 employees) SBI 96.012: Chemische wasserijen en ververijen (> 10 werknemers) 32 8922200 NACE 96.012:
NFR Chapter ES code Emission source
(English) Emission source (Dutch)
works (< 10 employees) 2D3i 23 0010300 Solvent and other
product use: PCP pressure treated wood, stock Oplosmiddel- en ander productgebruik: Emissie gevelbetimmering 0 0801000 Burning candles Branden van kaarsen 28 0801001 Smoking cigars Roken van sigaren 28 0801002 Smoking cigarettes Roken van sigaretten 15 0801101 Solvent and other
product use: cosmetics Oplosmiddel- en ander productgebruik: Cosmetica en artikelen voor persoonlijke verzorging. HDO 18 0801700 Fireworks at New
Year Afsteken vuurwerk 10 0802301 Solvent and other
product use: car products
Oplosmiddel- en ander productgebruik:
Autoprodukten, HDO 11 0802500 Solvent and other
product use: carbolized wood Oplosmiddel- en ander productgebruik: Gecarbolineumd hout, consumenten
11 0802501 Solvent and other product use: carbolized wood Oplosmiddel- en ander productgebruik: Gecarbolineumd hout, landbouw
11 0802600 Solvent and other product use: carbol like wood preservatives Oplosmiddel- en ander productgebruik: Gebruik carbolineum, consumenten 11 0802601 Solvent and other
product use: carbol like wood
preservatives
Oplosmiddel- en ander productgebruik: Gebruik carbolineum, landbouw 7 0802900 Solvent and other
product use: glues Oplosmiddel- en ander productgebruik: Lijmen, bouw
13 0803001 Solvent and other product use: detergents Oplosmiddel- en ander productgebruik: Schoonmaakmiddelen, HDO
35 0804000 Solvent and other product use: creosote pressure treated wood, new
Oplosmiddel- en ander productgebruik:
gecreosoteerd hout in de bouw, consumenten 35 0804001 Solvent and other Oplosmiddel- en ander
NFR Chapter ES code Emission source
(English) Emission source (Dutch)
35 0804002 Solvent and other product use: creosote pressure treated wood, new
Oplosmiddel- en ander productgebruik:
gecreosoteerd hout in de bouw, landbouw 35 0804003 Solvent and other
product use: creosote pressure treated wood, new
Oplosmiddel- en ander productgebruik:
gecreosoteerd hout in de bouw, verkeer en vervoer
35 0804100 Solvent and other product use: creosote pressure treated wood, stock
Oplosmiddel- en ander productgebruik:
opstand van
gecreosoteerd hout in de bouw, consumenten 35 0804101 Solvent and other
product use: creosote pressure treated wood, stock
Oplosmiddel- en ander productgebruik:
opstand van
gecreosoteerd hout in de bouw, HDO
35 0804102 Solvent and other product use: creosote pressure treated wood, stock
Oplosmiddel- en ander productgebruik:
opstand van
gecreosoteerd hout in de bouw, landbouw 35 0804103 Solvent and other
product use: creosote pressure treated wood, stock
Oplosmiddel- en ander productgebruik: opstand van gecreosoteerd hout in de bouw, verkeer en vervoer 37 0811200 Industrial cleaning
of road tankers Reinigen van tankauto's 31 0812400 Solvent and other
product use: domestic pesticides Oplosmiddel- en ander productgebruik: NMVOS niet landbouw bestrijdingsmiddelen 20 0820601 Solvent and other
product use: office products
Oplosmiddel- en ander productgebruik:
kantoorartikelen, HDO 36 0890400 Solvent and other
product use: foam of refrigerators in waste dumps Oplosmiddel- en ander productgebruik: diffusie isolatieschuim koelkast/diepvriezer afvalfase 29 8920700 NACE 45.1: service stations, anti-corrosive treatment SBI 45.1: Garagebedrijven, antiroest beh. 34 E800000 Solvent and other
product use: fumigation of
Oplosmiddel- en ander productgebruik:
NFR Chapter ES code Emission source
(English) Emission source (Dutch)
2H3 14 0802302 Building and
construction sites Stofemissies bouwplaatsen 5C1bv 0 8922001 NACE 96.032: crematories, mortuaries and cemeteries SBI 96.032: Crematoria, mortuaria en begraafplaatsen 5E 38 0801200 House fires Woningbranden
38 0801300 Car fires Autobranden 12 0890200 Solvent and other
product use: scrapping of refrigerators Oplosmiddel- en ander productgebruik: afdanken koelkast/diepvriezer 6A 19 0801600 Other sources and
sinks: human transpiration and breathing
Transpiratie en ademen
30 0802000 Manure from
5
Aerosol cans (CRF 2.G.3.b)
This section describes the emission of nitrous oxide from aerosol cans.
Process description Emk_code CRF_code Sector
Aerosol cans 811301 2.G.3b Consumers
5.1 Description emission source
Nitrous oxide (N2O) is used as a propelling agent in aerosol cans (for
example, cans of cream).
Contribution to the national emission
The contribution of this source to the total national N2O emission was
0.82% in 2013.
5.2 Calculation
For the complete time series, emissions are calculated as follows: Emission = Activity data x Emission factor
Activity data = Number of N2O containing aerosol cans sold
Emission factor = N2O emission per aerosol can
a) Activity data
The Dutch Association of Aerosol Producers (NAV) reports data on the annual sales of N2O-containing spray cans. Since the 2014 submission,
the annual sales have been based on real sales figures instead of estimated sales. As a result of these improved activity data, the N2O
emissions have been recalculated for the whole time series.
b) Emission factor
The EF for N2O from aerosol cans is estimated to be 7.6 g/can (based on
data provided by one producer) and is assumed to be constant over time.
5.3 Uncertainty and Quality checks
For N2O emissions, the uncertainty is estimated to be approximately 50
per cent based on expert judgement. Uncertainty in the activity data of N2O use is estimated to be 50 per cent and that of the EF to be less than
1 per cent (the assumption is that all gas is released). Quality checks
There are no sector specific quality checks performed. For the general QA/QC, see chapter 2.
5.4 Spatial allocation
The emissions of consumers are spatially allocated in the Netherlands based on population density.
Emission
source/process Allocation-parameter
Aerosol cans population density. Details available via
http://www.emissieregistratie.nl/erpubliek/misc/documenten.aspx?ROO T=Algemeen (General)\Ruimtelijke toedeling (Spatial allocation)
5.5 References
The Dutch Association of Aerosol Producers (NAV)
5.6 Version, dates and sources
Version: 1.3
Date: September 2015
Responsibility: manager WESP task group
Administrator Organisation E-mail address
6
Air Fresheners
This section describes NMVOC emissions from consumer air fresheners.
Process
description Emkcode NFR code Sector
Air freshener 0803100 2D3d Consumers
6.1 Description of emission source
Air fresheners are used indoors to hider unpleasant odours and to fill the room with a pleasant scent. The ingredients include volatile organic compounds (VOCs) which enter the atmosphere as they travel from indoor to outdoor air. VOC Emission is calculated for the use of passive, electric and combustible air fresheners.
6.2 Calculation
Emissions from the use of air fresheners are calculated as follows: Emission = Activity data x Emission Factor
Activity data = number of households in the Netherlands
Emission factor = kg NMVOC emission from air fresheners averaged per household
a) Activity data
The number of households in the Netherlands are reported annually by the Dutch Central Bureau of Statistics (CBS) (www.cbs.nl).
b) Emission factor
The emission factor is calculated as sum of three separate emission factors derived for combustible, electric and passive air freshener products.
EF=EFcombustible + EFelectric + EFpassive
The emission factor per air freshener product is calculated as the emission rate of the product (g per hour) multiplied by the fraction of households using the products, the number of air fresheners present in the households that use the product, and the duration per year in which the product is used (hours per year).
EFproduct= eNMVOC per product X FRhouseholds using AF product X NAF product samples per household X tuse
The emission rate (g per hour) of an air freshener product is calculated by multiplying the weight of the product (g) by the weight fraction of the product that is NMVOC (gNMVOC per gproduct) divided by the product
The VOC emissions per household are calculated per type of air freshener based on the use patterns described in the EPHECT
(“Emissions, Exposure Patterns and Health Effects of Consumer Products in the EU”) survey report (EPHECT, 2012), and product information of the most used brands of air fresheners reported in material safety data sheets (MSDSs). The EPHECT project is a European collaborative project co-funded by the European Union, in which important information has been gathered about the use of products by European consumers (EPHECT, 2015). The EPHECT survey was conducted in 2012 (EPHECT, 2012) and published in 2015 (Dimitroulopoulou et al., 2015a, b; Trantallidi et al., 2015); it includes survey data that describe the declared consumer use patterns of 4335 respondents including the use and non-use of air fresheners across Europe. Emission rates are
calculated from the product information given in the MSDSs (SC Johnson, 2014; 2016a-e).
AF class AF Products included households using AF class using productA (%) Product samples in households using productsA,B (number) Product WeightB (g) Weight fraction NMVOCs (g per g)B Product Exhaustion time (hour) B Product use (hours per year)B NMVOC Emission factor (g per year per household) Combustible Scented candles 22.6 A 1.7 96 0.025 27 219 4.4 Electric Active evaporators 22 2.14 38.6 0.76 1440 4061 38.9 Passive Passive evaporator 20 1.62 170 0.01 1440 8760 C 3.4 Total 46.7 A = see EPHECT, 2012 B = see Annex I
C = continuous emission (24 hours/day)
6.3 Uncertainty
Substance Activity
data Emission factors Emission
NMVOC E C E
6.4 Spatial allocation
The emissions of consumers are allocated in the Netherlands based on population density. Details are available at
http://www.emissieregistratie.nl/erpubliek/misc/documenten.aspx?ROO T=Algemeen (General)\Ruimtelijke toedeling (Spatial allocation).
6.5 References
CBS.http://statline.cbs.nl/statweb/publication/?vw=t&dm=slnl&pa=37%
20975&d1=0-5,10,15,19&d2=0&d3=0,5,10,15,(l-4)-l&hd=151214-1158&hdr=t&stb=g1,g2
Dimitroulopoulou C., Lucica E., Johnson A., Ashmore M.R., Sakellaris I., Stranger M. and Goelen E. 2015a. EPHECT I: European household survey on domestic use of consumer products and development of worst-case scenarios for daily use. Science of the Total
Environment 2015, 536, 880-889.
Dimitroulopoulou C., Trantallidi M., Carrer P., Efthimioua G.C., Bartzis J.G. 2015b. EPHECT II: Exposure assessment to household consumer products. Science of the Total Environment 2015, 536, 890-902.
EPHECT (Emissions, exposure patterns and health effects of consumer products in the EU). 2012. Authored by Johnson A. and Lucica E. Survey on Indoor Use and Use Patterns of Consumer Products in EU Member States. Survey report. EPHECT, Ipsos, Paris.
https://esites.vito.be/sites/ephect/
SC Johnson. 2014a. Material Safety Data Sheet GLADE® CANDLE APPLE CINNAMON. MSDS Number 350000023244
SC Johnson. 2016a. Material Safety Data Sheet GLADE® CANDLE BLUE ODYSSEY. MSDS Number 350000022876
SC Johnson. 2016b. Material Safety Data Sheet GLADE® CANDLE CASHMERE WOODS. MSDS Number 350000023246
SC Johnson. 2016c. Material Safety Data Sheet GLADE® CANDLE HAWIIAN BREEZE. MSDS Number 350000027860
SC Johnson. 2016d. Material Safety Data Sheet GLADE® CANDLE PURE VANILLA JOY. MSDS Number 350000023248
SC Johnson. 2016e. Material Safety Data Sheet GLADE® 2 IN1 CANDLE SUNNY DAYS® & CLEAN LINEN. MSDS Number 350000023275 Trantallidi, M., Dimitroulopoulou, C., Wolkoff, P., Kephalopoulos, S. and
Carrer, P. 2015. EPHECT III: Health risk assessment of exposure to householdconsumer products. Science of the Total Environment. 2015, 536, 903-913
6.6 Version, dates and sources
Version 1.0
Emission expert Organisation E-mail adress
J. Meesters RIVM joris.meesters@rivm.nl
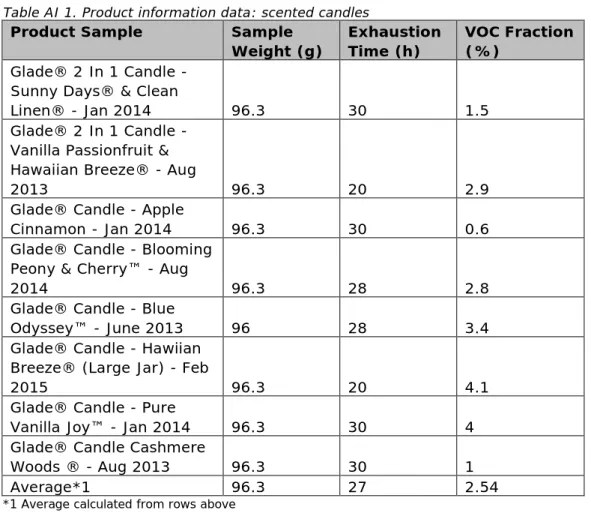
6.7 Annex I: Emission rates derived from air freshener product information data
Table AI 1. Product information data: scented candles
Product Sample Sample
Weight (g) Exhaustion Time (h) VOC Fraction (%)
Glade® 2 In 1 Candle - Sunny Days® & Clean
Linen® - Jan 2014 96.3 30 1.5
Glade® 2 In 1 Candle - Vanilla Passionfruit & Hawaiian Breeze® - Aug
2013 96.3 20 2.9
Glade® Candle - Apple
Cinnamon - Jan 2014 96.3 30 0.6 Glade® Candle - Blooming
Peony & Cherry™ - Aug
2014 96.3 28 2.8
Glade® Candle - Blue
Odyssey™ - June 2013 96 28 3.4 Glade® Candle - Hawiian
Breeze® (Large Jar) - Feb
2015 96.3 20 4.1
Glade® Candle - Pure
Vanilla Joy™ - Jan 2014 96.3 30 4 Glade® Candle Cashmere
Woods ® - Aug 2013 96.3 30 1
Average*1 96.3 27 2.54
*1 Average calculated from rows above
Table AI 2. Product information data: electric air fresheners
Product Sample Sample
Weight (g) n Time (h) Exhaustio VOC Fraction (%)
Glade Plugins® Scented Oil - Blooming Peony & Cherry™ - Oct
2014 38.1 1440 84.4
Glade Plugins® Scented Oil -
Clean Linen™ - Dec 2013 38.8 1680 72 Glade Plugins® Scented Oil -
Hawaiian Breeze® - July 2014 37.9 1440 69.6 Glade Plugins® Scented Oil -
Lavender & Vanilla - Dec 2013 37.4 1440 59.5 Glade Plugins® Scented Oil - Pure
Vanilla Joy™ - Mar 2015 40.9 1440 95.2
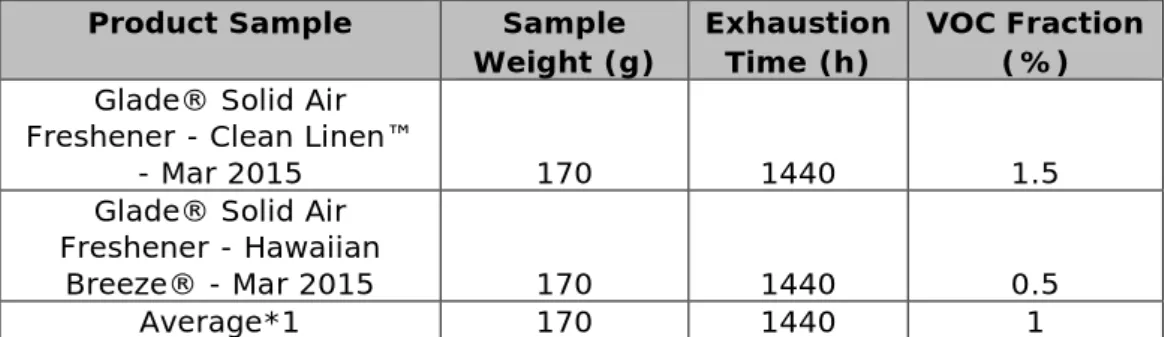
Table AI 3. Product information data: passive Air Fresheners
Product Sample Sample
Weight (g) Exhaustion Time (h) VOC Fraction (%)
Glade® Solid Air Freshener - Clean Linen™
- Mar 2015 170 1440 1.5
Glade® Solid Air Freshener - Hawaiian
Breeze® - Mar 2015 170 1440 0.5
Average*1 170 1440 1
*1 Average calculated from rows above
6.8 Annex II EPHECT Survey data
According to EPHECT, the average duration of scented candle being lit per occasion is, ‘85.6 minutes, ranging from 67 minutes in Spain and Italy to just over 120 minutes in Sweden.’
Table A II1. Average use frequency of combustible air fresheners calculated from EPHECT (2012) survey data
Multiple choice
answer % of respondents Frequency per year (% of respondents) X (Frequency per year)
At least once a day 19% 365 69.35
Several times a
week 31% 104 32.24
Once a week 15% 52 7.8
Once every two
weeks 9% 26 2.34
Once a month 9% 12 1.08
Less than once a
month 12% 6 0.72
Weighted average (hours per year) 119.5
The average number of hours per day the consumer lights scented candles is then calculated as 85.6 minus X 153.4 per year = 219 hours per year.
Table A II2. Average use frequency of electric plug-in air fresheners calculated from EPHECT (2012) survey data
Multiple choice
answer % of respondents Frequency per year (% of respondents) X (Frequency per year)
At least once a day 40% 365 146
Several times a
week 26% 208 54.08
Once a week 10% 52 5.2
Once every two
weeks 3% 26 0.78
Once a month 7% 12 0.84
Less than once a
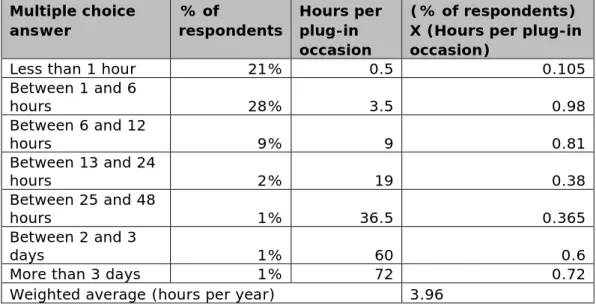
Table A II3. Average duration of electric air fresheners plugged in per occasion, excluding the population who permanently leave the device on
Multiple choice
answer % of respondents Hours per plug-in occasion
(% of respondents) X (Hours per plug-in occasion)
Less than 1 hour 21% 0.5 0.105
Between 1 and 6 hours 28% 3.5 0.98 Between 6 and 12 hours 9% 9 0.81 Between 13 and 24 hours 2% 19 0.38 Between 25 and 48 hours 1% 36.5 0.365 Between 2 and 3 days 1% 60 0.6
More than 3 days 1% 72 0.72
Weighted average (hours per year) 3.96
The average use frequency of electric plug-in air fresheners is 207 times per year, whereas the average duration per occasion is 3.96 hours, excluding those consumers who permanently plug in the device. The number of hours per year is then 3.96 X 207 = 820 hours. However, the device is permanently plugged in at 37% of the households, so that on weighted average, the number of hours for all households in which an electric air freshener is plugged is 820 + 37% X 24 X 365 = 4061 hours
Table AII 4. The use of in-house air fresheners per room
Room % of respondents claiming to
have at least one electric freshener in the room
Living/dining room 60% Bathroom 32% Bedroom 30% Hallway 29% Kitchen 24% WC 23% Closet/Storage room 9%
Other room in the house 7%
Average number of in-houseA air
fresheners 2.14
A: calculated as the sum of the % of respondents claiming to have at least one electric freshener in the rooms, divided by 100%.
7
Adhesive products
This section describes the emissions of substances from the use of adhesives in consumer glue and the use of adhesives in the construction sector.
Process
description EMK Code Population NFR category
Adhesives 0802900 Construction
sector 2D3i
Adhesives 0802901 Consumers 2D3a
7.1 Description of the emission source
Volatile organic compounds (VOCs) are used as substance ingredients in adhesive products such as glues available on the consumer market, or adhesive products used in the construction sector. These VOCs are released to the air during the application of adhesive products.
7.2 Calculation
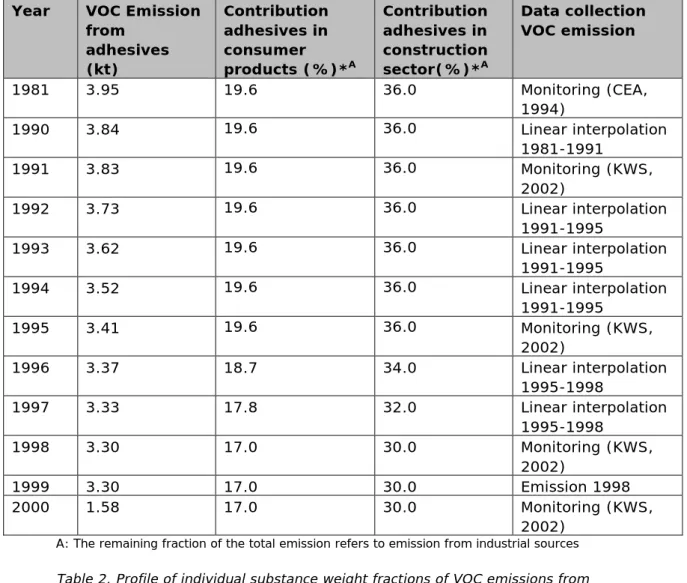
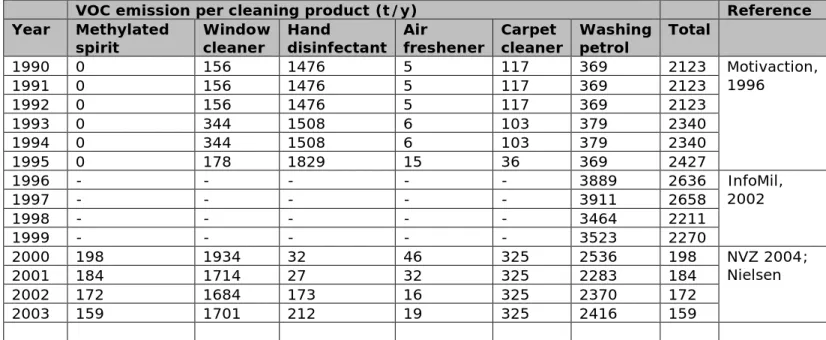
The total VOC emissions between 1990-2000 from adhesive products were estimated by interpolating monitoring data points (Table 1). The contribution of emissions from adhesives in consumer products and the construction sector is quantified according to the MilieuMonitor (1997) and KWS (2002) data. Annual emissions for the period after 2000 are set equal to the estimated emissions for the year 2000. Emissions of individual VOCs from adhesive use in consumer products and the construction sector are calculated as the total VOC emission from adhesives multiplied by the contribution of consumer products, or the contribution construction sector (Table 1) multiplied by the weight fraction of the individual VOC in the emission profile (Table 2).
Table 1. VOC emission for adhesives in consumer products and the construction sector
Year VOC Emission
from adhesives (kt) Contribution adhesives in consumer products (%)*A Contribution adhesives in construction sector(%)*A Data collection VOC emission 1981 3.95 19.6 36.0 Monitoring (CEA, 1994) 1990 3.84 19.6 36.0 Linear interpolation 1981-1991 1991 3.83 19.6 36.0 Monitoring (KWS, 2002) 1992 3.73 19.6 36.0 Linear interpolation 1991-1995 1993 3.62 19.6 36.0 Linear interpolation 1991-1995 1994 3.52 19.6 36.0 Linear interpolation 1991-1995 1995 3.41 19.6 36.0 Monitoring (KWS, 2002) 1996 3.37 18.7 34.0 Linear interpolation 1995-1998 1997 3.33 17.8 32.0 Linear interpolation 1995-1998 1998 3.30 17.0 30.0 Monitoring (KWS, 2002) 1999 3.30 17.0 30.0 Emission 1998 2000 1.58 17.0 30.0 Monitoring (KWS, 2002) A: The remaining fraction of the total emission refers to emission from industrial sources
Table 2. Profile of individual substance weight fractions of VOC emissions from adhesives in consumer products and in the construction industry
Substance ER-Nr Weight fraction of
VOC emission from consumer product adhesives Weight fraction of VOC emission in construction sector adhesives propane 1031 0.099 0.070 isobutene 1042 0.099 0.070 Mixture C2-C10 1201 0.093 0.089 methyleenchloride 1303 0.036 trichloro-ethane 1338 0.090 0.133 monohydroxy compounds 1629 0.047 0.051 esters kp <150 C 1653 0.093 0.103 propanon-2 1680 0.047 0.051 butanon-2 1681 0.233 0.256 dimethylether 1721 0.025 0.024 toluene 2502 0.140 0.153
7.3 Uncertainty and Quality
Substances Activity
data Emission factors Emission
VOC D
7.4 Spatial allocation
Spatial allocation of emissions is based on population density.
7.5 References
KWS. 2002. KWS 2000 Eindrapportage Final Report
MilieuMonitor. 1997. Publicatiereeks emissieregistratie/MilieMonitor. Nr. 37b, maart 2003: elektronische actualisatie: van Nr. 37 juli 1997.
7.6 Version, data and sources
Version 1.0
Date: January 2018 Contact:
Emission expert Organization E-mail adress
8
Anaesthesia (CRF 2.G.3.a)
This section describes the emissions of N2O used as an anaesthetic. Process description Emk_code CRF_code Sector
Anaesthesia 9310100 2.G.3.a Trade and services
8.1 Description emission source
Nitrous oxide (N2O), commonly known as laughing gas, is still used as
an anaesthetic. In addition to N2O, other anaesthetics are in use in the
Netherlands, most commonly halothane, desflurane, enflurane and sevoflurane. It is not known how much of these anaesthetics are used, and because of their decomposition, how much is exhaled again.
Contribution to the national emission
This emission is not a key source of greenhouse gases
The contribution of this source to the total national N2O emission was
<0.5% in 2009.
8.2 Calculation
For the complete time series, the emissions are calculated as follows: Emission = Activity data x Emission factor
Activity data = Amount of N2O sold for anaesthesia
Emission factor = N2O emission from anaesthesia
This is a tier 1 methodology. The methodology is consistent with the IPCC 2006 Guidelines.
a) Activity data
The amount of nitrous oxide sold in the Netherlands would be the best measure for the activity data. Therefore since 2011, all companies known to sell nitrous oxide as anaesthesia to the Dutch market are asked to report their annual sales to the Dutch market. The total of these sales results in the total amount of nitrous oxide used as an anaesthetic in the Netherlands.
In the years prior to the reporting year (2010), an estimate was made based on the sales of the major supplier. In years where sales were not reported by all companies, the total was estimated based on the sales of the other companies; based on the estimated market share of the
largest company selling nitrous oxide as an anaesthetic.
If nitrous oxide is sold as a mixture with oxygen, only the nitrous oxide is calculated as sales.
b) Emission factor
The emission factor for nitrous oxide sold in the Netherlands is 1kg per kg nitrous oxide. All nitrous oxide sold in a certain year is considered to be emitted after use in the same year.
This emission factor is consistent with the 2006 IPCC guidelines.
8.3 Uncertainty and Quality checks
In those cases where all companies report their sales, the uncertainty in the activity data is caused by stock changes on the consumer side (mainly hospitals). Those differences are considered to be negligible. If, on the other hand, not all companies provide their sales, the
uncertainty can be as much as 25%. The uncertainty in emission factor is 0%, because all N2O will be exhaled over time. Both the uncertainty in
activity data and in emission factor are based on expert judgement. Quality codes
Substance Activity data Emission factor Emission
N2O B A B
Quality checks
There are no sector specific quality checks performed. For the general QA/QC, see chapter 2.
8.4 Spatial allocation
Consumer emissions are spatially allocated in the Netherlands based on the number of beds per hospital.
Emission source/process Allocation-parameter
Anaesthesia Number of beds per hospital Details available via
http://www.emissieregistratie.nl/erpubliek/misc/documenten.aspx?ROO T=Algemeen (General)\Ruimtelijke toedeling (Spatial allocation)
8.5 References
Written (or in early years oral) data on sales from companies selling anaesthetics.
8.6 Version, dates and sources
Version: 1.2 Date: May 2015
Responsibility manager task group WESP
Administrator Organisation E-mail address
9
Burning Candles (CRF 2.D.2)
This section describes the emissions as a result of the burning of candles.
Process
description Emk_code CRF_code NFR_code Sector
Burning of
candles 0801000 2D2 2D3i CON
9.1 Description emission source
Within households and in some catering industries, candles are burned to create a pleasant ambiance. Burning candles results in the emission of several substances, for example particulate matter and PAHs.
Contribution to the national emission
This emission is not a key source of greenhouse gases The contribution of this source to the national emissions of
benzo(ghi)pyrene is <10%. For benzo(a)pyrene, the contribution is about 1%.
9.2 Calculation
For the complete time series, the emissions are calculated as follows: Emission = Activity data x Emission factor
Activity data = Amount of candles burned in kg Emission factor = Emission per kg candle
This is a tier 1 methodology. The methodology is consistent with the IPCC 2006 Guidelines.
a) Activity data
The activity data consist of two parts: national statistics on the number of inhabitants of the Netherlands (Dutch bureau for statistics), and the amount of candles burned per person in the Netherlands.
The amount of candles burned per person is retrieved from a company selling candles in the Netherlands. Up to 2009 the amount of candles burned per inhabitant was retrieved from www.bolsius.nl. From 2010, it has been based on expert judgement by a representative from a
company selling candles.
b) Emission factor
The emission factors for burning candles are dependent on the type of candle burned. Both tea lights and regular (gothic) candles have been taken into account, both estimated at 50% usage. Less-used candle
The CO2 emission factor, given in g/MJ candle, is multiplied by a heating
value of 42.7 MJ/kg. Both the CO2 emission factor and the heating value
for candles are derived from the Dutch fuel list 2015 (Zijlema, 2015). All other emission factors are mainly calculated based on EPA 2001.
Substance EF Unit Benzo(ghi)pyrene 0.278 mg/kg candle Benzo(a)pyrene 0.150 mg/kg candle VOC 928 mg/kg candle CO2 73.3 g/MJ candle PM10 0.872 mg/kg candle PM2.5 0.872 mg/kg candle Pb 1.56 mg/kg candle Zn 0.127 mg/kg candle
9.3 Uncertainty and Quality checks
The uncertainty of both the activity data and the CO2 emission factor are
determined in the report on uncertainties in greenhouse gas emissions by Olivier (2009). The uncertainty in activity data is estimated to be 100%. The uncertainty in the emission factor for CO2 is estimated at 20%.
For the other substances (not greenhouse gases), the uncertainty was not determined. Instead, the reliability of the data is qualitatively indicated in the table below with codes A-E (see Appendix A).
The number of inhabitants in the Netherlands is accurately known, but the amount of candles burned per inhabitant is a rough estimate based on data from one manufacturer. Therefore, the activity data are
relatively unsure and rated with a D.
The emission factors are retrieved by combining different sources to improve the reliability. However, since these sources did not take different candle types into account, the emission factors are rated with a C.
Quality codes
Substance Activity data Emission factor Emission
Benzo(ghi)pyrene D C D Benzo(a)pyrene D C D VOC D C D CO2 D C D PM10 D C D PM2.5 D C D Pb D C D Zn D C D Quality checks
There are no sector specific quality checks; for the general QA/QC, see chapter 2.
9.4 Spatial allocation
The emissions of consumers are spatially allocated in the Netherlands based on the population density, following the assumption that most candles are burned in residential areas/households.
Emission source/process Allocation-parameter
Burning of candles Population density Details available via
http://www.emissieregistratie.nl/erpubliek/misc/documenten.aspx?ROO T=Algemeen (General)\Ruimtelijke toedeling (Spatial allocation)
9.5 References
CBS, Dutch Bureau of Statistics, Statline, annual data on the number of inhabitants
EPA; January 2001, Candles and incense as potential sources of indoor air pollution: Market analysis and Literature review; EPA-600/R-01-001.
Fine M. Philip, Glen R. Cass, Bernd R.T. Simoneit; Characterization of fine particle emissions from burning church candles; Environmental Science & Technology vol. 33, NO. 14, 1999.
Gruijter H.J. de, A.J.G. van Rossum; De Kaars; Lesbrief KNCV/NVON; first edition1983.
Information on the amount of candles burned, http://bolsius.nl.
Molder, R. te, Metadata gegevensbeheer emissieregistratie: beschrijving gegevens t.b.v ruimtelijke verdeling van emissies, PBL, Bilthoven, jaarlijks, intern document.
Olivier, J.G.J., Brandes, L.J. and te Molder, R.A.B., 2009, Uncertainty in the Netherlands’ greenhouse gas emissions inventory, PBL
publication 500080013
Vebeka BV; Information on sizes and burning times:, http://vebeka.nl. Zijlema, P.J., 2015; Nederlandse lijst van energiedragers en standaard
CO2 emissiefactoren.
9.6 Version, dates and sources
Version: 1.3 Date: May 2015
Responsibility: manager WESP task group
Administrator Organisation E-mail address
10
Car Products
This section describes NMVOC emission from car products.
Process
description Emkcode NFR code Sector
Car products 0802300 2D3a Consumers
Car products 0802301 2D3i Trade and services
10.1 Description of emission source
NMVOC emission is estimated from the use of car products to maintain and clean company and private cars. Windscreen fluid is considered to contribute 70% of NMVOC emissions (ER, 2017), whereas other car products such as car wax, plastic cleaners, and cockpit sprays together comprise 30% of the emissions. Four different sources of emission are defined:
1. Windscreen fluid used on private cars. 2. Windscreen fluid used on company cars. 3. Other car products used on private cars. 4. Other car products used on company cars.
10.2 Calculation
Emissions from the use of windscreen fluids are calculated as follows: Emission = Activity data x Emission Factor
Windscreen fluids
Activity data = total number of kilometres driven by automobiles in the Netherlands
Emission factor = kg NMVOC emission per driven kilometre in the Netherlands
a) Activity data
Data describing the number of driven kilometres by automobiles in the Netherlands are collected from the website of the Dutch Central Bureau for Statistics (CBS, 2017).
b) Emission factor
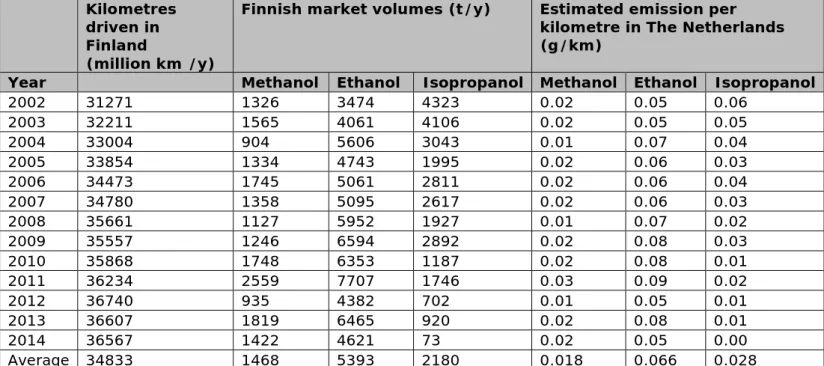
Data describing the market volumes of methanol, ethanol, and
isopropanol as main ingredients in car windshield fluids in Finland for the years 2002-2014 (Table 1) became publically available in 2015 (ECHA 2015a,b,c). The market volumes of these substances in windscreen fluids sold in the Netherlands have been estimated from the Finnish market volumes by correcting for the number of kilometres driven in the Netherlands and Finland as well as the number of frost days in the Netherlands and Finland. Finland’s climate is colder than the
233 days of frost per year (Plantmaps.com), whereas the Netherlands only has 38 days of frost annually (KNMI, 2017). Therefore, the
following correction factor for the difference in climate between Finland and the Netherlands has been applied:
𝑐𝑐𝑐𝑐𝑐𝑐𝑐𝑐𝑐𝑐𝑐𝑐𝑐𝑐𝑐𝑐𝑐𝑐𝑐𝑐𝑐𝑐𝑐𝑐𝑐𝑐𝑚𝑚𝑚𝑚𝑚𝑚𝑚𝑚 =𝑓𝑓𝑐𝑐𝑐𝑐𝑓𝑓𝑐𝑐 𝑑𝑑𝑑𝑑𝑑𝑑𝑓𝑓𝑓𝑓𝑐𝑐𝑐𝑐𝑓𝑓𝑐𝑐 𝑑𝑑𝑑𝑑𝑑𝑑𝑓𝑓𝑁𝑁𝑚𝑚𝑚𝑚ℎ𝑚𝑚𝑒𝑒𝑐𝑐𝑚𝑚𝑒𝑒𝑒𝑒𝑒𝑒+ 𝑐𝑐𝑐𝑐𝑐𝑐 𝑓𝑓𝑐𝑐𝑐𝑐𝑓𝑓𝑐𝑐 𝑑𝑑𝑑𝑑𝑑𝑑𝑓𝑓𝑁𝑁𝑚𝑚𝑚𝑚ℎ𝑚𝑚𝑒𝑒𝑐𝑐𝑚𝑚𝑒𝑒𝑒𝑒𝑒𝑒× 0.23 𝐹𝐹𝑐𝑐𝑒𝑒𝑐𝑐𝑚𝑚𝑒𝑒𝑒𝑒+ 𝑐𝑐𝑐𝑐𝑐𝑐 𝑓𝑓𝑐𝑐𝑐𝑐𝑓𝑓𝑐𝑐 𝑑𝑑𝑑𝑑𝑑𝑑𝑓𝑓𝐹𝐹𝑐𝑐𝑒𝑒𝑐𝑐𝑚𝑚𝑒𝑒𝑒𝑒× 0.23
= 38 + 327 × 0.23
233 + 132 × 0.23 = 0.43
Following on from this, the emissions of methanol, ethanol and isopropanol used in windscreen fluids per driven kilometre in the Netherlands are estimated as follows:
𝑐𝑐𝑒𝑒𝑐𝑐𝑓𝑓𝑓𝑓𝑐𝑐𝑐𝑐𝑐𝑐𝑁𝑁𝑚𝑚𝑚𝑚ℎ𝑚𝑚𝑒𝑒𝑐𝑐𝑚𝑚𝑒𝑒𝑒𝑒𝑒𝑒
𝑘𝑘𝑐𝑐𝑘𝑘𝑐𝑐𝑒𝑒𝑐𝑐𝑐𝑐𝑐𝑐𝑐𝑐𝑓𝑓𝑁𝑁𝑚𝑚𝑚𝑚ℎ𝑚𝑚𝑒𝑒𝑐𝑐𝑚𝑚𝑒𝑒𝑒𝑒𝑒𝑒=
𝑒𝑒𝑑𝑑𝑐𝑐𝑘𝑘𝑐𝑐𝑐𝑐 𝑣𝑣𝑐𝑐𝑘𝑘𝑣𝑣𝑒𝑒𝑐𝑐𝐹𝐹𝑐𝑐𝑒𝑒𝑐𝑐𝑚𝑚𝑒𝑒𝑒𝑒
𝑘𝑘𝑐𝑐𝑘𝑘𝑐𝑐𝑒𝑒𝑐𝑐𝑐𝑐𝑐𝑐𝑐𝑐𝑓𝑓𝐹𝐹𝑐𝑐𝑒𝑒𝑐𝑐𝑚𝑚𝑒𝑒𝑒𝑒 × 𝑐𝑐𝑐𝑐𝑐𝑐𝑐𝑐𝑐𝑐𝑐𝑐𝑐𝑐𝑐𝑐𝑐𝑐𝑐𝑐𝑐𝑐𝑐𝑐𝑐𝑐𝑚𝑚𝑚𝑚𝑚𝑚𝑚𝑚
Table 1 includes the market volumes of methanol, ethanol and
isopropanol in windscreen fluid in Finland (ECHA, 2015b), the number of kilometres driven by automobiles in Finland (Liikenneviraston Tilastoja, 2017) and the estimated emission per driven kilometre in the
Netherlands (g/km).
Kilometres driven in Finland
(million km /y)
Finnish market volumes (t/y) Estimated emission per
kilometre in The Netherlands (g/km)
Year Methanol Ethanol Isopropanol Methanol Ethanol Isopropanol
2002 31271 1326 3474 4323 0.02 0.05 0.06 2003 32211 1565 4061 4106 0.02 0.05 0.05 2004 33004 904 5606 3043 0.01 0.07 0.04 2005 33854 1334 4743 1995 0.02 0.06 0.03 2006 34473 1745 5061 2811 0.02 0.06 0.04 2007 34780 1358 5095 2617 0.02 0.06 0.03 2008 35661 1127 5952 1927 0.01 0.07 0.02 2009 35557 1246 6594 2892 0.02 0.08 0.03 2010 35868 1748 6353 1187 0.02 0.08 0.01 2011 36234 2559 7707 1746 0.03 0.09 0.02 2012 36740 935 4382 702 0.01 0.05 0.01 2013 36607 1819 6465 920 0.02 0.08 0.01 2014 36567 1422 4621 73 0.02 0.05 0.00 Average 34833 1468 5393 2180 0.018 0.066 0.028 The origin of the proportion of emissions from car products is assigned
as follows: 60% from consumers and 40% by trades and services (ER, 2017). The emission factors for consumers and trades and services are calculated by multiplying the average estimated emission per kilometre in the Netherlands (g/km) over the period of 2002-2014 (Table 1) with these proportions (Table 2).
NMVOC in
windscreen fluid Emission factor consumers (g/km) Emission factor trades and services(g/km)
Methanol 0.011 0.07
Ethanol 0.040 0.027
Isopropanol 0.017 0.011
Other car products
Activity data = amount of NMVOC in car products other than windscreen fluid sold in the Netherlands
Emission factor = emission per kg NMVOC in car products
a) Activity data
In 1997, bureau CREM conducted a study using car product monitoring data for the years 1994 and 1996 (CREM, 1997). The monitoring data originated from questionnaires filled in producers and suppliers of car products. In 1998, a recall survey was conducted by telephone in which the data for 1997 was established. The recall contained information from 26 companies (18 companies in the 1997 survey and 8 new companies). It was estimated that these 26 companies cover 80% of the market. The companies provided sales data of car products and the average amount of NMVOC these products contained. This information was then used to determine the NMVOC emissions from car products.
The 1997 monitoring data (CREM 1998) are still used for calculating NMVOC. The data from CREM (1998) is the most recent information available that refers to car products other than windscreen fluid.
b) Emission factor
NMVOC totals are recalculated to individual substances using an average car product profile. The profiles were established for car products by TNO (1992) in cooperation with the car products branch.
Substance in car product profile factor
Propane 0.12
Isobutane 0.12
Monohydroxyverbindingen 0.54
Dimethyl ether 0.03
Hydrocarbon. mixture. c2-c10 <25% aromatic. 0.18
These totals include the emissions from windscreen fluids. Windscreen fluid is considered to contribute 70% of the NMVOC emission (ER, 2017). Therefore, the NMVOC totals have been multiplied by 30% to correct for this, so that only emissions from the use of car products other than windscreen are estimated. Furthermore, the emissions from other car products have been divided into the target groups of
consumers (≈ 60%) and of trade and services (mostly garages ≈ 40%).
10.3 Uncertainty
qualified with a D. Both the emission factor and the activity data for the other car products are outdated, therefore the uncertainty is considered high and qualified with an E.
Since the NMVOC from windscreen products is about 70% of the
emissions, the overall quality of the activity data is estimated with a D. The quality of the emission factors is qualified with a D.
10.4 Spatial allocation
The emissions of consumers and trade and services are allocated in the Netherlands based on population density. Details are available at http://www.emissieregistratie.nl/erpubliek/misc/documenten.aspx?ROO T=Algemeen (General)\Ruimtelijke toedeling (Spatial allocation)
10.5 References
CBS, (1998 en latere jaren) Statistiek Motorvoertuigen, CBS, Heerlen. CBS, Dutch Central Bureau for Statistics. 2017.
http://statline.cbs.nl/Statweb/publication/?DM=SLNL&PA=80302n ed&D1=a&D2=a&D3=6,19,l&HDR=T&STB=G1,G2&VW=T
consulted October 3rd 2017
Chemiewinkel UvA,1999, Herziening Milieukeur Autoreinigingsmiddelen, Conceptrapportage, augustus 1999, Amsterdam.
CREM, 1997, NMVOS-emissies auto-onderhoudsproducten, CREM, Amsterdam (niet openbaar).
CREM, december1998, VOS-emissies auto-onderhoudsproducten, herhaalmeting 1997, CREM, Amsterdam (niet openbaar).
Emission Registration (ER), 2009. Netherlands Emission Registry. Data on 2009 available from www.emissieregistratie.nl
Emission Registration (ER), 2017. Methods used for the Dutch Emission Inventory. Product usage by consumers, construction and services 2017
European Chemicals Agency (ECHA). 2015a. Annex XV restriction report proposal for a restriction substance name: methanol.
European Chemicals Agency (ECHA). 2015b Comments and response to comments on Annex XV restriction dossier submitted by Poland on 16/01/2015 public consultation on Annex XV report started on 18/03/2015.
European Chemicals Agency (ECHA). 2015c. Committee for Risk
Assessment (RAC) Committee for Socio-economic Analysis (SEAC) Opinion on an Annex XV dossier proposing restrictions on Methanol ECHA/RAC/0000006324-78-01/F ; ECHA/SEAC/ RES-O-0000001412-86-100/F
European Chemicals Agency (ECHA). 2017
https://echa.europa.eu/previous-consultations-on-restriction-proposals/-/substance-rev/7202/term consulted October 3rd 2017
KWS2000/InfoMil, 1998, Jaarverslag 1996-1997, InfoMil, Den Haag. Liikenneviraston Tilastoja. 2017 Tietilasto 2016 Vägstatistik Finnish Road
Statistics. 4/2017
Date: January 2018
Responsibility: manager WESP task group
Administrator Organisation E-mail address
J. Meesters RIVM Joris.Meesters@rivm.nl Note: Since 1999, no new data has become available on emission variables and emission factors of car products other than windscreen fluids. Therefore, the data used may be outdated.
11
Carbolineum treated wood
This section describes emissions resulting from Carbolineum treated wood.
Process description EMK
Code Target group NFR
Carbolineum treated wood 0802500 Consumers 2D3i Carbolineum treated wood 0802501 Agriculture 2D3i Carbolineum use 0802600 Consumers 2D3i Carbolineum use 0802601 Agriculture 2D3i Carbolineum is a pesticide that is brushed on wooden surfaces in order to prevent woodworm and moulds from affecting wooden constructions in housings, gardens and agriculture. The use of carbolineum for treatment of wood in contact with groundwater has been prohibited since 1999, and as a consumer product since 2001 (KWS, 2002).
11.1 Description of the emission source
Emission from carbolineum is released via two processes:
• Emissions from wood that has been treated with carbolineum in the past. Carbolineum contains VOCs and PAHs that evaporate to outdoor air or leach to soil from the surfaces of the treated wood. • Emissions during the treatment of wood with carbolineum (VOC).
11.2 Calculation
The emissions of VOCs and PAHs from carbolineum treated wood are calculated by multiplying activity rates (AR) with respective emission factors (EF).
Emission = AR X EF
a) Activity data
Four different activity rates are considered:
• the area of carbolineum treated wood (treated in the past) for consumer use (m2)
• the area of carbolineum treated wood (treated in the past) for agricultural purposes (m2)
• the volume of carbolineum used by consumers during treatment (t.y-1)
• the volume of carbolineum for agricultural purposes during treatment (t.y-1).
It is assumed that 25% of the total volume of carbolineum used is for agricultural purposes and 75% for consumer use. It is also assumed that 25% of the total area of treated wood is for agricultural purposes and 75% for consumer. The total volumes of carbolineum used as well as the total surface area of carbolineum treated wood before 2001 are taken from Infomil (KWS, 2002). The use of carbolineum has been
from treatment with carbolineum. The surface area of the carbolineum treated wood standing from earlier years is assumed to be reduced each year by 20%, which implies that 5 years after the prohibition of the carbolineum, there is no longer any carbolineum treated wood remaining, and therefore no longer any emissions occur from this source.
b) Emission factors
The emission factors for PAHs and VOCs released to the environment during treatment, as well as those for evaporation and leaching from the surface of treated wood is summarised in Table 1. The emission factors apply both to consumer use and agricultural use.
Table 1 Emission factors for carbolineum use and carbolineum treated wood. Substance kg emission per million kg carbinoleum used kg emission per million m2 treated wood Naphthalene 0.02 0.0001 Anthracene 0.0005 0.00006 Fenanthene 0.015 0.0011 Fluoranthene 0.002 0.00049 Benzo(a)-anthracene 0.00027 0.000055 Chrysene 0.000026 0.00001
Benz(k)-Fluoranthene 2.9E-07 1.1E-07
Benzo(a)-pyrene 1.4E-06 5.70E-07
Benz(ghi)-Perylene 3.1E-07 1.20E-07
Pyrene 3.1E-07 1.2E-07
NMVOC 0.25 -
11.3 Uncertainty
Source Activity
data Emission factors Emission
Carbinoleum use D C D
Carbinoleum treated wood D C D
11.4 Spatial allocation
Spatial allocation of emissions is based on population density.
11.5 References
KWS 2000 eindrapportage, Infomil, Den Haag 52
11.6 Version, date, sources
Version: 1.0 Date: March, 2018 Task group leader:
Task group leader Organization E-mail adress


![Table 3: Emission factors for PAH-compounds from creosote treated wood, (10-3 kg/m2) [5]](https://thumb-eu.123doks.com/thumbv2/5doknet/2993510.4897/130.892.171.718.604.736/table-emission-factors-pah-compounds-creosote-treated-wood.webp)
![Table 4: Emission factors for arsenic from wood treated with Wolman salts based on [4], (10-3 kg/m3) Emission factor in reported year](https://thumb-eu.123doks.com/thumbv2/5doknet/2993510.4897/131.1263.178.1104.222.771/table-emission-factors-arsenic-treated-wolman-emission-reported.webp)
