Exploration of pathways
towards a clean
economy by 2050:
Exploration of pathways towards
a clean economy by 2050
Exploration of pathways towards
a clean economy by 2050
How to realise a climate-neutral
Netherlands
PBL Netherlands Environmental Assessment Agency Energy research Centre of the Netherlands
This publication can be downloaded from www.pbl.nl/en. This is the translated summary of the Dutch report ‘Naar een schone economie in 2050: routes verkend. Hoe Nederland klimaatneutraal kan worden’, PBL publication number: 500083014 / ECN publication number: ECN-O- -11-076.
Parts of this publication may be reproduced, providing the source is stated, in the form: PBL/ECN 2011, Exploration of pathways towards a clean economy by 2050, How to realise a climate-neutral Netherlands, The Hague: PBL Netherlands Environmental Assessment Agency.
The PBL Netherlands Environmental Assessment Agency is the national institute for strategic policy analysis in the fields of environment, nature and spatial planning. We contribute to improving the quality of political and administrative decision-making by conducting outlook studies, analyses and evaluations in which an integrated approach is considered paramount. Policy relevance is the prime concern in all our studies. We conduct solicited and unsolicited research that is independent and always scientifically sound.
The Energy research Centre of the Netherlands (ECN) is the largest energy research institute in the Netherlands. It has a strong international position in the areas of Biomass, Solar Energy, Wind Energy, Policy Studies and Sustainable Process and Heat Technology. With and for the market, we develop knowledge and technology that enable a transition to a sustainable energy system. ECN focuses its research on sustainable energy generation to develop safe, efficient, reliable and environmentally friendly energy systems. ECN also conducts research on future opportunities and economic backgrounds related to energy.
Exploration of pathways towards a clean economy by 2050
How to realise a climate-neutral Netherlands
© PBL Netherlands Environmental Assessment Agency
The Hague, 2011
PBL publication number: 500083016 ECN publication number: ECN-O--11-077 ISBN: 978-90-78645-85-6
Corresponding authors
jan.ros@pbl.nl
robert.koelemeijer@pbl.nl
Authors
Jan Ros, Robert Koelemeijer, Hans Elzenga, Jeroen Peters (all PBL) Michiel Hekkenberg (ECN) and Peter Bosch (TNO).
Graphics
Marian Abels, Filip de Blois, Jeroen Peters
English translation
Serena Lyon
English-language editing
Annemieke Righart
Production co-ordination
PBL Publishers, The Hague
Cover photo
NuonSolarteam/Hans Peter van Velthoven/ Hollandse Hoogte
Layout
5
Introduction |
Introduction
A significant reduction in greenhouse gas emissions is required if climate change is to be limited to an acceptable level. This will involve a radical change in the energy system and will take some time. Achieving such a change is a complex task – as well as providing many chances, it also raises many questions concerning energy resource availability, the opportunities offered by innovative technologies and the achievability of institutional change. A period of 40 years (up to 2050) in this context is actually quite short.
There are four important pillars for a clean energy system: reduction in energy demand; biomass; carbon capture and storage; and more use of CO2-free electricity (wind, solar, nuclear). Each of these pillars will play a crucial role, but there are uncertainties about the possibilities of innovative technologies, the availability of new resources and the feasilibility of institutional changes.
The Dutch Government plans to present a roadmap towards a cleaner country by 2050. This roadmap may form the foundation for a more clear and consistent policy, focusing on the long term. Further development and implementation of each of the four pillars are important elements of such a policy. Its realisation will have the character of a search, taking into account new knowledge and changing circumstances.
It is up to stakeholders and public bodies to gradually implement this roadmap. The PBL Netherlands Environmental Assessment Agency has supported this policy process together with the Energy research Centre of the Netherlands (ECN), by exploring technical possibilities and steps to take, the results of which are presented in this report.
Professor Maarten Hajer
Contents
Summary 10
Exploration of pathways towards a clean economy by 2050 12 Findings 13
1 Introduction: starting point and approch 14
2 The current Dutch energy system 16
3 Reference scenario for 2050 20
4 Four pillars for a low-emission system 22
4.1 Reduced energy demand 22 4.2 Biomass 24
4.3 Carbon capture and storage 26
4.4 Electrification and zero-CO2 emission electricity generation 27 4.5 Reduction in emissions of other greenhouse gases 29
5 Robust elements for the Netherlands in 2050 30
5.1 Analysis criteria 30
5.2 Achieving the objective: the dependence on resource availability and technologies 31
5.3 The importance of specific technologies for 2050 35 5.4 Emission reductions in the various sectors 37 5.5 Direct costs and economic effects 38
6 Important steps in learning and implementation pathways 42
6.1 First steps 42
6.2 Required transition time frames 44
7 Common barriers and a possible government role 46
9 Bevindingen |
SUMMAR
Y
SUMMAR
Y
10 | Exploration of pathways towards a clean economy by 2050
Exploration of
pathways towards
a clean economy
by 2050
How to realise a
climate-neutral Netherlands
Summary
• Many different scenarios are possible for a low-CO2 energy system that delivers an 80% reduction in greenhouse gas emissions by 2050. It is certain that such a system will be very different from the present one, and that this will require a comprehensive and prolonged process of change. Developing innovative technologies will take many decades, as will the replacement of existing products and processes with new products and processes and the development of the associated production chains and
infrastructure. Companies involved in these processes rely strongly on one another for a return on their investments and therefore take a cautious approach. As a result, a time frame of 40 years is considered narrow.
• The transition to a clean economy in the Netherlands by 2050 will be based on four pillars: reduced energy demand, the use of biomass, carboncapture and storage, and zero CO2 emissions from electricity generation (wind, solar and nuclear energy) in combination with a larger share of electricity in the total energy consumption (electrification). Failure to apply any one of these could result in excessive pressure on the other three. Given the many uncertainties surrounding the implementation of each of these pillars to their maximum capacity, this would present a high-risk strategy. • Based on moderate economic growth and taking into account current policy, the energy
demand in 2050 could be almost 15% higher than it is now. However, a strict energy-saving policy may be able to realise a further reduction of 30%. To achieve such a
11
Summary
reduction, it will probably be necessary to implement also expensive savings measures, supplemented to a limited extent with behavioural change.
• Without the implementation of biomass, emission reductions of 80% will be close to impossible. The Netherlands will probably need to import biomass, although there is great uncertainty about a sustainable global supply. The higher the demand for biomass, the higher the risk of increases in greenhouse gas emissions due to indirect land-use changes.
• Biomass is preferably used to produce liquid biofuels and green gas. These can be used in sectors for which there are few or very uncertain alternatives in 2050, such as in aviation, road freight, small industry and existing buildings. There are many clean alternatives for electricity generation, which makes it less favourable to apply in power stations into the future vision.
• Combining biomass with carboncapture and storage (CCS) in fuel production is important as this makes it possible to achieve negative emissions (carbon sequestered from the atmosphere is first stored in plants and trees, then finally ends up
underground). This can be used for compensating residual emissions that are difficult to remove entirely, such as non-CO2 greenhouse gases from agriculture.
• Carbon capture and storage is also highly relevant for large industrial plants and power stations. The Netherlands has a fairly large storage capacity in empty gas fields, but this will not be sufficient for the potential demand under various system scenarios. There are very large aquifers in the north-western part of the North Sea which may have sufficient capacity to meet the needs of the whole of Europe for the coming decades. However, the lack of experience in filling such storage reservoirs to maximum capacity means that there is still considerable uncertainty regarding actual storage capabilities, in particular with regard to aquifers.
• Wind turbines, nuclear power stations and solar panels do not produce any direct greenhouse gas emissions. They also have the potential to produce much more than the current electricity demand in the Netherlands. This, in combination with a shift in energy demand from fuels to electricity, could provide a basis for a clean system. The use of electrical heat pumps and electric vehicles are also part of the electrification scenario. It may also be possible to convert any temporary surplus of electricity into hydrogen. The technologies named, therefore, will make a significant contribution in 2050, although it would be going too far to say that any single technology will be indispensable.
• A disadvantage of these technologies as far as electricity generation is concerned, and this applies in particular to wind and sun, is the limited control over supply. This makes it difficult to match supply to demand. One effective solution strategy would be to increase the interconnection with the rest of Europe, and possibly North Africa. At this
12 | Exploration of pathways towards a clean economy by 2050
scale, supply and demand patterns would level out, to some degree, and pumped storage could also be used as an additional balance strategy. However, the construction of a pan-European electricity grid will require the cooperation of all European
countries, and this will not be an easy task. One alternative which would give the Netherlands more control would be to convert any surplus of clean electricity into energy carriers, such as hydrogen or hydrocarbons.
• The total direct annual cost in 2050 of an energy system that produces a maximum of 45 Mt in greenhouse gas emissions is projected to be between 0 and 20 billion euros more, annually, than under a continued use of current technologies. Costs cannot be determined more accurately due to uncertainties around cost levels of many still developing technologies combined with changes in the price of fossil fuels and biomass. Capital costs for energy supply and energy-saving measures are expected to increase, and fuel costs to decrease. There will also be a significant decrease in the dependence on oil, gas and coal. These probably higher direct costs may be offset by positive external effects on health and ecosystems and savings related to the avoidance of climate change damage and the costs of adaptation. However, this is not explored any further in this report or included in the results.
• The various technologies that may play a significant role in 2050 (e.g. biomass gasification, carboncapture and storage, and vehicles running on electric motors) will not be required to achieve the policy goals for 2020. Their still relatively high costs mean that they are not suited to a cost-effective approach in the short term. However, innovation policy that focuses on these technologies and associated systems is required now in order to achieve the goal for 2050.
• Technology learning is largely an international process. Participation by the Netherlands in this process it is not necessary for all new technologies. However, delaying the process for too long will mean that these technologies are less likely to be used to their full potential in the Netherlands by 2050. After all, experience with implementation and maintenance of new technologies also has to take place on a national level.
• Further exploration of the pathway towards a clean economy is up to stakeholders and government. However, specific attention should be paid to the further implementation of innovative technologies, suitable funding mechanisms, choice of instruments, cost distribution, new public–private partnerships, the scope for public initiatives and making use of new market opportunities. In doing so, it is essential that international developments are also explored. Neighbouring countries (in particular, Germany, the United Kingdom and Denmark) provide useful examples, and it may be beneficial to strengthen cooperation with these countries.
13
Bevindingen |
14 | Exploration of pathways towards a clean economy by 2050
ONE
Introduction:
starting point and
approach
In March 2011, the European Commission produced a roadmap outlining how greenhouse gas emissions in Europe could be reduced by 80% from 1990 emission levels, by 2050. Europe needs to make such a reduction to limit global warming to two degrees Celsius. Other developed and developing countries are also expected to make an appropriate contribution. The current Dutch Cabinet has decided to produce a similar roadmap for the Netherlands. The Dutch Ministry of Infrastructure and the Environment asked the PBL, ECN and TNO to produce a summary of the opportunities and technical possibilities associated with such a significant reduction in emissions. Although our analysis is also based on this 80% emission reduction, we are aware that, to date, no targets have been set for individual countries, and that the reduction percentage for the Netherlands could be less or more than that for Europe as a whole. However, whatever the situation, significant reductions are certain to be required, from the climate policy perspective. The 2050 time horizon may seem far away, but the impact of such a significant reduction means that there is no time to lose. The time between now and the target year of 2050 must be used to the full to achieve required innovations at system level. After all, freeing ourselves from the existing system will be no easy task. The construction of a new system that makes use of more sustainable and cleaner technology will take many decades, and the investments made over the coming years will partly determine the situation in 2050. In addition, the necessary preparations, the learning process and putting in place the required partnerships and procedures will also take time. Therefore, a vision must be developed today for a pathway to a low-emission society in 2050, and the transition process must be entered into immediately.
15
Inleiding |
ONE ONE
To this end, this report explores various possible pathways to various possible final destinations. The purpose of this exploration is to support further development of the roadmap by the various stakeholders involved, including the Dutch Government. At present, a large share (about 80%) of greenhouse gas emissions is the direct result of the use of fossil fuels. The remaining 20% comes from food production, waste removal and industrial processes. A reduction of 80% primarily requires a fundamental change in the energy system, which therefore is the focus of this report, although the other sources are also briefly discussed. The focus is on the Netherlands, although of course within the European and global context, and under the assumption that the rest of the world also works towards a strong climate policy.
The analysis applies the backcasting method, which involves backtracking from desired outcomes to determine which steps would be required now (see Figure 1). First, an analysis was made of which clean energy systems are technically feasible, and this produced many different variations. From this, we distilled the importance of various technologies, and addressed the steps required for their realisation, as well as the order in which they would need to be taken. The roadmap includes not only implementation pathways for robust elements, but also learning pathways to make good choices along the way. The total process will be a quest with many uncertainties along the way, including cost. Our aim, therefore, was not to outline the most cost-effective system for the long term, but rather to explore the range and diversity of possibilities.
Figure 1
Methodology of backcasting and steps to follow
Desired quality in the long term
First steps:
Which steps to take, by whom should they be taken, and with which policy support? Robust elements of
these system options Implementation pathways
(Road maps) Learning pathways(Road maps)
Uncertainties about parts of the system options System options for the long term
16 | Explorations of pathways towards a clean economy by 2050
twO
The current Dutch
energy system
this section outlines the current state of the Dutch energy system. this provides an idea of the order of magnitude, but is also important as future energy demand will be partly determined by the current status of the built environment, industrial production and infrastructure.
Figure 2 provides a summary of the current energy flows in the Netherlands. the different colours represent the various energy carriers and the width of the flows their relative volumes. As can be seen, the Netherlands has a large oil re-export (crude oil and oil products), and refinery products are intended mainly for export and bunkers (fuel bought in the Netherlands for international shipping and aviation). A relatively small proportion of oil products (e.g. petrol, diesel, naphtha, fuel oil) are for the Dutch transport sector and industry. the Netherlands clearly produces a lot of natural gas, half of which is for export, but a fair amount is also imported. the energy-using sectors (services, households, agriculture, industry and transport) are indicated on the right-hand side of Figure 2. Energy use by households, services and agriculture is mainly in the form of gas (for heating) and electricity (primarily generated by gas and coal). the use of residual heat from energy conversion (in power plants, CHP plants and refineries) can also be seen. the current annual energy consumption of the combined end-use sectors (services, households, agriculture, industry and transport) is about 2,800 PJ (1 petajoule = 1015 joules). this includes non-energy uses, such as the production of plastics using oil and gas. Roughly another 700 PJ is used to produce electricity and transport fuels from crude oil. total energy use in the Netherlands is about 3,500 PJ. the CO2 that is released from the combustion of 1 PJ of gas, oil or coal is about 57, 73 and 94 kilotonnes, respectively. CO2 emissions from the combustion of gas, oil and coal, therefore, total about 180 Mt
17
the current Dutch energy system |
twO twO
CO2 (including process emissions). Roughly an additional 30 Mt of other greenhouse gases (CH4, N2O and F gases) are emitted from agriculture and industry. Emissions from international aviation and shipping are also included in this study, calculated in proportion to the Dutch share of global GDP. Although not included in national emissions in current international treaties, they of course also contribute to climate change. Calculated in this way, the contribution from international transport amounts to more than 10 Mt.
Figure 2
Energy flows in the Netherlands, 2009
Natural gas Crude oil Petroleum products Coal Nuclear energy Electricity Heat Waste, biomass, biogas, biofuel Winning Sustainable Import Stocks
Power plants and waste incineration
Decentralised cogeneration Transport Agriculture Households Industry Services Refineries
Export Bunkers Stocks
Energy flow diagram representing current energy management in the Netherlands. The width of the flows represents the relative energy volumes. From left to right, the diagram shows energy production (far left), various energy conversions, and the end use in various sectors (far right). From top to bottom, the diagram shows import and export, energy use for international transport (bunkers) and stock changes.
18 | Explorations of pathways towards a clean economy by 2050
twO
In 1990, greenhouse gas emissions in the Netherlands from the sources named were 223 Mt CO2 equivalent. A reduction target of 80% from 1990 levels, therefore, implies a reduction of almost 180 Mt, in order to reach a level of 45 Mt CO2 equivalent by 2050. this equals an average annual reduction of 4.5 Mt over the next 40 years – something which represents a huge challenge, given that emissions have failed to decrease over the last 20 years, despite all the policy and technology developments.
19
the current Dutch energy system |
20 | Exploration of pathways towards a clean economy by 2050
THREE
Reference scenario
for 2050
To get an idea of the amount of energy required in 2050 we need to make a number of assumptions about future production and consumption levels in the Netherlands. The assumptions made in this report are based on the Reference Projection, a report by ECN and PBL (ECN/PBL, 2010) that projects developments in demand for goods, services and transport. For this report, we extrapolated these projections to the year 2050.
The reference scenario assumes no drastic changes in the economic structure of the Netherlands. The country will retain its energy-intensive industry and its trade will continue to focus primarily on Europe. The relative importance of the service sector, however, is thought to increase. An annual economic growth of 1.7% is assumed up to 2020, after which it will decrease to 1.3% (with productivity continuing to increase but with a decreasing working population after 2020). The assumption made in this study is that the population will increase from the current level of 16.5 million to 17.5 million by 2050.
All these developments have an effect on emissions. However, technology will also continue to develop, sometimes as a result of existing policy. This results in a reference scenario for 2050 in which the end-use sectors consume almost 15% more energy than at present, and in which greenhouse gas emissions remain more or less steady at current levels. This report discusses the possibilities for realising an emission level of less than 45 Mt, under the activity levels assumed in the 2050 reference scenario.
21
Reference scenario for 2050 |
THREE THREE
The economy as well as the energy demand could differ significantly in 2050 from that outlined above. However, this is implicitly incorporated into the analysis of clean economy options that is based on various levels of energy demand, which has the largest influence on greenhouse gas emissions.22 | Exploration of pathways towards a clean economy by 2050
FOUR FOUR
Four pillars for
a low-emission
system
Four groups of mainly technological options can be defined that form important pillars for a future low-emission system:
• reduction in energy demand;
• biomass application to fully or partly replace coal, gas, oil and oil products; • carboncapture and storage;
• electricity generation without direct CO2 emissions (wind, solar and nuclear energy) in combination with end-user electrification.
These four groups of technological options can each be implemented at many points in the energy system. They include a wide variety of already existing technologies, although many of these are still in the development phase. It is of course also possible that new technologies will be developed between now and 2050, but the chance that they will make a significant contribution to the energy system as early as 2050 is small. Each of the pillars named offers many possibilities, but also has its limitations. This chapter addresses these limitations first.
This study focuses primarily on the reduction in greenhouse gas emissions, and does not address other pros and cons of the technologies. The risk associated with nuclear energy, for example, is not discussed.
4.1 Reduced energy demand
Greenhouse gas emissions are related to production and consumption and thus are coupled to the level of economic activity by 2050. As the economy continues to grow, an
23
Four pillars for a low-emission system |
FOUR FOUR
increase in these activities can also be expected. In the hypothetical situation that the 2050 state of technology equals that of today, this would imply a significant increase in energy consumption (see Figure 3, current technology). Three types of policy strategy options to reduce energy demand can be defined: more efficient production processes, more efficient products and changes in consumer behaviour. Each of these options can be expected to result in improvements, partly due to existing policy, such as new standards in housing construction and for electrical appliances and passenger vehicles. Despite these independent efficiency improvements, however, the reference scenario shows an increase in energy consumption of almost 15% compared with current levels (Figure 3). This increase takes place mainly in traffic (including aviation) and industry. The amount of heating required in buildings will decrease. A number of additional measures could also be taken to further reduce energy demand, and are briefly described below.
First of all, efficiency improvements could be made in production processes and chains. There are many different processes and products, and many of these will be very different in 40 years’ time, so that it is only possible to give rough estimates of the potential total savings. Savings of 1.5%, annually, considered reasonable up to 2050, will result in a limited reduction compared with the reference scenario. Such savings can be realised if equipment is replaced with the best available technology, as well as the newest processes, electric motor systems and separation techniques and residual heat system configurations, must be used.
Secondly, product designs and specifications can be adapted to make their use more efficient (eco efficiency). The insulation of buildings is an important example of more efficient design. Figure 3 shows the potential savings that can be made if the energy performance of existing homes, on average, is brought up to a higher energy efficiency level. Cars can also be made more efficient, as can the electrical appliances used in homes and businesses.
Finally, consumers can make other choices, such as using the bicycle or public transport rather than the car, setting the thermostat a degree lower or eating fewer animal products. The savings expected to be achieved in practise through such behaviour changes are usually in the order of 10% to 15%, although this of course depends very much on the importance attached to such changes by consumers.
If fewer animal products are consumed, or products are manufactured using lighter materials, then the corresponding reduction in emissions will be seen in the relevant production chains. Due to the relatively large amount of import and export, such emission reductions will in many cases not be seen in industry or agriculture in the Netherlands itself, but could be significant from a global perspective.
The above-mentioned measures reduce the total expected energy demand by about 30% compared with the reference scenario (Figure 3, potential technological options). The energy demand in the analysis, therefore, varies between that of the reference scenario and a level of 30% lower.
24 | Exploration of pathways towards a clean economy by 2050
FOUR FOUR
4.2 Biomass
Sustainably produced biomass is an attractive potential replacement for coal, oil products and natural gas, as the CO2 released during combustion is compensated for by that sequestered when growing the biomass. These emissions are therefore not included in total emission figures. Biomass can be used to produce various forms of energy
Figure 3
Reference image, 2050
Energy demand per sector
Traffic and transport Built environment, heating Built environment, electricity Industry Agriculture
Total for the Netherlands
0 50 100 150 200
Index (2008 = 100) 2008
2050
Using current technology Autonomous development
With maximum application of efficiency options
Traffic and transport Built environment, heating Built environment, electricity Industry Agriculture 5 % 28 % 10 % 23 % 34 % Sector contributions, 2008
Energy demand in 2050, based on activity levels in the reference scenario. This shows the energy demand if current technologies are applied, the energy demand with efficiency improvements as assumed in the reference scenario, and if maximum technological potential is applied to reduce energy demand. A number of consumer changes are also included in the last variant.
25
Four pillars for a low-emission system |
FOUR FOUR
carriers: solid, liquid, gas (including hydrogen), warm water and electricity. With so many applications, a rapid increase in demand is possible, although the sustainable global supply is not unlimited. Estimates of availability in 2050 vary enormously. Based on most literature sources, a sustainable supply of 150 EJ (1 exajoule = 1018 joules) is considered reasonable. It could be higher, up to 400 EJ, but the uncertainties regarding the
sustainable production of such a large supply will then also increase. A number of factors determine the spread in the potential availability of biomass in 2050:
• Land is required to grow biomass, and this applies to both agricultural products and timber plantations. This is always at the cost of other land-use functions, and in practice mostly at the cost of natural systems. The potential for biomass increases as land is freed up due to productivity improvements in agriculture and forestry, but this land may also be required to meet the growing demand for food and, in particular, animal products. Different scenario assumptions result in differences in calculated potential. Poor or degraded soil that is of little use for food production or biodiversity is also assessed and it is possible that a reasonable yield could be obtained from some energy crops in these soils. However, from a farm economics point of view, the feasibility is questionable and better quality land continues to be more attractive. • The use of waste from businesses and homes and waste products from agriculture and
forestry does not require land. However, there is uncertainty about the availability of these products for energy applications. After all, some of these products can have or be given other uses, such as cattle feed.
• Much of the estimated biomass potential is in countries with a less well-developed organisational structure. The question is whether the required institutional changes can be realised in time to achieve the estimated potential.
• New raw materials may also be found for bio-energy, such as algae. However, this is currently unfeasible from an economic point of view. The learning curve needs to be followed to reduce the costs, but there still remains much uncertainty about the possible result.
The Netherlands may be able to supply about 200 PJ of biomass in 2050 for the energy system, but this will probably not be enough to meet demand. What will a global supply of 150 EJ, or possibly 400 EJ, mean for potential import? If equally shared amongst the world’s population, the Netherlands will have a supply of about 300 to 750 PJ; if shared according to unit national product, it will be more than double this amount. However, we also need to take into account the fact that countries with a lot of biomass will also be a relatively large consumer, and that only dry biomass can be transported over long distances. The future supply for the Netherlands varies in the analyses between 0 and 1000 PJ, and concerns just primary energy. Losses will still take place as a result of conversion into biofuels, green gas, electricity or heat, for example.
26 | Exploration of pathways towards a clean economy by 2050
FOUR FOUR
A future global shortage will result in increasing biomass prices, although efficiency improvements in agriculture could cause a decrease in price. It is therefore unclear what supply will be available, and at what price. Furthermore, biomass-exporting countries also have to meet greenhouse gas emission targets and will have an interest in CO2 sequestration within their own borders.
Emissions also take place in the production chains of all raw materials and clean technologies, often beyond our borders. This is particularly relevant in the case of biomass as greenhouse gas emissions are not only the result of transport and cultivation through the use of artificial fertilizer and agricultural vehicles. If, for example, land is converted directly or indirectly into agricultural land, a lot of extra CO2 is initially released into the atmosphere as natural soils usually contain more carbon than agricultural soils. So much CO2 can be released into the atmosphere that, under certain conditions, it cancels out the total emission reductions obtained by using bio-energy to replace fossil products over several decades. Biomass-related greenhouse gas emissions due to land use and land-use changes outside the Netherlands are not included in figures for the Netherlands, although they are the result of its use in the Netherlands. This is important in the further development of sustainable criteria.
4.3 Carbon capture and storage
Large industrial plants can use CO2 capture to reduce emissions to the atmosphere. There are various storage possibilities, the most important of which are deep-water layers (salt-water aquifers) and empty gas and oil fields. In the Netherlands, this mainly concerns empty gas and oil fields with a total of about 2,200 Mt storage capacity, half of which is below land. One option is the Slochteren gas field, but this will not be empty by 2050 and probably for many more years, and is therefore not yet available for CO2 storage. To keep costs under control, the storage capacity must be available over a certain period, preferably for at least the lifetime of the industrial plants and facilities that make use of it. Assuming a period of 50 years, there is a storage capacity of over 40 Mt a year available, or half of this if the decision is made not to store CO2 below land.
Initial inventories made in Europe show that there is sufficient storage capacity to be able to store the estimated emissions from the large industrial plants in western and central Europe for a much longer period. More than half of this capacity is in a few large aquifers in the Norwegian area of the North Sea, and given the expected emissions for Europe in 2050, it is estimated that only 5% of the capacity of these aquifers will be used. A relatively small amount of CO2 has been stored in one of these aquifers for a number of years already. The location of this aquifer, just 800 kilometres from the Netherlands, is not particularly unfavourable. If this aquifer can be used to its full assumed capacity then storage capacity will no longer be a limiting factor for the Netherlands.
27
Four pillars for a low-emission system |
FOUR FOUR
However, storage capacity is subject to much uncertainty. For example, there is as yet no experience in pumping in CO2 to full capacity deep underground. Gas and oil field storage capacity estimates are still based on knowledge about and the many experiences with the management and exploitation of these fields, whereas the effects of large-scale CO2 storage in aquifers have only been analysed based on simulation models. The
uncertainties regarding the actual storage capacity in aquifers are therefore large. Partly due to the possibilities for storage outside the Netherlands, the available storage capacity in the analyses carried out in this study varies between 0 and 100 Mt a year.
4.4 Electrification and zero-CO
2emission electricity
generation
Various technologies are available to generate electricity with zero CO2 emissions. Wind turbines, solar panels, nuclear power stations, possibly geothermal energy and other technologies are capable, at a cautious estimate, of potentially producing 350 PJ (about 100 TWh) a year in the form of electricity. A more optimistic estimate produces a figure of more than double this amount. Spatial limitations need not hinder zero-CO2 electricity generation, and replacing more and more fuel use in industry, buildings and transport with electricity will lay the foundations for a low-CO2 energy system.
It is however difficult to control the electricity supply using the technologies named, so that their potential cannot be made use of immediately. Wind, for example, has an unpredictable supply profile. The sun is more predictable, but its contribution is limited during the winter months when demand is high. Nuclear energy generates a constant supply, and while the new generations of nuclear power plants are expected to be more flexible, the technology is not suited to matching short-term supply and demand changes. This makes it less suitable for use in conjunction with a high percentage of solar and wind energy. An electricity supply in which wind energy makes a greater contribution than solar energy produces a supply profile that best matches daily and seasonal fluctuations in the load profile. Solar energy, however, does have the advantage that it can be used on a small scale, enabling individuals and companies to each make their own contribution to sustainable energy generation.
Gas provides flexibility in the electricity supply at a limited cost. A certain proportion of gas is therefore usually considered desirable in a system that makes use of difficult to control technologies. The amount used depends on other options, such as storage and the trade in electricity with other countries.
Storage technologies, such as batteries or the use of height differences in old mines, combined with hydropower and smart demand management, such as the charging of electric cars, can be used to further optimise the day-to-day match of supply and demand
28 | Exploration of pathways towards a clean economy by 2050
FOUR FOUR
in the Netherlands. However, this is not a solution for any imbalances over longer periods, in particular at the seasonal level.
Solutions for seasonal matching are currently being looked for at the European level by consolidating and expanding the electricity networks between countries. The current links with neighbouring countries were initially intended as an emergency precaution, but the network has also been recently responsible for further developing the European market. The prospect of much more renewable energy means that interest is growing in a pan-European network with a much greater exchange capacity between the various countries. It may even be possible to link North Africa to the grid. In this way, peaks in both supply and demand could be smoothed out and better matched to one another – completely so if use were also made of the large-scale storage opportunities provided by pumped storage.
The Dutch electricity grid is already connected to the grids of neighbouring countries and the capacity for trade between countries is expected to greatly increase. Agreements have been made regarding further connections between countries in north-west Europe. A fully renewable electricity supply is however unlikely at this scale as both the load and supply patterns (with lots of wind energy generated in the North Sea) differ too little at this scale. As a result, some imbalance between electricity demand and supply will remain that cannot be fully compensated for by pumped storage in Scandinavia. Various studies are currently being carried out at differing scales regarding the further development of such a system, to obtain a better idea of the possibilities and limitations.
The role of clean electricity generation will be greater if there is a simultaneous shift in energy demand from fuels to electricity. This can be achieved using technologies, such as electric vehicles and electrical heat pumps in homes and businesses. Hydrogen, a clean fuel, can also be produced using electricity, making it a useful energy carrier in such a system. From a technical point of view, a major shift towards electricity and/or hydrogen is possible in many sectors. From a practical point of view however, this is so new for many companies that it is possible that it will only be achieved to a limited extent by 2050.
A pan-European electricity grid is an important part of the solution strategy considered here (electrification and zero-CO2 electricity generation), as is therefore the dependence on the cooperation of many countries in achieving it. There is an additional option, as a result of which the Netherlands will be less dependent on European cooperation and in which gas plays a central role. This option receives less attention, but can be regarded as a single solution to three problems: the supply – demand balance of electricity and heat, the destination of captured CO2 and the storage of energy. In this option, any excess electricity is converted into hydrogen. This hydrogen can be used directly or mixed with the gas supply (a maximum concentration of 10% is currently applied). If the potential market is too small, the hydrogen can be converted into methane (e-gas) or methanol through a chemical reaction with the captured CO2. The production of hydrogen is the
29
Four pillars for a low-emission system |
FOUR FOUR
most critical step here as the fluctuating supply pattern for electricity is transferred to the electrolysis process, which can be relatively expensive.
4.5 Reduction in emissions of other greenhouse gases
The energy system does not include all the greenhouse gas emissions as there are other relevant emissions, in particular of non-CO2 greenhouse gases. Emissions of methane (CH4) from livestock farming and nitrous oxide (N2O) as a result of the use of fertilizers in agriculture are some of the most significant. Technological opportunities for reducing these emissions are rather limited, although improvements in milk production, cattle feed and the use of fertilizers and the fermentation of animal manure could help reduce emissions from around 16 Mt (projection for 2020) to 11 Mt CO2 equivalent. Given the desired 80% reduction in emissions to 45 Mt, these sources account for roughly a quarter of the emissions in 2050.
To achieve significant emission reductions, fundamental changes in the production structure are required. From a global point of view, a shift in production is pointless, rather a reduction and change in the consumption of animal products is required. A significant reduction in non-CO2 greenhouse gas emissions from industry and the waste disposal process is possible, to an emission level of a maximum of 2 Mt CO2 eq. Major industrial N2O sources, such as nitric acid and caprolactam production are expected to be practically eliminated by 2050. Fluorine compounds used, for example, for cooling and etching are powerful greenhouse gases and can be replaced with less harmful substances. Methane emissions from dump sites will steadily decline to be almost negligible, and those from waste water treatments plants will be significantly reduced.
30 | Exploration of pathways towards a clean economy by 2050
Fiv
E
Robust elements
for the Netherlands
in 2050
The previous chapter included a discussion of the possibilities relating to the important pillars for a clean economy. The next step is to investigate how these pillars can be combined to form a complete energy system that meets the emission reduction objective. To do this, analyses have been carried out using the E-Design model developed by PBL and ECN. This model covers the whole of the Dutch energy system, including electricity trade with foreign countries, and can be used to help design an energy system for the Netherlands in 2050.
5.1 Analysis criteria
The aim of the analyses is to define the importance of the four groups of technological options. This is done by using different scenarios for their potential use. For a reduction in energy demand, these scenarios are based on the analyses carried out in Section 4.1, in which the energy demand in the 2050 reference scenario is taken as a maximum and additional scenarios with a 10%, 20% and 30% lower demand are analysed.
For the biomass supply, CO2 storage capacity and potential zero-CO2 electricity
generation, various scenarios are ranked within four categories, from limited to very high availability (see Table 1). Here too, the ranges resulting from the analyses in Chapter 4 are applied. Scenarios are also analysed in which a particular group of technologies or a specific technology is omitted.
Extensive electrification is also a system innovation that will take a lot of time. Even in the case of maximum electrification, the assumption is made that at least 20% of all
31
Robust elements for the Netherlands in 2050 |
Fiv
E
Fiv
E
road traffic in 2050 will still have an internal combustion engine (based on the energy required), that at least 20% of the heating for buildings will be produced from gas and that at least 35% of the combustion processes in industry currently based on natural gas will still use gas. The sensitivity of these assumptions is further assessed the Full Results section of this report (only available in Dutch).
As a sensitivity analysis, both optimistic and pessimistic estimates of technology developments are made for all the scenarios (if the feasibility of the objective is not the same for both, then it is represented by a ‘?’ in Figures 4, 5, 7 and 8).
5.2 Achieving the objective: the dependence on resource
availability and technologies
if all the pillars are only available to a limited extent, then it would not seem to be possible to achieve the objective of an 80% reduction in emissions (see Figure 4). in the case of moderate availability the objective is technically feasible, although still uncertain in the scenarios in which there is a higher energy demand. in the case of the high availability of the pillars, the objective would seem to be technically feasible in all the demand scenarios.
The next step is to investigate the necessity or robustness of the four pillars. Each pillar can produce a 30% to 40% reduction in emissions (based, for biomass, on a very high availability of 1,000 PJ). This is quite a lot, but not enough, and so pillars need to be combined. To produce these combinations, we ask the question for each pillar whether it is possible to do without it. is it possible to achieve an emission level of 45 Mt in 2050 if one of the technology groups is not used? We only show the high or very high availability of the other pillars in Figures 5, 7 and 8, as it is not possible to achieve the objective in the case of moderate availability.
Table 1
Annual resource availability and technology scenarios
Limited Moderate High Very high
Biomass (PJ) 250 500 750 1.000
CO2 storage capacity (Mt) 25 50 75 100
Wind, solar, nuclear energy (TWh)* 120 190 260 320
32 | Exploration of pathways towards a clean economy by 2050
Fiv
E
5.2.1 Dependence on energy demand
An 80% reduction in emissions is feasible given an energy demand equivalent to that in the 2050 reference scenario. it is even feasible given an energy demand 10% higher than that in the reference scenario, although this requires the high availability of resources and a high capacity for clean energy generation. However, a reduction in energy demand significantly reduces the dependence (also refer to Figures 5 to 8).
5.2.2 Dependence on biomass
The analyses show that, given the assumptions made, it will not be possible to achieve an emission level of 45 Mt in the Netherlands if biomass is not used, even if very high use is made of the other technology groups (see Figure 5). Residual emissions in agriculture, emissions from transport (in particular aviation, shipping and haulage), and residual emissions from industry, even when as much CO2 capture is applied as possible, mean that, together with other smaller sources, the target is still not met. Without biomass, even a reduction in emissions of 70% seems barely feasible.
The question, therefore, is what is the minimum required amount of biomass? This depends very much on the energy demand and the availability of the other technologies (Figure 6). if all the other pillars were used to maximum capacity, 200 PJ would be sufficient. This is roughly double the amount of biomass currently used, and is equivalent to the potential supply within the Netherlands. However, the Netherlands will probably need to depend on biomass import to achieve the target. if the Netherlands only use the other pillars to a limited extent, it is highly possible that the supply of biomass will be insufficient, particularly if the energy demand remains relatively high.
Figure 4
Feasibility of 80% reduction in greenhouse gas emissions, by 2050
Ample Moderate
-30% -20% Energy demand compared
to the reference image -10% -0%
Feasible Feasibility uncertain Unfeasible Limited Supply stocks and imple-mentation space
33
Robust elements for the Netherlands in 2050 |
Fiv
E
Fiv
E
Figure 5
Feasibility of 80% reduction in greenhouse gas emissions, without application of biomass, by 2050
More than ample Ample
-30% -20% Energy demand compared
to the reference image -10% -0%
Feasible Feasibility uncertain Unfeasible Under widespread implementation of electrification Supply stocks and imple-mentation space
Feasibility of an 80% reduction in emissions without the use of biomass
Figure 6
-30% -20% -10% 0%
Energy demand, compared to reference image 0 400 800 1200 1600 PJ
Supply of other stocks and space (excluding biomass)
Ample supply, under widespread implementation of electrification
Ample supply, under limited implementation of electrification Moderate supply, under widespread implementation of electrification
Biomass demand, 2050
Minimum biomass utilisation to achieve an 80% reduction in emissions, assuming various levels of other resources (CO2 storage capacity, zero-CO2 electricity).
34 | Exploration of pathways towards a clean economy by 2050
Fiv
E
5.2.3 Dependence on carbon capture and storage
Without the use of carbon capture and storage, it will also be almost impossible to achieve the target (Figure 7). This would be easier if the final emission reduction in the Netherlands could be limited to 70% rather than 80%, but even then the high availability of other resources will be required, as well as extensive electrification.
There may be just enough storage capacity below sea in the Netherlands for the CO2 captured from industrial sources, but additional capacity is required for the capture of CO2 from power plants and/or new biomass processing plants.
5.2.4 Dependence on zero-CO2 electricity generation
An 80% reduction in emissions is possible without the utilisation of zero-CO2 electricity generated using wind turbines, solar panels and nuclear power plants (or other technologies). However, it is only possible if extra energy-saving measures are implemented with regard to the reference scenario, and if there is a very high availability of sustainable biomass and a very high CO2 storage capacity in foreign aquifers (Figure 8). it is the combination of biomass and CO2 storage that makes this possible, as this results in the net extraction of CO2 from the atmosphere over the whole of the production chain. This achieves negative emissions, which compensate for residual emissions elsewhere in the system.
Figure 7
Feasibility of 80% reduction in greenhouse gas emissions, without application of carbon capture and storage, by 2050
More than ample Ample
-30% -20% Energy demand compared
to the reference image -10% -0%
Feasible Feasibility uncertain Unfeasible Under widespread implementation of electrification Supply stocks and imple-mentation space
35
Robust elements for the Netherlands in 2050 |
Fiv
E
Fiv
E
5.2.5 Conclusion
Omitting one of the technology groups from the future scenario makes it very difficult, if not impossible, to achieve an 80% reduction in emissions by 2050. it would mean making extensive use of the options within the other technology groups, and there is a high risk that this will not be possible to achieve in practise. For example, the supply of sustainable biomass may be lower than expected, and there will be a high level of dependence on CO2 storage in a few large aquifers outside the Netherlands, with which there is little practical experience. The same applies to the dependence on a pan-European electricity grid, the success of which is certainly not guaranteed. Should a drastic reduction in the energy demand be required, it is unclear, partly due to the uncertainty concerning economic growth, whether this can be achieved using affordable technological measures alone. The best solution, therefore, would be to aim for a mix of these technology groups. The developments being made in sustainable biomass, CO2 capture, energy savings and zero-CO2 electricity generation would therefore seem to be robust. However, there are many different options within these pillars as far as specific technologies and applications are concerned, and these are addressed in the next section.
5.3 The importance of specific technologies for 2050
in analysing the importance of specific technologies, a similar approach is taken to that of the analysis of the four pillars described above. For many of the scenarios, a calculation
Figure 8
Feasibility of 80% reduction in greenhouse gas emissions, without wind, solar or nuclear energy, by 2050
More than ample Ample
-30% -20% Energy demand compared
to the reference image -10% -0%
Feasible Feasibility uncertain Unfeasible Under widespread implementation of electrification Supply stocks and imple-mentation space
36 | Exploration of pathways towards a clean economy by 2050
Fiv
E
is made of whether the target can also be achieved without making use of a particular technology, or combination of two technologies. The number of scenarios for which this is not possible without the technology in question is taken as a measure of its relative importance.
it can be assumed that the range of technological options is so wide that none of the specific technologies is considered absolutely essential. Nevertheless, there are differences in the importance of their contributions. This means that, in practise, not using a particular technology places a greater emphasis on the alternatives, with the associated risks described (in Section 5.2.5). The relative importance of each of the various technologies is briefly described in Table 2.
Table 2
A comparison of the importance of the availability of technologies for a clean economy by 2050
Technology Relative import-ance
Explanation
Wind on land Limited The technology fits in closely with the future vision but the potential for the Netherlands is thought to be limited, therefore not using this option can be compensated for by other technologies.
Wind at sea Large The technology fits in closely with the future vision and has a large potential. Not using this option will require the greater import of clean energy or a larger proportion of nuclear energy.
Solar-Pv Limited The limited use of this technology fits in well with the future vision. However, it has its limitations (more so than wind) regarding the matching of supply and demand.
Nuclear energy Large The technology fits in closely with the future vision and has a large potential. Not using this option can be compensated for by wind and solar energy (supplementary solutions for matching supply and demand will then also be required)
Gas-fired power plant with CCS
Limited This will become much more important if no pan-European electricity grid is built with a large exchange capacity. Gas power plants are important in providing a flexible supply.
Coal-fired power plant with indirect co-firing of biomass and CCS very limited
Although a form of electricity generation with low, sometimes even negative, emissions, there are also clean alternatives, and many variants at the system level in which better use can be made of biomass and CO2 capacity for the production of fuels or green gas.
Heat from geothermal energy
Limited The technology fits in closely with the future vision but the potential for the Netherlands is limited, therefore not using this option can be compensated for by other technologies.
37
Robust elements for the Netherlands in 2050 |
Fiv
E
Fiv
E
5.4 Emission reductions in the various sectors
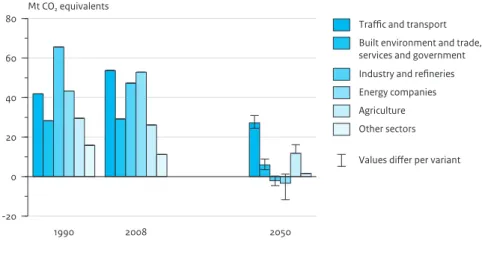
A reduction in emissions of 80% in the Netherlands does not automatically imply the same reduction for all sectors. The resulting distribution of emissions will be completely different from in the current situation. The results of various future visions, calculated using E-Design and all of which result in an 80% reduction in emissions, have been compiled (Figure 9). The distribution gives a good indication, however it is not conclusive and there are also scenarios in which sectors have residual emissions outside the ranges indicated.
A few comments need to be made regarding these sectoral emission changes. First of all, a completely new system also involves many new processes. Examples that have a large influence on emissions are the processes involved in producing green gas or biofuels from biomass and the production of hydrogen, especially if this includes CO2 capture and
Table 2 follow up Technology Relative
import-ance
Explanation
Solar heating Limited The technology fits in closely with the future vision but the potential for the Netherlands is extremely limited as supply is mainly available in the summer and additional technology is required in the winter. Electrical heat
pumps
Large This technology plays an important role in the electrification of industry, horticulture and buildings, helping increase the proportion of clean electricity used.
Micro CHP with hydrogen
Limited Hydrogen can be produced using electricity, but the energy losses are high if this hydrogen is then used to generate electricity. it would only be useful if hydrogen was used as a storage medium (a less obvious choice) or if it would be produced from biomass.
Micro CHP with methane
very limited
Decentralised electricity generation that makes use of natural gas does not result in emission reductions if the centralised electricity generation system produces no, or very little, emissions. Local application with biogas may be a useful supplement.. Biomass
gasification for fuels (+CCS)
very large The production of biofuels (green gas, transport biofuels) is crucial for sources for which there are few clean alternatives. it also has the advantage that biomass gasification with the capture of CO2 released
during the process has negative emissions.
Electric cars Large This type of vehicle may make an important contribution to electrification and therefore to the role of clean electricity, partly due to the flexibility provided by charging.
Hydrogen cars Large These vehicles could provide an alternative to electric vehicles but may be more useful as an additional option for road traffic over long distances such as road haulage.
CCS for industrial emissions
Large For many processes there are no alternatives, or the alternatives are shrouded in uncertainty.
38 | Exploration of pathways towards a clean economy by 2050
Fiv
E
therefore results in negative emissions. The allocation of these processes is important in the distribution of emissions according to sector. in Figure 9, green gas and hydrogen production are allocated to the energy sector and liquid biofuel production to industry and refineries. Secondly, emissions from the combustion of green gas and biofuel are assumed to be zero, and the emissions released during the production of biomass therefore not included. Nevertheless, the traffic and transport sector still produces considerable emissions. This is because the assumption is made that electricity and hydrogen will not yet play a significant role in aviation and shipping in 2050.
5.5 Direct costs and economic effects
There are various technological scenarios for a low-CO2 Netherlands, for which more and less robust elements can be distinguished. Assessing the affordability of such a future system is however more difficult as the year 2050 is too far away to be certain of the costs of new technologies and the required infrastructure. Having completed the learning pathway, these costs are expected to be lower than at present, in some cases significantly lower, as a result of fundamental changes to the technology and greater experience and economies of scale. Both pessimistic and optimistic estimates of future costs and returns from technologies have been used in the analyses. Estimates of the prices of raw materials in 2050, including fossil fuels and biomass, are even more difficult to make. Reference is made to the iEA Energy Technology Perspectives 2010 for the costs of various technologies and future fuel prices. These prices depend on the chosen scenario (less use of fossil fuels results in lower prices). There are therefore many uncertainties, but it is nevertheless possible to name some of the effects.
Figure 9 1990 2008 2050 -20 0 20 40 60
80 Mt CO2 equivalents Traffic and transport
Built environment and trade, services and government Industry and refineries Energy companies Agriculture Other sectors Values differ per variant
39
Robust elements for the Netherlands in 2050 |
Fiv
E
Fiv
E
An economy based on a clean energy system probably involves higher costs than one based on current technologies (Figure 10). The extra costs in 2050 are estimated to be in the order of 10 billion euros, although this includes a large margin of error. if the learning curves for new technologies produce favourable results these extra costs may turn out to be lower than anticipated, and the future system may also turn out to be a little cheaper. However, there will certainly be a shift towards lower prices for and less dependence on raw materials, and to higher capital costs. This shift will be most marked if renewable energy and energy-savings measures play an important role. Using carbon capture and storage will always result in extra direct costs as this is an additional technology that requires extra energy.
This study is limited to the direct costs of a clean energy system. A global approach to climate change will reduce the negative external effects of climate change on the environment and the economy; however these benefits are not priced in this study.
Figure 10
-30% -20% -10% 0%
Energy demand compared to reference image -10 0 10 20 30 billion euros
Most likely value Uncertainty Total
80% in additional costs of greenhouse gas emission reduction, compared to reference image , under current supply technology, by 2050
-30% -20% -10% 0% Energy demand compared to reference image -10 0 10 20 30 billion euros Supply technology Efficiency technology Energy sources Per cost component
Change in the total annual societal costs (in billion euros2010) of a low-CO2 system compared with a future system in
which use is made of the same technology as in the current situation. The margin of error in the total costs reflects the difference between an optimistic and pessimistic evaluation of the cost development of clean technologies.
40 | Exploration of pathways towards a clean economy by 2050
Fiv
E
in analysing the economic effects, we are of course not only interested in the costs in 2050, but rather in the costs in the years leading up to this. These costs can present serious barriers. The required transition also offers opportunities for many companies, in particular with regards to international development. The barriers are largely related to learning curves for new technologies that are still relatively expensive. Learning costs for new, clean technologies are global costs, in particular where they concern the development of the technology itself and the required production technology. The Netherlands can choose focal areas in which it contributes to these learning processes and purchase the results at a later date of similar learning processes in other areas. However, it is necessary to gain experience in maintaining the new technologies and implementing them within the system, and these learning processes must also be followed in the Netherlands.
41
Robust elements for the Netherlands in 2050 |
Fiv
E
Fiv
42 | Exploration of pathways towards a clean economy by 2050
SIX
Important steps
in learning and
implementation
pathways
For new technologies, there is no clear-cut distinction between ‘robust’ and ‘non-robust’. The implementation pathway becomes a stronger element of the roadmap as the involved technology becomes more important for a clean economy by 2050. Questions would still need to be answered about the less robust technologies before decisions can be taken about large-scale implementation. The pathway that is chosen would then have a strong learning element.
A technology is more than an industrial unit or piece of equipment. A technology or technological concept also requires an accompanying system with its production chains, infrastructure and new organisational forms. These are new component systems that may form part of the future vision. The roadmap could, or should, include the most important steps to be taken to achieve implementation at the level of such component systems. An idea is given below of possible steps for some component systems, with an emphasis on those to be taken in the coming ten years.
6.1 First steps
Some examples are given below of possible actions to be taken between now and 2020, to illustrate how specific a roadmap for the coming years could be. Some steps focus on the implementation of robust options, others on improving knowledge about possible options.