Committed to
health and sustainability
Informative
Inventory
Report 2019
Emissions of transboundary
air pollutants in the
Netherlands 1990–2017
This is a publication of:National Institute for Public Health and the Environment
P.O. Box 1 | 3720 BA Bilthoven The Netherlands
www.rivm.nl/en june 2019
Informative Inventory
Report 2019
Emissions of transboundary air pollutants in the Netherlands 1990–2017
Colophon
© RIVM 2019Parts of this publication may be reproduced, provided acknowledgement is given to: National Institute for Public Health and the Environment, along with the title and year of publication.
DOI 10.21945/RIVM-2019-0016
D. Wever (author), RIVM
P.W.H.G. Coenen (author), TNO R. Dröge (author), TNO
G.P. Geilenkirchen (author), PBL M. ’t Hoen (author), PBL
E. Honig (author), RIVM W.W.R. Koch (author), TNO A.J. Leekstra (author), RIVM L.A. Lagerwerf (author), RIVM R.A.B. te Molder (author), RIVM C.J. Peek (author), RIVM
W.L.M. Smeets (author), PBL S.M. van der Sluis (author), PBL J. Vonk (author), RIVM
Contact: Dirk Wever RIVM – MIL/DMO Dirk.wever@rivm.nl
This investigation has been performed by order and for the account of the Ministry of Infrastructure and Water Management, within the framework of Air and Noise (LG).
This is a publication of:
National Institute for Public Health and the Environment
P.O. Box 1 | 3720 BA Bilthoven The Netherlands
Acknowledgements
Many colleagues from a number of organisations – Statistics Netherlands (CBS), Wageningen Environmental Research (WUR), Netherlands
Enterprise Agency (RVO.nl), Netherlands Environmental Assessment Agency (PBL), RIVM and TNO – have been involved in the annual update of the Netherlands Pollutant Release & Transfer Register (NL-PRTR), also called the Emission Registration (ER) system, which contains emissions data on about 350 pollutants. The emissions calculations, including those for greenhouse gas (GHG) emissions, are performed by members of the ER Task Forces. This is a major task, since the Netherlands’ inventory contains details of many emissions sources.
The emissions and activity data of the Netherlands’ inventory were converted into the NFR source categories contained in the Nomenclature for Reporting (NRF) tables, which form a supplement to this report. In addition to the authors, several people contributed to this report. Rianne Dröge and Jolien Huijstee worked on completing the Approach 2 uncertainty data and performed the Approach2 uncertainty analyses. Bart Jansen, Bas van Huet, Olaf Janmaat and Kees Baas provided information regarding the emission sources in Chapter 7 (Waste). We are particularly grateful to Bert Leekstra, Kees Peek, Jacqueline Wanders and Dirk Wever for their contributions to data processing, chart production and data quality control.
We greatly appreciate the contributions of each of these groups and individuals to this Informative Inventory Report and supplemental NRF tables, as well as those of the external reviewers who provided
Synopsis
Informative Inventory Report 2019
Emissions of transboundary air pollutants in the Netherlands 1990–2017 Increase in ammonia emissions; entire time series adjusted upwards
At 132.4 Gg in 2017, ammonia emissions increased by 3.9 Gg compared with 2016 and are 4.4 Gg above the maximum set by the European Union and the UNECE under the Gothenburg Protocol (both 128 Gg). The increase in ammonia emissions in 2017 compared with 2016 is mainly due to the increased N excretion per dairy cow caused by a higher manure production (higher milk production and higher average weight) per animal and higher nitrogen content in the grass fed. The increase was also partly due to the addition of emission sources Residential combustion in woodstoves and fireplaces, Bonfires,
Accidental building fires and Manure treatment. The entire time series for ammonia was adjusted upwards to allow for the added emission sources.
Increase in non-methane volatile organic compounds; the entire time series adjusted significantly upwards
Mainly as a result of the addition of new emission sources, emissions of non-methane volatile organic compounds increased to 254 Gg in 2017 – 69 Gg above the maximum set by the European Union (185 Gg) and 63 Gg above the UNECE maximum under the Gothenburg Protocol (191 Gg).
The entire time series for non-methane volatile organic compounds was significantly adjusted upwards to allow for the new sources. Under the source sector 3B Manure management, the emissions coming from the use of silage was added. Furthermore, under the source sector 3D Emissions from soils, the new emission sources Animal manure applied to soils, Farm-level agricultural operations including storage, handling and transport of agricultural products and Cultivated crops were added. Additionally, the emission factor from the use of cleaning products by consumers is significantly higher.
Applying for adjustments
The emissions ceilings of both the European Union and the UNECE were set on the basis of knowledge at the time. To promote the
implementation of new scientific knowledge in the inventories of individual member states, a mechanism is adopted whereby emissions can be adjusted for compliance. For instance, where a member state exceeds the emission ceiling as result of the implementation of new emission sources, it can apply for an adjustment of the emissions used for checking compliance.
For both ammonia and non-methane volatile organic compounds the Netherlands requests adjustments of the emissions for compliance with the ceilings set by the European Union and the UNECE under the
The Informative Inventory Report 2019 was drawn up by the RIVM and partner institutes, which collaborate to analyse and report emission data each year – an obligatory procedure for Member States. The analyses are used to support Dutch policy.
Publiekssamenvatting
Informative Inventory Report 2019
De uitstoot van ammoniak is in 2017 gestegen ten opzichte van 2016 en ligt met 132,4 kiloton boven het maximum van 128 kiloton dat vanuit Europa voor Nederland is bepaald. De toename wordt veroorzaakt doordat nieuwe bronnen die ammoniak uitstoten zijn toegevoegd aan de emissie-inventarisatie: sfeerverwarming (open haarden en allesbranders), vreugdevuren, woningbranden en mestverwerking. Ook komt het door ontwikkelingen in de landbouw, zoals een hogere mestproductie per melkkoe en een hoger gehalte aan stikstof in het gevoerde gras. De emissie van vluchtige organische stoffen is in 2017 gestegen tot 254 kiloton en ligt daarmee boven het maximum van 185 kiloton dat vanuit Europa voor Nederland is bepaald. Ook hier komt dat vooral doordat nieuwe bronnen zijn toegevoegd, met als belangrijkste het gebruik van kuilvoer. Daarnaast blijkt door nieuwe inzichten dat consumenten er meer van uitstoten via het gebruik van
schoonmaakmiddelen.
De door Europa vastgestelde maxima zijn gebaseerd op de situatie in 2000. Bronnen die daarna zijn toegevoegd, hoeven voor de toetsing aan de vastgestelde maxima niet mee te tellen. Nederland heeft daartoe een verzoek opgenomen in dit rapport. Voor ammoniak zijn dat de bronnen afrijping van gewassen, gewasresten in de bodem en mestverwerking. Voor vluchtige organische stoffen zijn dat de uitstoot uit
landbouwbodems en het gebruik van kuilvoer.
Dit blijkt uit het Informative Inventory Report (IIR) 2019. Het RIVM analyseert en rapporteert hierin jaarlijks met diverse partnerinstituten de uitstoot van stoffen. Lidstaten van de Europese Unie zijn hiertoe verplicht. Nederland gebruikt de analyses om beleid te onderbouwen. Kernwoorden: emissies, grootschalige luchtverontreiniging,
Contents
1 Introduction — 11
1.1 National inventory background — 11
1.2 Institutional arrangements for inventory preparation — 12
1.3 The process of inventory preparation — 12
1.4 Methods and data sources — 15
1.5 Key source analysis — 16
1.6 Reporting, QA/QC and archiving — 16
1.7 Explanation of the use of notation keys — 22
1.8 Explanation of ‘Other’ emission sources — 23
2 Trends in Emissions — 27
2.1 Trends in national emissions — 27
2.2 Trends in nitrogen oxides (NOx) — 28
2.3 Trends in sulphur dioxide (SOx) — 29
2.4 Trends in ammonia (NH3) — 29
2.5 Trends in non-methane volatile organic compounds (NMVOC) — 30
2.6 Trends in PM2.5 — 31
2.7 Trends in PM10 — 31
2.8 Trends in Pb — 32
3 Energy — 35
3.1 Overview of the sector — 35
3.2 Public electricity and heat production (1A1a) — 36
3.3 Industrial combustion (1A1b, 1A1c and 1A2) — 40
3.4 Other stationary combustion (1A4ai, 1A4bi, 1A4ci and 1A5a) — 45
3.5 Fugitive emissions (1B) — 48
4 Transport — 51
4.1 Overview of the sector — 51
4.2 Civil aviation — 54
4.3 Road transport — 57
4.4 Waterborne navigation and recreational craft — 77
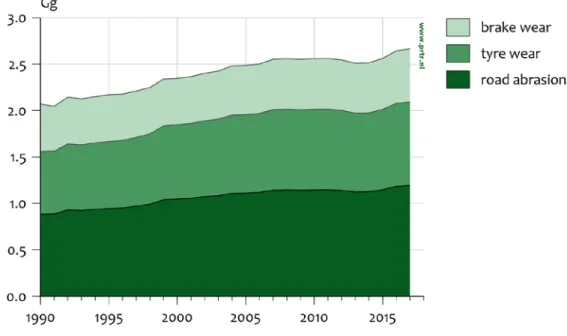
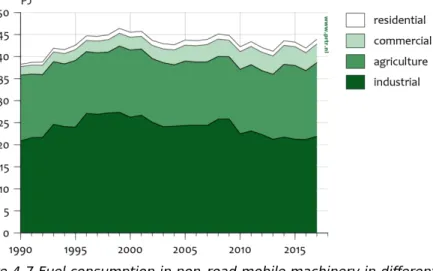
4.5 Non-road mobile machinery (NRMM) — 83
4.6 National fishing — 89
5 Industrial Processes and Product Use — 93
5.1 Overview of the sector — 93
5.2 Mineral products (2A) — 98
5.3 Chemical industry (2B) — 99
5.4 Metal production (2C) — 101
5.5 Solvents and product use (2D) — 105
5.6 Other production industry (2H) — 110
6 Agriculture — 113
6.1 Overview of the sector — 113
6.2 Manure management 115
6.3 Crop production and agricultural soils — 124
7 Waste (NFR 5) — 131
7.2 Solid waste disposal on land (5A) — 133
7.3 Composting and anaerobic digestion (5B) — 136
7.4 Waste incineration (5C) — 140
7.5 Open burning of waste (5C2) — 143
7.6 Waste-water handling (5D) — 146
7.7 Other waste (5E) — 146
8 Other — 151
8.1 Overview of the sector — 151
8.2 Other sources (6A) — 151
9 Response to the Reviews — 155
9.1 Combined CLRTAP and NEC review 2015 — 155
9.2 NEC review 2018 — 155
10 Recalculations and Other Changes — 157
10.1 Recalculations of certain elements of the IIR2019 — 157
10.2 Improvements — 157
10.3 Effects of recalculations and improvements — 157
11 Projections — 163
12 Adjustments — 165
12.1 Exceedances — 165
12.2 (Application for) Adjustments — 167
13 Spatial Distributions — 175
13.1 Background for reporting — 175
13.2 Methodology for disaggregation of emission data — 175
13.3 Maps with geographically distributed emission data — 176
14 References — 181
Appendix 1 The use of notation keys IE and NE — 187 Appendix 2 Key category analysis results — 193 Appendix 3 Status of review recommendations implementation — 213
1
Introduction
The United Nations Economic Commission for Europe’s 1979 Geneva Convention on Long-Range Transboundary Air Pollution (CLRTAP) was accepted by the Netherlands in 1982. The European Community subsequently adopted the Revised National Emission Ceiling Directive (NECD) in 2016 to set national emission-reduction commitments for EU Member States.
Parties to the CLRTAP and European Member States are obligated to report their emission data annually. Under the CLRTAP, these data are reported to the Convention’s Executive Body in accordance with the implementation of the Protocols to the Convention (accepted by the Netherlands), and for the NECD they are reported to the European Commission. For both the CLRTAP and the NECD, reports must be prepared using the Guidelines for Reporting Emissions and Projections Data under the Convention on Long-range Transboundary Air Pollution 2014 (UNECE, 2014).
The Informative Inventory Report 2019 (IIR 2019) comprises the national emissions reporting obligation for both the CLRTAP and the
NECD with respect to the pollutants SOx, NOX, NMVOC, NH3, PM2.5, other
particulate matter (PM10, TSP and Black Carbon (BC)), CO, priority heavy metals (Hg, Pb and Cd), heavy metals (As, Cr, Cu, Ni, Se and Zn) and several persistent organic pollutants (POP).
The Netherlands’ IIR 2019 is based on data from the national Pollutant Release and Transfer Register (PRTR). The IIR contains information on the Netherlands’ emission inventories for the years 1990 to 2017, including descriptions of methods, data sources and QA/QC activities carried out and a trend analysis. The inventory covers all anthropogenic emissions covered by the Nomenclature for Reporting (NFR), including individual polycyclic aromatic hydrocarbons (PAHs), which are to be reported under persistent organic pollutants (POP) in Annex IV.
1.1 National inventory background
Emission estimates in the Netherlands are registered in the PRTR, which is the national database for the sectoral monitoring of emissions to air, water and soil of pollutants and greenhouse gases. The database was set up to support national environmental policy, as well as to meet the requirements of the National Emission Ceilings (EU), the CLRTAP, the United Nations Framework Convention on Climate Change (UNFCCC) and the Kyoto Protocol (National System). This policy covers the
constant updating of the PRTR, the process of data collection, processing and registration, and the reporting of emission data for some 350
compounds. Emission data (for the most significant pollutants) and
documentation can be found at www.prtr.nl.
Instead of using the defaults from the EMEP/EEA air pollutant emission inventory guidebook 2016 (EMEP/EEA, 2016), the Netherlands often applies country-specific methods, with associated activity data and
emission factors. The emission estimates are based on the official statistics of the Netherlands (e.g. on energy, industry and agriculture) and on environmental reports issued by companies in the industrial sectors. Both nationally developed and internationally recommended emission factors have been used.
1.2 Institutional arrangements for inventory preparation
The Dutch Ministry of Infrastructure and Water Management (IenW) bears overall responsibility for the emission inventory and submissions made to CLRTAP and NECD. A Pollutant Release and Transfer Register (PRTR) system has been in operation in the Netherlands since 1974. Since 2010, the Ministry of Infrastructure and Water Management (IenW) has outsourced the full coordination of the PRTR to the Emission Registration team (ER team) at the National Institute for Public Health and the Environment (RIVM).
The main objective of the PRTR is to produce annually a set of unequivocal emission data that is up to date, complete, transparent, comparable, consistent and accurate. This forms the basis of all the Netherlands’ international emission reporting obligations and is used for national policy purposes.
Emission data are produced in annual (project) cycles. In addition to the RIVM, various external agencies/institutes contribute to the PRTR by performing calculations or submitting activity data:
• Netherlands Environmental Assessment Agency (PBL);
• Statistics Netherlands (CBS);
• Netherlands Organisation for Applied Scientific Research (TNO);
• Rijkswaterstaat (RWS):
o Centre for Water Management (RWS-WD);
o Centre for Transport and Navigation (RWS-DVS);
o Water, Traffic and Environment (RWS-WVL);
o Human Environment and Transport Inspectorate (RWS-ILT).
• Deltares;
• Wageningen Environmental Research;
• Wageningen UR Livestock Research;
• Wageningen Economic Research;
• Fugro, which coordinates annual environmental reporting (AER)
by companies.
Each of the contributing institutes has its own responsibility and role in the data collection, emission calculations and quality control. These are laid down in general agreements with the RIVM and in the annual project plan (RIVM, 2018).
1.3 The process of inventory preparation
1.3.1 Data collection
Task forces are set up to collect and process the data (according to pre-determined methods) for the PRTR. The task forces consist of sector experts from the participating institutes. Methods are compiled on the basis of the best available scientific knowledge. Changes in scientific knowledge lead to changes in methods and to the recalculation of
historical emissions. The following task forces are recognized (see Figure 1.1):
• ENINA: Task Force on Energy, Industry and Waste Management;
• MEWAT: Task Force on Water;
• TgL: Task Force on Agriculture and Land Use;
• V&V: Task Force on Traffic and Transportation;
• WESP: Task Force on Service Sector and Product Use.
Every year, after the emission data have been collected, several quality control checks are performed by the task forces during a yearly ‘trend analysis’ workshop. After being approved by participating institutes,
emission data are released for publication (www.prtr.nl). Subsequently,
these data are disaggregated to regional emission data for national use (e.g. 1 x 1 km grid, municipality scale, provincial scale and water authority scale).
Point-source emissions
As of 1 January 2010, the legal obligated companies can only submit their emissions electronically as a part of an Annual Environmental Report (AER). All these companies have emission monitoring and registration systems with specifications that correspond to those of the competent authority. The licensing authorities (e.g. provinces, central government) validate and verify the reported emissions. Information from the AERs is stored in a separate database at the RIVM and remains the property of the companies involved.
Data on point-source emissions in the AER database are checked for consistency by the ENINA task force. The result is a selection of
validated data on point-source emissions and activities (ER-I), which are then stored in the PRTR database (Peek et al., 2019).
As a result of the Dutch implementation of the EU Directive on the European Pollutant Release and Transfer Register (E-PRTR), since 2011 about 1,000 facilities have been legally obligated to submit data on their emissions of air pollutants when they exceed a certain threshold. To compensate for emissions from facilities in a particular subsector that do not exceed the threshold (small and medium-sized enterprises - SMEs), a supplementary estimate is added to the emissions inventory. For these supplementary estimates known emission factors from research (for
instance for NOx from Van Soest-Vercammen et al., 2002) and implied
factors from the reported emissions and production are used, as well as statistical information such as production indexes and sold fuels. The methods for these supplementary estimates are explained in detail in chapters 3 and 5.
To safeguard that the supplementary estimates do not add to the uncertainty of the subsectors total emission, the Dutch implementation of the E-PRTR directive (VROM, 2008) has set lower thresholds for major pollutants, so that a minimum of approximately 80% of the total
subsector emissions is covered by facility emission reports.
1.3.2 Data storage
In cooperation with the contributing research institutes, all emission data are collected and stored in the PRTR database managed by the RIVM.
Figure 1.1 The organisational structure of the Netherlands Pollutant Release and Transfer Register (PRTR)
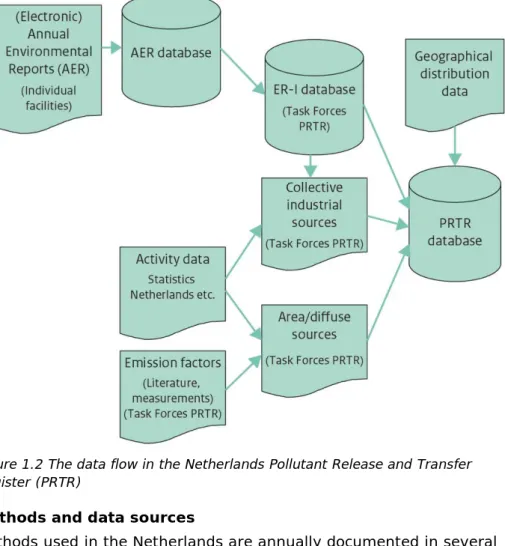
Emission data from the ER-I database and from collectively estimated industrial and non-industrial sources are stored in the PRTR database (see Figure 1.2). The PRTR database, consisting of a large number of geographically distributed emission sources (about 700), contains complete annual records of emissions in the Netherlands. Each emission source includes information on the NACE-code (Nomenclature statistique
des Activités économiques dans la Communauté Européenne) and
industrial subsector, separate information on process and combustion emissions, and the relevant environmental compartment and location. These emission sources can be selectively aggregated per NFR category.
Figure 1.2 The data flow in the Netherlands Pollutant Release and Transfer Register (PRTR)
1.4 Methods and data sources
Methods used in the Netherlands are annually documented in several
reports and protocols, and in meta-data files available from www.prtr.nl.
All methodology reports are in English. However, some background reports are only available in Dutch.
In general, two data models are used in the Netherlands:
• A model for emissions from large point sources (e.g. large
industrial and power plants), which are registered separately and supplemented by emission estimates for the remainder of the companies within a subsector (based mainly on IEFs from the individually registered companies). This is the so-called bottom-up method;
• Several sector-related models for emissions from ‘diffuse sources’
(e.g. road transport, agriculture), which are calculated from activity data and emission factors from sectoral emission inventory studies in the Netherlands (e.g. SPIN documents produced by the ‘Cooperation project on industrial emissions’). In addition, these assumptions are important to consider:
• Condensable emissions are only included in transport emissions,
not in emissions from domestic wood burning or industrial emissions.
• Road transport emissions have been calculated using ‘on-road’ measured emission factors, so emission data are insensitive to ‘the diesel scandal’.
1.5 Key source analysis
A trend assessment was carried out for the emission inventory of all components, in addition to a level assessment, in order to identify key source categories. In both approaches, key source categories were identified using a cumulative threshold of 80%. Key categories are those which, when summed together in descending order of magnitude, add up to more than 80% of the total level (EMEP/EEA, 2016). The level assessments were performed for both the latest inventory year (2017) and the base year of the inventory (1990). The trend assessments aim to identify categories for which the trend is significantly different from that of the overall inventory. See Appendix 2 for the actual analysis.
1.6 Reporting, QA/QC and archiving
1.6.1 Reporting
The Informative Inventory Report is prepared by the
inventory-compiling team at the RIVM, with contributions made by experts from the PRTR task forces.
1.6.2 QA/QC
The RIVM has an ISO 9001:2015 QA/QC system in place. PRTR quality management is fully in line with the RIVM QA/QC system. Part of the work for the PRTR is done by external agencies (other institutes). QA/QC arrangements and procedures for the contributing institutes are described in an annual project plan (RIVM, 2018). The general QA/QC activities meet the international inventory QA/QC requirements described in Part A, Chapter 6 of the EMEP inventory guidebook (EMEP/EEA, 2016).
There are no sector-specific QA/QC procedures in place within the PRTR. In general, the following QA/QC activities are performed:
Quality assurance (QA)
QA activities can be summarised as follows:
• For the energy, industry and waste sectors, emission calculation
in the PRTR is based mainly on AERs made by companies (facilities). The companies themselves are responsible for the data quality; the competent authorities (in the Netherlands, mainly provinces and local authorities) are responsible for
checking and approving the reported data, as part of their annual quality assurance programmes;
• As part of the RIVM quality system, internal audits are performed
at the Department for Data and the Environment (DMO) of the RIVM Centre for Environmental Quality (MIL);
• Annual external QA checks are also conducted on selected areas
of the PRTR system.
Quality control (QC)
A number of general QC checks have been introduced as part of the annual work plan of the PRTR (for results, see Table 1.1). The QC checks built into the work plan focus on issues such as the consistency,
completeness and accuracy of the emission data. The general QC for the inventory is largely performed within the PRTR as an integrated part of the working processes. For the 2019 inventory, the PRTR task forces filled in a standard-format database with emission data from 1990 to 2017. After an automated first check of the emission files by the data exchange module (DEX) for internal and external consistency, the data were made available to the specific task force for the checking of consistency and trends (error checking, comparability, accuracy). The task forces have access to information on all emissions in the database by means of a web-based emission reporting system and they are provided by the ER team with comparable information on trends and time series. Several weeks before a final data set is fixed, a trend verification workshop is organised by the RIVM (see Text box 1.1). The results of this workshop, including actions to be taken by the task forces to resolve the identified clarification issues, are documented by the RIVM. Required changes to the database are then made by the task forces.
Table 1.1 Key items of the verification actions on data processing 2017 and NFR/IIR 2019
QC item/action Date Who Result Documentation*
Automated initial check on internal and external data consistency
During each
upload Data Exchange Module (DEX) Acceptance or rejection of
uploaded sector data
Upload event and result logging in the PRTR database
Input of outstanding
issues for this inventory 4-07-2018 RIVM-PRTR List of remaining issues/actions from
last inventory
Actiepunten voorlopige cijfers 2017 v4 juli 2018. xls
Input for checking allocations from the PRTR database to the NFR tables
20-11-2018 RIVM-NIC List of allocations
NFR-ER-Koppellijst-2018-03-08-dtt54_DW.xlsx
Comparison sheets with
final data 19-11-2018 RIVM Input for data checking Verschiltabel_LuchtActueel_19-11-2018.xls
Input for trend analysis 27-11-2018 RIVM-PRTR Updated list of
required actions Actiepunten definitieve cijfers v 27 november 2018.xls
Comparison sheets with
final data 27-11-2018 RIVM Input for trend analyses Verschiltabel_LuchtActueel_27-11-2018.xls
Trend analysis
workshops 06-12-2018 Sector specialists,
RIVM-PRTR Explanations for observed trends and actions to resolve before finalising the PRTR dataset
− Emissies uit de landbouw 1990– 2017.pptx;
− ENINA TrendAnalysedag reeks 1990–
2017_v3.pptx;
− Trendanalyse verkeer 2018.pptx; − WESP trendanalyse 6-12-2018
defintief.pptx;
− Grootschalige luchtverontreiniging irt
plafondsTrendanalysedag 2018 v1.pptx.
QC item/action Date Who Result Documentation*
Input for resolving the final actions before finalising the PRTR dataset
8-12-2018 RIVM-PRTR Updated action list Actiepunten Definitieve cijfers 1990–
2017 v 7 december 2018.xls
Request to the individual task force chairs to approve the data produced by the task force.
16-1-2019 RIVM-PRTR Updated action list Actiepunten Definitieve cijfers 1990–
2017 v 16 januari 2019.xls Request to the contributing institutes to approve the PRTR database 18-01-2019 PRTR project secretary, representatives of the contributing institutes Reactions of the contributing institutes to the PRTR project leader
− Email (18-1-2019 01:23) with the request to endorse the PRTR database;
− Actiepunten definitieve cijfers v 16
januari 2018.xls; Emails with consent from PBL, Deltares and CBS (CBS 18-1-2019 15:11; PBL 18-18-1-2019 17:34; Deltares 18-1-2019 14:48).
Input for compiling the NEC report (in NFR format)
15-1-2019 RIVM-NIC List of allocations
for compiling from the PRTR database to the NFR tables
NFR-ER-Koppellijst-2018-12-03-dtt56 DW.xlsx
List of allocations for compiling from the PRTR database to the NFR tables
6-2-2019 RIVM Input for compiling
the EMEP/LRTAP report (NFR format)
NFR-ER-Koppellijst-2019-01-25-dtt56-BL-DW.xlsx
Text box 1.1 Trend verification workshops
About a week in advance of a trend analysis meeting, a snapshot of the database is made available by the RIVM in a web-based application (Emission Explorer, EmEx) for checks by the institutes involved, the sector and other experts (PRTR task forces) and the RIVM PRTR team. In this way, the task forces can check for level errors and consistency in the algorithm/method used for calculations throughout the time series. The task forces perform checks on the relevant gases and sectors. The totals for the sectors are then compared with the previous year's data set. Where significant differences are found, the task forces check the emission data in greater detail. The results of these checks form the subject of discussion at the trend analysis workshop and are subsequently documented.
The PRTR team also provides the task forces with time series of emissions for each substance for the individual subsectors. The task forces examine these time series. During the trend analysis for this inventory, the emission data were checked in two ways: (1) emissions from 1990 to 2017 from the new time series were compared with the time series of last year’s inventory; and (2) the data for 2017 were compared with the trend development for each gas since 1990. The checks of outliers are performed on a more detailed level of the subsources in all sector background tables:
• annual changes in emissions;
• annual changes in activity data;
• annual changes in implied emission factors; and
• level values of implied emission factors.
Exceptional trend changes and observed outliers are noted and discussed at the trend analysis workshop, resulting in an action list. Items on this list have to be processed within two weeks or dealt with in next year’s inventory.
Archiving and documentation
Internal procedures are agreed on (e.g. in the PRTR work plan) for general data collection and the storage of fixed data sets in the PRTR database, including the documentation/archiving of QC checks. As of 2010, sector experts can store related documents (i.e. interim results, model runs, etc.) on a central server at the RIVM. These documents then become available through a limited-access website. The updating of monitoring protocols for substances under the CLRTAP is one of the priorities within the PRTR system. Emphasis is placed on the
documentation of methodologies for calculating SOx, NOx, NMVOC, NH3,
PM10 and PM2.5. Methodologies, protocols and emission data (including
emissions from large point sources on the basis of Annual Environmental Reports), as well as emission reports such as the National Inventory Report (UNFCCC) and the Informative Inventory Report (CLRTAP), are
1.6.3 Quantitative uncertainty Approach2 method
Uncertainty estimates of total national emissions are calculated using an Approach2 method (Monte Carlo analysis). Most uncertainty estimates were based on the judgement of emission experts from the ENINA, TgL, V&V and WESP task forces. For agriculture, the judgement of experts was combined with an Approach1 uncertainty calculation. In the Approach1 uncertainty calculation of agriculture, it was assumed that emissions from manure management and manure application were completely correlated with each other.
The expert elicitation was set up following the expert elicitation guidance in the IPCC 2006 Guidelines (motivating, structuring, conditioning,
encoding and verification). Expert judgements were made for activity data and emission factors separately at the level of emission sources (which is more detailed than the NFR categories). Correlations between the activity data and emission factors of different emission sources have been
included in the Monte Carlo analysis. These correlations are included for the following type of data:
• Activity data:
o The energy statistics1 are known better on an aggregated
level (e.g. for industry) than they are on a detailed level (e.g. for the industrial sectors separately). This type of correlation is also used for several transport sectors (shipping and aviation);
o The numbers of animals in animal subcategories that make up
one emission source (e.g. non-dairy cattle, pigs, etc.) are correlated.
• Emission factor:
o The uncertainty of an emission factor from stationary
combustion is assumed to be equal for all of the emission sources in the stationary combustion sector. This type of correlation is also used for several transport sectors (shipping and aviation);
o Emission factors for the different animal categories are
assumed to be partly correlated, because part of the input data for deriving EFs is the same, or because EFs are derived from other animal categories.
The results of the Monte Carlo analysis (Approach2 method) are presented in Table 1.2.
Table 1.2 Uncertainty (95% confidence ranges) for NH3, NOx, SOx, NMVOC, PM10
and PM2.5 for each NFR category and for the national total, calculated with the
Approach2 method for emissions in 2017 (%)
NFR category NH3 NOx SOx NMVOC PM10 PM2,5
1 125 14 33 97 39 41
2 48 73 96 32 36 43
1 The energy statistics are available on the website of Statistics Netherlands. The following link refers to the
energy statistics of 2017. Using the button ‘Change selection’ on the website, it is possible to select the data for another year. Energy statistics of 2017:
NFR category NH3 NOx SOx NMVOC PM10 PM2,5
3 33 114 - 124 25 39
5 59 105 141 151 170 173
6 96 28 - 229 68 68
Total 30 19 32 55 21 28
The uncertainty estimates from the Approach2 method used in 2017 are different from the uncertainty estimates from this method in 2016 (as presented in the IIR 2018). This can be explained by the following:
• Small changes in the total uncertainty of a sector/pollutant are
caused by changes in absolute emissions.
• The uncertainty of emissions from agriculture has been
recalculated (NFR 3).
• Some emissions have been added to the inventory, and also
included in the uncertainty analysis. These are NH3 emissions from biomass combustion (NFR 1), NMVOC emissions in the agricultural sector (NFR 3), emissions from manure digestion (NFR 5) and emissions from bonfires (NFR 5).
• A new uncertainty estimate (expert judgement) for NMVOC
emissions of product use is added.
Approach 1 method
Uncertainty estimates from earlier studies (van Gijlswijk et al., 2004; RIVM, 2001) are presented in Table 1.3. These uncertainty estimates of
NH3 and NOx are similar to the NH3 and NOx uncertainty calculated for
2016. The uncertainty for SOx in 2016 increased compared with the
studies of van Gijlswijk et al. (2004) and RIVM (2001). This can be
explained by the fact that the uncertainty of the SOx emission factor
from chemical waste gas, coal and cokes is assumed to be uncertain.
Table 1.3 Uncertainty (95% confidence ranges) in earlier studies for NH3, NOx and
SOx emissions in 1999 (RIVM, 2001) and 2000 (van Gijlswijk et al., 2004)
Component Tier 1 for 1999 Tier 1 for 2000 Tier 2 for 2000
NH3 ± 17% ± 12% ± 17%
NOx ± 11% ± 14% ± 15%
SOx ± 8% ± 6% ± 6%
1.7 Explanation of the use of notation keys
The Dutch emission inventory covers all sources specified in the CLRTAP that are relevant to emissions to the air in the Netherlands. Because of the long history of the inventory, it is not always possible to specify all subsectors in detail. This is the why notation keys are used in the emission tables (NFR). The use of the notation keys is explained in Table A1.1 and A1.2 in Appendix A. For most cases in which ‘NE’ (not estimated) has been used as a notation key, the respective source is assumed to be negligible or there is no method available for estimating the respective source. ‘IE’ (included elsewhere) notation keys has been used mostly when activity data cannot be split or for reasons of
As a result of questions in subsequent reviews by UN-EMEP (United Nations European Monitoring and Evaluation Programme) and the EU-NECD (European National Emission Ceilings Directive) regarding the use of the notation keys NE and NA (not applicable), the task forces are asked to evaluate the correct use for each instance.
1.8 Explanation of ‘Other’ emission sources
Several source categories in the NFR format are used for allocating emission sources that are related to the NFR category, but that cannot be allocated to a specific source category in the specific source sector. In the NFR format are these source categories are named starting with ‘Other’. In table 1.4 is explained which source sector for the Netherlands are allocated in the various “Other” source categories. These emission sources and their emissions are explained in the relevant chapters for each source sector.
Table 1.4 Subsources accounted for in reporting of NFR ‘other’ codes
NFR13
code Substance(s) reported Subsource description
1A2gvii NOx, NMVOC, SOx, NH3, PM2.5, PM10,
TSP, BC, Pb, Cd, Hg, As, Cr, Cu, Ni, Se, Zn, Dioxins and PAHs
Combustion from mobile machinery in the sectors Industry and Construction.
1A2gviii NOx, NMVOC, SOx, NH3, PM2.5, PM10,
TSP, BC, Pb, Cd, Hg, As, Cr, Cu, Ni, Se, Zn, Dioxins, PAHs and HCBs
Stationary combustion from production industries in:
• construction;
• textiles and clothing;
• leather and fur preparation;
• rubber and plastic products;
• metal products;
• machine construction;
• electronic and electric equipment production;
• computers, electronics and optical equipment production;
• cars;
• other transport production;
• furniture production;
• rug and carpet production;
• wood products;
• concrete, gypsum and cement production;
• construction materials and glass production;
• construction;
• synthetic fibre production;
• ceramics, bricks and roofing tile production;
• waste preparation for recycling;
• mineral extraction;
• shipbuilding.
1A5a NOx, NMVOC, SOx, CO, PM2.5, PM10,
NFR13
code Substance(s) reported Subsource description
1A5b NOx, NMVOC, SOx, NH3, CO, PM2.5,
PM10, TSP, BC, Pb, Cd, Hg, As, Cr, Cu,
Ni, Se, Zn, Dioxins, PAHs, HCBs and PCBs
Recreational navigation and ground machinery at airports.
2A6 NOx, NMVOC, SOx, NH3, CO, PM2.5,
PM, TSP, Hg and PAHs Process emissions of product industries, excl. combustion, in building activities and production of building materials.
2B10a NMVOC, SOx, NH3, PM2.5, PM10, TSP,
Pb, Cd, Hg, As, Cr, Cu, Ni, Se, Zn, Dioxins and PAHs
Process emissions from production of chemicals, paint, pharmaceutics, soap, detergents, glues and other chemical products.
2D3i NOx, NMVOC, SOx, NH3, PM2.5,
PM2.5, TSP, Pb, Cd, Cu, Ni, Zn, Dioxins and PAHs
Smoking of tobacco products, burning of candles, air conditioning, use of pesticides and cosmetics, fireworks, preservation and cleaning of wood and other materials.
2H3 NOx, SOx, NH3, PM2.5, PM2.5, Pb,
Cd, Hg, Cr, Cu, Ni and Zn Process emissions from production of wood, plastics, rubber, metal, textiles and paper. Storage and handling.
3B4h NOx, NH3, TSP, PM10, PM2.5 Rabbits and furbearing animals.
3Da2c NOx, NH3 Use of compost.
5C2 NOx, NMVOC, SOx, NH3, CO, PM2.5,
PM10, TSP, BC, Pb, Cd, Hg, As, Cr, Cu,
Ni, Se, Zn, Dioxins, PAHs, HCBs and PCBs
Bonfires.
5E NOx, NMVOC, SOx, NH3, CO, PM2.5,
PM10, TSP, BC, Pb, Cd, Hg, As, Cr, Cu,
Ni, Se, Zn, Dioxins, PAHs, HCBs and PCBs
Process emissions from: Accidental building and car fires, Waste Preparation for recycling, scrapping fridges and freezers.
6A NOx, NMVOC, NH3, CO, PM2.5, PM10,
and TSP Human transpiration and respiration; Manure sold and applied to private properties or nature areas; Domestic animals (pets),
Privately owned livestock (horses and ponies, sheep, mules and asses).
2
Trends in Emissions
2.1 Trends in national emissions
Total national emissions for all pollutants have decreased substantially since 1990. Tables 2.1, 2.2 and 2.3 provide an overview of the
emissions with respect to the time series. The major overall drivers for this trend were:
• emission reductions in the industrial sectors due to the
introduction of cleaner production technologies and flue gas treatment technologies;
• use of cleaner fuels trough the desulphurisation of fuels and
reduced use of coal and heavy oils;
• cleaner cars due to European emission regulations for new road
vehicles.
The emissions of NH3, NOx and NMVOC increased with respect to the
complete time series mainly due to the addition of new emission sources to the inventory for the Agricultural sector and Waste sector (see
chapter recalculations). As a result of this, the Netherlands is in 2017 (and previous years) no longer in compliance with the NECD and
CLRTAP emission ceilings for NH3 and NMVOC. In accordance with the
conditions relating to these ceilings, and the flexibility allowed by the rules, the Netherlands has applied for adjustments to the emissions in order to achieve compliance. Several emission sources in the agricultural sector are proposed to be adjusted. A complete discussion and
justification for these proposed adjustments can be found in Chapter 12 (Adjustments).
Table 2.1 Total national emissions of main pollutants and PM, 1990–2017
Year
Main pollutants3 Particulate matter
NO x N M V OC SO x NH 3 PM 2. 5 PM 10 TS P BC Gg Gg Gg Gg Gg Gg Gg Gg 1990 629 601 194 351 52.7 75.1 99.1 13.5 1995 527 424 133 224 39.6 56.0 75.2 11.2 2000 441 331 77 176 29.9 44.1 53.2 9.9 2005 381 265 67 155 24.0 36.9 45.4 8.0 2010 312 268 35 134 18.6 31.5 38.9 5.5 2015 265 256 31 129 15.0 27.9 36.0 3.6 2016 254 253 29 128 14.1 27.2 34.7 3.2 2017 246 254 27 132 14.0 26.9 34.1 3.0 1990–2017 period1 -383 -347 -167 -219 -38.7 -48.2 -65.0 -10.4 1990–2017 period2 -61% -58% -86% -62% -73% -64% -66% -77% 1. Absolute difference in Gg.
2. Relative difference from 1990 in %.
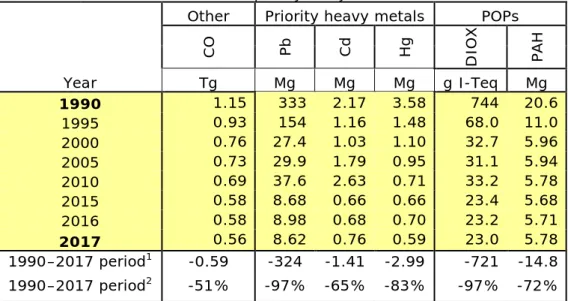
Table 2.2 Total national emissions of priority heavy metals and POPs, 1990–2017
Other Priority heavy metals POPs
CO Pb Cd Hg DIOX PAH Year Tg Mg Mg Mg g I-Teq Mg 1990 1.15 333 2.17 3.58 744 20.6 1995 0.93 154 1.16 1.48 68.0 11.0 2000 0.76 27.4 1.03 1.10 32.7 5.96 2005 0.73 29.9 1.79 0.95 31.1 5.94 2010 0.69 37.6 2.63 0.71 33.2 5.78 2015 0.58 8.68 0.66 0.66 23.4 5.68 2016 0.58 8.98 0.68 0.70 23.2 5.71 2017 0.56 8.62 0.76 0.59 23.0 5.78 1990–2017 period1 -0.59 -324 -1.41 -2.99 -721 -14.8 1990–2017 period2 -51% -97% -65% -83% -97% -72% 1. Absolute difference in Gg.
2. Relative difference from 1990 in %.
Table 2.3 Total national emissions of other heavy metals, 1990–2017
Year
Other heavy metals
As Cr Cu Ni Se Zn Mg Mg Mg Mg Mg Mg 1990 1.28 11.9 36.3 74.9 0.39 225 1995 0.88 8.59 37.2 85.8 0.34 147 2000 0.88 5.09 37.8 19.5 0.46 96.5 2005 1.34 4.34 39.6 10.3 2.57 89.0 2010 0.63 3.85 43.5 2.09 1.52 103 2015 0.67 3.48 38.9 2.00 0.98 103 2016 0.73 3.72 39.8 2.21 0.65 101 2017 0.54 3.57 45.2 2.12 0.21 94.6 1990–2017 period1 -0.74 -8.31 8.89 -72.8 -0.18 -130 1990–2017 period2 -58% -70% 24% -97% -47% -58% 1. Absolute difference in Gg.
2. Relative difference from 1990 in %.
2.2 Trends in nitrogen oxides (NOx)
Dutch NOx emissions (NO and NO2, expressed as NO2) decreased by
383 Gg in the 1990–2017 period, corresponding to 61% of the national total in 1990 (Figure 2.1). The main contributors to this decrease were road transport and the energy sector. Although emissions per vehicle decreased significantly in this period, an increase in the number of vehicles and the miles travelled, partially negated the effect on total road transport emissions. In 2017 transport is still the main contributor
to NOx emissions, with 57% of the national total. The shares of the
Figure 2.1 NOx emission trends, 1990–2017
2.3 Trends in sulphur dioxide (SOx)
Dutch SOx emissions (reported as SO2) decreased by 167 Gg in the
1990–2017 period, corresponding to 86% of the national total in 1990 (Figure 2.2). The main contributors to this decrease were the energy sector, industry, and the transport sector. The use of coal declined and major coal-fired electricity producers installed flue-gas desulphurisation plants. In addition, the sulphur content in fuels for the (chemical) industry and traffic was reduced. Over the period 1990–2017 refining
was the main contributor to total SOx emissions, with shares of 34% and
41% in 1990 and 2017, respectively. In 2017, the source sectors Industry, and Energy and Refining (IER) were responsible for 94% of
national SOx emissions.
Figure 2.2 SOx emission trends, 1990–2017
2.4 Trends in ammonia (NH3)
In recent years, three new NH3 emission sources were added to the
emission inventory (crop ripening, manure treatment, and burning of wood). As a result of these new emission sources, emissions over the complete time series increased.
Most of the NH3 emissions (87% in 2017) come from agricultural sources.
From 1990 to 2013, the decreasing trend in NH3 due to emission
reductions in the agricultural sector also showed up in the decreasing
trend of the national total. From 2014 onwards, NH3 emissions increased
again to just above 134 Gg in 2017. As a result of the abolition of milk quotas in 2015, breeding and dairy cattle numbers increased. As result of this, phosphate excretion increased and in 2016, the Netherlands
introduced a phosphate reduction plan that led, at farm level, to a
reduction of the number of dairy cows. In 2017, the number of dairy cows and the protein content of concentrate feed decreased, but the average weight of the cows increased and the share of grass in the roughage
increased, both resulting in an increase in NH3 emissions (see Chapter 6).
Due to the above-mentioned developments, in 2017 the Netherlands
exceeded the NH3 ceilings set by the NECD and CLRTAP. However, the
introduction over the past years of several new emission sources and new emission factors justify an application for adjustments in order to achieve compliance (see Chapter 12).
Figure 2.3 NH3 emission trends 1990–2017
2.5 Trends in non-methane volatile organic compounds (NMVOC)
In 2017, emissions from silage feeding (agriculture) were added as a new source to the inventory. As result of this new emission source, emissions of NMVOC over the complete time series increased. In the period 1990–2017, NMVOC emissions decreased by 347 Gg, corresponding to 58% of the national total in 1990 (Figure 2.4). With the exception of agriculture, all major source categories contributed to this decrease: transport (introduction of catalysts and cleaner engines), product use (intensive programme to reduce NMVOC content in
consumer products and paints) and industry (introducing emission abatement specifically for NMVOC).
Due to the adding of NMVOC emissions from silage feeding, in 2017 the Netherlands exceeded the NMVOC ceilings set by the NECD and CLRTAP. However, the introduction over the past years of several new emission
sources and new emission factors justify an application for adjustments in order to achieve compliance (see Chapter 12).
Figure 2.4 NMVOC emission trends, 1990–2017
2.6 Trends in PM2.5
PM2.5 emissions are calculated as a specific fraction of PM10 by sector
(based on Visschedijk et al., 2007). They decreased by 36 Gg in the 1990–2017 period, corresponding to 73% of the national total in 1990 (Figure 2.5). The two major source categories contributing to this decrease were the industrial sector (combustion and process emissions; due to cleaner fuels in refineries and the side effect of emission
abatement for SOx and NO) and the transport sector.
Figure 2.5 PM2.5 emission trends, 1990–2017
2.7 Trends in PM10
Dutch PM10 emissions decreased by 48 Gg in the 1990–2017 period,
corresponding to 64% of the national total in 1990 (Figure 2.6). The major source categories contributing to this decrease were:
• industry (combustion and process emissions; due to cleaner fuels
in refineries and the side-effect of emission abatement for SOx
and NOx);
• traffic and transport.
PM10 emissions from agriculture gradually increased from 1990 to 2017
from 4.9 Gg to 6.2 Gg. This was mainly caused by increasing animal numbers in poultry (especially laying hens).
PM10 emissions from the source sectors Energy, Industrial processes,
Other and Transport did not change significantly over the last year.
Figure 2.6 PM10 emission trends, 1990–2017
2.8 Trends in Pb
Lead (Pb) emissions in the Netherlands decreased by 324 Mg in the 1990– 2017 period, corresponding to 97% of the national total in 1990
(Figure 2.7). This decrease is attributable primarily to the transport sector, where, due to the removal of Pb from gasoline, Pb emissions collapsed. The remaining sources contributing to the decrease are industrial process emissions, particularly from the iron and steel industry (due to the replacement of electrostatic filters and the optimisation of some other reduction technologies at Tata Steel).
3
Energy
3.1 Overview of the sector
Emissions from this sector include all energy-related emissions from stationary combustion, as well as fugitive emissions from the energy sector.
Part of the emissions from stationary combustion for electricity
production and industry (NFR categories 1A1 and 1A2) are based on the Annual Environmental Reports (AERs) made by large industrial
companies. For SOx, 97% of the emissions were based on environmental
reports, while for other pollutants the proportions were 91% (NH3), 83%
(NMVOC), 87% (NOx) and 80% (PM10) in 2017. It should be noted that
these percentages include not only the data directly from the AERs, but also the initial gap filling at company level performed by the competent authorities. The emission data in the AERs come from direct emission measurements or from calculations using fuel input and emission factors. Most of the emissions from other stationary combustion (categories 1A4 and 1A5) were calculated using energy statistics and default emission factors.
As in most other developed countries, the energy system in the
Netherlands is largely driven by the combustion of fossil fuels. In 2017, natural gas supplied about 41% of the total primary fuels used in the Netherlands, followed by liquid fuels (38%) and solid fossil fuels (12%). The contribution of non-fossil fuels, including renewables and waste streams, is small (8%). Figure 3.1 and Figure 3.2 show the energy supply and energy demand in the Netherlands.
The energy statistics are available on the website of Statistics
Netherlands. The following link refers to the energy statistics of 2017. Using the button ‘Change selection’ on the website, it is possible to select the data for another year.
Figure 3.1 Energy supply in the Netherlands, 1990–2017 (‘Electricity’ refers to imported electricity only)
Figure 3.2 Energy demand in the Netherlands, 1990–2017
3.2 Public electricity and heat production (1A1a)
3.2.1 Source category description
In this sector, one source category is included: Public electricity and heat production (1A1a). This sector consists mainly of coal-fired power stations and gas-fired cogeneration plants, many of the latter being operated as joint ventures with industries. A relatively small amount of energy is generated by waste incineration plants in the Netherlands through energy recovery (see Peek et al. 2019). All waste incineration plants recover energy and are included in NFR category 1A1a. Relative to several other countries in the EU, nuclear energy and renewable energy (biomass and wind) provide a small amount of the total primary energy supply in the Netherlands.
3.2.2 Key sources
The sector 1A1a is a key source for the pollutants listed in Table 3.1.
Table 3.1 Pollutants for which the Public electricity and heat production (NFR 1A1a) sector is a key source
Category / Subcategory Pollutant Contribution to national
total of 2017 (%)
1A1a Public electricity and
heat production SONOxx 6.8 18
Hg 29
3.2.3 Overview of shares and trends in emissions
An overview of the trends in emissions is shown in Table 3.2. For almost all pollutants, emissions decreased between 1990 and 2017, while fuel consumption increased over the same period.
NOx and SOx emissions decreased by 79% and 90%, respectively. Other
pollutant emissions decreased by at least 54%. The decrease in emissions was partly caused by a shift in energy use, but also to technological improvements (especially the large decrease in dioxin emissions). The
only pollutant for which emissions increased is NH3, due to an increase in
activity rate. For Se, the increase by a factor of 7 between 1995 and 2000 was caused by environmental reports being considered for the later years, while for the earlier years little or no information was available.
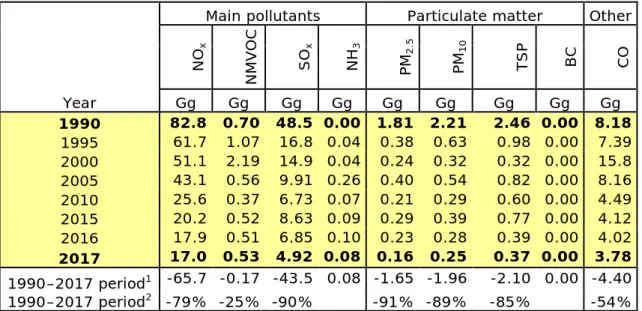
Table 3.2 Overview of trends in emissions
Main pollutants Particulate matter Other
NO x N M V OC SO x NH 3 PM 2. 5 PM 10 TS P BC CO Year Gg Gg Gg Gg Gg Gg Gg Gg Gg 1990 82.8 0.70 48.5 0.00 1.81 2.21 2.46 0.00 8.18 1995 61.7 1.07 16.8 0.04 0.38 0.63 0.98 0.00 7.39 2000 51.1 2.19 14.9 0.04 0.24 0.32 0.32 0.00 15.8 2005 43.1 0.56 9.91 0.26 0.40 0.54 0.82 0.00 8.16 2010 25.6 0.37 6.73 0.07 0.21 0.29 0.60 0.00 4.49 2015 20.2 0.52 8.63 0.09 0.29 0.39 0.77 0.00 4.12 2016 17.9 0.51 6.85 0.10 0.23 0.28 0.39 0.00 4.02 2017 17.0 0.53 4.92 0.08 0.16 0.25 0.37 0.00 3.78 1990–2017 period1 -65.7 -0.17 -43.5 0.08 -1.65 -1.96 -2.10 0.00 -4.40 1990–2017 period2 -79% -25% -90% -91% -89% -85% -54%
Table 3.2 Continued
Priority heavy metals POPs Other heavy metals
Pb Cd Hg DIOX PAH As Cr Cu Ni Se Zn Year Mg Mg Mg g I-Teq Mg Mg Mg Mg Mg Mg Mg 1990 16.3 0.95 1.92 583 0.17 0.50 0.68 2.05 2.49 0.02 40.7 1995 1.56 0.16 0.38 6.05 0.05 0.20 0.37 0.44 1.41 0.05 3.34 2000 0.18 0.08 0.40 0.09 0.00 0.08 0.19 0.17 0.08 0.45 0.26 2005 0.24 0.09 0.38 0.73 0.01 0.16 0.33 0.28 1.91 1.68 0.52 2010 0.34 0.18 0.22 1.16 0.01 0.11 0.14 0.15 0.16 1.33 3.91 2015 0.16 0.03 0.22 1.00 0.03 0.06 0.16 0.18 0.17 0.91 4.07 2016 0.12 0.04 0.22 1.12 0.02 0.04 0.21 0.20 0.12 0.57 4.30 2017 0.10 0.03 0.17 1.50 0.04 0.04 0.14 0.14 0.05 0.13 3.73 1990–2017 period1 -16.2 -0.92 -1.75 -581 -0.14 -0.46 -0.54 -1.92 -2.44 0.11 -36.9 1990–2017 period2 -99% -97% -91% -100% -80% -92% -80% -93% -98% 576% -91% 1. Absolute difference.
2. Relative difference from 1990 in %.
3.2.4 Activity data and (implied) emission factors
Emission data are based on Annual Environmental Reports (AERs) and collectively estimated industrial sources. For this source category, 97– 100% of the emission figures are based on AERs. To estimate emissions from collectively estimated industrial sources, national energy statistics (from Statistics Netherlands) are combined with implied emission factors (IEFs) from the AERs or with default emission factors (see Table 3.3).
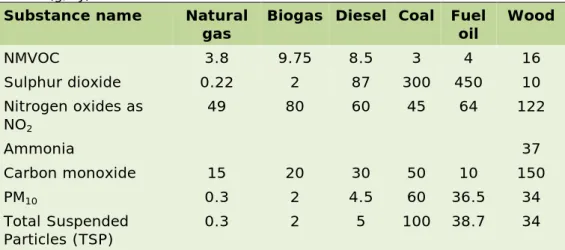
Table 3.3 Default emission factors for electricity production (g/GJ)
Substance
name Natural gas Bio-gas Cokes Diesel LPG Petro-leum Coal Fuel oil Wood
NMVOC 3.8 9.75 45.5 15 1.3 5 0.44 4 48 Sulphur dioxide 0.3 2 370 87 46 300 450 10 Nitrogen oxides as NO2 37 80 100 60 27 50 45 64 120 Ammonia 37 Carbon monoxide 29 20 12,437 30 10 10 50 10 160 PM10 0.2 2 6 4.5 2.0 3.6 60 42.5 12 Total Suspended Particles (TSP) 0.2 2 10 5.0 2.0 4.0 100 45 12
If emissions in AERs are calculated on the basis of stack measurements, they are calculated using uncorrected measurement data. To calculate industrial emissions, Dutch companies are obliged to use the guidance given in the Netherlands PRTR regulations. The relevant documents are
to be found on the government website www.infomil.nl (in Dutch only).
They apply to three types of plant: • Small combustion plants
• Large combustion plants
• Waste incineration plants
These documents explicitly state that emissions shall be calculated using uncorrected measurement data, and that the confidence interval may not be subtracted. Additionally, the calculations shall include emissions during stops, starting-up and incidents. The competent authorities confirmed that they check whether companies use uncorrected measurement data for calculating emissions.
3.2.5 Methodological issues
Emissions are based on data in the AERs from individual facilities (Tier 3 methodology). Emissions and fuel consumption data in the AERs are systematically examined for inaccuracies by checking the resulting IEFs. If environmental reports provide data of high enough quality, the
information is used to calculate an IEF for a cluster of reporting
companies (aggregated by NACE code). These IEFs are fuel- and sector dependent and are used to calculate emissions from companies that are not individually assessed.
EF ER-I (NACE, fuel) =
Emissions ER-I (NACE, fuel)
Energy use ER-I(NACE, fuel)
where:
EF = Emission factor
ER-I = Emission Registration database for individual companies Next, combustion emissions from companies that are not individually assessed in this NACE category are calculated from their energy use according to the energy statistics (from Statistics Netherlands), multiplied by the IEF. If the data from the individual companies are insufficient to calculate an IEF, then a default emission factor is used (see Table 3.3).
ER-C_emission (NACE, fuel) = EF ER-I(NACE, fuel) * energy statistics (NACE, fuel)
where:
ER-C = Emission Registration database for collective emission sources Total combustion emissions are the sum of emissions from the individual companies (ER-I) plus emissions from the companies that are not
individually assessed (ER-C).Uncertainties and time series consistency Uncertainties are explained in Section 1.7.
3.2.6 Source-specific QA/QC and verification
Emissions and fuel consumption data in the AERs are systematically examined for inaccuracies by checking the resulting IEFs. If
environmental reports provide data of high enough quality (see Section 1.6 on QA/QC), the information is used.
3.2.7 Source-specific recalculations
The following recalculations have been performed:
• The emission factors of SOx, CO, PM10 and TSP for natural gas
combustion have been updated. These emission factors are now based on the EMEP/EEA Guidebook (EMEP/EEA, 2016). These emission factors are only used to calculate emissions from companies that did not individually report their emissions.
• The energy statistics for 2015 and 2016 have been improved.
• New PM2.5/PM10 ratios have been derived; these have been used
to calculate PM2.5 emissions (Visschedijk & Dröge, 2019).
• NH3 emissions from biomass have been calculated.
3.2.8 Source-specific planned improvements
The following two sector-specific improvements are planned:
• The emission factors for the other fuels are still under
investigation.
• The AERs from individual companies are not complete. In the
coming years, a few sectors will be studied and AERs will be completed as far as possible. It is yet to be decided which sector will be improved in which year.
• Emissions of PCBs will be calculated in 2019.
3.3 Industrial combustion (1A1b, 1A1c and 1A2)
3.3.1 Source category description
This source category comprises the following categories:
• 1A1b Petroleum refining;
• 1A1c Manufacture of solid fuels and other energy industries;
• 1A2a Iron and steel;
• 1A2b Non-ferrous metals;
• 1A2c Chemicals;
• 1A2d Pulp, paper and print;
• 1A2e Food processing, beverages and tobacco;
• 1A2f Non-metallic minerals;
• 1A2gviii Other.
The sector 1A2gviii includes industries for: mineral products (cement, bricks, other building materials, glass), textiles, wood and wood products and machinery.
3.3.2 Key sources
The sectors 1A1b, 1A2c and 1A2gviii are key sources for the pollutants mentioned in Table 3.4.
Table 3.4 Pollutants for which the Industrial combustion (NFR 1A1b, 1A1c and 1A2) sector is a key source
Category / Subcategory Pollutant Contribution to
total of 2017 (%)
1A1b Petroleum refining SOx 41
1A2a Stationary combustion in
manufacturing industries and construction: Iron and steel
SOx
CO 9.9 12
1A2c Stationary combustion in
manufacturing industries and construction: Chemicals
NOx 3.6
1A2gviii Stationary combustion in manufacturing industries and construction: Other
SOx 8.8
3.3.3 Overview of shares and trends in emissions
An overview of the trends in emissions is shown in Table 3.5. Emissions have been reduced since 1990 for most pollutants, except for dioxins. A reduction in the emissions of the main pollutants has been due to an improvement in the abatement techniques used. Fluctuations in dioxin emissions have been caused by differences in the fuels used and/or
incidental emissions. The reduction in emissions of SOx and PM10 is
mainly due to a shift in fuel use by refineries, i.e. from oil to natural gas.
Table 3.5 Overview of trends in emissions
Main pollutants Particulate matter Other
NO x NM V O C SOx NH3 PM 2. 5 PM 10 TS P BC CO Year Gg Gg Gg Gg Gg Gg Gg Gg Gg 1990 101 6.26 110 0.57 5.84 7.79 8.21 0.41 266 1995 77.7 6.94 88.9 0.32 4.98 6.49 6.71 0.39 215 2000 49.3 2.14 45.9 0.05 2.86 4.16 4.90 0.30 160 2005 49.3 2.15 46.3 0.11 1.40 1.82 2.02 0.12 155 2010 40.2 3.90 24.3 0.48 0.38 0.56 0.80 0.02 126 2015 35.1 2.94 19.8 0.45 0.34 0.46 0.61 0.02 97.6 2016 33.4 2.47 19.4 0.48 0.32 0.45 0.59 0.02 93.7 2017 33.3 2.26 19.7 0.45 0.35 0.48 0.61 0.02 87.3 1990–2017 period1 -67.4 -4.00 -90.3 -0.12 -5.49 -7.31 -7.60 -0.40 -179 1990–2017 period2 -67% -64% -82% -21% -94% -94% -93% -96% -67%
Table 3.5 Continued
Priority heavy metals POPs Other heavy metals
Pb Cd Hg DIOX PAH As Cr Cu Ni Se Zn Year Mg Mg Mg g I-Teq Mg Mg Mg Mg Mg Mg Mg 1990 1.90 0.14 0.18 0.01 0.99 0.17 2.57 1.42 67.1 0.05 2.96 1995 3.90 0.17 0.08 1.02 0.38 0.16 3.18 2.17 80.5 0.05 3.52 2000 0.06 0.01 0.11 0.35 0.00 0.00 0.54 0.16 18.1 0.00 0.89 2005 0.01 0.00 0.00 0.94 0.10 0.78 0.08 0.09 6.50 0.08 0.51 2010 3.08 1.28 0.02 5.79 0.13 0.01 0.14 1.13 0.02 0.12 9.81 2015 0.09 0.00 0.05 0.19 0.10 0.00 0.01 0.00 0.11 0.00 1.16 2016 0.04 0.00 0.04 0.19 0.10 0.00 0.01 0.00 0.11 0.00 0.65 2017 0.01 0.00 0.03 0.09 0.09 0.00 0.28 0.11 0.26 0.00 0.43 1990–2017 period1 -1.89 -0.14 -0.15 0.08 -0.91 -0.16 -2.29 -1.31 -66.8 -0.05 -2.53 1990–2017 period2 -99% -100% -83% 928% -91% -100% -89% -92% -100% -100% -85% 1. Absolute difference.
2. Relative difference from 1990 in %.
3.3.4 Activity data and (implied) emission factors
Petroleum refining (1A1b)
All emission data are based on Annual Environmental Reports (AERs).
Manufacture of solid fuels and other energy industries (1A1c)
Emission data are based on AERs and collectively estimated industrial sources.
Iron and steel (1A2a)
Emission data are based on AERs and collectively estimated industrial
sources. For this source category, 1% of the SOx emissions were
collectively estimated (in 2017), thus 99% were based on the AERs.
Non-ferrous metals (1A2b)
Emission data are based on AERs and collectively estimated industrial sources. For this source category, 36% of the NMVOC emissions, 16% of
the NOx emissions and 19% of the SOx emissions were collectively
estimated (in 2017).
Chemicals (1A2c)
Emission data are based on AERs and collectively estimated industrial
sources. For this source category, 4% of the NOx emissions, 3% of the
SOx emissions and 4% of the NMVOC emissions and 1% of the PM10
emissions were collectively estimated (in 2017).
Pulp, paper and print (1A2d)
Emission data are based on AERs and collectively estimated industrial sources. For this source category, 55% of the NMVOC emissions and
Food processing, beverages and tobacco (1A2e)
Emission data are based on AERs and collectively estimated industrial sources.
Non-metallic minerals (1A2f)
Emission data are based on AERs and collectively estimated industrial sources. Emissions from non-metallic minerals were allocated to 1A2gviii.
Other (1A2gviii)
This sector includes all combustion emissions from the industrial sectors that do not belong to the categories 1A2a to 1A2e. Emission data are based on AERs and collectively estimated industrial sources.
For some of the above-mentioned categories, emissions were not entirely available from the AERs. For these sectors, emissions were calculated using national energy statistics and IEFs from the environmental reports or default emission factors (see ).
Table 3.6 Emission factors for the industrial sector (g/GJ)
Substance
name Natural gas Bio-gas Cokes Diesel LPG Petro-leum Coal Fuel oil (wood Wood
indus-tries) Wood (other indus-try) NMVOC 3.8 9.7 45.5 8.5 1.3 5 0.4 4 48 48 Sulphur dioxide 0.3 2 370 87 46 300 450 10 10 Nitrogen oxides as NO2 37 80 100 60 27 50 45 64 150 120 Ammonia 37 37 Carbon monoxide 15 20 12,437 30 10 10 50 10 750 160 PM10 0.2 2 6 4.5 2 3.6 60 42.5 27 12 Total Suspended Particles (TSP) 0.2 2 10 5.0 2 4.0 100 45 27 12 3.3.5 Methodological issues
Emissions are based on data in the AERs from individual facilities (Tier 3 methodology). The emissions and fuel consumption data in the AERs are systematically examined for inaccuracies by checking the resulting IEFs. If environmental reports provide data of high enough quality, the
information is used to calculate an IEF for a cluster of reporting
companies (aggregated by NACE code). These IEFs are fuel- and sector dependent and are used to calculate the emissions from companies that are not individually assessed.