1
Analysis beyond IPCC AR5: Net Phase Out
of Global and Regional Greenhouse Gas
Emissions and Reduction Implications
for 2030 and 2050
Niklas Höhne (NewClimate Institute), Michel den Elzen (PBL Netherlands
Environmental Assessment Agency), Annemiek Admiraal (PBL)
This briefing provides an overview of questions and answers on the feasibility and implications of phasing out net global and regional greenhouse gas emissions. It was prepared in the framework of the ACT 2015 project.1
What is meant by “net phase out of greenhouse gas emissions”?
Net phase out of greenhouse gas emissions means that anthropogenic emissions2 of greenhouse gases into the atmosphere decrease to a level equal to or smaller than anthropogenic removals of
greenhouse gases from the atmosphere. This would require that emissions from energy, industry, agriculture, forestry and waste are reduced to a bare minimum and are compensated by emissions removals from, for example, forests and carbon capture and storage (CCS).
What is meant by “climate neutrality” or “carbon neutrality”?
“Climate neutrality” on the global scale is equivalent to the net phase out of all greenhouse gas emissions. Remaining greenhouse gas emissions are compensated by at least the same amount of uptake (negative emissions) so that the net input of greenhouse gases to the atmosphere due to human activities is equal to or smaller than zero.
“Carbon neutrality” is a very similar concept, but for carbon dioxide (CO2) emissions only, as used in the Fifth Assessment Report (AR5) of the United Nations Intergovernmental Panel on Climate Change
1
For more information on ACT 2015, see http://www.wri.org/our-work/project/act-2015.
2
(IPCC)3 and the United Nations Environment Programme (UNEP). 4 Global carbon neutrality means that annual anthropogenic CO2 emissions are net zero on the global scale.
If applied on a smaller scale (country, city or company), climate or carbon neutrality would include the impact of emissions credits from international offset mechanisms currently in most widespread use (Clean Development Mechanism), or emissions reductions from greenhouse gas mitigation activities outside of the boundary.
What is meant by “carbon budget”?
The “carbon budget” is the cumulative amount of CO2 emissions over the century. The carbon budget is associated with meeting a certain level of global mean temperature increase; the lower the carbon budget, the lower the level of global temperature increase by the end of the century and the higher emissions reductions required to remain within this budget.
How does the global carbon budget relate to phase out of greenhouse gas emissions?
Carbon budget = eventually net zero CO2 emissions: The climate science working group of the IPCC re-emphasized the carbon budget concept: stabilization of the global mean temperature at a specific level implies that the carbon budget is limited. From the moment the budget is depleted, cumulative net CO2
emissions have to be zero. More stringent temperature targets require earlier net zero CO2 emissions
and thus faster emissions reductions in the years before reaching net zero. The scenarios used in the IPCC report also assume reductions of the other greenhouse gases to a similar extent as CO2.
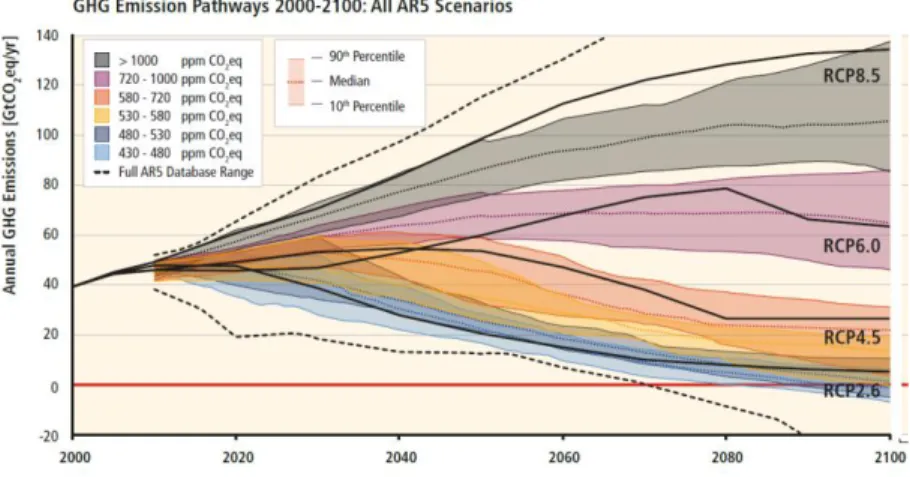
The carbon budget concept is illustrated by the global emissions pathways of the 900 mitigation scenarios, as collected in the IPCC Working Group III (WGIII) AR5 scenario database, shown in Figure SPM.4 of IPCC 2014 WGIII AR5 Summary for Policy Makers (SPM) (here Figure 1). The range spans atmospheric concentration levels in 2100 of 430 parts per million (ppm) CO2 equivalents (CO2eq) to
above 720 ppm CO2eq, which is comparable to the 2100 forcing levels between the Representative
Concentration Pathway (RCP) 2.6 and RCP 6.0. Figure 2 shows that the cumulative emissions of CO2 from
1870 to 2100 (carbon budget) resulting from these scenarios largely determine global mean surface warming by the late 21st century and beyond (IPCC 2014 Synthesis Report5 Figure SPM.10).
3
Intergovernmental Panel on Climate Change (IPCC). 2014. Climate Change 2014: Mitigation of Climate Change. Contribution of Working Group III to the Fifth Assessment Report of the Intergovernmental Panel on Climate Change.
4
United Nations Environment Programme (UNEP), 2014. The Emissions Gap Report 2014.
5
IPCC. 2014. Climate Change 2014: Synthesis Report. Contribution of Working Groups I, II and III to the Fifth Assessment Report of the Intergovernmental Panel on Climate Change.
3
Figure 1. Pathways of global greenhouse gas emissions (GtCO2eq/year) in baseline and mitigation scenarios of all IPCC AR5 scenarios (including the RCPs) for different long-term concentration levels. Source: IPCC 2014 WGIII Report (Figure SPM.4)
Figure 2. The relationship between temperature change and cumulative CO2 emissions (in GtCO2) from 1870 to the year 2100. Source: IPCC 2014 Synthesis Report (Figure SPM.10)
Do we need net negative emissions after emissions have been phased out to net zero?
If the carbon budget is overspent, global CO2 emissions have to become net negative to make up for the overspending. Apart from reforestation, the most important option currently assumed in models to remove CO2 permanently from the atmosphere is the use of biomass with carbon capture and storage –
a technology which has not yet been tested on a large scale.
When do global greenhouse gas emissions have to be phased out to be compatible with 2°C and what are the required emissions reductions by 2030 and 2050?
The phase out year depends on (a) the likelihood with which 2°C is to be met, (b) whether one considers all greenhouse gases or only CO2 emissions and (c) when reductions are assumed to start. Based on the
scenarios from the IPCC Fifth Assessment Report, which assume a starting date of reducing emissions by 2010, the following global phase out dates and emissions reductions for the year 2030 and 2050 can be determined (additional to the IPCC AR5 report, as this report only gives global reductions by 2050 and 2100):
4
For a likely chance (more than 66%) of meeting the 2°C target, 6 global emissions of all greenhouse
gases need to be net zero by 2100: The Working Group III of the IPCC covering options to reduce
greenhouse gas emissions has analyzed hundreds of modelled scenarios of future emissions (IPCC WGIII AR5 scenario database). The working group shows that, scenarios with a CO2-equivalent
concentration between 430 and 480 ppm in 2100 have a likely chance (greater than 66%) of keeping the temperature increase below 2°C. In these scenarios, global greenhouse gas emissions are roughly zero in 2100. The 10th to 90th percentile range for the greenhouse gas emissions in 2100 is 18% below zero to 22% above zero (as a percentage of 2010 emissions) (Table SPM.1, IPCC7). This would require greenhouse gas emissions of about 5% above to 40% below 2010 values by 2030, and 45% to 65% below 2010 levels by 2050 (see Table 1 in Box 1).
For a likely chance of meeting the 2°C target, global CO2 emissions need to be net zero around 2070: In general, most scenarios assume that CO2 and non-CO2 emissions are reduced with about thesame effort. Most scenarios assume that it is more difficult to reduce emissions of N2O and CH4 from
agriculture and land use to zero. Therefore, these residual emissions have to be compensated for by net negative CO2 emissions in order to achieve net zero greenhouse gas emissions. As a result, the
phase out date for CO2 is somewhat earlier than that for all greenhouse gases.
8
For a medium chance (33-66%) of meeting the 2°C target, 9 global emissions of all greenhouse gases need to be net zero around 2100: The global CO2 emissions need to be net zero around 2075. The
10th to 90th percentile range for the greenhouse gas emissions in 2100 is 27% to 79% above zero (as a percentage of 2010 emissions) (Table SPM.1, IPCC). This would require greenhouse gas emissions of about 20% above to 30% below 2010 values by 2030, and 40% to 60% below 2010 levels by 2050 (Table 1, Box 1).
UNEP (2014) has analyzed the impact of starting reductions in 2020 instead of 2010. Their analysis showed:
The higher the emissions in the near term, the higher the required level of negative emissions, and the earlier the timing of reaching zero emissions. For scenarios starting reductions in 2020, global greenhouse gas emissions need to be zero by 2080, and CO2 emissions by 2065. This is about twenty (all greenhouse gases) and five years (CO2) earlier compared to the dates under the least-cost
2010 scenarios.
6
The IPCC AR5 scenarios in the 430-480 ppm CO2-equivalent concentration category. 7IPCC. 2014. Climate Change 2014: Synthesis Report.
8
UNEP. 2014. The Emissions Gap Report 2014.
9
The IPCC AR5 scenarios in the 480-530 ppm CO2-equivalent concentration category have a medium change of
meeting 2°C. In the WGIII Summary for Policymakers these scenarios are categorized as ‘more likely than not’ and ‘about as likely as not’ in keeping global temperature increase below 2°C over the 21th century.
5
In addition, Climate Analytics has used the IPCC scenario database to assess scenarios that have a very
likely chance (90-100% likelihood) of meeting 2°C.10 Their analysis showed:
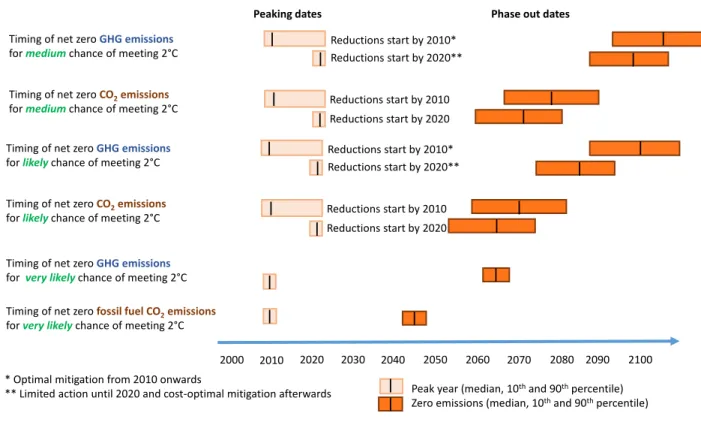
For a very likely chance of meeting the 2°C target, global emissions of all greenhouse gases would need to be net zero by 2065 and be negative thereafter.11 Under these conditions emissions have to be net zero earlier than under the scenarios with a likely chance of meeting the 2°C target. This would require greenhouse gas emissions levels of about 85-90% below 1990 values by 2050.
For a very likely chance of meeting the 2°C target, global CO2 emissions from fossil fuel
combustion and industry would need to be zero as early as 2045, and be negative thereafter. The
CO2 emissions from fossil fuel combustion and industry need to phase out earlier compared to all
greenhouse gas emissions. For a very likely certainty of meeting 2°C, phase out of the CO2 emissions
must occur by the middle of the century (see Figure 3).
10 Rogelj, Joeri, Michiel Schaeffer and Bill Hare. 2014. Timetables for Zero emissions and 2050 emissions
Reductions: State of the Science for the ADP Agreement…
11
Climate Analytics does not present a range as only three, very similar scenarios, are available for this category, so the scenario basis for these numbers is very narrow. Consequently, only the median zero‐year and minimum- maximum ranges for the emissions ranges are provided.
6
Box 1. Global and regional emissions reductions and peak year of emissions.
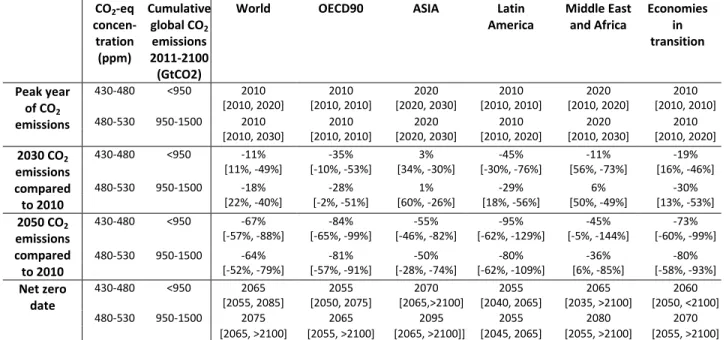
Table 1 Global and regional greenhouse gas (GHG) net zero dates, emission peak years and emission reductions for scenarios compatible with a likely chance and a medium chance of meeting the 2°C target, corresponding to CO2-equivalent
concentration levels of 430-480 and 480-530 ppm, respectively. Following the IPCC AR5, scenarios with a CO2-eq concentration of 430-480 have a likely chance of keeping temperature increase below 2°C, and scenarios with a CO2-eq concentration of 480-530 have a medium chance. For the ranges, the 10th and 90th percentile of the scenarios are shown. Source: this study, IPCC Fifth Assessment Report database.
CO2-eq concen-tration (ppm) Cumulative global CO2 emissions 2011-2100 (GtCO2)
World OECD90 ASIA Latin
America Middle East and Africa Economies in transition Peak year of GHG emissions 430-480 <950 2010 2010 2020 2010 2020 2010 [2010, 2020] [2010, 2010] [2020, 2020] [2010, 2010] [2020, 2020] [2010, 2010] 480-530 950-1500 2010 2010 2020 2010 2030 2010 [2010, 2030] [2010, 2010] [2020, 2030] [2010, 2010] [2020, 2030] [2010, 2020] 2030 GHG emissions compared to 2010 430-480 <950 -11% -30% 1% -28% 6% -17% [9%, -43%] [-15%, -47%] [19%, -34%] [-20%, -49%] [47%, -71%] [15%, -38%] 480-530 950-1500 -15% -28% -3% -14% 8% -23% [22%, -33%] [0%, -47%] [42%, -27%] [-17%, -37%] [45%, -28%] [11%, -45%] 2050 GHG emissions compared to 2010 430-480 <950 -52% -75% -47% -60% -8% -62% [-40%, -69%] [-62%, -86%] [-38%, -62%] [-43%, -82%] [16%, -123%] [-53%, -82%] 480-530 950-1500 -49% -70% -40% -48% -7% -65% [-38%, -60%] [-53%, -80%] [-23%, -56%] [-31%, -70%] [19%, -33%] [-45%, -75%] Net zero date 430-480 <950 2095 2065 >2100 2090 >2100 2080 [2085, >2100] [2055, >2100] [[2080, >2100] [2055, >2100] [2040, >2100] [[2065, <2100] 480-530 950-1500 >2100 2085 >2100 2080 >2100 >2100 [2085, >2100] [2075, >2100] [[2085, >2100] [2065, >2100] [2095, >2100] [[2075, >2100] Table 2 Global and regional CO2 net zero dates, emission peak years and emission reductions for scenarios compatible with a likely and a medium chance of meeting the 2°C target. Source: this study, IPCC AR5 scenario database.
CO2-eq concen-tration (ppm) Cumulative global CO2 emissions 2011-2100 (GtCO2)
World OECD90 ASIA Latin
America Middle East and Africa Economies in transition Peak year of CO2 emissions 430-480 <950 2010 2010 2020 2010 2020 2010 [2010, 2020] [2010, 2010] [2020, 2030] [2010, 2010] [2010, 2020] [2010, 2010] 480-530 950-1500 2010 2010 2020 2010 2020 2010 [2010, 2030] [2010, 2010] [2020, 2030] [2010, 2020] [2010, 2030] [2010, 2020] 2030 CO2 emissions compared to 2010 430-480 <950 -11% -35% 3% -45% -11% -19% [11%, -49%] [-10%, -53%] [34%, -30%] [-30%, -76%] [56%, -73%] [16%, -46%] 480-530 950-1500 -18% -28% 1% -29% 6% -30% [22%, -40%] [-2%, -51%] [60%, -26%] [18%, -56%] [50%, -49%] [13%, -53%] 2050 CO2 emissions compared to 2010 430-480 <950 -67% -84% -55% -95% -45% -73% [-57%, -88%] [-65%, -99%] [-46%, -82%] [-62%, -129%] [-5%, -144%] [-60%, -99%] 480-530 950-1500 -64% -81% -50% -80% -36% -80% [-52%, -79%] [-57%, -91%] [-28%, -74%] [-62%, -109%] [6%, -85%] [-58%, -93%] Net zero date 430-480 <950 2065 2055 2070 2055 2065 2060 [2055, 2085] [2050, 2075] [2065,>2100] [2040, 2065] [2035, >2100] [2050, <2100] 480-530 950-1500 2075 2065 2095 2055 2080 2070 [2065, >2100] [2055, >2100] [2065, >2100]]] [2045, 2065] [2055, >2100] [2055, >2100] Note: All scenarios are included with a radiative forcing of 2.3-2.9 and 2.9-3.45, and for those scenarios that did not report radiative forcing, the criteria of cumulative CO2 emissions: <950 GtCO2 and 950-1500 GtCO2 were used. The ‘medium chance’
scenarios may show higher reductions in 2030 than the ‘likely chance’ scenarios, as this database contains more delayed action scenarios that require faster reductions around 2030.
7
Figure 3. Timing of global peaking and global phase out of greenhouse gas emissions based on the IPCC emission scenarios. Given that for the category very likely are only three scenarios available, there is no range presented here. The analytical background for this category is therefore small. Source: UNEP GAP (medium and likely chance) Climate Analytics (very likely chance).
When do regional greenhouse gas emissions have to be phased out to be compatible with 2°Cand what are the required emissions reductions by 2030 and 2050?
In the previous sections phase-out dates and required emissions reductions were described at the global scale. However, on regional level these phase-out dates and reductions may differ, resulting in some countries reducing earlier than other countries. Tables 1 and 2, and Figure 3 show the phase out dates and total reductions by 2030 and 2050 at the level of the five IPCC AR5 regions for all greenhouse gas emissions (Table 1) and CO2 emissions (Table 2). This data is derived from the IPCC AR5 database. The
IPCC AR5 report only gives regional reductions in 2030 and peak years (Table 6.4 in IPCC AR5 WGIII Chapter 6).
The models are tasked to find the global cost-optimal reductions across regions and sectors. As a result, they assume that emissions are reduced in the regions where they are (assumed to be) the cheapest. This is without prejudice on who pays for these reductions. Many models assume that avoiding deforestation and enhancing afforestation can be achieved at low prices and therefore assign early reductions to the Latin American region. The main findings are:
2010 2020 2030 2040 2050 2060 2070 2080 2090 2100
Timing of net zero fossil fuel CO2emissions
for very likelychance of meeting 2°C Timing of net zero GHG emissions
for very likelychance of meeting 2°C Timing of net zero CO2emissions
forlikelychance of meeting 2°C Timing of net zero GHG emissions
for likelychance of meeting 2°C
2000
Phase out dates Peaking dates
Reductions start by 2020** Reductions start by 2010*
Reductions start by 2020 Reductions start by 2010
* Optimal mitigation from 2010 onwards
** Limited action until 2020 and cost-optimal mitigation afterwards Peak year (median, 10thand 90thpercentile) Zero emissions (median, 10thand 90thpercentile) Timing of net zero CO2emissions
for mediumchance of meeting 2°C Timing of net zero GHG emissions
for mediumchance of meeting 2°C Reductions start by 2020**
Reductions start by 2010*
Reductions start by 2020 Reductions start by 2010
8
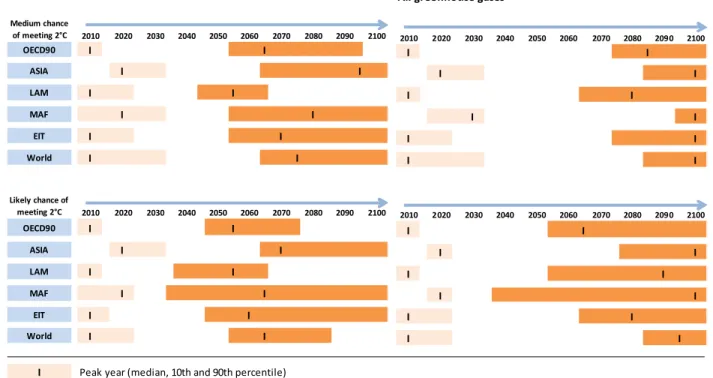
For a likely chance of meeting 2°C, regional CO2 and total greenhouse gas emissions would need to be zero about ten years earlier compared to having a medium chance of meeting 2°C. For comparison, global CO2 emissions need to be zero by 2065, and greenhouse gas emissions by 2095. According to this likelihood of keeping temperature increase below 2°C, the regions OECD90 and Latin America would need to reduce the CO2 emissions within a relatively short time
frame and therefore, peak dates would also need to be earlier (as shown in Figure 4). For the OECD90, Latin America and economies in transition (EIT countries) this means emissions
reductions by 2030 of about 19% to 45% compared to 2010 levels for CO2, and 17% to 30% for all
greenhouse gases. Asia and the Middle East and Africa show, by 2030, a change in CO2 emissions
of about 3% above to 11% below 2010 levels and an increase of 1% to 6% above 2010 levels for all greenhouse gas emissions.
For a medium chance of meeting 2°C, CO2 emissions need to be net zero by the middle of the century (2055-2065) for the regions OECD90 and Latin America and Economies in transition (EIT) countries.12 For comparison, global CO2 emissions need to be zero by 2075, and
greenhouse gas emissions by 2100. Considering all greenhouse gases, the regions OECD90 and Latin America need to reach net zero emissions first (2075-2085), followed by the other regions about ten to twenty years later (around 2100). In order to reach these net zero emissions, the highest reductions in 2030 are needed within the OECD90, EIT countries and Latin America; emissions levels by 2030 reach about 28% to 30% below 2010 levels for CO2 and 14% to 28%
below 2010 levels for all greenhouse gases. The other (developing) regions show a small growth in CO2 emissions towards 2030, about 1% to 6% growth compared to 2010 levels for CO2 and -3%
to 8% to growth for all greenhouse gases.
For both the likely and medium chance of meeting 2°C, CO2 and greenhouse gas emissions in the OECD90, Latin America and EIT countries peak earlier than the countries in Asia, the Middle East and Africa. The first group of countries show a medium peak in greenhouse gas emissions around 2010-2020, while countries in the latter group around 2010-2030.
12
EIT countries are countries undergoing economic reform and groups together the East and Central European countries and the Newly Independent States of the former Soviet Union.
9
Figure 4. Global and regional timing of peak years and net zero emissions for a likely chance of meeting 2°C (430-480 ppm, bottom figures) and a medium chance of meeting 2°C (480-530 ppm, top figures) in terms of CO2 (left figures) and all greenhouse gases (right figures). Presented ranges are 10th and 90th percentile ranges across the IPCC AR5 scenarios, and the median value. Source: this study, IPCC Fifth Assessment Report database.
Is nuclear power needed for global phase out of greenhouse gas emissions?
Some scenarios foresee a larger share of nuclear energy while other scenarios have a lower/zero share. The necessity of nuclear power in the future depends on the rate of technological innovation and the availability of using other sources of energy, like renewables.
Scenarios that, by definition, phase out nuclear power show higher mitigation costs than model runs without this constraint. For example, the IPCC WGIII AR5 (Table SPM.2)13 shows an increase of around 7% in total costs for a scenario without nuclear, relative to a full portfolio scenario with immediate action, and the AMPERE study finds an increase of around 25%.14
13
IPCC, 2014: Climate Change 2014: Mitigation of Climate Change.
14
Kriegler, E. et al. 2014.) Assessing Pathways toward Ambitious Climate Targets at the Global and European levels: A Synthesis of Results from the AMPERE Project. (FP7 AMPERE Project).
CO2 Medium chance of meeting 2°C 2010 2020 2030 2040 2050 2060 2070 2080 2090 2100 OECD90 I I ASIA I I LAM I I MAF I I EIT I I World I I Likely chance of meeting 2°C 2010 2020 2030 2040 2050 2060 2070 2080 2090 2100 OECD90 I I ASIA I I LAM I I MAF I I EIT I I World I I
I Peak year (median, 10th and 90th percentile)
I Zero emissions (median, 10th and 90th percentile)
All greenhouse gases
2010 2020 2030 2040 2050 2060 2070 2080 2090 2100 I I I I I I I I I I I I 2010 2020 2030 2040 2050 2060 2070 2080 2090 2100 I I I I I I I I I I I I
10
To what extent is bio-energy needed for global phase out?
Bio-energy and changes in land use are important parts of the solution. The solution mix requires that biomass is sourced sustainably and without compromising food security and other land demand. Scenarios show that this is possible, but that it needs to be very carefully managed. For example, the IPCC WGIII AR5 (Table SPM.2) shows an increase of around 60% in total costs for a scenario with limited bio-energy relative to a full portfolio scenario with immediate action, and the AMPERE study found an increase of 100%. It should be noted that the number of models that find the 2°C target feasible decreases substantially when the use of bioenergy is limited.
Is a reduction in energy services or a reduction in consumption necessary for a global phase out of greenhouse gas emissions?
No, the usual assumption in the modeled scenarios is that consumption increases, primarily in
developing countries with comparatively low consumption levels today. This means that consumption of energy services and food, in particular meat consumption, would increase. Changes in lifestyle for parts of the population with high consumption levels would provide for additional greenhouse gas emissions reductions.15 However, these are usually not included in the model runs.
What are particular technical challenges with a global net phase out?
A step change in global action is needed. From today on, towards 2100 we have only about 20 years of current emissions left in the carbon budget. The scenarios underlying the feasibility therefore assume a rapid transition as soon as possible in almost all countries.
Stable policy is needed. The technical solutions for phase out of greenhouse gas emissions require changes in long lasting infrastructure, such as power plants, energy systems, buildings and transport infrastructure. These long-term investments need to be carefully managed. Trust in clear, long-term policies is needed here to realize these investments.
Removal of emissions from the atmosphere is needed. Greenhouse gases will also have to be removed from the atmosphere to compensate for remaining emissions that cannot be reduced and to
compensate for delay of action. Current technological solutions may require more technical maturity and social acceptance, such as carbon capture and storage, or may face other constraints, such as forestry and demand for land.
11 References
Intergovernmental Panel on Climate Change (IPCC). 2014. Climate Change 2014: Mitigation of Climate Change. Working Group III Contribution to the Fifth Assessment Report of the Intergovernmental Panel on Climate Change. Edenhofer, O., R. Pichs-Madruga, Y. Sokona, E. Farahani, S. Kadner, K. Seyboth, A. Adler, I. Baum, S. Brunner, P. Eickemeier, B. Kriemann, J. Savolainen, S. Schlömer, C. von Stechow, T. Zwickel and J.C. Minx (eds.). Cambridge University Press, Cambridge, United Kingdom and New York, NY, USA. Available online at: https://www.ipcc.ch/pdf/assessment-report/ar5/wg3/ipcc_wg3_ar5_full.pdf
IPCC. 2014. Climate Change 2014: Synthesis Report. Contribution of Working Groups I, II and III to the Fifth Assessment Report of the Intergovernmental Panel on Climate Change. Core Writing Team, R.K. Pachauri and L.A. Meyer (eds.) Geneva, Switzerland: IPCC: 151 pp. Available online at: https://www.ipcc.ch/pdf/assessment-report/ar5/syr/SYR_AR5_FINAL_full.pdf.
Kriegler, E. et al. 2014. Assessing Pathways towards Ambitious Climate Targets at the Global and
European levels: A Synthesis of Results from the AMPERE Project. Assessment of Climate Change Mitigation Pathways and Evaluation of the Robustness of Mitigation Cost Estimates (AMPERE). Available online at: http://webarchive.iiasa.ac.at/Admin/PUB/Documents/XQ-14-801.pdf Rogelj, Joeri, Michiel Schaeffer and Bill Hare. Timetables for Zero emissions and 2050 emissions
reductions: State of the Science for the ADP Agreement. Climate Analytics, Berlin, Germany. Available online at: http://climateanalytics.org/files/ca_briefing_timetables_for_zero_ emissions_and_2050_emissions_reductions.pdf
Stehfest, E. et al. 2009. Climate Benefits of Changing Diet. Climatic Change. Available online at: https://foodethics.univie.ac.at/fileadmin/user_upload/p_foodethik/Stehfest__E._ Netherlands_Enviro_Ass._Agency_2009._Climate_and_diet.pdf
United Nations Environment Programme (UNEP). 2014. The Emissions Gap Report 2014. UNEP, Nairobi. Available online at: http://www.unep.org/publications/ebooks/emissionsgapreport2014/ portals/50268/pdf/EGR2014_LOWRES.pdf
12 LIST OF ACT 2015 PARTNERS
Ateno School of Government (The Philippines)
E3G (Third Generation Environmentalism) (United Kingdom) Ecofys (Germany)
Energeia
Institute for European Studies- Vrije Universiteit Brussel (Belgium) New Climate Institute
PBL Netherlands Environmental Assessment Agency (The Netherlands) Tsinghua University (China)
World Resources Institute
With support from Youba Sokona and Chukwumerije Okereke
ACT 2015 IS SUPPORTED BY:
This document has been produced with the financial assistance of the European Union. The contents of this document are the sole responsibility of ACT 2015 and can under no circumstances be regarded as reflecting the position of the European Union.
About ACT 2015:
The Agreement on Climate Transformation 2015 (ACT 2015) consortium is a group of the world’s top climate experts from developing and developed countries that have come together to catalyse discussion and build momentum toward reaching a global climate agreement at the forthcoming UN Framework Convention on Climate Change (UNFCCC) summit in 2015.