Monte Carlo Risk Assessment (MCRA)
software: maintenance and management
2016
RIVM Letter report 2017-0014 P.E. Boon et al.
Colophon
© RIVM 2017
Parts of this publication may be reproduced, provided acknowledgement is given to: National Institute for Public Health and the Environment, along with the title and year of publication.
DOI 10.21945/RIVM-2017-0014
P.E. Boon (Author), RIVM
H. van der Voet (Author), Biometris (Wageningen UR) W.J. de Boer (Author), Biometris (Wageningen UR) J. Kruisselbrink (Author), Biometris (Wageningen UR) M. van Lenthe (Author), Biometris (Wageningen UR) J.D. van Klaveren (Author), RIVM
Contact: Polly E Boon Food Safety
polly.boon@rivm.nl
This investigation has been performed by order and for the account of the Netherlands Food and Consumer Product Safety Authority (NVWA), Office for Risk Assessment and Research, within the framework of project ‘Intake calculations and modelling’, research questions 9.4.39
This is a publication of:
National Institute for Public Health and the Environment
P.O. Box 1 | 3720 BA Bilthoven The Netherlands
Synopsis
Monte Carlo Risk Assessment (MCRA) calculation tool: maintenance and management 2016
This report shows the adjustments in the Monte Carlo Risk Assessment (MCRA) computational model implemented by RIVM and Wageningen UR Biometris in 2016. MCRA is a computational tool that presently gives the most realistic chemical intake via food. The model is available for
registered users via the internet (https://mcra.rivm.nl).
The new version of MCRA, version 8.2, was published in December 2016. This version contains new functionalities to calculate the cumulative intake of chemical mixtures via food. Furthermore, this version contains a number of adjustments that easily allow data from several countries to be included simultaneously in an exposure
assessment. These new functionalities have been implemented as part of the partnership agreement between RIVM and the European Food Safety Authority (EFSA) and the EU project EuroMix, among other things.
Furthermore, an analysis was carried out in 2016 to identify options to reduce potential health risks of certain chemicals in food. To quantify these options, a general tool design was developed within MCRA; this design will be implemented in 2017.
MCRA was used in 2016 in the risk assessment of acrylamide in Ras fries (fries made from potato flour) for the Front Office Food and Product Safety. It was also used to calculate the intake of various chemicals that can contaminate food and food additives such as 3-MCPD, flame
retardants and nitrite.
Keywords: intake calculations, probabilistic modelling, MCRA, cumulative exposure, risk management
Publiekssamenvatting
Monte Carlo Risk Assessment (MCRA) rekentool: onderhoud en management 2016
In dit rapport staan de ontwikkelingen rond het rekenmodel Monte Carlo Risk Assessment (MCRA) beschreven die het RIVM en Wageningen UR, Biometris in 2016 hebben uitgevoerd. MCRA is een rekenmodel
waarmee de meest realistische innamen van stoffen via voedsel kan worden verkregen die op dit moment mogelijk is. Het rekenmodel is voor geregistreerde gebruikers beschikbaar via internet.
In december 2016 is een nieuwe versie van MCRA, versie 8.2, gepubliceerd. Deze versie bevat nieuwe functionaliteiten om de
cumulatieve inname van stoffen via voedsel te berekenen. Verder bevat deze versie een aantal aanpassingen waardoor het rekenmodel beter geschikt is om de inname van stoffen via voedsel te berekenen met gegevens uit meerdere landen. Deze nieuwe functionaliteiten zijn geïmplementeerd als onderdeel van een aantal (internationale)
projecten, waaronder de partnershipovereenkomst tussen het RIVM en het Europese voedselveiligheidsautoriteit (EFSA) en het EU project EuroMix.
Verder is in 2016 een analyse uitgevoerd naar opties om mogelijke gezondheidsrisico’s door de aanwezigheid van stoffen in voedsel te verkleinen. Om deze opties te kwantificeren is een algemeen ontwerp van een tool binnen MCRA ontwikkeld. Dit ontwerp zal in 2017 worden geïmplementeerd.
De rekentool is in 2016 gebruikt bij één risicobeoordeling voor het Front Office Voedsel- en Productveiligheid (aanwezigheid van acrylamide in Ras-patat) en om de inname te berekenen van verschillende stoffen die voedsel kunnen besmetten en van voedseladditieven, zoals 3-MCPD, vlamvertragers en nitriet.
Kernwoorden: innameberekeningen, probabilistisch modelleren, MCRA, cumulatieve blootstelling, risicomanagement
Contents
1 Introduction — 9
2 Tasks performed in 2016 — 11
2.1 ICT infrastructure — 11
2.2 Revision control, and maintenance — 11
2.2.1 Documentation — 11
2.2.2 Validation — 11
2.2.3 Help desk — 11
2.3 New functionalities — 12
2.4 Development risk management tool in MCRA — 12
3 International developments regarding MCRA — 15 4 Publications 2016 — 17
5 Conclusion — 19 References — 21
1
Introduction
The Monte Carlo Risk Assessment software calculates the dietary exposure to chemical substances in foods, both acute and chronic, in a probabilistic manner, both in the field of nutrition and food safety. MCRA is continuously updated and adjusted based on user feedback and new (international) developments and insights regarding the performance of such assessments. The developments and major adjustments of MCRA are, predominantly financed by the European Commission as part of EU projects (e.g. SAFE FOODS1 , ACROPOLIS2, EuroMix3) and the European
Food Safety Authority (EFSA).
Within the ‘Intake calculations and modelling’ (IBM) project, financed by the Netherlands Food and Consumer Product Safety Authority (NVWA), Office for Risk Assessment and Research (BuRO), the MCRA software is maintained and managed. Without this maintenance, it would be not be possible to provide contributions regarding exposure modelling in various national and international projects in a consistent way. The IBM project also allows for the performance of national exposure
assessments. These assessments are performed as part of the IBM project, but also, for example, as part of risk assessment questions of the NVWA through the Front Office Food and Product Safety, or research projects financed by the NVWA or different Dutch ministries.
This short report gives an overview of the work performed regarding the maintenance and management of MCRA in 2016.
1 www.safefoods.n 2 www.acropolis-eu.com 3 www.euromixproject.eu
2
Tasks performed in 2016
2.1 ICT infrastructure
In 2016, the ICT infrastructure for MCRA was maintained in cooperation with WUR Biometris and the Shared Service Centre.
From 15 December 2016, MCRA 8.2 has become available at https://mcra.rivm.nl. This version has not been used in exposure assessments performed in 2016. For those assessments, version 8.1 was used. The earlier versions of MCRA are no longer available for dietary exposure calculations. To keep these versions available online is very costly, and given the financial resources not feasible. If in
incidental cases, it is necessary to redo an old calculation with one of these earlier versions of MCRA, they are available offline at WUR Biometris.
2.2 Revision control, and maintenance
An important aspect of model development is the management of the different versions. In 2016, MCRA 8.1 was the operational version until 15 December. Per 15 December 2016, MCRA 8.2 is the operational version.
2.2.1 Documentation
For a good revision control, the documentation of the different versions of MCRA is necessary. The documentation in 2016 included the
documentation of MCRA versions 3 up to 8.2.
2.2.2 Validation
Validation of MCRA is needed when a new version of the software is released. Due to the late release of MCRA 8.2 and budget constraints within the IBM project, this version has not yet been validated in relation to the previous version of MCRA by RIVM. This will be done at the beginning of 2017. WUR Biometris has performed a validation on the key results before the release of the new version.
2.2.3 Help desk
During the period of 2016, Biometris has been available to provide support with the use of MCRA. Furthermore, small adjustments were implemented in MCRA due to bugs and user wishes. These adjustments were not fundamental and did therefore not require a validation of the adjusted software or the release of a new version of MCRA. Adjustments made were
• implementation of a new graphics component (OxyPlot, improved functionality),
• the option for partial downloads of output sections in pdf form (including outline),
• details of agricultural use,
• an implementation of cumulative exposure for TDS data and for Health Impact (IPRA) assessments,
• implementation of random generators to secure reproducibility of results,
• brand loyalty (market share chronic).
2.3 New functionalities
In 2016, the following new functionalities were added to MCRA 8.1 and/or 8.2, financed in different projects.
1. Summaries
2. Mixture selection (EuroMix project) 3. Co-exposure (EuroMix project), 4. Data handling (EuroMix project),
5. Non-dietary and aggregate exposures (EuroMix project), 6. Cumulative IPRA (EuroMix project),
7. Multi-country assessment (EFSA-RIVM partnership agreement), 8. Tiered approaches (EuroMix project)
See Appendix A for further details about these new functionalities.
2.4 Development risk management tool in MCRA
MCRA 8.2 contains a risk management tool that was developed within the EU project Total Diet Study (TDS)4. The tool quantifies how
regulation of the use of specific compounds on a specific food can affect exposure to these compounds. Using a pragmatic approach, it is
assumed that effective regulation will reduce the total exposure
distribution by a fixed factor, such that only a limited percentage of the exposures will exceed a given threshold. However, other risk
management options exist. Moreover, the current tool can only be used in combination with TDS data, and not monitoring data.
As part of the IBM project, this risk management will be improved to reflect the different risk management (RM) options available. In 2016, possible RM actions were listed, and a more general design for the RM tool in MCRA was developed. This design will be implemented in MCRA in 2017.
The following possible RM actions to reduce a (too high) intake of chemicals or chemical groups have been identified:
1. Reduce product norms (e.g. maximum residue limits (MRLs) or maximum permitted levels (MPLs)
2. Remove products from trade
3. Prohibit the use of chemicals for all products (relevant for regulated chemicals, e.g. pesticides, veterinary medicines, and additives)
4. Prohibit the use of chemicals on specific products/crops/animals 5. Dietary advice
6. Create a Code of Practice together with industry to influence the production process such that levels of chemicals will be reduced (relevant for process contaminants, such as acrylamide or 3-MCPD)
7. Determine indicative limit values for foods as eaten (these are not necessarily legal limits, but may help the market to arrive at lower levels in products)
8. Adapt the waiting period between last application and harvest/slaughter (relevant for pesticides and veterinary medicines)
9. Choice of crop varieties that are not or less susceptible to diseases and therefore require no/less pesticides
10. Prohibit import from countries on a ‘high risk’ list
Actions 1, 2, 4 and 6 are RM actions that can be addressed by existing or future (already planned) options in MCRA. Other actions require the development of new models. In particular, the currently implemented RM tool is a very simple interpretation of action 6, assuming that the whole concentration distribution is shifted with a simple factor, such that the percentage of the concentration distribution above a defined
concentration limit is limited to a given percentage (e.g. 5%, 10%). The limit value and percentage can be provided to MCRA .
Design for a future implementation
• Adapt MCRA in such a way that scenario analyses can be
performed with monitoring data. For this, the Concentration data group and the TDS data group (see data formats manual of MCRA) should be integrated.
• Generalize the concept of ConcentrationLimit values with MRL, MPL or ad-hoc limit value as special cases.
• (in relation to RM action 1) Implement an option to choose between limit values from the available concentration data (or distribution) or from the actual limit values.
• (in relation to RM action 1) Implement an RM scenario based on alternative concentration limits. This requires scenario-specific input for limit values.
• (in relation to RM action 4) Implement an RM scenario based on scenario authorisations, requiring scenario-specific input. Note: The current Agricultural Use option (for pesticides) in MCRA can be used by making it more generally applicable, including for example additives and veterinary drugs.
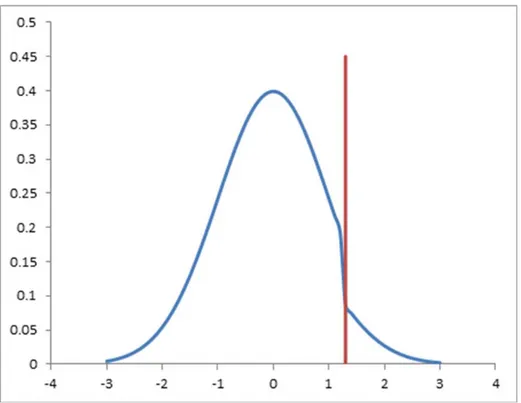
• (in relation to RM action 2) Tail reduction scenario:
Implementation of an option in which, instead of dividing by a factor, the tail of the concentration distribution above the limit is reduced by multiplication with a factor (between 0 and 1)
representing the ineffectiveness of control. The resulting distribution is based on two parts: the truncated concentration distribution for values lower than or equal to the limit, and the same but reduced truncated concentration distribution for higher values than the limit value (example in Figure 1).
Figure 1. Example of tail reduction scenario where 50% of log concentrations above 1.3 are assumed to be removed.
3
International developments regarding MCRA
The international developments regarding MCRA are as described in the 2015 maintenance and management report of MCRA (Boon et al., 2015). As described in section 2.3 of the current report, adjustments have been implemented in MCRA to make the software better suitable for use by EFSA and DG SANTE. These adjustments have been made as part of the agreements between RIVM and these two institutions. The results of these projects are expected to be published in 2017 on the EFSA website. A report was published on the EFSA website describing the development of a scalable version of MCRA as part of the
partnership agreement between RIVM and EFSA (van der Voet et al., 2016). For the convenience of the reader, the text of the short report of 2015 explaining the background of these agreements is included below. As follow-up of the EU project ACROPOLIS, a partnership agreement between RIVM and EFSA has been set up to develop MCRA further in relation to the needs of DG SANCO, EFSA, Member States and industry regarding the performance of dietary exposure assessments to
pesticides belonging to cumulative assessment groups. The ultimate aim of this partnership is to have a long-lasting relationship between EFSA and RIVM regarding model development for calculating the risk of exposure to multiple chemicals.
Also with DG SANTE, an agreement has been reached to use MCRA to improve the understanding of cumulative dietary exposure assessments of pesticide residues at Member State level within the framework of Regulation (EC) No. 396/2005. For this, an electronic working group has been established. In a recent opinion, EFSA has proposed several
scenarios for probabilistic exposure assessments to pesticide residues via food (EFSA, 2012). Within this electronic working group, with the help of work examples set up with MCRA, the different scenarios will be discussed to arrive at an optimal scenario for achieving the goals set out in Regulation (EC) No. 396/2005. Furthermore, the use of probabilistic techniques for risk assessment and setting of maximum residue limits (MRLs) for pesticide residues depends on a common understanding regarding an acceptable health risk. The electronic working group will also address this issue.
In the coming years, the expectation is that, as part of the above mentioned collaborations, MCRA will become better suitable for use at the international level for pesticide residue exposure assessments by different stakeholders, including EFSA, DG SANTE, the Member States and industry. The following developments are expected:
1. Implementation of technical features, such as scalability, to facilitate cumulative dietary exposure assessments to pesticide residues belonging to a large cumulative assessment group (e.g. consisting of more than 100 pesticides).
3. Open and transparent exchange of input data and models. This includes the scientific justification of the statistical algorithms used in exposure assessments, such as openly available reference/user manuals.
4. Implementation of probabilistic modelling results in European decision making regarding health risks.
The partnership agreement with EFSA will offer RIVM, the NVWA, and the Dutch ministries of Health, Welfare, and Sports and the one of Economic Affairs a position to harmonise and refine chemical risk assessment at the international level. However, national investments in the software remain necessary to keep the software optimally available for national dietary exposure assessments to chemical substances:
• Developments relevant for the risk assessment of other food chemicals (other than pesticide residues), as well as a help-desk function, revision control and maintenance, are not covered in the agreements with EFSA and DG SANTE.
• National investments and a better fine-tuning of national and international initiatives and agendas are required to improve chemical risk assessments at the international level.
• International developments are not fully equivalent with national developments and in many areas additional information at the national level might require a more refined approach as currently achievable at the international level.
4
Publications 2016
In 2016, several papers and reports in which MCRA was used to
estimate the dietary exposure to chemical substances were published or prepared. These papers and reports include the dietary exposure to 3-MCPD (Boon et al., 2016b), flame retardants (Boon et al., 2016a), added titanium dioxide and its nano-fraction (Rompelberg et al., 2016), mycotoxins (Sprong et al., 2016), lead (Boon et al., In prep), and nitrates and nitrites as food additive (Sprong et al., In prep). MCRA was also used by researchers outside RIVM to assess the dietary exposure to nitrite in Finnish children and adults (Suomi et al., 2016).
Apart from this, dietary exposure assessments to chemical substances performed with MCRA are used as input in Front Office Food and Product Safety assessments. In 2016, this included the assessment of the intake of acrylamide via the consumption of Ras fries (fries made from potato flour) (Front Office Voedsel- en Productveiligheid, 2016).
5
Conclusion
In 2016, MCRA was used both nationally and internationally for dietary exposure assessments to chemical substances. Furthermore, a new version of MCRA, version 8.2, has been published and will be used from December 15 onwards for the exposure assessments. This new version contains new functionalities related to cumulative exposure assessments and makes MCRA better suitable for use at the international level for dietary exposure assessments. These new functionalities have been developed and implemented as part of a number of (international) projects.
Furthermore, an analysis of possible risk management (RM) actions was performed, and a more general design for the risk management tool in MCRA was developed. This design will be implemented in MCRA in 2017. In 2016, MCRA was used in one risk assessment question of the
Netherlands Food and Consumer Product Safety Authority (NVWA) through the Front Office Food and Product Safety, and to assess the exposure to several food contaminants and food additives.
References
Béchaux C, Zetlaoui M, Tressou J, Leblanc JC, Héraud F, Crépet A (2013). Identification of pesticides mixtures and connection between combined exposure and diet. Food Chemical Toxicology 59: 191-198. Boon PE, te Biesebeek JD, van Leeuwen SPJ, Hoogenboom LAP, Zeilmaker MJ (2016a). Dietary exposure to polybrominated diphenyl ethers in the Netherlands. RIVM Letter report 2016-0037. National Institute for Public Health and the Environment (RIVM), Bilthoven. Available online: www.rivm.nl.
Boon PE, te Biesebeek JD (2016b). Preliminary assessment of dietary exposure to 3-MCPD in the Netherlands. Reportnr: 2015-0199. National Institute for Public Health and the Environment (RIVM), Bilthoven. Available online: www.rivm.nl.
Boon PE, te Biesebeek JD, van Donkersgoed G, Zeilmaker MJ (In prep). Dietary exposure to lead in the Netherlands. National Institute for Public Health and the Environment (RIVM), Bilthoven. Will become available online: www.rivm.nl.
Boon PE, van der Voet H, de Boer W, Kruisselbrink J, van Lenthe M, van Klaveren JD (2015). Monte Carlo Risk Assessment (MCRA) software: maintenance and management 2015. Bilthoven, Wageningen, National Institute for Public Health and the Environment, WUR Biometris.
Crépet A, Sprong C, Béchaux C, de Boer W, Beukers M, Blaznik U, Svab A, Rorije E, Peijnenburg A, van der Voet H, van Klaveren J (2016). List of mixture compounds from combined dietary exposures. Milestone MS8 related to Task 5.3: Identification of relevant mixtures based on
exposure consideration. Available online: www.euromixproject.eu. de Boer WJ, van der Voet H, Kruisselbrink JW, van Lenthe MS, Béchaux C, Crépet A (2016). Milestone MS9 (6.1): Report on Task 6.1:
Implementation mixture selection. Available online:
www.euromixproject.eu.
EFSA (2012). Guidance on the Use of Probabilistic Methodology for Modelling Dietary Exposure to Pesticide Residues. EFSA Journal 10(10):2839. [95 pp.]. Available online: www.efsa.europa.eu. Embry MR, Bachman AN, Bell DR, Boobis AR, Cohen SM, Dellarco M, Dewhurst IC, Doerrer NG, Hines RN, Moretto A, et al. (2014). Risk assessment in the 21st century: Roadmap and matrix. Critical Reviews in Toxicology, 44:6-16.
Front Office Voedsel- en Productveiligheid (2016). Acrylamide in Ras patat. Bilthoven, Wageningen, Rijksinstituut voor Volksgezondheid en Milieu (RIVM), RIKILT Wageningen UR.
Kennedy M, van der Voet H, de Boer W, Bokkers B, Grosskopf C, Karrer C, von Goetz N, Crépet A (2016). A functional design for aggregate exposure linking dietary and non-dietary exposure modules. Milestone 10 report. Available online: www.euromixproject.eu.
Moretto A, Bachman A, Boobis A, Solomon KR, Pastoor TP, Wilks MF, Embry MR (In press). A framework for cumulative risk assessment in the 21st century. Critical Reviews in Toxicology.
Pastoor TP, Bachman AN, Bell DR, Cohen SM, Dellarco M, Dewhurst IC, Doe JE, Doerrer NG, Embry MR, Hines RN, et al. (2014). A 21st century roadmap for human health risk assessment. Critical Reviews in
Toxicology, 44:1-5.
Rompelberg C, Heringa MB, van Donkersgoed G, Drijvers J, Roos A, Westenbrink S, Peters R, van Bemmel G, Brand W, Oomen AG (2016). Oral intake of added titanium dioxide and its nanofraction from food products, food supplements and toothpaste by the Dutch population. Nanotoxicology, doi: 10.1080/17435390.2016.1222457.
Slob W (2002). Dose-response modeling of continuous endpoints. Toxicological Sciences, 55: 298-312.
Sprong RC, de Wit-Bos L, te Biesebeek JD, Alewijn M, Lopez P, Mengelers MJB (2016). A mycotoxin-dedicated total diet study in the Netherlands in 2013: Part III – exposure and risk assessment. World Mycotoxin Journal 9: 109-127, doi: 10.3920/WMJ2015.1905.
Sprong RC, Niekerk M, Beukens M (In prep). Intake assessment of the food additives nitrites (E 249 and E 250) and nitrates (E 251 and E 252). National Institute for Public Health and the Environment (RIVM), Bilthoven. Will become available online: www.rivm.nl.
Suomi J, Ranta J, Tuominen P, Putkonen T, Bäckman C, Ovaskainen ML, Virtanen SM, Savela K (2015). Quantitative risk assessment on the dietary exposure of Finnish children and adults to nitrite. Food Additives & Contaminants: Part A, doi: 10.1080/19440049.2015.1117145.
van der Voet H, de Boer WJ, Kruisselbrink JW, van Donkersgoed G, van Klaveren JD (2016). MCRA made scalable for large cumulative
assessment groups. EFSA supporting publication 2016:EN-910. Available online: www.efsa.europa.eu.
van der Voet H, Slob W (2007). Integration of probabilistic exposure assessment and probabilistic hazard characterization. Risk Analysis, 27: 351-371, doi: 10.1111/j.1539-6924.2007.00887.x.
van der Voet H, van der Heijden GWAM., Bos PMJ, Bosgra S, Boon PE, Muri SD, Brüschweiler BJ (2009). A model for probabilistic health impact assessment of exposure to food chemicals. Food and Chemical
Appendix New functionalities in MCRA
WUR Biometris, 06-12-2016
1. Summaries
In MCRA, simulation results for dietary and non-dietary exposures are summarized by food x compound combination, by foods, by read across TDS-foods, by compounds, by non-dietary route x compound
combinations, by non-dietary routes and by dietary and non-dietary routes. The original summaries were based on daily intakes (intake days) independently of the assessment type (acute or chronic). Now, for the acute case, summaries are still based on daily intakes, but for the chronic case, summaries are based on chronic estimates (averaging within individuals) and in this way better reflect the type of analysis that is performed. In all summaries exposure > 0 are summarized and in the summaries for compounds, the statistics are expressed on the scale of the compounds themselves (rather than on the scale of the reference equivalents).
2. Mixture selection
In the EuroMix project, the development of a mixture selection module based on exposure was prioritised, because the choice of chemicals for the experiments depended on this (Task 6.1). A mixture selection module was therefore developed, based on a method called sparse non-negative matrix under approximation (SNMU) (de Boer et al., 2016). The mixture selection module was then applied to French and Dutch data in Task 5.3, leading to a list of suggested chemicals for each adverse outcome pathway in the project (Crépet et al., 2016). Practical guidance was developed for other EuroMix partners (EuroMix 2016). The mixture selection module was already made available in advance as part of MCRA 8.1, but is officially delivered in MCRA 8.2.
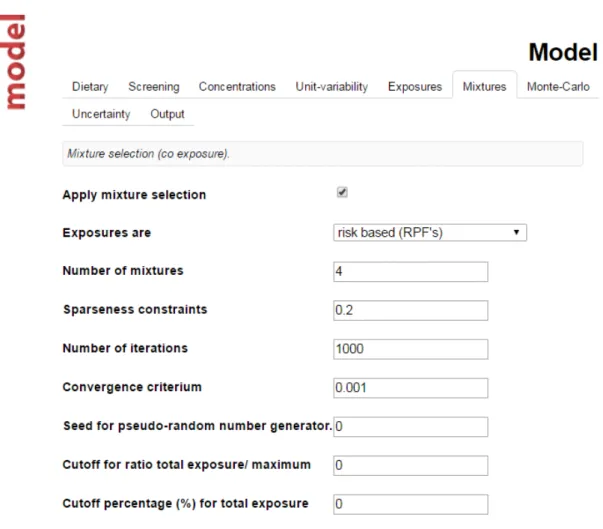
The new functionality can be chosen by checking ‘Apply mixture selection’ in the tab Mixtures in the MCRA Model interface (see Figure A).
The usual choice for ‘Exposures are’ will be ‘risk based (RPFs)’, which means that the exposures of all compounds will be recalculated to exposures in terms of the reference compound before the NMU algorithm is applied. The alternative option, ‘standardized’ is only provided for calculations similar to those in (Béchaux et al., 2013). The SNMU method identifies clusters of compounds with often come together in the exposure matrix. In reality, a very large number of possible compound-combinations (mixtures) often exists, but the interest lies mainly at the most important ones. The option ‘Number of mixtures’ specifies this.
The next four options refer to technical parameters (see de Boer et al., 2016). The last two options refer to possible pre-selection criteria for the exposure matrix based on the Maximum Cumulative Ratio (MCR) plot, discussed in the next section.
Figure A. Screenshot of the mixture selection interface in MCRA 8.2.
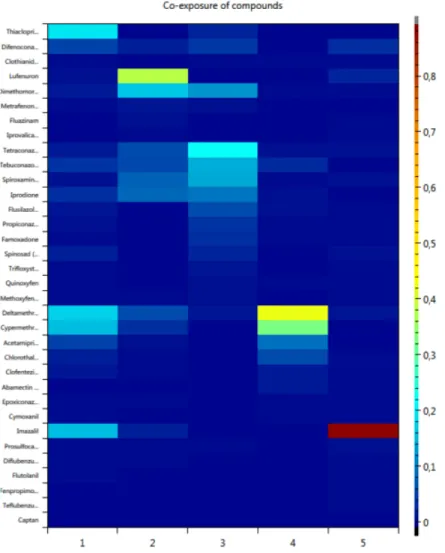
An example of the output of a mixture selection is presented in Figure B. In practical cases the most predominant ‘mixtures’ have often only one compound, representing no real mixtures. By restricting the analysis to the exposure days at which the exposure from all compounds is at least five times the exposure from any single compound, more focus is placed on the truly important mixture effects.
More details on the use of the mixture selection module in MCRA are available in the EuroMix milestone reports of de Boer et al. (2016), Crépet et al. (2016), and the practical MCRA guidelines.
Figure 1. Example of SNMU mixture selection. Five mixtures are identified; predominant compounds in the first mixture are thiacloprid, deltamethrin, cypermethrin, and imazalil. Copied from de Boer et al. (2016).
3. Co-exposure
An inventory of the degree of co-exposure, i.e. exposure to more than one compound, can be made visible using various newly implemented instruments in MCRA 8.2 as part of the EuroMix project:
1. qualitative approach: co-exposure distribution. Which part of the exposure distribution is based on co-exposure?
2. qualitative approach: counting of co-exposure. To which combinations of compounds are individuals exposed?
3. quantitative approach: maximum cumulative ratio (MCR). To what degree are mixtures more important than single
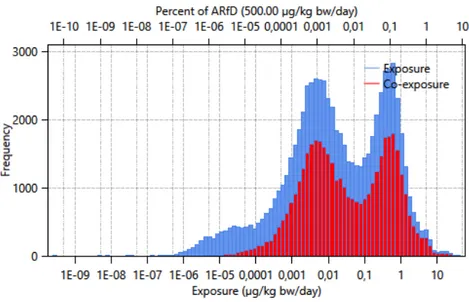
Examples of diagnostic plots and tables related to co-exposure are shown below (Figures C and D). For more details, see the EuroMix milestone report (de Boer et al., 2016).
Figure C. Example of co-exposure distribution (from > 1 compound per individual-day, red) super-imposed on the total exposure distribution (blue).
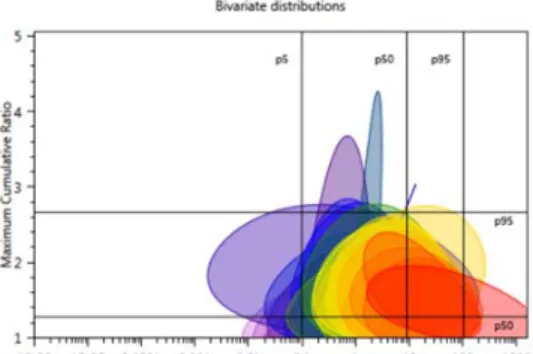
Figure D. Example Maximum Cumulative Ratio (MCR) plots. Copied from Milestone report, de Boer et al. (2016).
For further details on the use of these instruments, see the EuroMix milestone reports (de Boer et al., 2016; Crépet et al., 2016) and the practical guidelines.
4. Data handling
In versions of MCRA up to 8.1, the raw data needed for an exposure assessment were uploaded and then compiled in the database for further use. Data compilation was thus linked to all relevant entities for a certain task. This system, while straightforward, is not flexible enough for the future EuroMix toolbox, in which many different tasks should be possible, each with different data requirements. Therefore, the MCRA system was restructured in version 8.2, so that tasks can be performed by directly using the raw data. The compilation of links between the entities in the datasets is then performed directly when needed. An advantage is that the sometimes lengthy compilation step can be avoided if only part of the data is replaced by new data.
5. Non-dietary and aggregate exposure
In the EuroMix project, several models for non-dietary exposure are considered. The functionality of MCRA for aggregate exposure
assessment has been reviewed and a functional design has been made for the future implementation in the EuroMix project with links to BROWSE, PACEM, AOEM and possibly other non-dietary models (Kennedy et al., 2016).
In the aggregate exposure module of MCRA 8.1, non-dietary exposures were linked to dietary exposures. In MCRA 8.2, this module has been revised. The following items have been implemented:
• Inclusion of multiple non-dietary surveys
• Demographic criteria (e.g. age, gender) can be set as survey properties
• Cumulative assessment allowing multiple compounds
• New option for unmatched: sample non-dietary individuals from
multiple non-dietary surveys with correlation or not
• Improved file upload and performance
The option to match non-dietary and dietary exposure is made
independent of the uploaded non-dietary data. For matching to occur, non-dietary individuals should have identity codes that are identical to those used in the dietary data. Dietary individuals without a non-dietary counterpart are assumed to have a zero non-dietary exposure, unless a non-dietary exposure is recorded with ‘Individual = General’ and the dietary individual meets the demographic criteria.
When matching is not activated, non-dietary individuals are randomly sampled and allocated to a dietary individual meeting the demographic criteria. When multiple surveys are available, the option ‘sample individuals with correlation or not’ is relevant. When correlation is activated, non-dietary exposures of individuals with identical identity codes in the available non-dietary surveys are matched to the relevant dietary individual. When correlation is not activated, from each available survey a non-dietary exposure record is sampled, combined and
allocated to a randomly selected dietary individual that meets the demographic criteria.
6. Cumulative IPRA and hazard vs. exposure plots for risk assessment
Risk assessment integrates exposure assessment and hazard assessment. MCRA contains a module to integrate this: Integrated Probabilistic Risk Assessment (IPRA) model (van der Voet & Slob, 2007). In MCRA 8.2, the module has been generalized for cumulative
assessments (as described in van der Voet et al., 2009). Further, the results of a cumulative IPRA are plotted both in an Individual Margin of Exposure (IMoE) plot (Figure E, van der Voet et al., 2009), and, in line with the ideas put forward in the RISK21 project (Pastoor et al., 2014; Embry et al., 2014; Moretto et al., In press) in a hazard vs. exposure plot (Figure F).
7. Multiple-project calculations in MCRA
MCRA has been updated to allow batch calculations over multiple countries through the concept of multi-projects. This document will elaborate on the implementation details of the multi-project concept.
Background
In MCRA, assessments are performed, defined projects. Within a project, data sources can be combined into a data source configuration that defines the assessment data. The assessment can be configured to create multiple outputs per project. Hence, assessments can be (re-)run
using varying settings and data. However, for some scenarios, this project mechanism is too limited.
Figure E. Individual Margin of Exposure (IMoE) plot. Copied from van der Voet et al. (2009).
Figure F. Example of MCRA hazard vs. exposure plot for multiple chemicals. Distribution of Individual Margin of Exposure (IMoE) shown as P5-P95 plotted on diagonal lines through the points (P95(IExp), CED/100)
Consider, for instance, a survey-loop, in which we want to run the same type of exposure assessment (i.e., using the same settings) and the same occurrence data for different food consumption surveys (e.g., the per country surveys of the EU countries). In this case, it is convenient to have one project per country, in which the settings are the same and the data source configurations only differ regarding the consumption data. Manually creating and running these projects one-by-one involves many steps, is tedious and error-prone. Moreover, it is not so much the per-country results that are of interest, but rather a combined overview. Another example is the scenario in which multiple assessments for the same compiled data source are performed, using different modelling choices. In this case, it would be convenient to store these settings configurations in separate projects, and have the ability to compare the results.
For scenarios like the examples above, the concept of multi-projects offers a practical solution. Based on the two examples above, the following types of multi-projects can be distinguished:
1. Multiple data sources, single settings: This is the scenario in which the same assessment is performed using different data sources. The multi-survey loop will be the most common type for this scenario.
2. Single data source, multiple settings: This is the scenario in which multiple assessment configurations are run using on the same data source.
Below we focus on the first type of multi-project assessments and present its implementation in MCRA. The focus is on this type of multi-project assessment, because the multi-survey scenario is the scenario for which the need is most evident.
Concept and implementation
The implementation consists of three parts:
• Preparing a multi-project, which is a set of projects with different consumption data (e.g. from multiple countries), and all the other data (e.g. concentration) and model settings (e.g. chronic exposure assessment) are the same.
• Running a batch job including all selected individual projects. • Viewing and reporting of the combined results.
Batch-creation
The most important feature of a multi-project system is that it should create a multi-project in one go. The current implementation adopts the mechanism of batch-creation by using a template project. Within MCRA, batch creation of a multiple data source project group can be
accomplished using the create data source loop option. The first step for the user is to create and configure a so-called template project. This project should be fully specified with all settings specified as they are desired in the loop. When this is done, the option Create datasource
loop can be used to create a number of sub-projects that share the
same template, but differ in the data source configuration. A popup apears in which the user needs to specify the overall tag, an optional project prefix string that will be added to the start of the new
sub-project names of the multi-sub-project group, and an overall description can be set for the sub-projects.
Next, the data groups and the data sources should be selected over which the data source configuration should be looped. E.g., for a multi-survey loop, the data group that should be varied is the consumptions group and the data sources should be the ones containing the surveys for the different countries. Note that for the other data groups in the multi-survey loop (i.e., those that were not selected), the data sources from the template project are used.
After having selected the data sources and data groups that should be varied, an overview of the sub-projects that are to be created is shown. Pressing create will start the creation of this batch project.
For each of the created sub-projects, the create action involves: cloning of the original project, reconfiguring the data sources of the
sub-projects, and checking and re-initialization of the data dependent settings.
Batch-opening/editing
After creation of a multi-project, the project group can be opened from the project browser. Using the search-box on the top left, the project list can be filtered by name (e.g., using the specified prefix of the multi-project), all projects of the multi-project can be selected and opened.
The action of batch opening the projects of a multi-project group will open the project comparison panel and render an additional projects
comparison box in the project pane of MCRA. This comparison box
allows the user to easily switch between the opened projects (and edit individual settings of sub-projects.
Note that this mechanism is very flexible. It allows the user to change everything about the sub-projects of a multi-project group. Also, this batch open option can be applied to simultaneously open other (related) projects that may not have been created as multi-project sub-projects. It would also be convenient to have the option to change overall settings in one go. However, such a mechanism is currently not implemented because of the complexity of this feature. The main difficulty here is that this introduces the question which settings should the same for all sub-projects, and which settings should be sub-project specific.
Batch runs
An essential feature is the possibility to start a batch run of all/some projects within a multi-project in a single action. This functionality is offered from the project comparison panel. Select the projects that should be run, and select the action run batch in the action list to queue assessment runs for these projects.
Note that within this implementation, a batch run of a multi-project is in fact a batch run that consists of separate runs of the individual projects of the selected batch.
At present, there is no feedback about whether or not the projects are running. A nice addition would be to show combined run-progress in the project comparison panel.
Multi-projects output
The projects of a multi-project group may contain multiple outputs. Per project, one output can be assigned as default output. These outputs are used in combined overviews of the multi-project group.
There are two different ways to look at the joint outputs of the projects in a multi-project: 1) comparison of the default outputs, and 2)
combined default outputs. These two options can be selected in a similar way as starting a batch job. That is, select them in the project
comparison panel and select the appropriate action in the action list. Comparison of the default outputs
In case of comparison of the default outputs, we focus on the (original) outputs of the projects within the multi-project, yet have the ability to switch between these outputs in order to compare output sections.
8. Tiered approaches
The final EuroMix Toolbox is intended to implement a variety of tiered approaches, both with respect to data and models. In MCRA 8.2, a few examples have been incorporated.
Hazard doses
The higher-tier approach used in probabilistic approaches, such as the IPRA module of MCRA (van der Voet & Slob, 2007), is to estimate a benchmark dose (BMD) or critical effect dose (CED) from dose-response data, together with a distribution describing the uncertainty of the estimate (Slob, 2002). At a lower tier, the dose-response data are not available but point estimates are used, of BMD, of CED or of other points of departure, such as the No Observed Adverse Effect Level (NOAEL) or No Observed Effect Level (NOEL). Without any appropriate data for the compound except its chemical structure, a fall-back is possible to TTC x assessment factor (AF), which is the Threshold of Toxicological Concern (TTC) multiplied by AF, for which the traditional value is 100.
In MCRA, the term ‘Hazard dose’ is used, which is equated, depending on the tier chosen, to CED, NOAEL or TTC x AF. The tier can be chosen overall, or per compound.
Exposure
The higher-tier approach used in probabilistic assessments is to estimate for all foods the consumption distribution and the occurrence
integration. If no data are available for estimating a distribution with good precision, a lower-tier approach is to use only the mean (or other point estimate). This can be applied at the consumption side or the occurrence side or both, leading to various lower-tier approaches. In the case two point estimates are used, the exposure estimate itself is just a single value (‘Dietary exposure point estimates’ tier).
Within the limitations of a given exposure model, the precise tier is further characterised by a list of settings, e.g. non-detect imputation by 0, 0.5LOR or LOR, use of processing factors yes/no, unit variability model, etc.