RIVM report 330310001/2006
Validation and comparison of methods for enumeration of faecal coliforms and Escherichia coli in bivalve molluscs
K.A. Mooijman, M. Poelman1, H. Stegeman1, C. Warmerdam1, P.F.M.Teunis and
A.M. de Roda Husman
This report contains an erratum (red colour) on page 13 d.d. 9-07-2007
Contact:
K.A. Mooijman
Microbiological Laboratory for Health Protection kirsten.mooijman@rivm.nl
1: Institute of Food Safety (RIKILT), Wageningen UR, the Netherlands
This investigation has been performed by the Institute of Food Safety (RIKILT), Wageningen UR, the Netherlands and within the framework of RIVM project V/330310/05/TW by the Dutch National Reference Laboratory for Bivalve molluscs
Abstract
Validation and comparison of methods for enumeration of faecal coliforms and Escherichia coli in bivalve molluscs
The main result of the validation study to show the equivalence of two methods for the enumeration of faecal coliforms in bivalve molluscs is that the plate count method on Mac Conkey agar was indeed found to be equivalent to the MPN method. Meaning that the Netherlands fulfilled the demands as stated in Council Directive 91/492/EC.
The quality requirements of bivalve molluscs, intended for human consumption, are laid down in European legislation. One of the requirements of Council Directive 91/492/EC is that bivalve molluscs must contain less than 300 faecal coliforms or less than 230
Escherichia coli per 100 g mollusc flesh and intravalvular liquid. According to this Directive,
the microbiological analyses should be performed with a Most Probable number (MPN) method, ‘or any other bacteriological procedure shown to be of equivalent accuracy’. Up to 2005, the Netherlands preferred a plate count method on Mac Conkey agar. To meet the requirements it was necessary to perform a national validation study. Additional to this validation study, four procedures for the enumeration of Escherichia coli were compared. This comparison was performed as in the new European Regulation 854/2004 the quality of bivalve molluscs is only based on the number of Escherichia coli and not longer on faecal coliforms. The conclusion from this comparison study is that a plate count method can be considered as a possible alternative method for the newly prescribed MPN method for the enumeration of Escherichia coli in bivalve molluscs.
Key words: Bivalve molluscs, faecal coliforms, Escherichia coli, validation study, comparison of methods.
Rapport in het kort
Validatie en vergelijking van methoden voor de telling van fecale bacteriën van de coligroep en Escherichia coli in tweekleppige weekdieren
Het belangrijkste resultaat van de validatiestudie waarin gelijkwaardigheid van twee
methoden voor de telling van fecale bacteriën van de coligroep in tweekleppige weekdieren werd aangetoond, was dat de telplaatmethode op Mac Conkey agar inderdaad gelijkwaardig werd bevonden aan de MPN-methode. Dit betekent dat Nederland voldeed aan de eisen van Richtlijn 91/492/EC.
De kwaliteitseisen van tweekleppige weekdieren, bedoeld voor menselijke consumptie, zijn vastgelegd in Europese wetgeving. Eén van de vereisten van Richtlijn 91/492/EC is dat tweekleppige weekdieren minder dan 300 fecale bacteriën van de coligroep of minder dan 230 Escherichia coli per 100 g weekdiervlees en vocht mogen bevatten. Volgens deze Richtlijn moet de microbiologische analyse uitgevoerd worden met een Meest
Waarschijnlijke Aantal (MPN) methode, ‘of een andere bacteriologische procedure van welke gelijke nauwkeurigheid is aangetoond’. Tot 2005 prefereerde Nederland het gebruik van een telplaatmethode op Mac Conkey agar. Om aan de eisen te voldoen was het nodig om een nationale validatiestudie uit te voeren. Naast deze studie werden ook vier procedures voor de telling van Escherichia coli vergeleken. Deze vergelijking werd gedaan omdat in de nieuwe Europese Verordening 854/2004 de kwaliteit van tweekleppige weekdieren alleen gebaseerd is op het aantal Escherichia coli en niet langer op fecale bacteriën van de coligroep. De conclusie van deze vergelijkingsstudie is dat een telplaatmethode een
mogelijke alternatieve methode kan zijn voor de nieuw voorgeschreven MPN-methode voor de telling van Escherichia coli in tweekleppige weekdieren.
Trefwoorden: Tweekleppige weekdieren, fecale bacteriën van de coligroep, Escherichia coli, validatiestudie, vergelijking van methoden
Contents
Summary 5
List of abbreviations 7
1. Introduction 8
2. Materials and Methods 10
2.1 Sample preparation 10
2.2 Microbiological methods 11
2.2.1 Preparation of primary homogenate 11 2.2.2 Classical MPN (ISO 7251) 11 2.2.3 Donovan MPN (ISO 16649-3) 12 2.2.4 Plating method on TBX (ISO 16649-2) 13 2.2.5 Plating method on Mac Conkey 13
2.3 Statistical analyses 14
3. Results 15
3.1 General 15
3.2 Faecal coliforms (Mac Conkey vs. ISO 7251) 15
3.3 Escherichia coli 17
3.3.1 Mac Conkey vs. ISO 7251 (Classical MPN) 17 3.3.2 Mac Conkey vs. ISO 16649-3 (Donovan MPN) 18 3.3.3 Mac Conkey vs. ISO 16649-2 (TBX) 20 3.3.4 ISO 7251 (Classical MPN) vs. ISO 16649-3 (Donovan MPN) 21 3.3.5 ISO 7251 (Classical MPN) vs. ISO 16649-2 (TBX) 23 3.3.6 ISO 16649-2 (TBX) vs. ISO 16649-3 (Donovan MPN) 24
4. Discussion 26
5. Conclusions 27
Acknowledgements 28
References 29
Annex 1. Media 31
Summary
The quality requirements of bivalve molluscs, intended for human consumption, are laid down in European legislation. One of the requirements of Council Directive 91/492/EC is that bivalve molluscs must contain less than 300 faecal coliforms or less than 230
Escherichia coli per 100 g mollusc flesh and intravalvular liquid. According to this Directive,
the microbiological analyses should be performed with a (five-tube, three dilutions) Most Probable number (MPN) method, ‘or any other bacteriological procedure shown to be of equivalent accuracy’. Up to 2005, the Netherlands preferred a plate count method on Mac Conkey agar. To meet the requirements it was necessary to perform a national validation study, in which the plate count method on Mac Conkey agar was compared to an MPN method which was valid by that time (‘MPN-classical’). Additional to this validation, four procedures for the enumeration of Escherichia coli were compared: MPN-classical (ISO 7251), MPN-Donovan (ISO 16649-3), Mac Conkey plate count (Annex 1) and
TBX-plate count (ISO 16649-2). Fifty shellfish samples with different contamination levels were prepared by contaminating live mussels with different amounts of sewage sludge. Before analyses, the samples were homogenised, after which the homogenate was analysed with the four different methods. The results were statistically analysed according to the procedure as described in ISO 16140 and by using Bland-Altman analysis.
The out come of the analyses is summarised below. Faecal coliforms:
• Mac Conkey (Plate count) vs. ISO 7251 (MPN-classical): not significantly different.
Escherichia coli
• Mac Conkey (Plate count) vs. ISO 7251 (MPN-classical): differences on the boundary of significance;
• Mac Conkey (Plate count) vs. ISO 16649-3 (MPN-Donovan): significantly different; • Mac Conkey (Plate count) vs. ISO 16649-2 (Plate count-TBX): differences on the
boundary of significance;
• ISO 7251 (MPN-classical) vs. ISO 16649-3 (MPN-Donovan): not significantly different;
• ISO 7251 (MPN-classical) vs. ISO 16649-2 (Plate count-TBX): not significantly different;
• ISO 16649-2 (Plate count-TBX) vs. ISO 16649-3 (MPN-Donovan): not significantly different.
The results of the validation study show that the method used in the Netherlands (Mac Conkey) is equivalent to the classical MPN method (ISO 7251) for the enumeration of faecal coliforms in bivalve molluscs. This means that the Netherlands fulfilled the demands as stated in Directive 91/492/EC.
In the new legislation (Commission Regulation (EC) 854/2004) the quality of bivalve molluscs is no longer based on the number of faecal coliforms, but on the number of
Escherichia coli. For this, the Mac Conkey method can not be used as it gives significantly
lower results than the prescribed MPN method (ISO 16649-3). Both MPN methods
(ISO 7251 and 16649-3) and the plate count method on TBX (ISO 16649-2) gave equivalent results for the enumeration of Escherichia coli in mussels. Therefore, this study has also shown that the plate count method on TBX (ISO 16649-2) can be considered as a possible alternative method for the prescribed Donovan MPN method (ISO 16649-3) for enumeration of Escherichia coli in bivalve molluscs. For acceptance of alternative methods at
international level, a full validation according to the procedure as described in EN/ISO 16140 is needed.
List of abbreviations
BGLB Brilliant Green Lactose Broth CEN European Committee for Standardization
cfu colony forming units
CRL Community Reference Laboratory EC broth Escherichia coli broth
ISO International Organization for Standardization LTB Lauryl Sulphate Tryptose broth
MMGB Mineral Modified Glutamate Broth
MPN Most Probable Number
NRL National Reference Laboratory
PCR Polymerase Chain Reaction
PS Peptone saline solution
RIKILT Institute of Food Safety
RIVM National Institute for Public Health and the Environment RIVO Netherlands Institute for Fisheries Research
RSV RIKILT Standaard Voorschrift (RIKILT Standard Operation Procedure)
1.
Introduction
Council Directive 91/492/EC (1991) prescribes an MPN-method for the enumeration of faecal coliforms or Escherichia coli for the classification of bivalve molluscs production areas. This MPN method is described in general terms. No reference is made to a standard method, like described by ISO or CEN. The Directive approves the usage of alternative methods when ‘shown to be of equivalent accuracy’. Many alternative methods (e.g. plate count methods, impedance methods) are available for the analysis of the indicator bacteria faecal coliforms and Escherichia coli. Since speed and reduction of labour are important issues for financial and legislative reasons, several EU Member States prefer other methods than the MPN method. However, not all methods are validated for bivalve molluscs.
In the Netherlands, a plate count method on Mac Conkey agar for the enumeration of faecal coliforms has been used for the classification of shellfish production area’s since the eighties. The method was validated at that time. However, the results were not published and at present not retrievable. Therefore a proper validation of the Mac Conkey plate count method against the (by that time) prescribed MPN method (MPN-classical) was required to verify the legitimacy of the method used at national level.
Since 2004 new legislations for, amongst others, bivalve molluscs have been published. These legislations (Commission Regulations (EC) No 853/2004, 854/2004 and 2073/2005) prescribe the enumeration of Escherichia coli by using an MPN method as reference method. The detection of faecal coliforms as prescribed by Directive 91/492/EC has been abandoned. In Commission Regulation (EC) No 2073/2005, a specification of this MPN-method is given, being the MPN method described by Donovan et al. (1998), which is currently described in ISO/TS 16649-3 (Anonymous, 2005). However, it is allowed to use alternative methods, when they are validated against the prescribed MPN method. According to the same
Regulation, the validation studies should follow the procedure as described in EN/ISO 16140, ‘or other internationally accepted similar protocols’.
Since the Netherlands have a shellfish monitoring system, which is based on rapid decisions on opening, closing and declassification of production areas, there is a need for fast and reliable methods. In order to select a proper method, which is fully accepted, different methods were compared to the prescribed methods (MPN-classical and MPN-Donovan).
The main objective of the studies described in this report was the national validation of the Mac Conkey plate count method against the prescribed classical MPN method (ISO 7251) for the enumeration of faecal coliforms in bivalve molluscs, to show the legitimacy of the use of the Mac Conkey plate count method in the Netherlands.
An additional objective was the comparison of methods for the enumeration of Escherichia
coli in bivalve molluscs: the Mac Conkey plate count method, the TBX plate count method
(ISO 16649-2), the classical MPN method (ISO 7251) and the Donovan MPN method (ISO 16649-3).
A summary of the studies as well as the main conclusions were reported to the Dutch Food and Consumer Product Safety Authority in 2005. The finishing of the full report was delayed due to the fact that four staff members involved in the studies at RIKILT and at the RIVM changed jobs or retired since early 2005.
2.
Materials and Methods
2.1
Sample preparation
Mussels (Mytilus edulis) were collected from the estuary the Oosterschelde, the Netherlands from May to October 2004. The mussels were not tested for contamination prior to the experiment. However, the area in which they were collected was classified as Category A according to Council Directive 91/492/EC. Therefore the assumption could be made that the shellfish did not contain faecal coliforms above 300 cfu/ 100 g shellfish meat and moist. After collection, the mussels were stored in a basin with flow-through clean seawater. Since the experiment was performed in a half-year period, mussels with a different lipid
composition could be analysed.
The mussels were artificially contaminated using active sludge derived from the Water Treatment Plant in Waarde (Zeeland, the Netherlands). The active sludge was collected within 12 h prior to contamination of the mussels and stored in the refrigerator (2 °C - 8 °C) until use. The active sludge was estimated to contain 109-1010 Escherichia coli per ml.
Five different rounds of contaminations were performed. For each contamination level, 1 kg of mussels was placed into a polyethylene basket. The basket was placed in a 5 litre bucket containing 2 litre seawater, contaminated with 1 ml to 1 litre of active sludge to achieve different levels of contamination. The accumulation of microorganisms was performed over 6-16 h. In order to keep the mussels as healthy and active as possible, the bucket was aerated (see Picture 1).
Picture 1 Mussel contamination experiment (faecal coliforms and Escherichia coli)
2.2
Microbiological methods
2.2.1 Preparation of primary homogenate
Artificially contaminated mussel were transported to the laboratory on melting ice and examined within 12 h.
Mussels were cleaned under running water and aseptically opened to collect internal meat and moist. Hundred gram of the meat and moist was homogenised in 200 ml peptone saline solution (PS: peptone 1 g/L and NaCl 8.5 g/L) by using a Stomacher homogeniser (1 min). This primary homogenate was further diluted in PS depending on the requirements of the method (see below).
2.2.2 Classical MPN (ISO 7251)
To distinguish the two MPN procedures in this report, they are denoted as classical MPN or MPN-classical (ISO 7251; Anonymous, 1993) and as Donovan MPN or MPN-Donovan (ISO 16649-3; Anonymous, 2005).
The classical MPN method was performed according to ISO 7251 (Anonymous, 1993). The procedure is summarised below. The media used are described in ISO 7251.
Sixty ml of the primary homogenate was diluted in 140 ml PS to obtain a 10-1 dilution of the sample material in PS. This 10-1 dilution was used to prepare 10-2, 10-3, 10-4 and
10-5 dilutions.
Dilutions were inoculated in 5-fold as follows:
0: 10 ml 10-1 dilution in 10 ml double-strength enrichment medium Lauryl Sulphate Tryptose Broth (LTB);
10-1: 1 ml 10-1 dilution in 10 ml single-strength enrichment medium LTB; 10-2: 1 ml 10-2 dilution in 10 ml single-strength enrichment medium LTB; 10-3: 1 ml 10-3 dilution in 10 ml single-strength enrichment medium LTB; 10-4: 1 ml 10-4 dilution in 10 ml single-strength enrichment medium LTB; 10-5: 1 ml 10-5 dilution in 10 ml single-strength enrichment medium LTB.
The tubes were incubated at (37 ± 1) °C and examined for gas production after (24 ± 2) h and after (48 ± 4) h. Tubes in which gas was produced were recorded as positive for the presence of faecal coliforms.
For confirmation of the presence of Escherichia coli, one loopful of broth material from each tube with gas formation was inoculated into a tube containing 10 ml of Escherichia coli (EC) broth. EC broth was incubated at (44 ± 0.5) oC for (48 ± 2) h and checked for the presence of gas production. One loopful of broth material from each positive EC tube was inoculated into a tube containing 5 ml of Tryptone water and incubated at (44 ± 0.5) oC for (24 ± 2) h. After incubation, 1 ml of Kovacs reagent was added to the tube. The appearance of a red circle within 1 minute after addition of the Kovacs reagent indicated a positive indole reaction. Samples showing gas formation in both LTB broth and EC broth and showing a positive indole reaction, were recorded as positive for the presence of Escherichia coli.
The number of positive tubes in each dilution resulted in an MPN code. From this MPN code the Most Probable Number of Escherichia coli and/or faecal coliforms was derived using the 5-fold MPN-tables (De Man, 1983).
2.2.3 Donovan MPN (ISO 16649-3)
The Donovan-MPN method was performed according to ISO 16649-3 (Anonymous, 2005). The procedure is summarised below. The media used are described in ISO 16649-3.
Sixty ml of the primary homogenate was diluted in 140 ml PS to obtain a 10-1 dilution of the sample material in PS. This 10-1 dilution was used to prepare 10-2, 10-3, 10-4 and
10-5 dilutions.
Dilutions were inoculated in 5-fold as follows:
0: 10 ml 10-1 dilution in 10 ml double-strength enrichment medium Mineral Modified Glutamate Broth (MMGB);
10-1: 1 ml 10-1 dilution in 10 ml single-strength enrichment medium MMGB; 10-2: 1 ml 10-2 dilution in 10 ml single-strength enrichment medium MMGB; 10-3: 1 ml 10-3 dilution in 10 ml single-strength enrichment medium MMGB; 10-4: 1 ml 10-4 dilution in 10 ml single-strength enrichment medium MMGB; 10-5: 1 ml 10-5 dilution in 10 ml single-strength enrichment medium MMGB.
After incubation at (37 ± 1) oC for (24 ± 2) h, the MMGB tubes were examined for acid production (yellow coloration)1 and for lactose fermentation (gas production). From each tube showing acid production1, a loopful of material was streaked on a plate containing Tryptone Bile Glucoronic agar (TBX). TBX plates were incubated at (44 ± 1) °C for (21 ± 3) h. The presence of characteristic blue colonies on TBX indicated the presence of
Escherichia coli in the original MMGB tube.
The number of positive tubes in each dilution resulted in an MPN code. From this MPN code the Most Probable Number of Escherichia coli was derived using the 5-fold MPN-tables (De Man, 1983).
2.2.4 Plating method on TBX (ISO 16649-2)
The plating method on Tryptone Bile Glucoronic agar (TBX) was performed according to ISO 16649-2 (Anonymous, 2001). The procedure is summarised below. The media used are described in ISO 16649-2.
Sixty ml of the primary homogenate was diluted in 140 ml PS to obtain a 10-1 dilution of the sample material in PS. This 10-1 dilution was used to prepare 10-2, 10-3, 10-4 and
10-5 dilutions.
Fifteen ml of the primary homogenate was distributed over 8 Petri dishes (each with a diameter of 9 cm). Subsequently, 15 ml of freshly prepared and molten TBX agar was added to each dish. Furthermore, duplicates of 1 ml of the 10-1, 10-2, 10-3, 10-4 and 10-5 dilutions were inoculated into Petri dishes and mixed with molten TBX agar.
After solidification, TBX plates were resuscitated at (37 ± 1) oC for (4 ± 0.5) h, followed by incubation at (44 ± 1) °C for (18 ± 2) h. Typical blue (ß-glucuronidase-positive) colonies were counted and the number of E. coli in the original sample was calculated.
2.2.5 Plating method on Mac Conkey
The plating method on Mac Conkey agar was performed according to an in-house procedure of RIKILT (RSV A0741). The procedure is summarised below.
1 Text amended (in red) on 09-07-2007
Sixty ml of the primary homogenate was diluted in 140 ml PS to obtain a 10-1 dilution of the sample material in PS. This 10-1 dilution was used to prepare 10-2, 10-3, 10-4 and
10-5 dilutions.
Fifteen ml of the primary homogenate was distributed over 8 Petri dishes (each with a diameter of 9 cm). Subsequently, 15 ml of freshly prepared and molten Mac Conkey agar (Annex 1) was added to each dish. Furthermore, duplicates of 1 ml of the 10-1, 10-2, 10-3, 10-4 and 10-5 dilutions were inoculated into Petri dishes and mixed with molten Mac Conkey agar. After solidification, Mac Conkey agar plates were resuscitated at (37 ± 1) °C for (2 ± 0.5) h, followed by incubation at (44 ± 1) °C for (24 ± 2) h. Typical red colonies were counted and the square root of the total number of typical colonies (√n) was confirmed by inoculation in Brilliant Green Lactose Broth (BGLB; Annex 1). Tubes were incubated at (44 ± 1) °C for (24 ± 2) h. Gas production indicated the presence of faecal coliforms. When tubes were also positive for the indole reaction in Tryptone water (see 2.2.2), the presence of Escherichia coli was assumed.
Taking into account the confirmation results, the numbers of faecal coliforms and
Escherichia coli in the original samples were calculated.
2.3
Statistical analyses
The results were analysed following the procedure as described in ISO 16140
(Anonymous, 2003). Additional to the orthogonal regression analysis on the estimated most probable numbers according to ISO 16140, an alternative analysis was performed.
Assuming Poisson distributed numbers of bacteria in the suspended sample, both the plate counts and presence-absence data can be used to estimate most probable numbers and corresponding (95 %) confidence intervals for the numbers of colony forming units (cfu) in all samples. For direct plate counts (ISO 16649-2) and presence absence in serial dilutions (ISO 16649-3) this is straightforward. In case of additional confirmation (Mac Conkey or ISO 7251) an additional binomial probability (for the fraction Escherichia coli) was also estimated. This provides a cfu estimate for each sample, and corresponding confidence intervals, allowing comparison of the error ranges. For equivalence testing of the applied methods, a Bland-Altman analysis (Bland and Altman, 1986) was used for pairwise comparing cfu estimates from all four methods. This involves regression of the difference between two measurements of a sample (as an estimate of their variance) against the sum of the two measurements (as an estimate of its ‘true’ value). Zero offset then indicates
equivalence (‘a slope of 1’), whereas a zero slope of the Bland-Altman graph indicates that the variance of the difference between the two methods is independent of their mean (i.e. the estimated ‘true’ number). This is a very simple procedure, yet provides appropriate
information, whereas orthogonal regression analysis (as required by ISO 16140) is more complicated and may lead to biased slope estimates (Dissanaike and Wang, 2003).
3.
Results
3.1
General
A total of 70 samples of each 100 g of mussel meat and moist, were analysed according to ISO 16649-2 (Plate count-TBX; Anonymous, 2001) and ISO 16649-3 (MPN-Donovan; Anonymous, 2005). Fifty of the samples were also analysed according to ISO 7251 (MPN-classical; Anonymous, 1993) and the plate count method on Mac Conkey.
The relevant raw data for all methods are given in Annex 2.
In the next subchapters the results of the comparisons between the different methods are presented. For each comparison, the results of the orthogonal regression analysis (ISO 16140) and the Bland-Altman analysis are summarised. For each comparison a figure is presented in which the Log10 values found with one method are plotted against the Log10 values found with another method. In these figures the 95 % confidence intervals per result and per method are indicated with small lines (based on the assumption that the results are Poisson
distributed). For each comparison the results of the Bland-Altman analysis are also summarised in a figure.
3.2
Faecal coliforms (Mac Conkey vs. ISO 7251)
For the faecal coliforms a comparison of the results found with plating method Mac Conkey and with the classical MPN method ISO 7251 was made. Results are summarised in Figures 1 and 2. Figure 1 shows (from the 95 % confidence intervals) that in general the variation within results is higher for the MPN method (ISO 7251). However, for the lower numbers the variation within results becomes comparable for both methods. Furthermore, this figure shows that with ISO 7251 somewhat higher numbers were found compared to the Mac Conkey counts. The figure derived from the Bland-Altman analysis (Figure 2) shows the same. However, both the orthogonal regression analysis and the Bland-Altman analysis showed that the differences between the two methods were not significant (see below).
Results statistical analyses
Orthogonal regression analysis (ISO 16140):
• Slope = 1.010 (not significantly different from 1) • Intercept = 0.350 (not significantly different from 0)
Bland-Altman analysis:
• Slope = -0.005, p = 0.84 (not significant) • Offset = -0.347, p = 0.09 (not significant)
2 3 4 5 6 7Mac Conkey 2 3 4 5 6 7 ISO 7251
Figure 1 Faecal coliforms: Log10 cfu found on Mac Conkey agar plotted against
Log10 cfu found with MPN method ISO 7251. Lines indicate the 95 %
confidence intervals within a result found with a method.
6 8 10 1 0.75 0.5 0.25 0.25 0.5
Figure 2 Faecal coliforms: Bland-Altman analysis of results found with Mac Conkey agar and found with MPN method ISO 7251. On the X-axis the sum of the results found with both methods are indicated, on the Y-axis the differences between the results found with both methods are indicated.
3.3
Escherichia coli
3.3.1 Mac Conkey vs. ISO 7251 (Classical MPN)
The results found with Mac Conkey agar plates and with the MPN method ISO 7251
(classical MPN) for enumeration of Escherichia coli are summarised in Figures 3 and 4. The variation within results is comparable for both methods (Figure 3). Similar to the results of the faecal coliforms, the numbers of Escherichia coli found with ISO 7251 were higher than the counts found with Mac Conkey agar. This is also reflected in the results of the Bland-Altman test (Figure 4). The differences were on the boundary of significance (see below).
Results statistical analyses
Orthogonal regression analysis (ISO 16140):
• Slope = 0.957 (not significantly different from 1) • Intercept = 0.401 (just significantly different from 0) Bland-Altman analysis:
• Slope = 0.025, p = 0.43 (not significant) • Offset = -0.42, p = 0.06 (just significant)
2 3 4 5 6 7Mac Conkey 2 3 4 5 6 7 ISO 7251
Figure 3 Escherichia coli: Log10 cfu found on Mac Conkey agar plotted against
Log10 cfu found with MPN method ISO 7251. Lines indicate the 95 %
6 8 10
1 0.5 0.5 1
Figure 4 Escherichia coli: Bland-Altman analysis of results found with Mac Conkey agar and found with MPN method ISO 7251. On the X-axis the sum of the results found with both methods are indicated, on the Y-axis the differences between the results found with both methods are indicated.
3.3.2 Mac Conkey vs. ISO 16649-3 (Donovan MPN)
The results found with Mac Conkey agar plates and with the MPN method ISO 16649-3 (Donovan MPN) for Escherichia coli are summarised in Figures 5 and 6. In general the variation within results is higher for the Donovan MPN method (ISO 16649-3), except for the lower counts where the variation within results of both methods becomes comparable
(Figure 5).
Significantly higher results were found with the Donovan MPN method when compared to the results found on Mac Conkey agar.
Results statistical analyses
Orthogonal regression analysis (ISO 16140):
• Slope = 0.938 (not significantly different from 1) • Intercept = 0.651 (significantly different from 0) Bland-Altman analysis:
• Slope = -0.03, p = 0.23 (not significant) • Offset = -0.68, p = 0.002 (significant)
2 3 4 5 6 7Mac Conkey 2 3 4 5 6 7 ISO 16649 3
Figure 5 Escherichia coli: Log10 cfu found on Mac Conkey agar plotted against
Log10 cfu found with MPN method ISO 16649-3 (Donovan). Lines indicate the
95 % confidence intervals within a result found with a method.
6 8 10
1 0.5 0.5
Figure 6 Escherichia coli: Bland-Altman analysis of results found with Mac Conkey agar and found with MPN method ISO 16649-3 (Donovan). On the X-axis the sum of the results found with both methods are indicated, on the Y-axis the differences between the results found with both methods are indicated.
3.3.3 Mac Conkey vs. ISO 16649-2 (TBX)
The results found with Mac Conkey agar plates and with the plating method on TBX (ISO 16649-2) for Escherichia coli are summarised in Figures 7 and 8.
The variation within results is higher for the results found with Mac Conkey than with TBX (Figure 7).
The results found with TBX are somewhat higher than the results found with Mac Conkey agar, but just on the boundary of significance.
Results statistical analyses
Orthogonal regression analysis (ISO 16140):
• Slope = 1.021 (not significantly different from 1) • Intercept = -0.305 (just significantly different from 0) Bland-Altman analysis:
• Slope = -0.01, p = 0.58 (not significant) • Offset = 0.303, p = 0.037 (significant) 2 3 4 5 6 7ISO 16649 2 2 3 4 5 6 7 Mac Conkey
Figure 7 Escherichia coli: Log10 cfu found on Mac Conkey agar plotted against
Log10 cfu found with plating method ISO 16649-2 (TBX). Lines indicate the
5 6 7 8 9 10 11 0.2 0.2 0.4 0.6 0.8 1
Figure 8 Escherichia coli: Bland-Altman analysis of results found with Mac Conkey agar and found with plating method ISO 16649-2 (TBX). On the X-axis the sum of the results found with both methods are indicated, on the Y-axis the differences between the results found with both methods are indicated.
3.3.4 ISO 7251 (Classical MPN) vs. ISO 16649-3 (Donovan MPN)
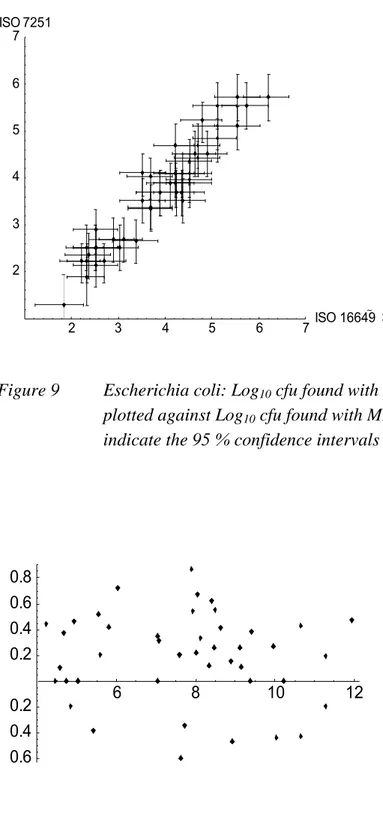
The results found with the two MPN techniques (ISO 7251 and ISO 16649-3) forEscherichia coli are summarised in Figures 9 and 10. With both MPN methods comparable
results were obtained. The variation within results was also comparable.
Results statistical analyses
Orthogonal regression analysis (ISO 16140):
• Slope = 1.021 (not significantly different from 1) • Intercept = -0.264 (not significantly different from 0) Bland-Altman analysis:
• Slope = -0.01, p = 0.67 (not significant) • Offset = 0.263, p = 0.182 (not significant)
2 3 4 5 6 7ISO 16649 3 2 3 4 5 6 7 ISO 7251
Figure 9 Escherichia coli: Log10 cfu found with MPN method ISO 16649-3 (Donovan)
plotted against Log10 cfu found with MPN method ISO 7251 (classical). Lines
indicate the 95 % confidence intervals within a result found with a method.
6 8 10 12 0.6 0.4 0.2 0.2 0.4 0.6 0.8
Figure 10 Escherichia coli: Bland-Altman analysis of results found with MPN method ISO 16649-3 (Donovan) and found with MPN method ISO 7251 (classical). On the X-axis the sum of the results found with both methods are indicated, on the Y-axis the differences between the results found with both methods are indicated.
3.3.5 ISO 7251 (Classical MPN) vs. ISO 16649-2 (TBX)
The results found with the classical MPN method (ISO 7251) and with the plating method on TBX (ISO 16649-2) for Escherichia coli are summarised in Figures 11 and 12. With both methods comparable results were obtained. In general the variation within results is higher for the MPN method (ISO 7251), except for the lower counts where the variation within results of both methods becomes comparable (Figure 11).
Results statistical analyses
Orthogonal regression analysis (ISO 16140):
• Slope = 0.977 (not significantly different from 1) • Intercept = 0.109 (not significantly different from 0) Bland-Altman analysis:
• Slope = 0.01, p = 0.63 (not significant) • Offset = -0.11, p = 0.563 (not significant)
2 3 4 5 6 7ISO 16649 2 2 3 4 5 6 7 ISO 7251
Figure 11 Escherichia coli: Log10 cfu found with plating method ISO 16649-2 (TBX)
plotted against Log10 cfu found with MPN method ISO 7251. Lines indicate
5 6 7 8 9 10 11 0.5
0.5 1
Figure 12 Escherichia coli: Bland-Altman analysis of results found with plating method ISO 16649-2 (TBX) and found with MPN method ISO 7251. On the X-axis the sum of the results found with both methods are indicated, on the Y-axis the differences between the results found with both methods are indicated.
3.3.6 ISO 16649-2 (TBX) vs. ISO 16649-3 (Donovan MPN)
The results found with the plating method on TBX (ISO 16649-2) and the Donovan MPN method (ISO 16649-3) for Escherichia coli are summarised in Figures 13 and 14. With both methods comparable results were obtained. In general the variation within results is higher for the MPN method (ISO 16649-3), except for the lower counts where the variation within results of both methods becomes comparable (Figure 13).
Results statistical analyses
Orthogonal regression analysis (ISO 16140):
• Slope = 0.979 (not significantly different from 1) • Intercept = 0.244 (not significantly different from 0) Bland-Altman analysis:
• Slope = 0.01, p = 0.57 (not significant) • Offset = -0.24, p = 0.08 (not significant)
2 3 4 5 6 7ISO 16649 2 2 3 4 5 6 7 ISO 16649 3
Figure 13 Escherichia coli: Log10 cfu found with plating method ISO 16649-2 (TBX)
plotted against Log10 cfu found with MPN method ISO 16649-3 (Donovan).
Lines indicate the 95 % confidence intervals within a result found with a method.
5 6 7 8 9 10 11
0.5 0.5 1
Figure 14 Escherichia coli: Bland-Altman analysis of results found with plating method ISO 16649-2 (TBX) and found with MPN method ISO 16649-3 (Donovan). On the X-axis the sum of the results found with both methods are indicated, on the Y-axis the differences between the results found with both methods are
4.
Discussion
The quality of the bivalve molluscs production areas has traditionally been based on the number of faecal coliforms. Although Directive 91/492/EC prescribed the use of an MPN method it also allowed other methods if properly validated. Up to 2005 a plating method on Mac Conkey agar was used for the enumeration of faecal coliforms in bivalve molluscs in the Netherlands. The national validation study has shown that the plate count method on Mac Conkey agar is not significantly different from the (classical) MPN method which is described in ISO 7251 and suggested in Directive 91/492/EC.
In the new legislations (Commission Regulations (EC) No. 853/2004, 854/2004 and 2073/2005) the quality of bivalve molluscs is not longer based on the number of faecal coliforms, but on the number of Escherichia coli. The new Regulations describe again an MPN method for the enumeration of Escherichia coli.
The comparison studies of the four methods for enumeration of Escherichia coli showed in general high variation within results for the MPN methods (to be seen in larger 95 % confidence intervals). This is not an unexpected result as an MPN result is not based on a direct count but on a combination of positive results found with dilutions of the initial sample. At lower counts the variation in results between the MPN methods and the plate count methods became comparable. This is caused by a higher variation in results of plate count methods at lower numbers.
The results of the comparison studies showed that the Mac Conkey agar method is not an acceptable method for the enumeration of Escherichia coli in mussels as it gives significantly lower results than the presently prescribed MPN method (ISO 16649-3). Both MPN methods (ISO 7251 and 16649-3) and the plate count method on TBX (ISO 16649-2) gave equivalent results for the enumeration of Escherichia coli in mussels. Therefore, this study has also shown that the plate count method on TBX (ISO 16649-2) can be considered as a possible alternative method for the prescribed Donovan MPN method (ISO 16649-3) for enumeration of Escherichia coli in bivalve molluscs. For acceptance of alternative methods at
international level, a full validation according to the procedure as described in EN/ISO 16140 is needed.
5.
Conclusions
The national validation study has shown that the plate count method on Mac Conkey agar for the enumeration of faecal coliforms in bivalve molluscs was not significantly different from the classical MPN method (ISO 7251). Therefore, it can be concluded that the Netherlands have checked the quality of their shellfish production areas in compliance with Directive 91/492/EC.
From the comparisons of the four methods for enumeration of Escherichia coli in mussels the following conclusions can be drawn:
• Mac Conkey (Plate count) vs. ISO 7251 (MPN-classical): differences on the boundary of significance;
• Mac Conkey (Plate count) vs. ISO 16649-3 (MPN-Donovan): significantly different; • Mac Conkey (Plate count) vs. ISO 16649-2 (Plate count-TBX): differences on the
boundary of significance;
• ISO 7251 (MPN-classical) vs. ISO 16649-3 (MPN-Donovan): not significantly different; • ISO 7251 (MPN-classical) vs. ISO 16649-2 (Plate count-TBX): not significantly
different;
• ISO 16649-2 (Plate count-TBX) vs. ISO 16649-3 (MPN-Donovan): not significantly different.
Acknowledgements
The authors thank Wendy van Overbeek (RIKILT) and Ad van Gool (RIVO) for excellent technical assistance and Wilma Jacobs-Reitsma (RIKILT) and Ciska Schets (RIVM) for critical reading of the report.
References
Anonymous, ISO 7251, 1993 (revised in 2005). Microbiology – General guidance for enumeration of presumptive Escherichia coli - Most probable number technique. International Organisation for Standardisation, Geneve, Switzerland.
Anonymous, ISO 16140, 2003. Microbiology of food and animal feeding stuffs - Protocol for the validation of alternative methods. International Organisation for Standardisation, Geneve, Switzerland.
Anonymous, ISO 16649-2, 2001. Microbiology of food and animal feeding stuffs -
Horizontal method for the enumeration of β-glucuronidase-positive Escherichia coli - Part 2: Colony-count technique at 44 °C using
5-bromo-4-chloro-3-indolyl-beta-D-glucuronide. International Organisation for Standardisation, Geneve, Switzerland.
Anonymous, ISO/TS 16649-3:2005, Microbiology of food and animal feeding stuffs - Horizontal method for the enumeration of β-glucuronidase-positive Escherichia coli - Part 3: Most probable number technique using
5-bromo-4-chloro-3-indolyl-beta-D-glucuronide. International Organisation for Standardisation, Geneve, Switzerland.
Bland JM and Altman DG, 1986. Statistical methods for assessing agreement between two methods of clinical measurement. The Lancet 1986, 8476, 307-310.
Commission Regulation (EC) No 853/2004, 29 April 2004, laying down specific hygiene rules for food of animal origin. Official Journal L139, 30/04/2004, P. 55-205.
Commission Regulation (EC) No 854/2004, 29 April 2004, laying down specific rules for the organisation of official controls on products of animal origin intended for human
consumption.. Official Journal L226, 25/06/2004, P. 83-127.
Commission Regulation (EC) No 2073/2005, 15 November 2005, on microbiological criteria for food stuffs. Official Journal L338, 22/12/2005, P. 1-26.
Council Directive 91/492/EEC, 15 July 1991, laying down the health conditions for the production and the placing on the market of live bivalve molluscs. Official Journal L268, 24/09/1991, P. 1-14.
Dissanaike G and Wang S, 2003. A critical examination of orthogonal regression. Social Science Research Network, Electronic Paper No. 407560
(http://ssrn.com/abstract=407560)
Donovan TJ, Gallacher S, Anrews NJ, Greenwood MH, Graham J, Russell JE, Roberts D and Lee R., 1998. Modification of the standard method used in the United Kingdom for
counting Escherichia coli in live bivalve molluscs. Comm Dis & Public Health 1, 188-196.
RSV A0741. Schaal- en schelpdieren – Bepaling van het aantal faecale coliformen – plaattelling.
Annex 1.
Media
Mac Conkey agar No. 3 (Oxoid CM 115).
Composition
Peptone 20 g
Lactose 10 g
Bile salts No. 3 1.5 g
Sodium Chloride 5 g Neutral red 0.03 g Crystal violet 0.001 g Agar 15 g Water 1000 ml Preparation
Suspend 51.5 gram in 1 litre of distilled water. Bring to the boil to dissolve completely and sterilise at 121 °C for 15 minutes. Cool down to 47 °C before use. The pH should be 7.1 ± 0.2 (at room temperature).
Brilliant Green Lactose Broth (BGLB)
Composition
Peptone 10 g
Lactose 10 g
Ox Bile (dehydrated) 20 g
Brilliant-green (0.1 % by mass aqueous solution) 13 ml
Water to 1000 ml
Preparation
Dissolve the peptone in 500 ml of distilled water. Add the 20 g of dehydrated ox bile dissolved in 200 ml distilled water. This solution should have a pH between 7.0 and 7.5. Make up to approximately 975 ml with distilled water. Add the lactose and adjust the pH to 7.4. Add the Brilliant-green solution and make up to 1000 ml with distilled water. Distribute 5 ml volumes in test tubes containing inverted inner fermentation (Durham) tubes and autoclave at 115 °C for 10 min.
Annex 2.
Raw data
Table A.2.1 Results faecal coliforms and E.coli found with plating method MacConkey
Sample code
No. of typical
colonies1 Dilution factor 100g cfu /
No. of tubes pos. for faecal coliforms No. of tubes pos. for E. coli Confirmed Faecal coliforms cfu / 100 g Confirmed E.coli cfu / 100 g M1 426 20 8520 4/15 0/15 2272 <20 M2 173 20 3460 4/15 0/15 923 <20 M3 50 20 1000 0/15 0/15 <20 <20 M4 45 20 900 0/15 0/15 <20 <20 M5 2 20 40 1/2 1/2 20 20 M6 8 20 160 7/8 7/8 140 140 M7 35 20 700 15/15 12/15 700 560 M8 1207 20 24140 15/15 14/15 24140 22531 M9 80 20 1600 14/15 13/15 1493 1387 M10 16 20 320 11/15 6/15 235 128 M11 9 20 180 6/9 5/9 120 100 M12 55 20 1100 12/15 6/15 880 440 M13 15 20 300 9/15 6/15 180 120 M14 11 20 220 7/11 4/11 140 80 M15 17 20 340 5/15 3/15 113 68 M16 16 20 320 8/15 6/15 171 128 M17 23 20 460 11/15 5/15 337 153 M18 3 20 60 2/3 1/3 40 20 M19 5 20 100 4/5 1/5 80 20 M20 32 20 640 11/15 3/15 469 128 M21 54 20 1080 11/15 6/15 792 432 M22 269 20 5380 15/15 8/15 5380 2869 M23 224 20 4480 13/15 4/15 3883 1195 M24 472 20 9440 15/15 10/15 9440 6293 M25 709 20 14180 13/15 10/15 12289 9453 M26 312 20 6240 14/15 9/15 5824 3744 M27 67 20 1340 13/15 9/15 1161 804 M28 457 20 9140 11/15 6/15 6703 3656 M29 133 20 2660 11/15 6/15 1951 1064 M30 714 20 14280 3/4 3/4 10710 10710 M31 20-13 1000 16500 5/5 5/5 16500 16500 M32 39-44 1000 41500 7/7 7/7 41500 41500 M33 93-121 1000 10700 11/11 9/11 107000 87545 M34 61-80 1000 70500 8/9 7/9 62667 54833 M35 36-34 1000 35000 5/6 3/6 29167 17500 M36 32-19 10000 255000 5/6 4/6 212500 170000 M37 20-16 10000 180000 3/5 3/5 108000 108000 M38 19-36 10000 27500 6/6 4/6 275000 183333 M39 184-232 1000 208000 16/16 12/16 208000 156000 M40 22-17 1000 19500 4/5 2/5 15600 7800 1: Where two counts are given (xx-yy) duplicate counts were made
Table A.2. continued
Sample code
No. of typical
colonies1 Dilution factor 100g cfu /
No. of tubes pos. for faecal coliforms No. of tubes pos. for E. coli Confirmed Faecal coliforms cfu / 100 g Confirmed E.coli cfu / 100 g M41 24-16 1000 20000 4/5 3/5 16000 12000 M42 543 20 10860 8/10 6/10 8688 6516 M43 122-107 1000 114500 10/11 9/11 104091 103050 M44 1012 20 20240 10/12 9/12 16867 15180 M45 24-28 1000 26000 5/6 4/6 21667 17334 M46 31-32 1000 31500 4/6 3/6 21000 15750 M47 29-40 1000 34500 6/6 3/6 34500 17250 M48 43-23 1000 22500 5/6 2/6 27500 11000 M49 970 20 19406 11/12 7/12 17789 11320 M50 31-29 1000 30000 5/6 4/6 25000 20000 1: Where two counts are given (xx-yy) duplicate counts were made
Table A.2.2 Results faecal coliforms and E.coli found with MPN method ISO 7251
Sample code
Faecal coliforms
MPN-code MPN-code E. coli
Faecal coliforms
cfu / 100 g cfu / 100 g E. coli
M1 000 000 <20 <20 M2 000 000 <20 <20 M3 000 000 <20 <20 M4 000 000 <20 <20 M5 100 100 20 20 M6 320 320 140 140 M7 511 511 460 460 M8 55510 55510 33000 33000 M9 550 550 2400 2400 M10 520 410 490 170 M11 510 510 330 330 M12 552 542 5400 2200 M13 530 520 790 490 M14 420 410 220 170 M15 540 510 1300 330 M16 510 500 330 230 M17 530 530 790 790 M18 410 300 170 78 M19 520 410 490 170 M20 542 510 2200 330 M21 541 520 1700 490 M22 5530 5520 7900 4900 M23 5550 5540 24000 13000 M24 5520 5520 4900 4900 M25 55420 55300 22000 7900 M26 55310 55100 11000 3300 M27 5520 5100 4900 330 M28 5540 5520 13000 4900 M29 5520 5510 4900 3300 M30 55530 55520 79000 49000 M31 55410 55400 17000 13000 M32 55531 55521 110000 70000 M33 55552 55541 540000 170000 M34 55550 55540 240000 130000 M35 55550 55540 240000 130000 M36 55552 55551 540000 350000 M37 55552 55552 540000 540000 M38 55554 55552 1600000 540000 M39 55551 55551 350000 350000 M40 55520 55400 49000 13000 M41 55522 55211 94000 9200 M42 55510 55310 33000 11000 M43 55500 55200 24000 4900 M44 55510 55300 33000 7900 M45 55310 55300 11000 7900 M46 55510 55500 33000 24000 M47 55540 55430 130000 27000 M48 55520 55510 49000 33000 M49 55500 55400 24000 13000 M50 55520 55520 49000 49000
Table A.2.3 Results E.coli found with plating method ISO 16649-2 (TBX)
Sample
code No. of typical colonies1 No. of typical colonies 1
on next 10 fold dilution Dilution factor cfu / 100 g E.coli
M1 0 - <20 M2 0 - <20 M3 0 - <20 M4 0 - <20 M5 0 - <20 M6 5 20 100 M7 47 20 940 M8 770 20 15400 M9 64 20 1280 M10 7 20 140 M11 7 20 140 M12 51 20 1020 M13 16 20 320 M14 6 20 120 M15 2 20 40 M16 4 20 80 M17 19 20 380 M18 11 20 220 M19 11 20 220 M20 27 20 540 M21 41 20 820 M22 280 20 5600 M23 195 20 3900 M24 437 20 8740 M25 564 20 11280 M26 263 20 5260 M27 45 20 900 M28 263 20 5260 M29 110 20 2200 M30 667 20 13340 M31 20-20 1000 20000 M32 55-42 1000 48500 M33 118-103 14-13 1000 113000 M34 113-112 13-7 1000 111000 M35 62-68 1000 65000 M36 22-27 10000 245000 M37 32-45 10000 385000 M38 45-68 10000 565000 M39 24-20 10000 220000 M40 757 20 15140
Table A.2.3 continued
Sample
code No. of typical colonies1 No. of typical colonies 1
on next 10 fold dilution Dilution factor cfu / 100 g E.coli
M41 803 20 16000 M42 314 20 6280 M43 70-98 15-15 1000 90000 M44 698 20 13960 M45 32-32 1000 32000 M46 36-28 1000 32000 M47 44-34 1000 39000 M48 36-30 1000 33000 M49 560 20 11200 M50 32-42 1000 37000 M51 6 20 120 M52 172 20 3440 M53 705 20 14100 M54 822 20 16440 M55 63-61 1000 62000 M56 10 20 200 M57 21 20 420 M58 305 20 6100 M59 750 20 15000 M60 50-60 1000 55000 M60A 6 20 120 M61 3 20 60 M62 18 20 360 M64 126 20 2520 M65 178 20 3560 M66 8 20 160 M67 19 20 380 M68 112 20 2240 M69 781 20 15620 M70 754 20 15080
Table A.2.4 Results E.coli found with MPN method ISO 16649-3 (Donovan)
Sample code MPN-code cfu / 100 g E. coli
M1 000 < 0.18 M2 000 < 0.18 M3 000 <0.18 M4 000 <0.18 M5 210 68 M6 510 330 M7 550 2400 M8 55530 79000 M9 5520 4900 M10 410 170 M11 510 330 M12 5520 4900 M13 530 790 M14 420 220 M15 411 210 M16 500 230 M17 510 330 M18 420 220 M19 520 490 M20 531 1100 M21 540 1300 M22 5530 7900 M23 5510 3300 M24 5541 17000 M25 5540 13000 M26 5550 24000 M27 510 330 M28 5530 7900 M29 5510 3300 M30 55410 17000 M31 55410 17000 M32 55540 130000 M33 55512 63000 M34 55540 130000 M35 55551 350000 M36 55540 130000 M37 55551 350000 M38 55554 1600000 M39 55552 540000 M40 55500 23000
Table A.2.4 continued
Sample code MPN-code cfu / 100 g E. coli
M41 55510 33000 M42 55200 4900 M43 555000 23000 M44 55410 17000 M45 55510 33000 M46 55510 33000 M47 55520 49000 M48 55502 43000 M49 55510 33000 M50 55520 49000 M51 400 110 M52 550 2400 M53 5531 11000 M54 5540 13000 M55 55520 49000 M56 410 160 M57 530 750 M58 5510 3300 M59 5530 7900 M60 55530 79000 M60A 4110 210 M61 200 45 M62 540 1300 M64 540 1300 M65 552 5400 M66 510 330 M67 51010 330 M68 5540 13000 M69 55530 79000 M70 55410 17000