A literature review on safety performance
indicators supporting the control of major
hazards
Colophon
© RIVM 2012
Parts of this publication may be reproduced, provided acknowledgement is given to the 'National Institute for Public Health and the Environment', along with the title and year of publication.
L.J. Bellamy, White Queen
V.M. Sol
Contact:
Henk Jan Manuel
Centre for External Safety
henkjan.manuel@rivm.nl
This investigation has been performed by order and for the account of Ministry of Social Affairs and Employment, within the framework of Seveso III
Abstract
A literature review on safety performance indicators for supporting the control of major hazards
Companies working with large amounts of hazardous substances fall under the Major Accident Risks Decree 1999. These companies must conform to specific requirements to prevent major accidents with serious consequences for man and environment. These companies are regularly visited by regulatory bodies such as the Labour Inspectorate. The inspectorate focuses on the risks to workers and evaluates whether these companies have a safety management system. It is important whether this safety management system is tailored to the risks involved and whether it works well.
Indicators: how well a company manages risks
The RIVM has explored whether it is possible to evaluate the major accident risks of a company based on safety performance indicators. Safety performance indicators are intended to provide information on the safety performance of a company. A set of indicators helps managers and employees of the company to focus on the important risk factors and helps the regulator determine how well the company is managing its risk controls and whether it is improving. Safety performance indicators should be tailor-made when used by a company but will need to be generally applicable, communicable and unambiguous when used by the regulator. Indicators may develop over time, based on experience as to which provide the most effective and efficient information about the safety performance of a company with respect to the potential for a major accident.
Criteria for the development of safety performance indicators
It is recommended to develop indicators based on a list of 30 criteria. For example, an indicator should have a causal link with the risk. In addition, a concrete action on the indicator may be attached, such as improvement interventions. The indicator set should also be sufficient in number and
frequency to be able to identify trends. For the research, the scientific literature as well as guidelines from industry and regulators were explored.
Keywords: safety performance indicators, major hazards, safety management, safety culture
Rapport in het kort
Een literatuuronderzoek naar veiligheidsperformance-indicatoren ter ondersteuning van het toezicht op de beheersing van zware ongevallen
Bedrijven die met grote hoeveelheden gevaarlijke stoffen werken, vallen onder het Besluit risico’s zware ongevallen (BRZO). Deze bedrijven moeten aan specifieke regels voldoen om zware ongevallen met grote gevolgen voor mens en milieu te voorkomen. Daarnaast staan deze bedrijven onder toezicht van o.a.de Inspectie SZW (voorheen de Arbeidsinspectie). De Inspectie richt zich op de risico’s voor werknemers en beoordeelt onder andere of er binnen de
desbetreffende bedrijven een zogeheten veiligheidsbeheerssysteem is. Daarbij is het van belang of dit systeem is toegesneden op de aanwezige risico’s en of het goed werkt.
Indicatoren: hoe goed beheert een bedrijf gevaren
Het RIVM heeft daarom bekeken of het mogelijk is om de veiligheid van een bedrijf te beoordelen op basis van veiligheidsprestatie-indicatoren.
Veiligheidsprestatie-indicatoren zijn bedoeld om informatie te leveren over de veiligheidsprestaties van een bedrijf. Ze kunnen managers en werknemers van het bedrijf helpen om te focussen op de belangrijkste risico’s. Daarnaast kunnen indicatoren de inspectie helpen vast te stellen hoe goed het bedrijf met risico’s omgaat en of dit zonodig verbetert. Indicatoren moeten op maat worden gemaakt als ze worden gebruikt door een bedrijf. Voor de inspectie zijn juist indicatoren nodig die algemeen toepasbaar, communiceerbaar en
ondubbelzinnig zijn, zodat bedrijven met elkaar kunnen worden vergeleken. Indicatoren kunnen zich door de tijd heen ontwikkelen op basis van de
ervaringen met indicatoren die het meest effectief en efficiënt informatie geven over de mogelijkheid op een zwaar ongeval bij een bedrijf.
Criteria voor de ontwikkeling van veiligheidsprestatie-indicatoren
Aanbevolen wordt om indicatoren te ontwikkelen op basis van een lijst van 30 criteria. Zo moet een indicator een oorzakelijk verband hebben met het onderdeel dat daadwerkelijk een risico kan vormen. Daarnaast moet er een concrete actie aan de indicator kunnen worden verbonden, zoals een
verbeteractie. Om trends te kunnen waarnemen is een set van indicatoren nodig die voldoende frequent worden gemeten. Voor het onderzoek is de
wetenschappelijke literatuur onderzocht, evenals richtlijnen van industrie en inspecties.
Trefwoorden: veiligheidsmanagement, veiligheidscultuur, veiligheidsprestatie indicatoren, zware ongevallen
Contents
Summary 7
1 The context for reviewing safety performance indicators 11
2 Purpose of key performance indicators in process safety performance measurement 15
2.1 Introduction 15
2.2 Safety performance measurement 17
2.3 Performance indicators as predictors of safety 19
2.3.1 Event frequencies 19
2.3.2 Performance indicators as alarms 21 2.3.3 Causal links to risk 21
2.3.4 Technical-organisational links 22 2.3.5 Resilience and safe envelope 24
2.3.6 The Rasmussen Drift 26
2.4 SPIs for comparison over time 26
2.5 SPIs for comparison across a set of many organisations 27
2.6 Deciding where and how to take action 27
2.7 Performance indicators as motivators 27 2.8 Part of the problem solving process 28
3 Safety management and safety culture 29
3.1 Safety management system requirements 29
3.2 Accident analysis and safety management causes 29
3.3 Lagging indicators of the regulator 31
3.4 Safety culture 34
3.4.1 Definitions of safety culture 34
3.4.2 Leadership and culture 35
3.4.3 Climate and culture tools 36
3.4.4 Safety improvement programmes 38
4 Guidance on developing SPIs 41
4.1 Available guidance 41
4.2 Types of metrics 41
4.3 Nature of guidance 42
5 Evidence of use of leading safety performance indicators 45
6 Conclusions 49
7 References 53
ANNEX 1: Safety management system requirements of the Seveso II Directive 63 ANNEX 2: Guidance for developing safety performance indicators 65
ANNEX 3: Monitoring system attention points from AVRIM2 77 ANNEX 4: Ten tips to improve safety in the workplace 79
Summary
The Ministry of Social Affairs and Employment commissioned RIVM to develop key performance indicators (KPIs) for safety in the process industry. The purpose of this literature review is to provide a background, based on the referenced literature, for establishing key safety performance indicators in the Netherlands and which could be used by the regulator for Major Hazard Control to assess safety management system performance in controlling major hazards. The review concentrates primarily on peer reviewed literature and industry- and regulator-produced guidance. This is not a comprehensive research review but rather focuses on coming up with some points for what is important in a safety indicator system with emphasis on coupling with process safety management and major hazard safety performance. In this respect it is fit for purpose rather than an all-embracing coverage of a wide subject area. Details of the
management science background relating to the history and use of key
performance indicators are not included. In the safety world the new challenge is developing leading metrics of safety to predict future performance, rather than only evaluating performance from data on deaths, injuries, spills and releases, the so-called lagging indicators.
Safety indicator systems are developed by companies primarily for the purpose of learning about risk control and its adjustment and improvement through safety management processes. Process safety performance indicator systems are required in order to avoid the forming of management blind spots and stepping outside the boundary of good process safety performance. Their purpose is to provide information on safety performance through the use of measurement of progress towards measureable targets, which are the
operational performance goals. They also fulfil an important communication role in telling stakeholders how well the company appears to be doing in managing the major hazards.
There is already a wealth of guidance on safety performance indicators (e.g. Deltalinqs, HSE, OECD, CCPS) with the suggestion that a well-designed monitoring and improvement system is beneficial and revealing. Scientific research still has to find significant quantitative relationships between methods, metrics and outcomes for major hazards. It is generally agreed that lack of a major accident does not indicate that a plant is safe. For this reason so-called ‘leading’ indicators are sought, these being precursors, ahead of so-called ‘lagging’ indicators, a term which is predominantly used to mean safety outcomes like harm (e.g. fatalities) and loss (e.g. spills). A whole controversy about what is leading and what is lagging has emerged. In effect all indicators are after the fact but the distinction is useful to separate management input indicators from output indicators or activities indicators from outcome indicators or precursors from incidents.
What is safety then? Of course ultimately it is the absence of events which cause harm but if the hazard is present there is always a chance of loss of control. The very low probabilities in major hazard systems with defence-in-depth render the need for more frequent events to be used if safety is to be measured over time. If the regulator is to use indicators as part of the enforcement strategy then these indicators must be aligned to this strategy. High frequency risk sensitive events are therefore a fundamental requirement to give timely information upon which action can be based. Quantitative risk assessment, which is used in the Netherlands, is currently still too generic to accommodate safety management
system inputs to be continuously updated. The safety performance indicators system has to be modelled instead to supplement more static risk evaluation measures. It needs to be tailor-made for a company/site and developed over time as the company learns what indicators are the most effective and efficient to measure in relation to risk. Absence of incidents, or indicators which are always 100% on target or always within tolerances should trigger the search for new indicators, targets and tolerances.
Safety, in the new perspective of indicators, could be represented as a learning and adjustment process whereby the process safety indicator metrics provide feedback for controlling actions that ensure the technical systems remains within the safe envelope of the design. For the regulator these indicators also have to distinguish between the good and the bad in the measured population if it is desirable to use them as safety benchmarks or to learn how to shift the mean of the population in the good direction. KPIs are also sought for providing key information to higher level management and the public.
The basis for most safety performance systems is Reason’s Swiss cheese model of lines of defence or barriers and Heinrich’s famous accident triangle.
Approaches are primarily guidance driven, together with analysis of causes of incidents such as so-called ‘near misses’, the indicators themselves being thought up by workforce teams. Use of new technology can support data collection and aggregation.
Safety culture or climate measurement is barely touched on in indicator
guidance despite being considered important. There is also criticism of the linear accident modelling approaches typically found in safety performance indicator guidance with the development of the idea of ‘resilience’’, an organisation’s ability to recover from deviations and to stay within the safety envelope. How to measure elasticity as a safety performance indicator was not clear. Rasmussen’s concept of ‘drift’ towards the boundary of acceptable safety performance
seemed to have more practical relevance suggesting the need to measure (and halt) developing trends in this direction and the factors which drive them. However no-one is suggesting measuring these potential safety antagonists directly, but only indirectly through the perceptions and attitudes of the workforce as measured with safety climate tools.
A good safety culture is reputedly critical for high hazard operations. It can only be measured, assuming it can be measured at all, by such tangible artefacts of safety culture as the shared belief, attitudes, perceptions, practices and behaviours that affect safety performance of high risk operations. In other words, how people feel about process safety. For example, feeling ‘chronic unease’ in the face of lack of incidents has been identified as a characteristic of high reliability organisations. Safety culture and climate tools have been developed to provide measureable snapshots of attitudes and beliefs through self-report questionnaires. Correlations with injury statistics have been shown and there are rare instances of correlations with technical integrity failures. As a result of the current review 20 aspects are considered important, but not necessarily complete, for the design and operation of a safety performance indicator system:
1. a link (usually causal) to the major hazard (process) risks, with
2. sufficient in number and frequency to be able to identify trends (e.g. quarterly, yearly, three-yearly), including any ‘Rasmussen drift’ effects towards boundaries of safe operation to allow appropriate recovery in time;
3. tailor-made for the company/site;
4. metrics distinguish between good and bad in the population distribution (this also facilitates benchmarking);
5. consideration of published guidance (HSE, CCPS, OECD, API, Deltalinqs, CEFIC etc.);
6. quantitative measureable indicators associated with defined objectives; 7. precursor (prior to loss/harm) indicators of sufficient scope and
sensitivity to give sufficient and timely ‘warning’ of deviations from safe standards of design and operation;
8. precursor indicators on management system inputs to major hazard risk control processes and indicators on related outputs of these processes; 9. evaluation of management inputs, outputs and incidents for
relationships, interactions, causes and major hazard risk potential; 10. specification of indicator tolerances with justification in safe boundaries
of operation and associated with action levels;
11. specification of indicator targets, especially in relation to the objectives of the major accident prevention policy;
12. a selection of KPIs for reporting to the top management;
13. indicators that are actionable, in that there is a connection between the indicator and the actions which should affect it;
14. a reporting culture involving the whole workforce who have responsibilities in the control of major hazards;
15. workforce involvement in indicator development and reporting programmes;
16. a leadership which maintains the reporting culture and which ensures actions are carried out in time;
17. a leadership which positively influences safety culture through
interactions with the workforce, safety improvement (programmes), and measuring the effect on safety attitudes and awareness;
18. consideration given to using metrics that could be sensitive to changes in the external system climate (such as economic pressures, takeovers, new knowledge) and their impact on safety at the plant;
19. indicator review and improvement at least on a yearly basis;
20. use of indicators also by external bodies about their own performance, particularly emergency response organisations. This point has not really been elaborated in the review, but it suffices to say that if they are part of the socio-technical safety system affecting plant then perhaps emergency responders should also be part of the measurement system.
Distilled from the review, a further ten points are considered specifically for the regulator:
21. Leading KPIs should give signals for concern about future safety. 22. Lagging KPIs should show past performance.
23. KPIs should identify degradation in safety performance as early as possible.
24. KPIs should be designed according to the way they are to be used by the regulator.
25. Consideration should be given as to whether indicators can be used standalone.
26. Aligning action levels with KPI measurement should be possible. 27. KPIs should be clearly defined and unambiguous to ensure accurate
communications with stakeholders.
28. KPIs should not be capable of being manipulated.
29. Learning from the use of indicators may require changes in the set of KPIs used or associated action levels over time.
30. Standardisation, e.g. based on number of hours worked, could facilitate comparisons between companies.
1
The context for reviewing safety performance indicators
The Ministry of Social Affairs and Employment commissioned RIVM to develop key performance indicators (KPIs) for safety in the process industry. The purpose of this literature review is to make recommendations, based on the referenced literature, for establishing key safety performance indicators in the Netherlands, and which could be used by the regulator for Major Hazard Control to assess safety management system performance in controlling major hazards. This concerns companies that fall under the European Seveso II Directive (European Council Directive, 1996). The context of the review is the
development of indicators for the purposes of supporting the development of guidelines for these companies and for enforcement by the Dutch regulator. The focus is on indicators of safety management system performance which can predict safety performance, with consideration also to be given to the related subjects of safety culture and leadership.
It is these factors which are now considered important in Major Hazard Control. They have been implicated as causal agents in big accidents over the past two decades, since the Chernobyl accident in 1986 and more recently with the BP Texas City explosion in 2005 where the Baker Panel Report (Baker, 2007) highlighted how BP’s safety indicators failed to indicate the poor level of process safety management which led to the accident.
The current review was undertaken by searching the peer-reviewed literature using specific search criteria associated with safety management, performance , process safety, indicators, loss of containment, leading, lagging and various combinations of these. A list of about 400 articles was obtained and, given the limitations of the study, the most recent and most relevant as could be determined from the abstracts were used. For example, occupational safety performance was not of primary interest. Internet searches were also made where general industry guidance on performance indicators and research reports could be identified and obtained. Contact was also made with academic experts in major hazards and safety culture such as University of Aberdeen Department of Psychology (e.g. Mearns and Flin, 1999), the Health and Safety Laboratory (Sugden, 2011), attendance at a cross-industry safety culture workshop (Network Rail, 2011) and a performance indicators conference focused on industry (CEFIC-EPSC, 2012).
In the current review the terms safety performance indicators (SPIs), and key performance indicators (KPIs) for safety are both used. KPIs are usually linked to a target and are key in helping managers determine if they are on track in relation to goals and objectives and what actions to take. The information is key to the company objectives. However many articles about performance indicators and safety refer simply to safety performance indicators (SPIs) or as process safety performance indicators (PSPIs) to distinguish them from indicators of occupational safety, using the term in the sense of a piece of information that says something about safety performance. Both process safety KPIs and SPIs may be used together in an organisation.
The main points for the review are as follows:
1. The review will inform the design of the enforcement regime concerning KPIs for process safety for Seveso companies. Issues include:
purpose of KPIs for process safety (what and why); types of indicators (metrics);
what is being measured (goals, coverage); the process of selection of indicators (tailoring); tolerances (cue for action);
follow-up, learning, assurance (intervention and improvement); motivation and incentives (drivers).
2. The review will inform the development of guidelines for making company specific process safety performance indicators in the Netherlands for Seveso companies and for developing KPIs for use by the regulator as part of the enforcement regime. This is linked to point 1 since the guidance and
enforcement have to be connected, so the same basic issues apply. Existing guidelines are examined on the basis that a lot of thought from companies and regulators has already gone into their making and common basic principles and experience can be extracted for further consideration. 3. The review only considers current work on researching and developing
safety performance indicators concerned with major hazards. Occupational safety performance indicators work is only of interest if of relevance to major hazards. In that respect work in the area of occupational safety is largely ignored unless the results can be generalised.
4. Industries besides major hazard chemicals that are relevant include the nuclear industry, which already has a history of using performance indicators and examining safety culture. These other industries are examined only in so far as they are considered useful for 1 and 2.
5. Sources of information include peer reviewed journal articles, conference proceedings and currently available guidance and any tools or
questionnaires available.
6. The requirements for a safety management system are currently specified in the European Seveso II Directive (See Annex I). A new area on performance indicators is expected to be in the forthcoming Seveso III. The current review focuses on KPIs for the safety management system with additional consideration of safety culture and leadership issues.
7. Issues with respect to KPI’s, the safety management system and
relationships with culture and leadership are broadly defined and critically addressed within the current review. Use is made as far as possible of previously undertaken reviews by specialists in the area.
8. Finally, the review considers whether there is any evidence that companies are actually using process safety KPIs.
The review is organised as follows:
Chapter 2 addresses the purpose of having indicators.
Chapter 3 looks for evidence of links between safety management, safety culture and safety performance.
Chapter 4 summarises guidance for the industry, supplemented by Annex 2 giving details for selected guidance.
Chapter 5 briefly considers what companies are currently doing in developing key performance indicators.
2
Purpose of key performance indicators in process safety
performance measurement
2.1 Introduction
‘The blast at Chevron in Pembroke was a "tragic incident"’, the prime minister said….Speaking during Prime Minister's Questions on Wednesday, he added: ‘I am sure there will be lessons to learn but as you said it has had a good safety
record and a good safety record in an industry in which there really are some
inherent risks.’ BBC New South West Wales (online) 8 June 2011
The feeling of safety derives from not having accidents. Although the absence of accidents may give a sense of security, it is no guarantee to safety when there are hazards present. Low probability high consequence events that characterise the major hazard industries are, by virtue of being low probability, not regular occurrences. When such events do actually occur they trigger attempts to understand and improve major hazard control. Quantitative risk criteria in the Netherlands (Ale, 2005) give some idea of what low probability means in this context.
Improving process safety means reducing the probability of harmful
consequences from toxic, flammable and explosive hazards. The probability factor cannot, unfortunately, be measured directly. Target zero will never be reached unless the hazard is removed altogether, so absence of an accident is not informative. On the other hand when a major accident actually occurs all kinds of causal factors are identified which could have been better monitored and controlled. As a result, one drive for improvement which has risen in importance over the past decade is the introduction of key performance indicators (KPIs) into the process safety management system.
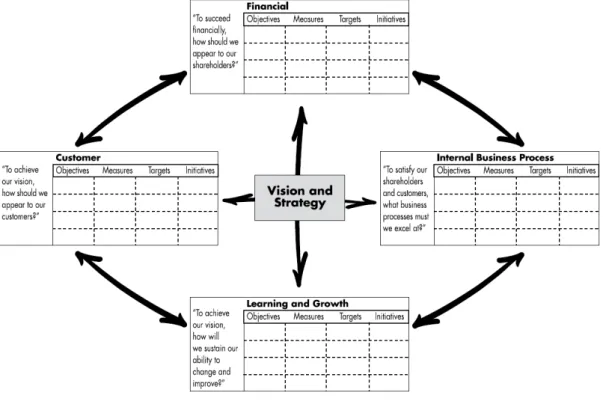
The KPI is a well-known business management term referring to the measures that monitor the performance of key result areas of business activities. KPIs represent a set of measures focusing on those aspects of organisational performance that are the most critical for the success of an organisation. Parmenter (2006) cites the financial turnaround of British Airways in the 1980s, claiming it resulted from the focus on late planes as a KPI. The number of late planes can impact on a number of critical success factors like costs, customer satisfaction, internal business processes and learning and growth. These critical success factors are taken from an approach to business management developed by Kaplan and Norton (1992, 1997) which requires managers to focus on a small number of critical measures (the ‘balanced scorecard’) and takes a goal-directed rather than control-directed approach. The measures are designed to pull people toward the overall vision by whatever actions are necessary rather than trying to specify what those people’s behaviour should be under constantly changing conditions.
Figure 1 The balanced scorecard of KPIs (from Kaplan and Norton, 1996)
KPIs developed for process safety performance could serve similar functions to those developed for realising financial goals:
to help a company monitor and manage its level of safety performance by evaluating its progress towards safety goals;
to give assurance to stakeholders that a plant is being well-managed with respect to major hazards;
to find ways to continuously improve safety.
A set of performance measures will be part of a company’s own general
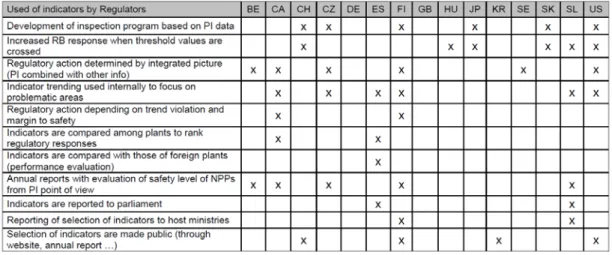
monitoring system, providing intelligence about the major hazard control system and how it is performing. The system has to be part of the company and it should be adapted and improved over time as part of the learning process. From the perspective of the regulator, KPIs could serve a different function, informing on the current and future level of safety for the purpose of planning inspections and interventions. The international Committee on the Safety of Nuclear Installations and Committee on Nuclear Regulatory Activities
(CSNI/CNRA) published a report on this area (OECD, 2006) stating that safety performance indicators alone have no value unless they are to be used for a specific purpose. These uses should be defined. A survey of regulatory bodies showed that the main uses were:
to measure safety performance as a way of judging licensees performance, together with inspection, scrutinising documents,
investigating events, and interviews with personnel and judging whether their systems for managing safety were effective and improving;
to improve their own regulatory activities as a tool for targeting resources;
to communicate about safety with stakeholders.
It was also recognised that nuclear power plants have different needs to regulators and that their performance measurement systems are likely to be larger and deeper than those of regulators. No clear agreement emerged on indicators of safety management and safety culture, although self-assessment and continuous improvement by such plants were central points.
A summary of regulator responses is shown in Figure 2.
Figure 2 Overview of replies about the objectives for the establishment of a regulatory safety performance indicators system in the nuclear industry (OECD, 2006)
The use of experience in the nuclear industry is not necessarily helpful in the current process. In the chemical industry the different manufacturing processes, products, not to mention the possible scenarios that could develop depending on these technologies and chemical properties, compared to the limited processes of the energy sector, is a much wider spectrum to be addressed.
2.2 Safety performance measurement
Safety improves or degrades in relation to boundaries of acceptability and the availability and application of standards. Safety is driven by social forces, common and competing goals, and underpinned by the technical and financial possibilities to resource its improvement or prevent its decline. But is it possible to measure safety to determine whether current activities lie within acceptable safety boundaries or whether trends in performance decline or improvement are occurring? Indicators offer the possibility of defining acceptable or tolerable boundary limits or trends, expressing tolerances as to how close to the boundary one can get and associating these with levels of action. Can the ‘Rasmussen drift’ (section 2.3.6) to the boundary of acceptability be measured?
Measurements have to be taken to indicate safety performance. Two modes of measurement are generally considered in relation to safety management and safety culture:
1) Measure the inputs of the management system to the safety processes and the outputs of these processes using leading and lagging indicators.
2) Measure the safety culture (beliefs and attitudes) or safety climate
(perceptions about safety and risk) which is believed to underpin safety at a collective level, across the organisation.
Most published guidance on KPIs in process safety concerns (1) – see chapter 4 and Annex 2. Issues related to (2) are discussed in chapter 3.4.
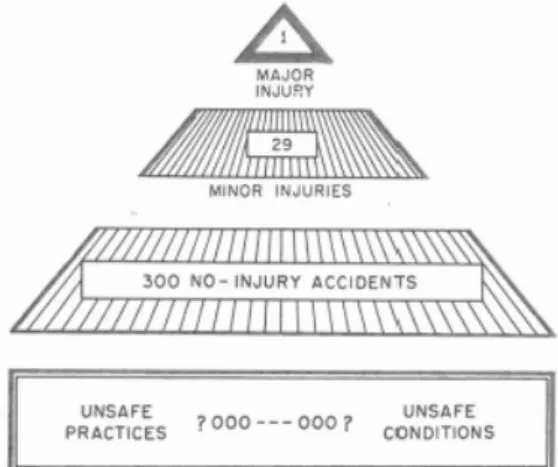
Many see the new breed of performance indicator as another layer of Heinrich’s triangle (Heinrich, 1931) as shown in Figure 3, or one step deeper setting metrics at management level in the sociotechnical system as shown in Figure 5 and Figure 10. There is talk of a ‘management dashboard’ which will provide the necessary parameters for using the safety controls.
To be able to say that safety is getting better (or worse), like saying whether the speed of a car is faster or slower, appropriate measurements have to be taken. It is generally agreed that safety performance indicators should be a driving force for learning and improvement. That will only work if organisations direct attention in the right places. That was the conclusion of the Baker report after its review of BP’s US refineries (Baker, 2007) following the 2005 Texas City explosion.
‘BP primarily used injury rates to measure process safety performance at its U.S. refineries before the Texas City accident. Although BP was not alone in this practice, BP’s reliance on injury rates significantly hindered its
perception of process risk. BP tracked some metrics relevant to process safety at its U.S. refineries. Apparently, however, BP did not understand or accept what this data indicated about the risk of a major accident or the overall performance of its process safety management systems. As a result, BP’s corporate safety management system for its U.S. refineries does not effectively measure and monitor process safety performance.’ xiv (Baker, 2007).
The panel concluded that BP should develop, implement, maintain, and periodically update an integrated set of leading and lagging performance indicators for more effectively monitoring the process safety performance of the U.S. refineries by BP’s refining line management, executive management (including the Group Chief Executive), and Board of Directors.
In conclusion, it makes sense that regulators and companies are looking to: establishing indicators as predictors (leading indicators) of a potential
loss of control that could lead to harm or damage;
establish common indicators for benchmarking, especially unwanted consequences (lagging indicators);
the safety management system as inputs to risk control as a place to locate leading indicators;
critical parts of the total output such as failures in safety-critical equipment.
Questions about what to address include:
What functions are indicators intended to perform?
Can causal modelling assist the selection of performance indicators? Can culture measurement provide a suitable major hazard safety metric? Are there enough events of the necessary diversity illustrating the key
issues?
What and how many indicators would one need to include to give a broad and critical safety coverage?
How would they be measured (and how often)?
What would the criterion be for taking follow-up action? What are current SPI measurements telling us?
The subject is gaining increased attention at conferences and workshops (e.g. Wood, 2010; CEFIC-EPSC, 2012). The following sections attempt to deal with some of the main issues.
2.3 Performance indicators as predictors of safety
2.3.1 Event frequencies
‘Although it has been involved in at least 68 fatal crashes in the last 43 years, aviation experts say that the 737 has a good safety record when the sheer number of miles it has flown is taken into account.’
The occurrence of an accident does not by itself say something about the quality of the installation, personnel or management (Ale, 2009). Similarly even if everything is good and functions as intended there still remains a probability that an accident will occur.
Some things are very rare, others frequent. Maybe we will only see them once in a lifetime, or maybe many times. Safety management failures like having blind spots and not keeping to their own procedures have been identified multiple times in investigations of the larger scale accidents. Why did the management not see this beforehand? Was there a ‘drift’ into failure which could have been measured by some trend?
Figure 3 Heinrich Triangle (Heinrich, 1931)
Can this concept be similarly applied to major accidents and is there a causal relationship between the layers?
The Heinrich concept initiated the idea that near misses help point to less frequent bigger accidents. Perhaps near misses and other less severe outcomes could point to weaknesses in the system which contribute to major accidents.
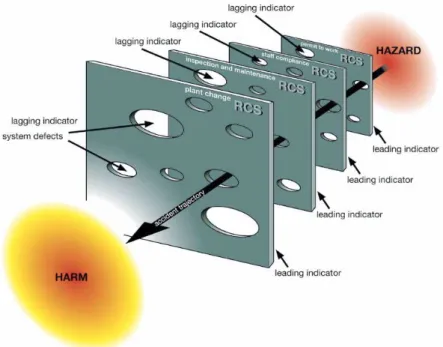
For example, measured outcomes could point to holes in the ‘Swiss cheese’ (Reason, 1990, 1997) of already penetrated barriers (Figure 4).
Figure 4 Swiss cheese model illustrating leading and lagging indicators (from HSE 2006)
However, the Energy Institute (2005) criticises the idea that the smaller Loss Of Containment (LOC) accidents predict the bigger ones and therefore looking at more frequent near misses as performance indicators could be a diversionary effort. This conclusion was based on an evaluation of the potential for smaller LOC related accidents to have been bigger or that a number of smaller LOC accidents are correlated with the number of bigger accidents. The conclusion was that the predictive power of near misses was not so good for major hazards. However, there are data on underlying causes from the more serious chemical accidents to highlight events which play a role in the accident sequence
(Arbeidsinspectie, 2011) and which show that self-assessment by companies of potential scenarios and how to avoid them could be improved. The analysis of incidents in the years 2008-2010 showed that accidents begin with deviations in the material specifications and conditions, in process control or in safeguarding equipment for maintenance or at start-up or due to loose connections between connecting points in the containment system and that in more than half of the cases deviations were not detectable because of lack of indications. In this way deviations can develop into full blown incidents exacerbated by subsequent mitigation failures, particularly shutting off the release. In around half the accidents non-compliance with legal obligations were identified, amongst which failures in the safety management system.
Small deviations, which could have been recovered, developed into incidents. The point about the Heinrich triangle is that it has stimulated companies to conduct self-assessment using smaller incidents (Anderson and Denkl 2010) but the assessment of small developing into big has to compare like with like. Guidance on developing performance indicators often refers to using near miss data but it needs to be clearer what near miss means in the major hazards context and how to best evaluate such more frequent data including the risks
associated with deviations as well as the safety management strengths and weaknesses.
2.3.2 Performance indicators as alarms
Many major accidents are considered to have harbingers which a company should have recognised, such as should have warned BP before Texas City. BP’s measured loss of containment incidents had got steadily worse in the preceding few years (Baker, 2007, p.187) but they ignored them. Outcome indicators which are harbingers should play an alarm call role but these can fall in the management blind spot.
Even at the technical level, where there are interfaces with human detection capabilities, one of the notable high frequency nodes in the sequence of
precursors is a lack of any indication or signal that a deviation has occurred, so the deviation is not detected and goes on to develop into an accident. This has been found in analysis of data from the MARS database (Bellamy and Baksteen, 2009), and in Dutch major hazard LOC data (Mud et al 2011, Bellamy et al, 2012) and in UK data (Lisbona et al, 2012). Is management measuring these deviations and understanding why they occur? SPIs could be more focused on the predictive indicators at the organisational level that underpin these deviations and the ability to detect and respond to them. Körvers and
Sonnemans (2008) have also argued for a focus on these kinds of precursors which they found to frequently recur in accident reports: ‘… it is striking to see that these disruptions are not used for constructing pro-active Sis; neither are they emphasized in accident reports as pre-warning signals.’ (p.1076). The emphasis on looking at precursors and addressing the underlying root causes is further elaborated in Sonnemans, Körvers and Pasman (2010), especially the question as to what, why and how it is that these events develop into accidents.
2.3.3 Causal links to risk
A link with the risk may be represented in models analysing accident causation (RIVM 2008) involving direct and underlying causes, built around a socio-technical concept like a risk control system as in the UK Health and Safety Executive’s (2006) guidance on developing performance indicators. Or it may be considered at a more social than technical level which conceives of risk control as a safety culture issue - a set of assumptions, beliefs, values and feelings and visible artefacts (Schein, 2004).
An obvious and predominant line of thinking is that accidents, being negative events, had to have had causes that are also negative events. So, by identifying the potential weaknesses of an organisation and management system in
advance, it may be possible to intervene before an accident takes place.
To make the connection between safety and indicators it is generally agreed that in practice the safety performance indicator system should be linked to the risk in some way, even if it is just going round the installation and spotting areas of concern. Grote (2009) suggests that central to the debate on SPIs is sound knowledge about cause and effect relations in order to predict safety
performance from any set of indicators. In practice, sound knowledge may be substituted by risk perceptions and experience:
‘We asked the team to brainstorm around the question: “As you go about your
work what are the things which make you feel uncomfortable about process safety”…..The only constraint we put on the brainstorming was that, for a
weakness to be added to the list, the proposer had to give an example of how it had in his experience given rise to the risk.’ (Webb, 2009).
It is not to say that this is not a valid approach. It is a substitute for an absent model, so the ones in the heads of the workforce are used instead.
In general, looking at guidance approaches, performance indicators are focused on the management inputs to and outputs of risk control such as the HSE
(2006) guidance. This shows the risk control system to be a constituent part of a process safety management system that focuses on a specific risk or activity. The input might be the testing of a critical safety system. The output might be the result of the test. The approach is ultimately meant to be about causal relationships underpinning the selection of performance indicators. However, the strengths of the relationships between indicators and safety are not generally known. As the Health and Safety Laboratory reports (Sugden et al, 2007) there is a lack of literature concerning the success or otherwise of SPIs:
‘Most performance indicators seem to have been developed in the absence of any underlying rationale or holistic model. There are some suggestions that the use of performance indicators leads to improvements in system safety, but no concrete evidence of this’ (p.3).
Similarly there is little apparent underpinning using causal modelling although there are many references to the Reason (1997) Swiss cheese model which is a metaphor for the concept that accidents occur because of weaknesses in lines of defence represented by holes in slices of cheese. Indicators should then perhaps measure the holes in the cheese.
Hopkins (2009) talks about failures which identify how well the process safety controls are functioning like plant trips and alarm rates, or delay to repair. Hudson (2009) responds similarly with a bowtie model of managed barriers and needing to know how threats to the barriers relate to consequences in order to develop feedforward indicators. Vinnem (2010) describes the risk level project of the Petroleum Safety Authority to identify levels of risk from indicators. Vinnem distinguishes technical barriers from the human element. Technical barrier indicators of safety critical systems are used with measures of test
success/failure reported by the installations for these barriers such as emergency shutdown valves, fire detection, pressure safety valves. Barrier performance panels are proposed which could be updated every 3 or 6 months with a rolling 12-month average, showing status and trend direction which would maintain motivation and awareness on the major hazards. However, barrier performance did not correlate significantly with hydrocarbon leaks (Vinnem et al 2010).
What is the source of causal data? Accident analysis, near miss reporting, bowtie modelling and risk assessment are all candidates. However, how far do these get in linking the management system to the causality and whether management can handle the risks? Chapter 3 looks at some of the accident analysis evidence. Risk assessment is considered below.
2.3.4 Technical-organisational links
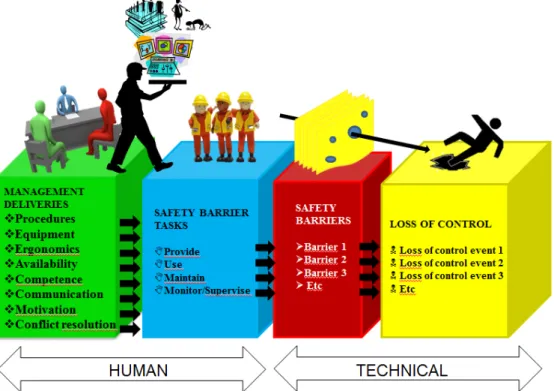
The risk model developed by RIVM (2008) for the Dutch Ministry of Social Affairs and Employment used accident data as a basis for logical modelling. The logic of the model is built by organising the precursor events (previous to outcome) from the accident analysis and relating these to outcomes using probabilistic modelling. The accident analysis includes eight management delivery systems
and four barrier tasks as shown in Figure 5, but omits these elements from the logical modelling because of the potential explosion in the number of scenarios. The logical model therefore lacks the ‘socio’ element of sociotechnical. This is quite typical in risk analysis. The question is whether it can even be included in risk analysis, especially the cultural element.
Figure 5 The barriers model showing an interface between the human and the technical system (After RIVM 2008)
The problem partly resides in the fact that we do not know the best way to measure the socio factors in such a way that we could incorporate these into risk assessment, although there have been attempts to do so (I-Risk and ARAMIS projects) in order to bring more focus on risk related management issues for low probability high consequence risks (Bellamy et al, 1999; Duijm and Goossens, 2006).
The causal relationship is based on the premise that deficiencies in process safety management outputs are linked to deficiencies in the technical system components through an influence on their probability of failure. Duijm and Goossens (2006) point out that the argument against including safety
management in risk assessment is that the SMS is changing fast and so cannot be used for e.g. land-use planning quantitative risk assessments as done in the UK and the Netherlands. However, the authors point out that inclusion of safety management evaluation would lead to more conservative risk estimates
meaning more robust estimates over the long term. ‘Neglecting the safety management efficiency means neglecting the possible degradation of the safety barriers under the presumably volatile safety management regimes’.
The modification of risk (MOR) approach, which is designed to incorporate the management factor, requires scenario-based auditing (Bellamy, 1998). This kind
of audit tool can show up differences across sites (Hurst, 1997). However it can be very resource intensive. A child of this approach called AVRIM2 (Bellamy and Brouwer, 1999), was introduced into the toolkit of the Dutch Labour
Inspectorate for major hazard control accompanied by an organisational typing tool. This tool was based on an extensive mapping of mental constructs of Dutch major hazard inspectors using factor analysis and which could help to predict the strengths and weaknesses of the management system (Bellamy et al, 1995a, 1995b). Strength-weakness constructs were, for example, adherence to procedures, awareness of the risks, resources available for safety,
knowledge/skill of management, commitment to safety, delegated responsibility to front line, level of emergency preparedness. These are areas which are potential SPI candidates and which fell into the following categories:
Design and Condition of Installation; Procedures, Rules and Written Material; Skills, Knowledge and Training;
Use of Contractors and External Expertise; Pressures and Resources;
Culture and Attitudes; Maintenance and Checking;
Communication (between management and workforce); Level/amount of control;
Care for Workforce/Job satisfaction;
Standards of safety reports and attitudes to the Labour Inspectorate; Organisation and Systems;
Event Reporting and Investigation.
The most important organisational typing variables for predicting strengths and weaknesses based on both frequency of occurrence and the amount of explained variance in inspectors’ evaluations were size (of company, site, installation, workforce), documentation (existence of, quantity of; rules, written
documentation, paperwork, procedures), complexity of process or operations, age, degree of centralisation of standards and the influence of parent company, nationality, single or multiple products/hazards, primary or secondary role of the hazardous chemicals in business. Different organisational types would therefore be expected to have different candidate SPIs.
2.3.5 Resilience and safe envelope
Systems modellers (e.g. Hollnagel et al, 2006) consider the concept of a chain of causes or of holes in slices of cheese too linear. The graphic modelling of fault and event trees is too constraining. The system modelling perspective looks at hierarchies of control. There has been a tool developed called STAMP (Systems Theoretic Accident Modelling and Processes) that integrates all aspects of risk including organisational and social (Leveson et al, 2006). The most basic component is a ‘constraint’. The modelling makes sense for controlling safety systems with their dynamic boundaries. The control hierarchy has downward communication imposing constraints and has a measuring channel to provide feedback about effective constraint enforcement.
The system modellers would argue that the typical modelling approaches of accident analysis and risk assessment are not good at modelling what may be non-linear effects. The resonance of concurrent events which influence each other is targeted in the resilience concept of Hollnagel et al (2006). Hollnagel calls into question whether safety performance alone can be proof of resilience. In a system modelling approach, rather than one that focuses on component
failures, resilience is not the classic definition of safety as being resistant to causes. Rather it is the organisation’s ability to adjust to harmful influences. An unsafe state can arise because of insufficient adjustments rather than because something fails. Resilience, according to Hale and Heijer (2006), could be defined as the ability under difficult conditions to stay within the safe envelope and avoid accidents. Indeed, as Rasmussen and Svedung (2000) point out, most major accidents have been caused by organisations operating outside design envelopes due to economic pressures.
‘Safety control should then be based on a facility enabling managers to compare operational conditions to the assumed preconditions of safe operation. This implies that, in the first approximation, measuring safety involves measuring the margin between the safety design envelope and the actual state of system operation, a problem that is realistic as long as the particular system design has been based on an adequate definition of the boundaries of safe operation.’ p48. The point, according to Rasmussen and Svedung (2000) would be to have:
explicit formulation of the boundaries of safe operation (e.g. defence in depth philosophy of probabilistic risk assessment);
communication of design envelope to operating organisation; risk management as part of operational line management; design of managers’ system information interface.
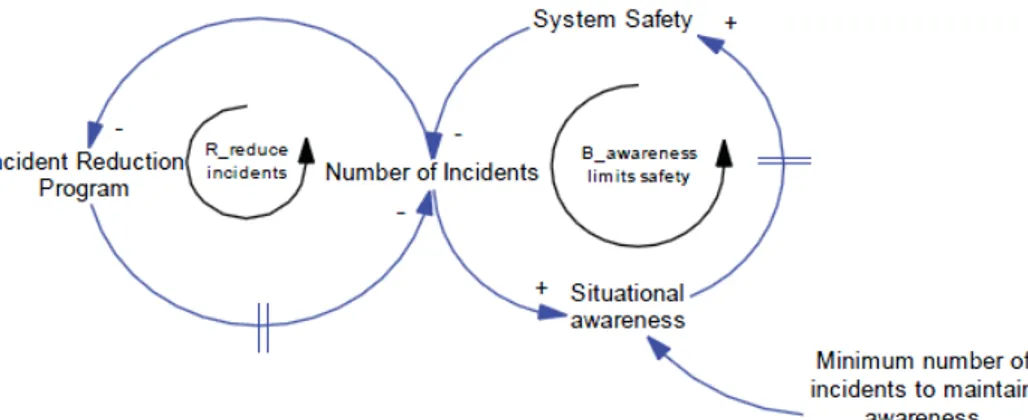
That last point highlights the concept of the important SPIs that could be informing management –the concept of the management dashboard. Some of the issues pointed out by the system modellers should perhaps be considered in the dashboard. The modelling of system dynamics is exemplified in Figure 6. This shows how an incident reduction programme could lead to
reduced situational awareness because of reduced incidents. The model only looks at the interaction of the variable ‘number of incidents’. However, it does show that incidents should not be the lone source of information. It is also implying, paradoxically, that incidents are needed for safety.
Figure 6 Archetype of decreasing safety consciousness (Marais and Leveson, 2003) The + and – signs indicate increases and decrease in the variables
2.3.6 The Rasmussen Drift
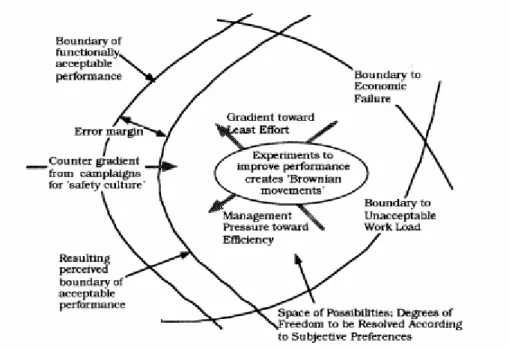
Rasmussen (1997) says that ‘under the presence of strong gradients behaviour will very likely migrate toward the boundary of acceptable performance’. This is shown in Figure 7. This so-called ‘Rasmussen’s drift’ is regarded as a natural process of local adaptation to the situations and demands encountered which bring actors closer to the edge of the safe envelope, with factors like cost effectiveness dominating. Irreversibly crossing the boundary can result in an accident. Boundaries are hard to see.
Safety management according to this model is then understood as requiring a dynamic process dealing with the dynamics of the pressures to migrate towards and across the boundaries and of developing coping strategies for close
boundary interactions. From that perspective safety performance indicators can be imagined as migration meters continuously keeping track of the dynamics of what is happening within the safe boundary.
Figure 7 Rasmussen drift (Rasmussen, 1997)
2.4 SPIs for comparison over time
Descriptive indicators are monitors that can be used for comparing performance over time. The indicators should give an idea about how well safety controls are functioning and be capable of showing trends. The UK Petroleum Industry said that effective key performance indicators (KPIs) should provide a measure of the annual improvement for individual sites (Energy Institute, 2005). Indicators that can be more frequently measured are important so as to be able to talk about a rate (Hopkins, 2009).
Hopkins (2009) emphasises measuring two things:
1) whether monitoring is being carried out (management input measure) and 2) what the monitoring is finding out (output measure ).
2.5 SPIs for comparison across a set of many organisations
Stough (2011), from a research study of a large energy industry data set, claims that the most meaningful key performance indicators are those for which there is variability i.e. there are score differences across many organisations – some good, some average, some bad. Improving the scores of poorer performers is an opportunity to improve aggregate outcome performance.
2.6 Deciding where and how to take action
In order to decide where to take action there needs to be an understanding of causal links to indicate where action is needed (Hale, 2009). Similarly, for driving leadership behaviour leading indicators must offer a practical solution by being ‘actionable’” as well as being routinely measureable, believable and predictive (Stough, 2011):
‘To attain the full commitment of field-level leaders, the leaders must believe that outcome performance can be affected with proper changes to performance in the leading KPI.’
Stough identified that the typical pattern in many QHSE business processes is (1) Obtain/review data from reported incidents, (1a) Measure potential risk, (1b) Identify failed controls, (2) Implement/repair controls to reduce risks. (1) is affected by reporting culture and (2) by leadership response. The traits of a high performance culture were:
strong culture of reporting and fixing;
high rate of action with high percentage on-time completion; responsive, disciplined leadership involvement.
2.7 Performance indicators as motivators
In driving improvement, giving incentives is one of the functions identified by Hopkins (2009). There could be financial incentives if, for example, SPIs are linked to bonuses. Hale (2009) reports that setting intermediate performance indicators on management drives up the reporting of intermediate events which appears to be a success factor in lowering accident rates. The reporting included dangerous situations and their resolution or observation rounds coupled with discussions with the workforce on good and bad practices. Hale and Guldenmund (2008) also indicate a three times greater chance of success with culture
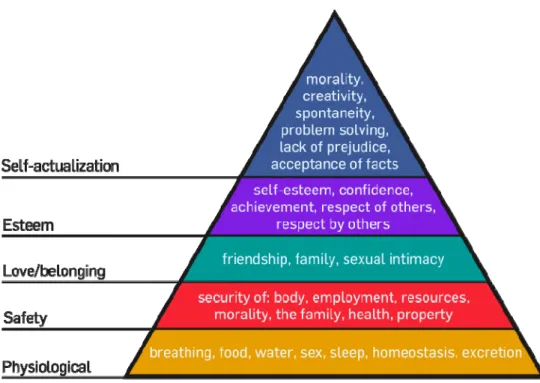
interventions when site directors are supportive, active and participative. Motivation is generally described as goal directed behaviours such that it is logical to conclude that target setting in terms of safety indicators should be motivating. That might be placed in a broader context of need, such as that of Maslow (1943). Achieving higher levels in the hierarchy means satisfying the lower levels first. Attaching SPI’s to pay would be low in the hierarchy
(safety/security level), whereas safety achievement being motivated as a matter of self-esteem would be higher and safety as a moral value even higher. One might wonder therefore whether linking performance targets with financial reward systems has less impact than providing achievement rewards that raise self-esteem. Concepts like trust and commitment which appear to be positive aspects of safety culture (see section 3.4) also look to be more aligned to the higher levels.
Figure 8 Maslow's hierarchy of needs (Maslow 1943)
2.8 Part of the problem solving process
We might regard SPIs as part of the problem solving process of how best to manage process safety. According to Schein (2004) the culture of a group can be defined as a ‘pattern of shared basic assumptions that was learnt by a group as it solved its problems of external adaptation and internal integration, that has worked well enough to be considered valid and, therefore, to be taught to new members as the correct way to perceive, think and feel in relation to those problems.’ p17. The tasks of safety management can be seen as part of this problem solving cycle – a set of feedback and learning loops operating at different levels in the sociotechnical organisation (Hale et al, 1999).
3
Safety management and safety culture
3.1 Safety management system requirements
The requirements for a safety management system according to the Seveso II Directive is given in Annex I. Various guidance and standards have been
produced indicating what a safety management system should contain including Mitchison and Porter (1998) and NTA 8620 (NEN 2006) focused on major hazard safety management and at a more general level ILO-OSH (2001) and
OHSAS 18001 (2007).
3.2 Accident analysis and safety management causes
The primary link between safety management and safety performance is
hindsight. Lessons learnt from accidents repeatedly address failures in the safety management system. An example is given below.
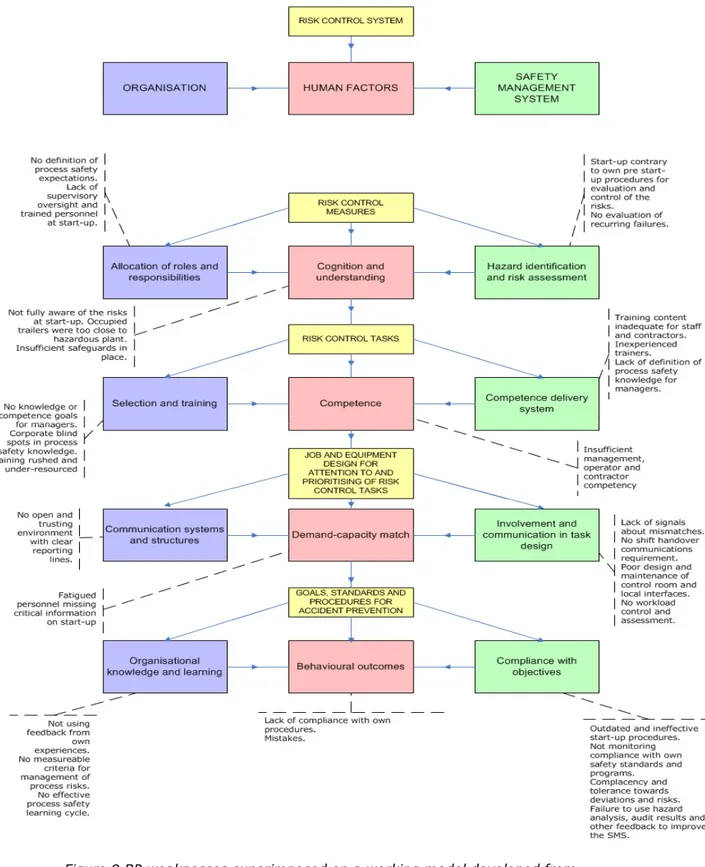
Bellamy, Geyer, Oh and Wilkinson (2008) analysed the weaknesses in BP’s system underlying the Texas City accident based on the Baker report (Baker, 2007) and the Chemical Safety Board (US CSB, 2007) investigation. The analysis used a model developed from analysing a small number of major accidents where very detailed investigation reports were available (Bellamy and Geyer, 2007). The model encourages thinking within four themes which
influence human performance:
failure by people with major accident prevention responsibilities to understand the risks;
failure to competently perform tasks related to the integrity of major accident risk control measures;
failure to prioritise and give due attention to resolving task demands and human performance capacities, particularly through communications and workforce involvement;
failure to give assurance that there is a knowledgeable learning organisation.
BP weaknesses found across all themes were superimposed on the model. This is shown in Figure 9
Figure 9 BP weaknesses superimposed on a working model developed from major accident analysis (Based on Bellamy and Geyer, 2007; Bellamy, Geyer, Oh and Wilkinson 2008)
3.3 Lagging indicators of the regulator
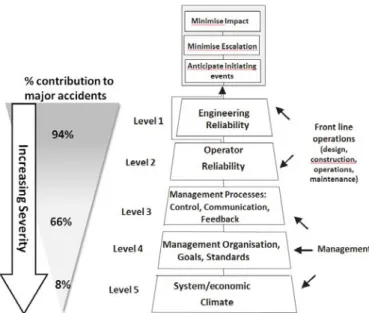
Kawka and Kirchsteiger (1999) examined the EU Major Accident Reporting System (MARS) in the context of the ‘sociotechnical pyramid’ (Hurst et al, 1991; Bellamy and Geyer, 1992), a hierarchical model of risk control (Figure 10). They found that, using 230 accidents from the MARS database, around 66% of the accidents occurred due to latent Safety Management System (SMS) failures and 8% from factors in the system climate. The mean severity of the accidents increased with the level depth of the pyramid. It seems that failures at the deepest levels of the sociotechnical pyramid give rise to the severest accidents. It was shown that severity in MARS data was unrelated to the length of the accident description. Neither was the length of the accident description related to the level in the sociotechnical pyramid.
The distribution of results support the idea that failure events at levels 1 and 2 of the type found in major accidents (equipment and human failures) are for a large part (around 75%) outcomes of an underlying loss of control by the management system.
Figure 10 Sociotechnical pyramid showing on the left % contribution of causes to 230 MARS accidents (after Kawka and Kirchsteiger, 1999)
66% were due to latent safety management system failures at levels 3 and 4 and accident severity increased with depth of cause.
Figure 11 shows components of the SMS identified by regulatory authorities in incidents and comparing Dutch (Arbeidsinspectie, 2011; Mud et al, 2011) and Italian (Basso et al, 2004) findings. The Dutch data are based on the analysis by the Labour Inspectorate. The Italian data are based on analysis by the
Figure 11 Distribution of incidents according to involvement of the SMS as a % of the total incidents for the MAPP and the seven Seveso safety management system elements according to investigations in the Netherlands
(Arbeidsinspectie, 2011; Mud et al, 2011) and company incidents reports to the inspectorate in the Piemonte region of Italy (Basso et al, 2004)
Number of events NL = 118, I= 277.
Basso et al (2004), reporting on the Italian study, identified that the monitors set by operators were not related to the objectives of the policy but to
measuring a part of the system. The authors recommended a method for targeting SPIs that should be focused on achieving the targets of the major accident prevention policy. Some suggested areas were:
1. Organization and personnel
investments in preventive or protective measures to limit the consequences of major accidents (from budget);
hours for safety training per person (from training minutes); percentage of right answers for person (from tests to evaluate the
effectiveness of training);
percentage of incidents when correct response was taken (from incident reports).
2. Identification and evaluation of major hazards number of hazard evaluations conducted;
number of incidents happened in the establishment not previewed by the risk analysis (from risk analysis and incident reports).
3. Operational control and management of change
non-compliance about procedures, instructions and all documents necessary to describe dangerous substances, processes, plants and pieces of equipment (check list of audits);
technical inspections for control and maintenance of critical plants and pieces of equipment (from records);
number of incidents due to wrong observance of procedures and instructions (from incident reports);
number of incidents due to wrong management of change (from incident reports).
4. Planning for emergencies.
percentage of hours for safety training specific to the planning for emergencies (from training minutes);
number of incidents happened in the establishment not considered or badly planned by the emergency plan (from emergency plan and incident reports).
5. Audit and review number of audits;
number of reviews of the major accident prevention policy and the SMS. Combined with:
incident investigation to find out the critical issues of the safety management system;
choice and analysis of performance indicators and their thresholds; correlation between the indicator tolerance and the severity of the issue
of the safety management system.
Further analysis on the data set of the Dutch LOC accidents over the period 2006-2010 by selecting only the Seveso plants incidents that were entered into the tool Storybuilder™ (Bellamy et al, 2006) reveals that for Operational Control barriers the main preventive barrier failures were as shown in Figure 12 - mainly safeguarding, flow and equipment condition failures. Figure 13 then shows the relationship between failure of one of the barriers (safeguarding) and the barrier tasks and management delivery systems failures associated with it. Dominant failures are in delivering adequate procedures (50% of safeguarding failures) in providing (45%) and using (41%) the barrier.
The purpose here has been to show that by collecting a large amount of incident information, links can be made between the management system and incidents. Data within individual companies may not be sufficient to show such results, such that it is helpful for companies and regulators to share data for the purposes of large scale analysis. With improved safety and reduced incident data, the opportunities to identify underlying problems in the higher severity events becomes more challenging.
Figure 12 Analysis of Operational Control Barrier failures in Dutch Seveso plants 2006-2010
Figure 13 Percentage and number of barrier management failures (shown below boxes) for the safeguarding barrier (safeguarding before starting up an
operation or beginning an activity) in 22 accidents identified from incident investigations
% of total and numbers of accidents are shown below the boxes. Plans and procedures failures in providing and using safeguarding dominate and in 36% of these incidents mistakes could be identified as having occurred.
3.4 Safety culture
3.4.1 Definitions of safety culture
The term 'Safety Culture' was first introduced in the Post-Accident Review Meeting on the Chernobyl Accident in 1986. The International Nuclear Safety Advisory Group later produced INSAG-4 ‘Safety Culture’ (IAEA, 1991), which deals with the concept of Safety Culture as it relates to Organizations and Individuals engaged in nuclear power activities, and provides a basis for judging the effectiveness of Safety Culture in specific cases in order to identify potential improvements. A later review of the accident in INSAG-7 (IAEA, 1992) found that design flaws were in fact primarily responsible which led INSAG to shift the emphasis of its conclusions from the actions of the operating staff to faulty design of the reactor's control rods and safety systems.
The safety culture concept emphasises safety at a group level. The commonality in culture is a sharing of ideas, beliefs, values. Culture is a term used by
anthropologists which has become instrumentalised by management theorists (Haukelid, 2008).
There has been a recent shift towards talking about organisational culture, a shift apparently being referred to as the ‘third age of safety’ after hazard control technologies and human factors (Mengolini and Debarberis, 2008). According to these authors safety culture in the nuclear industry is now regarded as a specific type of organisational culture in high reliability organisations. The concept of ‘leading’ indicators which can be used to predict safety performance as opposed to ‘lagging’ or output indicators which reflect past performance is the challenge for monitoring these organisational factors.
Guldenmund (2000, 2010) defines safety culture as the aspects of the organisational culture which will impact on attitudes and behaviour related to increasing or decreasing risk. He argues that it is not possible to measure culture directly. Culture is an unmeasurable set of unconscious basic assumptions that can only be interpreted through ‘espoused values’. Schein (2004) explains that organisational culture is a pattern of assumptions in relation to problems with external adjustments and internal integration that have functioned well enough to be perceived as true, and are passed on to new members as the right way to conceive, think and feel. These basic assumptions are apparently non-negotiable and those not holding them are outsiders. Members of the culture depict these basic assumptions through espoused beliefs, values, norms, and rules of behaviour that members of the culture use to depict the culture to themselves or others. The tangible overt manifestations of culture are called artefacts – the architecture of the environment, the language, the technology, style, manners, myths and stories, rituals etc.
The term ‘safety climate’ is often heard alongside that of culture. ‘Safety climate’ describes employees’ perceptions (as opposed to attitudes and beliefs) about risk and safety, providing a ‘snapshot’ of the current state of safety (Mearns and Flin, 1999). Safety climate can be seen as an ‘artefact’ of the deeper cultural level and is the visible behaviour of its members. Artefacts include
organisational processes which render certain behaviours routine.
3.4.2 Leadership and culture
The Harvard Business Review (1998) on Leadership gathers together key articles from eminent thinkers on management and leadership. From this can be distilled that leadership is about bringing about and adapting to change. It is about vision and strategy, gathering and analysing information, and giving direction. It is about protection, orientation, managing conflict and shaping norms.
Leadership failings have recently become the hue and cry of the major hazard safety industries but with ‘little theoretical development or empirical research directly assessing the relationship between leadership and safety’ (O’Dea and Flin, 2003). Apparently there has been a long held proposition, since 1939, that leaders create climate. According to Zohar (2010) interactions and exchange between leaders and their group members are part of a social learning process for how to interpret the organisational environment. This gives leaders an important role in informing group members of how to behave, what the priorities are and what behaviour gets rewarded. Organisations with lower accident rates are characterised by the presence of upper managers who are personally involved in safety activities (Mearns et al, 2003). According to Human