Wout Slob
National Institute for Public Health and the Environment
P.O. Box 1 | 3720 BA Bilthoven www.rivm.com
Estimating the carcinogenic potency of
chemicals from the in vivo micronucleus
test
Colophon
ISBN: © RIVM 2012
Parts of this publication may be reproduced, provided acknowledgement is given to: National Institute for Public Health and the Environment, along with the title and year of publication.
Lya G. Hernández, Laboratory for Health Protection Research (GBO) Jan van Benthem, Laboratory for Health Protection Research (GBO) Wout Slob, Centre for Substances and Integrated Risk Assessment (SIR)
Contact: Wout Slob
Centre for Substances and Integrated Risk Assessment (SIR) Wout.Slob@rivm.nl
This investigation has been performed by order and for the account of the Ministry of Health, Welfare and Sport (VWS), within the framework of VWS project 340700
Rapport in het kort
Schatting van de carcinogene potency van chemische stoffen uit de in vivo micronucleus test
Het RIVM heeft een methode ontwikkeld waarmee sneller en met minder proefdieren een schatting kan worden gemaakt van de mate waarin een chemische stof kankerverwekkend is.
Normaal gesproken wordt de mate waarin een stof kankerverwekkend is gebaseerd op het aantal tumoren dat in langdurige dierstudies wordt
aangetroffen. Dergelijke langdurige studies zijn nodig omdat tumorvorming een langzaam proces is. Deze studies duren twee jaar en vergen veel proefdieren (rond de 400). Voordat tot een langetermijnstudie wordt overgegaan, wordt eerst met behulp van een kortetermijnstudie bekeken of een stof wel of geen schade veroorzaakt. Hiervoor zijn circa 50 proefdieren nodig. Als DNA-schade optreedt, is dit een indicatie dat de stof kankerverwekkend kan zijn. De langetermijnstudie wordt vervolgens ingezet om na te gaan of de stof inderdaad kankerverwekkend is, maar ook om een indicatie te krijgen van de mate waarin. Uit het RIVM-onderzoek blijkt nu dat op basis van de kortetermijnstudie niet alleen duidelijk wordt of een stof DNA-schade veroorzaakt, maar ook een indicatie kan worden verkregen van de mate waarin de stof kankerverwekkend is. De langetermijnstudie met veel proefdieren kan dan in veel gevallen
vermeden worden. Dit is van belang aangezien er internationaal naar wordt gestreefd het proefdiergebruik terug te dringen en het aantal langdurige studies te minimaliseren.
Voor de nieuwe methode is in kortetermijnstudies onderzocht bij welke concentratie (bijvoorbeeld in het voer van de dieren) een bepaalde mate van DNA-schade optreedt. Tevens is onderzocht bij welke concentratie een bepaald percentage van de proefdieren tumoren krijgt in de langetermijnstudies. Beide concentraties bleken aan elkaar gerelateerd.
Trefwoorden:
vervanging, voorspelbaarheid, in vivo genotoxiciteit, carcinogeniteit, benchmark dose, in vivo micronucleus test
Abstract
Estimating the carcinogenic potency of chemicals from the in vivo micronucleus test
The RIVM has developed a faster method for estimating the carcinogenic potency of compounds, using less animals than with existing methods.
Currently, the degree to which a substance is carcinogenic is estimated from the number of tumors found in animals in long-term studies. These long-term studies are necessary because the development of tumors is a slow process. Normally, these studies take two years and make use of many animals (around 400). Prior to deciding whether to perform a long-term study, short term-studies are always performed to examine if a compound causes DNA damage. The presence of DNA damage (a positive result in short-term test) is generally indicative that a compound might be carcinogenic. Long-term studies are therefore performed to confirm whether a compound is carcinogenic or not, and to assess how potent the substance is in inducing tumors (carcinogenic
potency).
Research at the RIVM has shown that short-term studies can not only provide an indication as to whether a compound causes DNA damage, but also can provide an estimate of the carcinogenic potency of a chemical. With this new approach, long-term studies can be avoided. This is of interest given the international aim for reducing animal use and long-term studies.
In this new method, a comparison was made between the concentration that induced a selected degree of DNA damage in short-term studies and the concentration at which a selected percentage of animals developed tumors. Results demonstrated a relationship between concentrations in short- and long-term studies, thus providing the possibility to use short-long-term studies to obtain an indication of the carcinogenic potency of chemicals.
Keywords:
potency correlation, in vivo genotoxicity tests, carcinogenicity, benchmark dose approach, in vivo micronucleus test
Contents
Contents−7 Summary−9 1 Introduction−11 1.1 Aim−12 2 Analysis− 13 2.1 Data−132.2 Deriving BMD confidence intervals−18
2.3 Steps of analysis−20
3 Results−21
4 Discussion−25
4.1 Impact for risk assessment−27
4.1.1 Hazard identification−27
4.1.2 Hazard characterization−28
4.2 Impact for study design−28
5 Conclusions−29
6 Future research−31
7 Acknowledgements−33
8 References−35
Appendix 1: Description of tumor lesions per class−37 Appendix 2: Data used to generate Figure 2−41
Summary
The goal of this report was to investigate the use of short-term genotoxicity tests in predicting the carcinogenic potency of chemicals as measured in a chronic cancer bioassay. This bioassay has several practical drawbacks: it uses large numbers of animals, has a long duration (two years plus one year of analysis), and high costs. For this reason, alternative methods are desirable. In
vivo genotoxicity assays might be useful as an alternative for estimating
carcinogenic potency given the experience that genotoxicty tests measure mutations and/or chromosomal aberrations, which are associated with carcinogenesis.
In this study we focused on the murine in vivo micronucleus test as a potential predictor of the carcinogenic potency of compounds in the same species. We applied the benchmark dose (BMD) approach for estimating the genotoxic and the carcinogenic potency for a total of 51 compounds: 41 were studied in the National Toxicology Program and 10 were re-analyzed from the Carcinogenic Potency Database and public literature. Both genotoxicity and carcinogenicity studies showed large variability in estimated BMDs for the same compounds when data from studies with different study conditions were compared. In spite of this variability, the BMDs derived from the genotoxicity studies were clearly correlated to the BMDs from the carcinogenicity studies, in particular when the lowest BMD was selected for each compound, both for the micronucleus and the carcinogenicity studies. Results suggest that the lowest tumor BMD10 can be estimated from in vivo micronucleus BMDL05s (lower confidence bound of BMD05) by multiplying the latter by a scaling factor of 10. Thus, the uncertainty in the MN BMD05 is taken into account by using the BMDL05 as the starting point. This value would predict the tumor BMD10 within an uncertainty range of around two orders of magnitude (the true BMD10 might be a factor of 10 higher or lower with an overall uncertainty range of 100). Therefore, an uncertainty factor of only 10 would be sufficient to turn the value obtained into a
conservative estimate of the tumor BMD10.
Our results challenge the way genotoxicity data are currently analyzed by showing that genotoxicity potencies only differ gradually among chemicals without any demarcation between genotoxic and non-genotoxic chemicals. Thus, the distinction between genotoxic or non-genotoxic can only be made by
appointing a value of the potency parameter for use in practical decisions. Given that a BMD analysis of haematopoietic micronucleus (hMN) data from blood and bone marrow provides better and more useful information, it is worthwhile to re-think the current experimental designs and to consider using designs with more doses without increasing the total number of animals.
Overall, these results show that the clastogenic potency from short-term studies may be used as an estimate of the carcinogenic potency, at least for compounds that are positive in the in vivo micronucleus test. The next step would be to investigate the carcinogenic potency for chemicals that appear to be non-clastogenic.
1
Introduction
The 2-year cancer bioassay (OECD, 2008) plays an important role in cancer risk assessment. Unfortunately, this assay has several drawbacks which include the large number of animals utilized, the long time it takes to get the results (two years plus one year of analysis), and the high cost (up to several million euros depending on the route of exposure (Jacobson-Kram et al., 2004). Therefore, the decision to perform such a study is not easily made. In the European legislation REACH (Registration, Evaluation, Authorization, and restriction of Chemicals), carcinogenicity studies are considered at all annexes but testing is only allowed at the highest production volume (REACH Annex X) and under specific conditions: (i) the test substance is either genotoxic or induces hyperplasia and/or pre-neoplastic lesions in repeated dose studies and (ii) the substance has a widespread dispersive use or there is evidence of frequent or long-term human exposure. Both criteria have to be fulfilled for carcinogenicity studies to be performed. There are also a number of conditions that waive carcinogenicity studies such as classification as a category B or category C-mutagen. A test proposal needs to be submitted and approved by the European Chemical Agency (ECHA) before any carcinogenicity study is allowed to be performed. As a result, carcinogenicity assays in Europe will often be lacking and thus in many instances human risk assessment for a potential carcinogen cannot be completed, leaving the carcinogenic potency of the chemical unknown. This raises the question of whether carcinogenic potency of substances can be estimated in the absence of carcinogenicity data from a chronic bioassay. One way to address this issue for genotoxic carcinogens is to use in vivo genotoxicity tests. Genotoxicity is generally a parameter used for hazard identification, but the applicability of using the magnitude of response from in vivo genotoxicity tests for hazard characterization has never been thoroughly investigated in a quantitative manner. Genotoxicity assays could be useful for the determination of cancer potency parameters given that genotoxicity tests measure mutations and/or chromosomal aberrations which are strongly associated with
carcinogenesis. These in vivo tests are relevant candidates for predicting the carcinogenic potency of chemicals, as there is accountability for metabolic disposition of a xenobiotic including absorption, tissue distribution, metabolism and excretion; all these factors are important parameters in determining the carcinogenic potency of chemicals in vivo.
If genotoxic potency were found to be correlated with carcinogenic potency, then in vivo genotoxicity tests might be used to assess the carcinogenic risk of substances in the absence of carcinogenicity data. To the best of our knowledge, only one study has attempted to address the relationship between
dose-response data from genotoxicity tests and carcinogenicity studies (Sanner and Dybing, 2005). They compared the Lowest Effective Dose (LED) for in vivo genotoxicity (micronuclei, sister chromatid exchange, DNA adducts,
chromosomal aberrations and comet assay) to a dose that resulted in a 25%
increase in tumor load (T25) in mice and rats. Positive correlations were found
both in mice and rats, and both for oral and inhalation exposure (Sanner and
Dybing, 2005). A drawback of this study was that the LED and T25, both being
estimated by simple and imprecise methods, were used as estimates of equipotent doses. We performed dose-response analysis in an earlier study where equipotent doses were estimated as benchmark doses (BMDs) from in
vivo genotoxicity tests (micronucleus test and transgenic rodent mutation assay)
as well as from carcinogenicity studies. In this study we found a positive correlation between genotoxicity tests and tissue-matched carcinogenicity, based on dose-response data from 18 compounds (Hernandez et al., 2011). This promising result stimulated us to proceed and try to validate this result based on a larger sample of chemicals. In the present study we investigated 51
compounds: 41 compounds which were evaluated by the U.S. National
Toxicology Program (http://ntp.niehs.nih.gov/) in a in vivo micronucleus test, as well as in a 2-year cancer bioassay and 10 compounds from our previous
analysis (Hernandez et al., 2011). Table 1 provides a list of compounds considered.
The in vivo erythrocyte micronucleus test is the most common in vivo
genotoxicity test. It measures the ability of a test compound to induce micronuclei in progenitor red blood cells in bone marrow (Heddle et al., 1983). The incidence of micronucleated polychromatic erythrocytes (reticulocytes) from bone marrow (Heddle et al., 1983), and micronucleated reticulocytes from peripheral blood (Hamada et al., 2001) are considered a valid index for identifying chemicals that induce chromosomal damage or cause chromosomes to lag at anaphase.
We analyzed the in vivo micronucleus tests from hematopoietic cells (blood and bone marrow, hMN) and carcinogenicity studies for the 51 chemicals by re-analyzing the dose-response data and by quantifying their respective potencies in terms of equipotent doses, i.e. doses that are associated with the same change in response. Such equipotent doses can be effectively estimated using the BMD approach, where response curves are fitted to the overall dose-response data resulting in confidence intervals for the BMDs. Confidence intervals quantify the precision of each estimated BMD in dependence of the quality of the specific dataset.
1.1 Aim
The aim of this report was to investigate whether the carcinogenic potency of a compound can be estimated from an in vivo hMN. This would be the case if the following conditions are fulfilled:
1. a relationship between the hMN and carcinogenic potency of chemicals must exist, and;
2. the dose-response data from hMN and carcinogenicity tests are of sufficient quality to establish that correlation with sufficient precision.
The first condition relates to the scientific question if the correlation exists at all. The second condition relates to the practical (risk assessment) question if current test protocols are of sufficient quality to make predictions about the carcinogenic potency of a chemical in the absence of a bioassay. If it can be established that condition 1 holds, it would be worthwhile to investigate how study protocols could be improved to make the prediction of a chemical’s carcinogenic potency more precise.
2
Analysis
2.1 Data
A total of 222 technical reports in the National Toxicology Program were surveyed for carcinogens that had both hMN and carcinogenicity dose-response data and 44 compounds met this criterion (http://ntp.niehs.nih.gov/). For another 10 compounds, dose-response analysis was performed (BMD analysis) for carcinogenicity data obtained from the Carcinogenic Potency Database (CPD, http://potency.berkeley.edu/); for DMH, NDA, BAP, 2AAF, AZA and PHIP a literature search was performed to obtain in vivo micronucleus data (Asano and Hagiwara, 1992; Durling and Abramsson-Zetterberg, 2005; Meli and Seeberg, 1990; Shimada et al., 1992; Smith et al., 1999; Suzuki et al., 1996; Vrzoc and Petras, 1997). The basis for selection of these 10 compounds is the availability of both carcinogenicity and hMN data for BMD comparisons. The compounds selected were not exclusively compounds classified as clastogenic; many of them were also classified as mutagenic. Compounds in Table 1 that were selected from the NTP database were assigned a consistency score by Levy (2010), both for hMN and carcinogenicity, based on the consistency of the results of multiple tests of the same compound when tested in one or both sexes of mice and/or rats:
0 = all negative results wherever tested;
1 = some negative and some equivocal, never positive; 2 = never positive or negative; always equivocal; 3 = at least one positive and one negative; and 4 = at least one positive; no negative whenever tested.
Many compounds considered in this study had equivocal (score 2) or
inconsistent (score 1 or 3) test results for the hMN test, while four of them were negative with a score 0 (i.e. classified as non-clastogenic). Similarly for
carcinogenicity, where seven compounds were negative in both sexes of both mice and rats or had intermediate scores in at least one sex or species.
Table 1: List of compounds
Carcinogenicity NTP Score In vivo
hMN
Source Cas # IARC Compound AB hMN Cancer M F
1) TR-042 320-67-2 2A 5-Azacytidine ACD 4 3 + NT 2) CPD 306-37-6 2A 1,2- Dimethyl-ne DMH - - + 1 NT 3) CPD 305-03-3 1 Chlorambucil CBC - - + NT 4) CPD 148-82-3 1 Melphalan MEL - - + NT 5) CPD 62-75-9 2A N- Nitrosodimethyl-amine NDA - - + 2 NT 6) CPD 684-93-5 2A N-Nitroso-N-methylurea MNU - - + NT 7) TR-028 96-12-8 2B 1,2-Dibromo-3-chloropropane DBCP 0 4 +3 NT TR-206 96-12-8 1,2-Dibromo-3-chloropropane 0 4 +3 NT 8) CPD 50-32-8 1 Benzo(a)pyrene BAP - - + , 4,5 NT 9) CPD 50-18-0 1 Cyclo- de CPA - - + NT 10) TR-086 106-93-4 2A 1,2-Dibromoethane DBE 4 4 + NT 11) CPD 53-96-3 - 2-acetylaminofluor ene 2AAF - - + 6 NT 12) CPD 446-86-6 1 Azathioprine AZA - - +7 NT 13) TR-288 106-99-0 1 1,3-Butadiene BUT 4 4 + + 14) TR-316 513-37-1 2B Dimethylvinyl chloride (DMVC) DMVC 4 4 + NT 15) TR-510 51-79-6 2A Urethane URE 3 4 + NT
IARC, International Agency for Research on Cancer; CPD, carcinogenic potency database (http://potency.berkeley.edu/); hMN, hematopoietic micronucleus test; AB, abbreviation; M, male; F, female; NT, not tested; TR, National Toxicology Program technical report; +, positive; -, negative;
1(Meli and Seeberg, 1990); 2(Suzuki et al., 1996); 3 (Morita et al., 1997), 4(Shimada et al., 1992);
5(Vrzoc and Petras, 1997); 6(Asano and Hagiwara, 1992);
7(Smith et al., 1999); 8(Durling and Abramsson-Zetterberg, 2005).
hMN and carcinogenicity test results were scored as follows: 0 for all negative results wherever tested; 1 for some negative and some equivocal, never positive; 2 for never positive or negative; always equivocal; 3 for at least one positive and one negative; and 4 for at least one positive; no negative whenever tested in any strain or sex of both mice and rats (Levy, 2010).
hydrazi
Table 1: List of compounds cont…
Carcinogenicity NTP Score In vivo
hMN
Source Cas # IARC Compound AB hMN Cancer M F
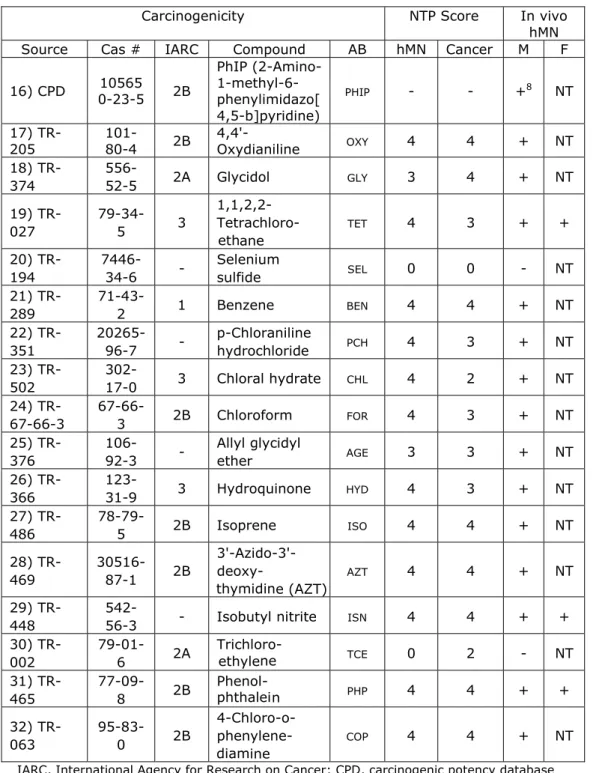
16) CPD 0-23-5 10565 2B PhIP (2-Amino-1-methyl-6- phenylimidazo[ 4,5-b]pyridine) PHIP - - +8 NT 17) TR-205 101-80-4 2B 4,4'-Oxydianiline OXY 4 4 + NT 18) TR-374 556-52-5 2A Glycidol GLY 3 4 + NT 19) TR-027 79-34-5 3 1,1,2,2- Tetrachloro-ane TET 4 3 + + 20) TR-194 7446-34-6 - Selenium sulfide SEL 0 0 - NT 21) TR-289 71-43-2 1 Benzene BEN 4 4 + NT 22) TR-351 20265-96-7 - p-Chloraniline hydrochloride PCH 4 3 + NT 23) TR-502 302-17-0 3 Chloral hydrate CHL 4 2 + NT 24) TR-67-66-3 67-66-3 2B Chloroform FOR 4 3 + NT 25) TR-376 106-92-3 - Allyl glycidyl ether AGE 3 3 + NT 26) TR-366 123-31-9 3 Hydroquinone HYD 4 3 + NT 27) TR-486 78-79-5 2B Isoprene ISO 4 4 + NT 28) TR-469 30516-87-1 2B 3'-Azido-3'- deoxy-e (AZT) AZT 4 4 + NT 29) TR-448
542-56-3 - Isobutyl nitrite ISN 4 4 + +
30) TR-002 79-01-6 2A Trichloro-ne TCE 0 2 - NT 31) TR-465 77-09-8 2B Phenol-n PHP 4 4 + + 32) TR-063 95-83-0 2B 4-Chloro-o- phenylene-ine COP 4 4 + NT
IARC, International Agency for Research on Cancer; CPD, carcinogenic potency database (http://potency.berkeley.edu/); hMN, hematopoietic micronucleus test; AB, abbreviation; M, male; F, female; NT, not tested; TR, National Toxicology Program technical report; +, positive; -, negative. hMN and carcinogenicity test results were scored as follows: 0 for all negative results wherever tested; 1 for some negative and some equivocal, never positive; 2 for never positive or negative; always equivocal; 3 for at least one positive and one negative; and 4 for at least one positive; no negative whenever tested in any strain or sex of both mice and rats (Levy, 2010).
eth
thymidin
phthalei ethyle
Table 1: List of compounds cont…
Carcinogenicity NTP Score In vivo
hMN
Source Cas # IARC Compound AB hMN Cancer M F
33) TR-515 57018-52-7 3 Propylene glycol mono-t-butyl ether PGE 3 3 - + 34) TR-266 150-68-5 3 Monuron MON 4 3 + NT 35) TR-287 868-85-9 3 Dimethyl hydrogen phosphite DHP 4 3 + NT 36) TR-309 1163-19-5 3 Decabromodip
henyl oxide DPO 4 3 NT NT
37) TR-203 108-95-2 3 Phenol PHE 4 1 + NT 38) TR-385 74-83-9 3 Methyl bromide MBR 4 0 + NT 39) TR-403 108-46-3 3 Resorcinol RSC 4 0 + NT 40) TR-473 58-55-9 3 Theophylline TEO 3 0 + - 41) TR-200 15481-70-6 - 2,6- Toluene-e dihydrochloride TAC 4 0 + NT 42) TR-247
50-81-7 - L-Ascorbic acid LAS 4 0 + NT
43) TR-330 136-77-6 - 4-Hexylresorcinol HRC 3 1 + NT 44) TR-447 75-05-8 - Acetonitrile ACE 3 1 + - 45) TR-493 518-82-1 - Emodin EMO 3 1 - + 46) TR-501 80-07-9 - p,p'- Dichloro-yl sulfone CPS 4 0 + NT 47) TR-097 13463-67-7 2B Titanium dioxide TIO 4 1 + NT 48) TR-237 630-20-6 3 1,1,1,2-Tetrachloro ane ETH 4 3 + NT 49) TR-513 91-17-8 - Decalin DCN 3 3 + - 50) TR-527 129-73-7 - Leucomalachite green LEU 4 3 NT +
IARC, International Agency for Research on Cancer; CPD, carcinogenic potency database (http://potency.berkeley.edu/); hMN, hematopoietic micronucleus test; AB, abbreviation; M, male; F, female; NT, not tested; TR, National Toxicology Program technical report; +, positive; -, negative. hMN and carcinogenicity test results were scored as follows: 0 for all negative results wherever tested; 1 for some negative and some equivocal, never positive; 2 for never positive or negative; always equivocal; 3 for at least one positive and one
diamin
diphen
eth
-negative; and 4 for at least one positive; no negative whenever tested in any strain or sex of both mice and rats (Levy, 2010).
Table 1: List of compounds cont…
Carcinogenicity NTP Score In vivo
hMN
Source Cas # IARC Compound AB hMN Cancer M F
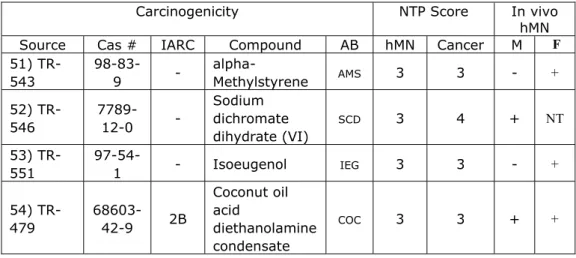
51) TR-543 98-83-9 - alpha-Methylstyrene AMS 3 3 - + 52) TR-546 7789-12-0 - Sodium dichromate dihydrate (VI) SCD 3 4 + NT 53) TR-551 97-54-1 - Isoeugenol IEG 3 3 - + 54) TR-479 68603-42-9 2B Coconut oil acid diethanolamine condensate COC 3 3 + +
The in vivo micronucleus tests examined blood and/or bone marrow using a variable study design, with group sizes between 5 and 15, and number of doses ranging from three to eight (including controls). They further differed in the exposure regimen, varying from a single dose to treatment for 182 days or 26 weeks. Both sexes were used in some of the studies, but most studies used only males. While for some chemicals only a single dose-response dataset was available, other chemicals were tested more extensively by varying factors like sex, strain, or exposure regimen, resulting in various dose-response datasets for the same compound. Thus, individual datasets were defined by having the same levels for the following factors: compound, sex, strain, route, tissue observed, exposure regimen, exposure duration, and sampling time (24 or 48 hrs). Genotoxic potency parameters were derived in terms of BMDs for each of these individual datasets. Thus, there were many BMDs derived per compound and the lowest BMD was selected for final analysis.
The carcinogenicity dose-response data varied largely in group sizes (ranging between as few as 7 and as many as 999). Number of dose groups ranged from three to eight (including controls). Individual datasets were defined by the following factors: compound, sex, strain, route, exposure duration, study duration, and tissue with lesion, type of lesion, tissue specific lesion, and lesion category (see below). Carcinogenic potency parameters were derived in terms of BMDs for each individual dataset. The number of individual dose-response datasets available for a given compound varied between a single dose-response for some chemicals to a large number of them in others by using, i.e. different exposure durations or study durations (with 2AAF as the most prominent example). Similar to the analysis of the in vivo hMN, there were many BMDs derived per compound and the lowest BMD was selected for final analysis. One of the complications of the dose-incidence data reported by carcinogenicity studies is that they may relate to quite different types of response with varying degrees of severity, such as hyperplasia, adenomas, carcinomas, or tumor bearing animals (tba). Clearly, a dose that causes a 10% increase in animals with hyperplasia is not equipotent to a dose that causes a 10% increase in tumor bearing animals. To keep track of such differences, we assigned ‘lesion class’ scores, roughly representing different descriptions of malignant or potentially pre-malignant lesions in each dose-response dataset. There was a
group of compounds which had no evidence of a dose-related trend in
carcinogenicity and we assigned this group category ‘A’. The remaining lesions were designated as follows:
B- hyperplasia, effects in hematopoetic system, neoplasms; C- adenoma, benign tumors, cystioadenoma, leukemia; D- carcinoma, papilloma, sarcoma, angiosarcoma, lymphoma, hamangioendothelioma, stomal tumor, granulosa cell tumor, pheochromocytoma;
E- tumors mixed, any mixed tumor (i.e. lung mixed, liver mixed); F- combination of tumors: papilloma-carcinoma, carcinosarcoma, adenocarcinoma;
G- tba, tba mixed (more than one tumor type combined by NTP or by Berkeley for the CPD);
H- tba malignant tumor(s) (See Appendix 1 for a detailed description of all the tumor lesions in each category).
Three approaches were taken in correlating the hMN potency to the tumour potency:
1. by including all BMDs for all endpoints and study conditions in one graph, irregardless of tumor lesion category;
2. by selecting the lowest BMD for each compound, irregardless of the associated tumor lesion category, and;
3. by selecting the lowest BMD for each compound, for the same tumor lesion category. See Figures 1-3, respectively.
2.2 Deriving BMD confidence intervals
Equipotent doses are defined by BMDs at a given constant benchmark response (BMR). For the carcinogenicity studies we used a BMR of 10% extra risk, which is the most commonly used value of the BMR in dose-response characterization of quantal endpoints (EFSA, 2009). For the continuous dose-response data from the in vivo hMN we used a 5% increase in the mean count in the controls as the BMR, as being the recommended BMR for continuous response data by the European Food Safety Authority (EFSA, 2009).
Rather than deriving BMDs as single values, we derived the (two-sided) 90%-confidence intervals for them. In this way, the potency of chemicals can be quantified even if they do not show a significant trend in the dose-response. For our purposes this is particularly important because this makes it possible to include chemicals with ‘negative’ test outcomes in our sample of chemicals, and thus contribute to establishing the correlation of interest. For chemicals with a negative test outcome, the upper confidence limit for the BMD will be very large or even infinite. However, there will be a lower bound, implying that, if the chemical would at all induce a response (at the value of the BMR used), then it will occur at a higher dose than that lower bound. On the other side of the range, it may occur that the lower confidence limit results in ‘zero’, meaning that no lower bound can be assessed given the dose-response data available. Such may occur in datasets when even the lowest dose shows a response that is substantially higher than the chosen BMR. In these cases, the upper bound of the confidence interval provides some information on the potency of the chemical: the effect (at effect size = BMR) will occur at a dose lower than that upper bound.
Correlation plots of hMN against carcinogenic BMDs can be created by plotting the confidence intervals (in both the x- and y-direction) for each dataset, including the ones that resulted in (one-sided) infinite confidence intervals. Another option is to plot single points rather than confidence intervals, and in that case we used the (geometric) mean of the upper and lower confidence bound. For intervals with zero lower bound we used the minimum nonzero lower limit over all intervals assessed, and for intervals with infinite upper bound we used the maximum of the finite upper bounds of all intervals assessed.
Many of the dose-response data available did not contain much information on the shape of the dose-response by themselves; for instance due to a limited number of dose levels tested, or with responses in only one or a few dose groups. This would lead to highly imprecise estimates of equipotent doses, and a potential correlation would be concealed by the large variability in the data However, a recent re-analysis of a large number of toxicological datasets (Slob and Setzer, in prep.) showed that the dose-responses (from similar studies) of different chemicals tend to be parallel on log-dose scale. We used this result by fitting the model to combined clusters of datasets, where the common value of the steepness parameter is informed by all datasets in the cluster. This approach results in a considerable improvement of the precision of individual BMDs (i.e. smaller confidence intervals).
The continuous dose-response data from the micronucleus tests were analysed by fitting the exponential model, which is one of the recommended models for continuous data (EFSA, 2009), and known to be generally applicable to toxicity data:
bx
d
c
c
a
y
[
(
1
)
exp
where y is the response (number of cells with micronuclei) and x the dose. In fitting the model to the combined cluster of datasets, separate values for
parameters a (reflecting the response at dose 0) and b (reflecting the potency of the chemical) are estimated for each individual dose-response dataset, while parameters c and d are kept constant over all datasets within the cluster analyzed. The within group variance was estimated separately for each
individual dataset as well. See Slob (2002) for a more detailed discussion on this method.
For the quantal dose-response data from the carcinogenicity studies the log-logistic model was fitted.
)]
/
log(
exp[
1
)
1
(
b
x
c
a
a
y
where y is the response (fraction of affected animals) and x the dose. Again, parameters a (reflecting the response at dose 0) and b (reflecting the potency of the chemical) are estimated for each individual dose-response dataset, while parameter c is kept constant over all datasets within the cluster analyzed. A BMD analysis normally applies various models to take ‘model uncertainty’ into account. The overall confidence interval (CI) for the BMD is then obtained by integrating the results from the various models (for which various methods may be used (EFSA, 2009)). We only used one model in the present analysis. In general, experience has shown that the log-logistic model describes toxicological dose-responses data in nearly all cases. Further, systematic analyses of large numbers of historical datasets from all sorts of studies showed that the two
models just mentioned adequately described all datasets that were selected based on having sufficient doses and animals (Slob and Sezter, in prep.). Dose-response modelling was performed with the software package PROAST. This package allows for dose-response analysis with covariates. This makes it possible to perform combined analyses of clustered sets of similar datasets related to different chemicals by assuming that the potencies of the chemicals differ, but not the shape parameters of dose-response model (see above). This assumption appeared to be satisfied by the data considered, at least
approximately so.
2.3 Steps of analysis
To overall analysis consisted of the following steps.
- A large datasheet was created for the hMN data with columns dose
(mg/kg/day), mean response, Standard Error of the Mean (SEM), group size, and a number of relevant factors (chemical tested, sex, strain, route of exposure, tissue (blood or bone marrow), exposure duration, sampling time (24 or 48 hours), or vehicle used in controls.
- Similarly, a large datasheet was created for the tumor data with columns
dose (mg/kg/day), number of animals with response, group size, and a number of relevant factors (chemical tested, sex, strain, route of exposure, exposure duration, duration of study, tissue, type of lesion, combination of lesion and tissue, severity of the response.
- In both datasheets, a column with study number was added, such that
dose-response data differing in any of the associated factors were labelled with a unique number.
- For each datasheet the total number of individual datasets was too large to
be analysed as a single combined dataset. Each datasheet was split up in a number of manageable clusters, with around 60 datasets max. Each cluster combined similar datasets like same route of administration, and/or same sex, etc.
- A dose-response model was fitted to each cluster of datasets, with individual
dataset as a covariate for parameter a (estimated response in controls) and for parameter b (potency of the dose-response), and, in the case of hMN data, for the within group variance. In this way, the steepness of the curves is estimated from all dose-response data in the cluster, since it is assumed to be constant among the individual studies.
- For each cluster of datasets, the confidence intervals were calculated for the
BMD related to each individual dataset.
- The CIs for all hMN clusters were combined and the columns with the
associated factors were added. The same was done for the tumor clusters.
- The hMN and tumor CIs were combined in a single table, such that for
matching chemicals each genotoxic study with a CI matches each tumor study with a CI, and vice versa. The factors related to the hMN and to the tumor studies were maintained as additional columns.
- The CIs, or the geometric means of the intervals related to matching
chemicals were plotted against each other. Any of the factors in the table could be used to mark the points. In this way, the impact of each factor could be further examined.
3
Results
From the 54 compounds considered, three were omitted: TIO as it resulted in (two-sided) infinite BMD CI for all micronucleus data considered, DPO as there were no micronucleus data available, and AZA because it was tested in a genetically modified strain (MM). Thus, 51 chemicals were left for further analysis.
All hMN and carcinogenic BMDs were plotted against each other in Figure 1. Even though the scatter is large, from this figure it can be concluded that a positive (and approximately linear) correlation between the hMN potency of a compound and its carcinogenic potency exists. The large scatter and low
correlation coefficient (Pearson’s r = 0.35) could hardly be better given the large variability in BMDs within the same compounds, in the X-direction (hMN), and even more so in the Y-direction (carcinogenicity). The latter could partly be due to the fact that the carcinogenic dose-response datasets varied in important factors like study duration (and exposure duration), and lesion class description of the endpoint considered. A first exploration did not reveal which factors contributed systematically to the variation in BMDs within compounds, apart from the factor ‘lesion severity’ in the carcinogenicity studies.
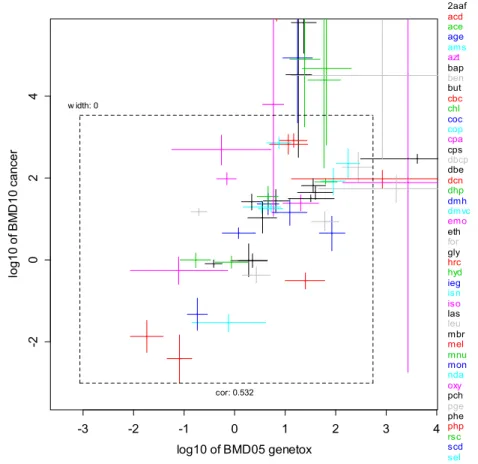
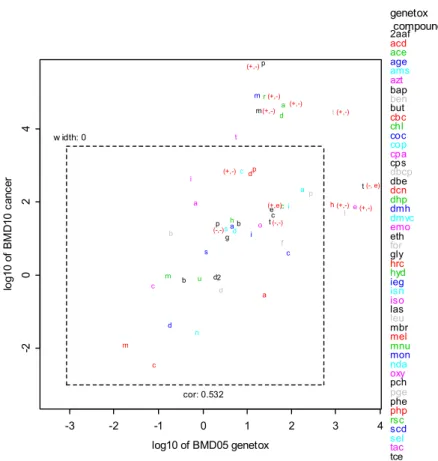
The next question is to what extent the carcinogenic potency (BMD) can be estimated from the hMN potency (BMD). Normally, the lowest carcinogenic BMD is selected as a point of departure (PoD) in risk assessment. Figure 2 shows the correlation between the lowest hMN and lowest carcinogenic BMDs (for any lesion category), each selected from all datasets available for a given compound. In this figure, the CI in both directions were plotted and from this figure, we noted that some of the CIs in the right upper corner have infinite upper bounds, but the lower bounds are in line with the overall correlation. This Figure contains 7 compounds in category A, 1 compound in category B, 3 compounds in
category C, 11 compounds in category D, 3 compounds in category E, 21 compounds in category F, and 5 compounds in category G (See Appendix 2 for summary of the hMN and tumor BMDs).
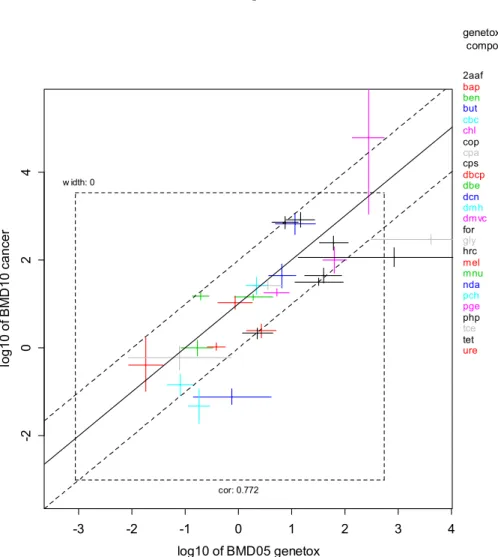
As already noted, part of the scatter in the correlation is due to the different ‘lesion classes’ for the endpoint considered representing different descriptions of malignant or potentially pre-malignant lesions. Indeed, the scatter can be reduced by selecting one lesion category. Figure 3 shows the results for lesion category D (defined as tissue-specific tumor, see section 2.1 for lesion category definitions). The middle smooth line represents all points where the tumor BMD10 is ten times higher than the hMN BMD05. Hence, if all points would lie on this line, the carcinogenic BMD10 would be predicted by multiplying the hMN BMD05 by a scaling factor of 10. Note that this value of the scaling factor specifically holds for the value for the BMR chosen for the hMN BMD; if a higher value than 5% been chosen, this scaling factor would have been found to be lower (possibly lower than 1). Obviously, both the uncertainty in BMDs
(represented by the confidence intervals) and the scatter among the points need to be taken into account. Most of the associated uncertainty/variability can be captured by the two dotted lines, representing a factor of 10 higher/lower than the middle smooth line. Taking a specific hMN BMDL05 (i.e. BMD05 lower bound) which lies exactly on the lower dotted line, multiplying that value by ten would result in a ‘best’ estimate of the tumor BMD. When that value is
resulting value would be back on the dotted line, and the associated value on the y-axis would now represent a conservative estimate of the tumor BMD.
d d d d d d d d d d d d d d d d d d d d d d d b b b b b b b b b b b b b b b b b b b b b b b b b b b b b b b b b b b b b b b b b b b b b b b b b b b b b b b b b b b b a a a a i i i i i i i i i i i i i i i i i i p p p p p p p p m m aa aa mm c c c c c c d d d d a a a a a a a a a a a a d d d d o o o o o o g g g g g g g g g g g g g g g g g g g g g g g g g g g g g g g g g g g g g g g g g g g g g g g g g g g g g g g g g g g g g g g g g g g g g g g g g g g g g g g g g g g g g g g g g g g g g g g g g g g g g g g g g g g g g g g g g g g g g g g g g g g g g g g g g g g g g g g g g g g g g g g g g g g g g g g g g g g g g g g g g g g g g s s b b b b b b b b b b b b b b b b b b b b b b b b b b b b b b b b b b b b b b b b b b b b b b b b b b b b b b b b b b b b b b b b b b b b b b b b b b b b b b b b b b b b b b b b b b b b b b b b b b bb b b b b b b b b b b b b b b b b b b b b b b b b b b b b b b b b ccc c f f f f f f h c c c c c c c c m m d t t p h h r r e e ee ee c c c c c c c c c e e e m m m m m c c c c c c c c n n n n n n n n n n n n d d d d d d d d d d d d d d d d d d d d d d c c c cc c c c c c cc c c c c c cc c c c c c cc c c 2 2 2 2 2 2 2 2 2 2 2 2 2 2 2 2 2 2 2 2 2 2 2 2 2 2 2 2 2 2 2 2 2 2 2 2 2 2 2 2 2 2 2 2 2 2 2 2 2 2 2 2 2 2 2 2 2 2 2 2 2 2 2 2 2 2 2 2 2 2 2 2 2 2 2 2 2 2 2 2 2 2 2 2 2 2 2 2 2 2 2 2 2 2 2 2 2 2 2 2 2 2 2 2 2 2 2 2 2 2 2 2 2 2 2 2 2 2 2 2 2 2 2 2 2 2 2 2 2 2 2 2 2 2 2 2 2 2 2 2 2 2 2 2 2 2 2 2 2 2 2 2 2 2 2 2 2 2 2 2 2 2 2 2 2 2 2 2 2 2 2 2 2 2 2 2 2 2 2 2 2 2 2 2 2 2 2 2 2 2 2 2 2 2 2 2 2 2 2 2 2 2 2 2 2 2 2 2 2 2 2 2 2 2 2 2 2 2 2 2 2 2 2 2 2 2 2 2 2 2 2 2 2 2 2 2 2 2 2 2 2 2 2 2 2 2 2 2 2 2 2 2 2 2 2 2 2 2 2 2 2 2 2 2 2 2 2 2 2 2 2 2 2 2 2 2 2 2 2 2 2 2 2 2 2 2 2 2 2 2 2 2 2 2 2 2 2 2 2 2 2 2 2 2 2 2 2 2 2 2 2 2 2 2 2 2 2 2 2 2 2 2 2 2 2 2 2 2 2 2 2 2 2 2 2 2 2 2 2 2 2 2 2 2 2 2 2 2 u u u u u u u u u u u u u u u u u u u u u u u u u u u u u u u u u u u u u u u u u u u u u u u u u u u u u u u u u u u u u u u u u u u u u u u u u u u u u u u u u u u u u u u u u u u u u u u u u u u u u u u u u u u u u u u u u u u u u u u u u u u u u u u u u u u u u u u u u u u u u u u u u u u u u u u u u u u u u u u u u u u u u u u u u u u u u u u u u u u u u u u u u u u u u u u u u u u u u u u u u u u u u u u u u u u u u u u u u u u u u u u u u u u u u u u u u u u u u u u u u u u u u u u u u u u u u u u u u u u u u u u u u u u u u u u u u u u u u u u u u u u u u u u u u u u u u u u u u u u u u u u u u u u u u u u u u u u u u u u u u u u u u u u u u u u u u u u u u u u u u u u u u u u u u u u u u u u u u u u u u u u u u u u u u u u u u u u u u u u u u u u u u u u u u u u u u u u u u u u u u u u u u u u u u u u u u u u u u u u u u u u u u u u u u u u u u u u u u u u u u u u u u u u u u u u u u u u u u u u u u u u u u u u u u u u u u u u u u u u u u u u u u u u u u u u u u u u u u u u u u u u u u u u u u u u u u u u u u u u u u u u u u u u u u u u u u u u u u u u u u u u u u u u u u u u u u u u u u u u u u u u u u u u u u u u u u u u u u u u u u u u u u u u u u u u u u u u u u u u u u u u u u u u u u u u u u u u u u u u u u u u u u u u u u u u u u u u u u u u u u u u u u u u u m m bb b b b b b b b b b b b b b b b b b b b t t t t t t t t p p p t t t t p p p p p p p p p p p p p p p p p p p p p p p p p p p p p p p p p p p p p p p p p p p p p p p p p p p p p p p p p p p p p p p p p p p p p p p p p p p p p t t t t s s s s s s s s s s i i i i d a a a l l ll -3 -2 -1 0 1 2 3 4 -2 0 2 4 log10 of BMD05 genetox log1 0 o f B M D 10 c anc er compound 2aaf acd ace age ams azt bap ben but cbc chl coc cop cpa cps dbcp dbe dcn dhp dmh dmvc emo eth for gly hrc hyd ieg isn iso las leu mbr mel mnu mon nda oxy pch pge phe php rsc scd sel tac t w idth: 0 cor: 0.348
Figure 1. All hMN BMDs plotted against all carcinogenic BMDs (n = 1452 pairs of BMDs, related to 51 compounds). Note the large variation in BMDs within chemicals, both for the hMN and for the carcinogenic BMDs. The lower and left dashed lines of the inner block indicate the smallest nonzero lower confidence limit over all datasets; the right and upper dashed lines indicate the largest finite upper confidence limit over all datasets. So, outside these lines the uncertainty is infinite in the outer direction.
-3 -2 -1 0 1 2 3 4 -2 0 2 4 log10 of BMD05 genetox lo g1 0 o f B M D 1 0 ca ncer genetox compound 2aaf acd ace age ams azt bap ben but cbc chl coc cop cpa cps dbcp dbe dcn dhp dmh dmvc emo eth for gly hrc hyd ieg isn iso las leu mbr mel mnu mon nda oxy pch pge phe php rsc scd sel tac w idth: 0 cor: 0.532
Figure 2. The 90% CIs for the lowest carcinogenic BMD were plotted against the CIs for the lowest hMN BMD for the 51 chemicals considered. Upper confidence bounds that hit the outer frame are in fact infinite (See Appendix 2 for hMN and tumor BMD values).
- -3 -2 -1 0 1 2 3 4 -2 024 log10 of BMD05 genetox log10 of B M D 10 c anc er genetox compound 2aaf bap ben but cbc chl cop cpa cps dbcp dbe dcn dmh dmvc for gly hrc mel mnu nda pch pge php tce tet ure w idth: 0 cor: 0.772
Figure 3. Lowest carcinogenic BMD for lesion category D against lowest hMN BMD (n = 26 compounds). The 90%-CIs are plotted in both directions. The middle solid line represents the case where the carcinogenic BMD10 is 10 fold higher than the hMN BMD05s. The upper and lower dotted lines are 10 times higher and lower than that (in both directions). So, the lower dotted line is the line where the hMN BMD05 is equal to the tumor BMD10. The confidence intervals for chemicals DMH and NDA are outside the lines, but their dose-response data were poor (e.g., only two nonzero doses) (see Appendix 3 for hMN and tumor BMD values).
4
Discussion
The aim of this report was to extend our initial study (Hernandez et al., 2011) which was based on only 18 compounds and to investigate whether BMDs from the in vivo hMN are correlated with carcinogenic BMDs. Increasing the number of compounds to 51 confirmed our earlier result (Hernandez et al., 2011) that the hMN potency of a chemical is correlated to its carcinogenic potency. There is remaining scatter in the correlation plots, but this could not have been otherwise given the observation that carcinogenic BMDs vary considerably within the same compounds. This variability can be partly explained by the fact that the
individual dose-response datasets (for a given compound) often relate to endpoints of different type and lesion category. Further, the individual datasets for a given compound may vary regarding other factors, such as study duration, route, strain, and sex. The individual dose-response datasets for the various chemicals form a complex database, and more work would be needed to see if systematic patterns could be revealed between the various factors involved and the resulting BMDs.
This analysis differed in approach to our previous study (Hernandez et al., 2011) in several ways. First, we analyzed 51 compounds, 138 micronucleus and 388 cancer bioassay data sets, in comparison to 18 compounds, 54 micronucleus and 224 cancer bioassay data sets in our previous study. Second, data were
analyzed separately in our previous study while the data were grouped into clusters for combined analyses in the present study. This was performed because combining datasets into clusters with chemical as a covariate generally leads to more precise BMD estimates, in particular for poor dose-response datasets that by themselves provide little information on the dose-response shape. Third, in the present study we only used hMN tests, while in the previous study we included various types of genotoxicity assays, including the transgenic rodent mutation assay and the comet assay.
Regarding the results, there were both similarities and differences between both studies. The correlation coefficients between lowest tumor BMD10 and lowest micronucleus BMD10 were similar in both studies: 0.54 in our previous analysis and 0.53 (Figure 2) in this study. Importantly, tumor lesion was taken into account in the present analysis, which was not the case in our earlier study, resulting in an improvement in the correlation to 0.77 (Figure 3). However, an important difference was that we found the tumor BMD to be proportional to the hMN BMD in the present study, while in the previous study the tumor BMD was proportional to (approximately) the square root of the genotoxic BMD. Further, in our present analysis we found an uncertainty factor of 10 would probably be sufficient, in comparison to an uncertainty factor of 100 in our earlier analysis (Hernandez et al., 2011).
The approach of producing correlation plots between hMN and carcinogenic potency of chemicals (Figures 1 to 3) challenges the way genotoxicity data are analyzed, in particularly the way we categorize chemicals as genotoxic or non-genotoxic, and the way we view false positive and false negative results in genotoxicity tests. As an illustration, we plotted the geometric means of the CIs in Figure 2, and indicated which chemicals were negative in the hMN and/or carcinogenicity test (Figure 4). Several examples from Figure 4 will be
highlighted to illustrate the advantages of using correlation plots, in comparison to traditional yes/no analysis. The first example concerns a set of chemicals (ACE, CPS, EMO, HRC, MBR, PHE, TAC, TEO, TIO and RSC) which are positive for
hMN and negative for carcinogenicity (+,- in Figure 4), and would be considered a false positive in the traditional approach. As Figure 4 shows, this set of
compounds does not deviate from the correlation plot. The fact that they are located in the right upper corner means that the hMN test correctly predicts them to have low carcinogenic potency (if any). The second set of examples are CHL (+/e) and TCE (-,e) where equivocal results were obtained in the
carcinogenicity study. In this case, both the hMN and the tumor BMDs were found to be high, and the hMN test correctly predicts that CHL and TCE are weak carcinogens. These examples illustrate how informative the correlation plot (Figure 4) is in gaining insight on the carcinogenic potency of chemicals using the estimated potency (BMD) from the in vivo hMN test. Thus, all ‘false positives’ and ‘false negatives’ in the database considered comply with the overall correlation plot. As Figure 4 shows, negative tests only occur in the right upper quarter of the plot (above around 1 mg/kg), but this region also includes many positives (for both tests). Clearly, highly potent compounds (i.e. low BMD) will virtually always be found to be positive, while lower potency chemicals have an increasing probability to result in a negative test outcome. Given that our data set had very few negative hMN and non-carcinogens, further analysis is needed to investigate whether negative hMN compounds provide useful information in regards to carcinogenic potency. This is of particular importance as analysis of hMN generally show low sensitivity for prediction of
carcinogenicity (Witt et al., 2000). It is clear from the aforementioned correlation plots that carcinogenic potency information can be derived from positive hMN compounds in this data set and our results are in line with the notion that a positive hMN is highly predictive of rodent carcinogenicity (Witt et al., 2000).
As illustrated by Figure 4, positive and negative test outcomes do not
necessarily provide a discrete distinction between compounds with or without the hazard considered. Overall, Figures 2, 3 and 4 show that different chemicals gradually differ in potency without any clear demarcation between highly and less potent chemicals because there is no gap between low and high BMDs, neither for hMN nor for carcinogenicity. Therefore, it is not possible to
objectively define the border between positive and negative chemicals (for hMN or for carcinogenicity). For purposes of classification and labelling, the boundary between positive and negative chemicals may be an appointed dose level that is based on consensus, using practical considerations such as maximally feasible or realistic doses.
Finally, results suggest that the lowest tumor BMD10 can be estimated from in
vivo micronucleus BMDL05s (lower confidence bound of BMD05) by multiplying
the latter by a scaling factor of 10. Here, the uncertainty in the MN BMD05 is taken into account by using the BMDL05 as the starting point. This value would predict the tumor BMD10 within an uncertainty range of around two orders of magnitude (the true BMD10 might be a factor of 10 higher or lower with an overall uncertainty range of 100). Therefore, an uncertainty factor of only 10 would be sufficient to obtain a conservative estimate of the tumor BMD10. Altogether, these results demonstrate that the clastogenic potency from short-term studies may be used as an estimate of the carcinogenic potency, at least for compounds with a positive result in in vivo micronucleus studies.
d b a i i p m a c d a a d o g s b c f h c m d t p h r e c e m c n d c 2 u m b t p t p t s i d a l -3 -2 -1 0 1 2 3 4 -2 0 2 4 log10 of BMD05 genetox lo g10 of B M D 10 canc er genetox compound 2aaf acd ace age ams azt bap ben but cbc chl coc cop cpa cps dbcp dbe dcn dhp dmh dmvc emo eth for gly hrc hyd ieg isn iso las leu mbr mel mnu mon nda oxy pch pge phe php rsc scd sel tac tce teo w idth: 0 cor: 0.532 (+,-) (+,-) (+,-) (-, e) (-,-) (+,-) (-,-) (+,-) (+,-) (+,e) (+,-) (+,-)
Figure 4. Geometric means of the confidence intervals shown in Fig. 2, related to lowest hMN BMD and lowest tumor BMD for each chemical. Between brackets the micronucleus and tumor test outcome are given, respectively (+ for positive, - for negative and e for equivocal result). So, (-,+) would represent a false positive. If omitted, both test outcomes were positive. Note that the points outside the dashed box are rough approximations only, as their confidence limits had infinite upper bounds (See Appendix 2 for hMN and tumor BMD values).
4.1 Impact for risk assessment
Our results have a significant impact for risk assessment, both regarding hazard identification and hazard characterization.
4.1.1 Hazard identification
Our results show that there are only gradual differences in genotoxic (hMN) (or carcinogenic) potencies and suggest that a clear demarcation between negative and positive compounds is not distinguishable. To inform risk management decisions that require a yes/no answer to the question whether a chemical may be considered to be genotoxic (or carcinogenic) or not, is currently based on the associated statistical test being significant or not. The outcome of significance tests is largely driven by coincidental experimental circumstances, and may be misleading, as illustrated in Figure 4. The approach of estimating the potency of the compound (in terms of BMD) is much more reliable. To translate this quantitative outcome into a yes/no answer, consensus would be needed as to where to draw the line on the potency (BMD) scale that distinguishes chemicals with the hazard from those without the hazard in a decision framework. For
instance, one might decide to demarcate chemicals with a BMDL05 below 1000 mg/kg body weight as genotoxic and above that level as non-genotoxic. This would be a better funded and more transparent way of classifying chemicals as compared to the current approach. Regulatory agencies should be responsible for determining their own demarcating dose values.
4.1.2 Hazard characterization
The practical impact of our results is that, in the absence of a carcinogenicity study, it may be possible to prepare a conservative estimate of the carcinogenic potency from a (short-term) in vivo micronucleus test. As Figure 3 showed, the carcinogenic BMD10 can, on average, be estimated by multiplying the
micronucleus BMDL05 (note the lower bound) by a scaling factor of 10. An uncertainty factor of 10 can account for the uncertainty of the correlation between micronucleus and tumor potency. Put together, the rodent genotoxicity BMDL05 can be directly used as a conservative estimate of the rodent tumor BMD10. This relationship is based on the results for carcinogenic BMD10s associated with effects of lesion category D (see Figure 3). For lesion categories C, E and F the average relationship also resulted in a scaling factor of 10, although the scatter in the correlations was slightly larger. A further analysis of the data (with the extensions mentioned above) should be performed to better substantiate the overall uncertainty in the correlation plots.
Overall, our findings have a significant impact on the way risk assessment is currently performed by providing an option of using the in vivo MN test for both hazard identification and hazard characterization.
4.2 Impact for study design
One possibility to further reduce the observed scatter in the correlation between hMN and carcinogenicity BMDs resulting from current studies is to improve the study designs of both carcinogenicity and hMN studies. Since the trend is to avoid carcinogenicity studies wherever possible, focus should primarily be on changes to improve the genotoxicity studies. Although OECD guidelines are currently available for the in vivo hMN test, these guidelines should be updated to improve the interpretation and applicability of the results. Here, we briefly discuss general statistical aspects of an optimal study design for the purpose of effectively quantifying the genotoxic potency of chemicals.
One thing to note in thinking about experimental designs using the BMD approach is that it is not driven by statistical power, but rather by statistical precision in estimating the potency (BMD) of the chemical. The precision of the BMD is determined by the total number of animals in the study rather than by individual group sizes. For this reason, experimental designs using the BMD approach can have fewer animals per dose and more doses without increasing the total number of animals used. Indeed, for a given total number of animals in the study, the precision as well as the accuracy can be improved by distributing the animals over more dose groups (keeping the total number of animals the same (Slob et al., 2005). Therefore, experimental designs of genotoxicity studies may provide better information for BMD analysis when six or more dose groups are employed. Although less animals per dose are used, the same information on inter-animal variability is obtained, with a gain of better understanding the dose-response relationship. Group sizes are important for approaches that rely on pairwise comparison of dose groups using significance testing but not in a dose-response analysis.
5
Conclusions
Our current and previous results (Hernandez et al., 2011) support the existence of a quantitative relationship between in vivo hMN potency and the carcinogenic potency.
The gradual variation in hMN potencies among chemicals challenges the current approach of assessing the genotoxicity of chemicals, usually based on
significance testing. The demarcation between genotoxic and non-genotoxic compounds is better set by appointing a value of the potency (BMD) based on biological or practical considerations.
The observation that chemicals show little variation in dose-response shapes supports our approach of analyzing datasets as combined clusters. In this way, BMDs could be better estimated for chemicals with limited dose-response data. More chemicals with ‘negative’ outcomes in the hMN test should be added to this analysis to check whether the hMN test for these chemicals predicts cancer potency. If not, it should be investigated if these chemicals can be covered by another genotoxicity test, e.g. one that measures mutations.
Overall, these results support the notion that cancer potency can be estimated from a positive in vivo micronucleus test in the absence of a 2-year cancer bioassay.
6
Future research
The analysis of the database from the 51 compounds in this study could be further extended by examining the following:
- Refine lesion categories: For the purpose of this first exploration of the
data, we devised a rough lesion categorization representing different descriptions of malignant or potentially pre-malignant lesions in each dose-response dataset. This should be revised by consulting with experts (cancer pathologists) and re-analyzing the database with the new categorization. - Include more compounds with ‘negative’ hMN results: It is possible
that some of these chemicals fall outside the correlation found in this study. If so, examination of other genotoxicity tests may fill this gap.
- Other in vivo genotoxicity tests: It would be useful to investigate to what
extent other genotoxicity tests (e.g. transgenic rodent mutation assay and comet assay) could predict the carcinogenic potency of chemicals and to what extend this analysis can complement the findings in this report. - Variable study conditions: Insight in study conditions involved in the
various micronucleus tests and carcinogenicity studies might reduce the scatter in the correlation plots even further. Therefore, a further
investigation of the impact of study conditions on the potency estimates would be very useful to improve the current OECD guidelines.
- Extended dose-response analysis: The present study used a 5% increase
in micronucleus frequency as the BMR. However, this value may have been too low for obtaining a reasonable BMD confidence interval. The correlation should be re-assessed based on a larger effect size (BMR) than 5% (e.g. 10-50%). This may result in a different scaling factor, while the uncertainty factor is expected to remain the same. In addition, the assumption that dose-responses are parallel on log-dose scale (for a given cluster of datasets) should be further validated.
- In vitro genotoxicity tests: Explore potency correlations between in vitro
genotoxicity tests and carcinogenicity. Even if a weaker correlation is observed, results can inform risk assessment, help improve testing
strategies, and possibly further reduce the number of animals currently used in evaluating the carcinogenic potential of chemicals. This is of particular importance for cosmetics where in vivo testing is no longer allowed.
7
Acknowledgements
We wish to thank Dr. Dan Levy from the U.S. Food and Drug Administration and Dr. Kristine L. Witt from the U.S. National Institute of Environmental Health Sciences for their expert advice. We wish also to thank Mrs. Lea Patrice McDaniel from the United States Food and Drug Administration for retrieving the data from the NTP database.
8
References
Asano, N., Hagiwara, T., 1992. The mouse peripheral blood micronucleus test with 2-acetylaminofluorene using the acridine orange supravital staining method. Mutat Res 278, 153-157.
Durling, L.J., Abramsson-Zetterberg, L., 2005. A comparison of genotoxicity between three common heterocyclic amines and acrylamide. Mutat Res 580, 103-110.
EFSA, 2009. European Food Safety Authority. Guidance of the scientific
committee on use of the benchmark dose approach in risk assessment. The EFSA Journal 1150, 1-72.
Hamada, S., Sutou, S., Morita, T., Wakata, A., Asanami, S., Hosoya, S., Ozawa, S., Kondo, K., Nakajima, M., Shimada, H., Osawa, K., Kondo, Y., Asano, N., Sato, S., Tamura, H., Yajima, N., Marshall, R., Moore, C., Blakey, D.H., Schechtman, L.M., Weaver, J.L., Torous, D.K., Proudlock, R., Ito, S., Namiki, C., Hayashi, M., 2001. Evaluation of the rodent micronucleus assay by a 28-day treatment protocol: Summary of the 13th
Collaborative Study by the Collaborative Study Group for the
Micronucleus Test (CSGMT)/Environmental Mutagen Society of Japan (JEMS)-Mammalian Mutagenicity Study Group (MMS). Environ Mol Mutagen 37, 93-110.
Heddle, J.A., Hite, M., Kirkhart, B., Mavournin, K., MacGregor, J.T., Newell, G.W., Salamone, M.F., 1983. The induction of micronuclei as a measure of genotoxicity. A report of the U.S. Environmental Protection Agency Gene-Tox Program. Mutat Res 123, 61-118.
Hernandez, L.G., Slob, W., van Steeg, H., van Benthem, J., 2011. Can carcinogenic potency be predicted from in vivo genotoxicity data? a meta-analysis of historical data. Environ Mol Mutagen 52, 518-528. Jacobson-Kram, D., Sistare, F.D., Jacobs, A.C., 2004. Use of transgenic mice in
carcinogenicity hazard assessment. Toxicol Pathol 32 Suppl 1, 49-52. Levy, D.D., McDaniel, L.P., Witt, K.L. , 2010. Analysis of micronucleus data in
the NTP database.
http://www.regulations.gov/#!documentDetail;D=FDA-2009-N-0519-0008.
Meli, C., Seeberg, A.H., 1990. Activity of 1,2-dimethylhydrazine in the mouse bone marrow micronucleus assay using a triple- and a single-dosing protocol. Mutat Res 234, 155-159.
Morita, T., Asano, N., Awogi, T., Sasaki, Y.F., Sato, S., Shimada, H., Sutou, S., Suzuki, T., Wakata, A., Sofuni, T., Hayashi, M., 1997. Evaluation of the rodent micronucleus assay in the screening of IARC carcinogens (groups 1, 2A and 2B) the summary report of the 6th collaborative study by CSGMT/JEMS MMS. Collaborative Study of the Micronucleus Group Test. Mammalian Mutagenicity Study Group. Mutat Res 389, 3-122.
OECD, 2008. Draft OECD guideline for the testing of chemicals, Test Guideline 451: Carcinogenicity studies.
http://www.oecd.org/dataoecd/30/46/41753121.pdf.
Sanner, T., Dybing, E., 2005. Comparison of carcinogenic and in vivo genotoxic potency estimates. Basic Clin Pharmacol Toxicol 96, 131-139.
Shimada, H., Suzuki, H., Itoh, S., Hattori, C., Matsuura, Y., Tada, S., Watanabe, C., 1992. The micronucleus test of benzo[a]pyrene with mouse and rat peripheral blood reticulocytes. Mutat Res 278, 165-168.
Slob, W., 2002. Dose-response modeling of continuous endpoints. Toxicol Sci 66, 298-312.
Slob, W., Moerbeek, M., Rauniomaa, E., Piersma, A.H., 2005. A statistical evaluation of toxicity study designs for the estimation of the benchmark dose in continuous endpoints. Toxicol Sci 84, 167-185.
Smith, C.C., Archer, G.E., Forster, E.J., Lambert, T.R., Rees, R.W., Lynch, A.M., 1999. Analysis of gene mutations and clastogenicity following short-term treatment with azathioprine in MutaMouse. Environ Mol Mutagen 34, 131-139.
Suzuki, T., Hayashi, M., Ochiai, M., Wakabayashi, K., Ushijima, T., Sugimura, T., Nagao, M., Sofuni, T., 1996. Organ variation in the mutagenicity of MeIQ in Big Blue lacI transgenic mice. Mutat Res 369, 45-49.
Vrzoc, M., Petras, M.L., 1997. Comparison of alkaline single cell gel (Comet) and peripheral blood micronucleus assays in detecting DNA damage caused by direct and indirect acting mutagens. Mutat Res 381, 31-40.
Witt, K.L., Knapton, A., Wehr, C.M., Hook, G.J., Mirsalis, J., Shelby, M.D., MacGregor, J.T., 2000. Micronucleated erythrocyte frequency in peripheral blood of B6C3F(1) mice from short-term, prechronic, and chronic studies of the NTP carcinogenesis bioassay program. Environ Mol Mutagen 36, 163-194.
Wout Slob
National Institute for Public Health and the Environment
P.O. Box 1 | 3720 BA Bilthoven www.rivm.com