RIVM report 330050001/2004
Surveillance of zoonotic bacteria in farm animals in the Netherlands
Results from January 1998 until December 2002
M. Bouwknegt, W.D.C. Dam-Deisz, W.J.B. Wannet, W. van Pelt, G. Visser, A.W. van de Giessen
This investigation has been performed by order and for the account of the Inspectorate for Health Protection and Veterinary Public Health, within the framework of project 330050, Bacterial Zoonoses.
Het rapport in het kort
De door de EU uitgevaardigde Zoönosen Richtlijn verplicht de Europese lidstaten om jaarlijks te rapporteren over het vóórkomen van ziekteverwekkende micro-organismen die van dier naar mens overdraagbaar zijn (zoönoseverwekkers). In dit kader voert het RIVM in opdracht van de Voedsel en Waren Autoriteit / Keuringsdienst van Waren (VWA/KvW) een surveillance-programma uit naar het voorkomen van zoönoseverwekkers bij landbouwhuisdieren in Nederland.
De prevalentie van Salmonella spp. in koppels leghennen is in de periode 1999-2002 significant gedaald, hetgeen mogelijk het gevolg is van beheersmaatregelen die de pluimveeindustrie heeft getroffen. De prevalentie-schattingen voor Salmonella spp. in koppels vleeskuikens leverden nog geen dalende trend op, hoewel een aanzienlijke daling in 2002 werd geconstateerd. De salmonella-prevalentie in koppels vleesvarkens vertoonde een dalende trend tussen 2000-2002. Het salmonella-besmettingspercentage bij melkkoeien en vleeskalveren bleef op een constant, relatief laag niveau.
De prevalentie van Campylobacter spp. in koppels vleeskuikens vertoonde geen stijgende of dalende trend tussen 1998 en 2002, hetgeen in grote lijnen overeen komt met data afkomstig uit de pluimveevleesindustrie.
De prevalentieschattingen voor E. coli O157 in koppels melkkoeien en vleeskalveren namen toe in de periode 2000-2002. Het merendeel van de E. coli O157-isolaten betrof Shigatoxine-producerende E. coli (STEC) O157, welke bacteriën potentieel ziekteverwekkend zijn voor de mens. De toename van STEC O157 bij melkvee en vleeskalveren kan leiden tot een verhoogd risico van STEC-infecties bij de mens.
Short abstract
The EU Zoonoses Directive obliges the Member States to collect data on the occurrence of zoonotic agents in animal populations. For this purpose, since April 1997, the RIVM conducts a national programme for surveillance of zoonotic bacteria in farm animals in order of and in collaboration with the Inspectorate for Health Protection and Veterinary Public Health (VWA/KvW).
The prevalence of Salmonella spp. in laying hens has significantly decreased in the period 1999-2002, which might indicate that the control measures taken by the poultry industry were effective. Prevalence estimates for Salmonella spp. in broiler flocks, in 1999-2002, did not yet yield a decreasing trend. The prevalence of Salmonella spp. in finishing pigs showed a decreasing trend between 2000 and 2002. The prevalence of Salmonella spp. in dairy cattle and veal calves remained at a relatively low level during the study period.
The prevalence of Campylobacter spp. in broiler flocks did not increase nor decrease continuously between 1998 and 2002, which roughly corresponds with the monitoring results from the poultry industry.
The prevalence estimates for E. coli O157 in dairy cattle and veal calves increased in the period 2000-2002. The vast majority of the E. coli O157-isolates concerned Shiga toxin-producing E. coli (STEC) O157. The increase of STEC O157 in dairy and veal herds may yield an increased risk of STEC O157 infections in humans.
Preface
For the successful realisation of this surveillance programme, the input of the colleagues of the Inspectorate for Health Protection and Veterinary Public Health (VWA/KvW) was essential and indispensable. Many samples were collected routinely and questionnaires with numerous questions were completed, enabling the analyses presented in this report and in other publications. Also, the comments and suggestions received from Rob van Oosterom (VWA) were valuable for the preparation of this report.
Secondly, we would like to acknowledge the contributions of the Animal Health Service (GD) and the Foundation for Quality Guarantee of Veal (SKV) performing the selection of flocks/herds to be sampled and for contacting the selected farm holders.
Furthermore, we would like to acknowledge our colleagues of the Diagnostic Laboratory for Infectious Diseases and Perinatal Screening (LIS) for serotyping the isolates.
Finally, we thank the farm holders who were willing to contribute to this voluntary programme.
Contents
Samenvatting 7
Summary 9
1. Introduction 11
2. Materials and Methods 15
2.1 Programme design 15 2.2 Microbiological examination 16 2.2.1 Salmonella spp. 16 2.2.2 Campylobacter spp. 17 2.2.3 E. coli O157 17 2.3 Questionnaires 18 2.4 Data analyses 18 2.5 Available data 19 3. Results 21 3.1 Descriptive results 21
3.1.1 Primary sample sizes 21
3.1.2 Geographical distribution of sampled farms 21
3.1.3 Age distribution 22
3.1.4 Flock-/herdsize distribution 23
3.2 Salmonella spp. 24
3.3 Campylobacter spp. 27
3.4 E. coli O157 27
3.5 Potential risk factors for Salmonella spp. in finishing pigs 29
3.6 Potential risk factors for E. coli O157 in veal calves 29
4. Discussion 31
References 39
Appendix 1 Primary sample size calculations 45
Appendix 2 Geographical distribution of sampled flocks/herds 50
Appendix 3 Adjustments of prevalence estimates for inadequacies in geographical spread of sampled
flocks/herds 55
Appendix 4 Isolated salmonella serotypes per animal species per year 56 Appendix 5 Seasonal variation of salmonella presence in layer, broiler and finishing pig flocks 58
Appendix 6 Seasonal variation of campylobacter presence in broiler flocks 59 Appendix 7 Seasonal variation of E. coli O157 presence in dairy and veal calf herds 60 Appendix 8 Comparison of seasonal variation of E. coli O157 in humans and cattle 61 Appendix 9 Comparison of results from different monitoring programmes in the Netherlands 62
Samenvatting
De door de EU uitgevaardigde Zoönosen Richtlijn verplicht de Europese lidstaten om jaarlijks te rapporteren over het vóórkomen van ziekteverwekkende micro-organismen die van dier naar mens overdraagbaar zijn (zoönoseverwekkers). In dit kader voert het Rijksinstituut voor Volksgezondheid en Milieu (RIVM) in opdracht van de Voedsel en Waren Autoriteit / Keuringsdienst van Waren (VWA/KvW) een surveillance-programma uit naar het voorkomen van zoönoseverwekkers bij landbouwhuisdieren in Nederland. In de periode 1998-2002 zijn daartoe wekelijks mestmonsters genomen van leghennen, vleeskuikens, vleesvarkens, melkkoeien en vleeskalveren en onderzocht op de aanwezigheid van Salmonella spp.. Daarnaast zijn de monsters van vleeskuikens onderzocht op het vóórkomen van Campylobacter spp. en de monsters van melkkoeien en vleeskalveren op het vóórkomen van E. coli O157. De hoofddoelstelling van dit onderzoek is inzicht te verkrijgen in (trends in) het vóórkomen van deze zoönotische bacteriën bij landbouwhuisdieren. Deze informatie is onder meer van belang om effecten van genomen maatregelen in productiesectoren te kunnen evalueren. Daarnaast worden risicofactoren voor besmetting van landbouwhuisdieren met deze zoönosenverwekkers geïdentificeerd en gekwantificeerd, om daarmee een mogelijke basis te verschaffen voor gerichte interventiestrategieën. Tevens worden de resultaten van de surveillance gebruikt om epidemiologische verbanden te onderzoeken tussen het vóórkomen van deze pathogene micro-organismen bij deze landbouwhuisdieren en het optreden van infecties bij de mens, middels typeringen van isolaten.
De prevalentie van Salmonella spp. in koppels leghennen is significant gedaald in de periode 1999-2002. Deze dalende trend is mogelijk het gevolg van beheersmaatregelen die de pluimveeindustrie heeft getroffen. De prevalentieschatting in 2002 bedroeg 13%, waarbij één derde van de positieve koppels besmet was met S. Enteritidis. De prevalentie-schattingen voor Salmonella spp. in vleeskuikens, in 1999-2002, leverden nog geen dalende trend op. Echter, de afname in prevalentie gemeten in 2002 en de lagere salmonella-besmettingspercentages op de boerderij gemeten door de pluimveeindustrie zelf en in kipproducten in de detailhandel door de Keuringsdienst van Waren suggereren dat de toegepaste beheersmaatregelen in deze sector effect hebben. De geschatte salmonella prevalentie voor vleeskuikens was 11% in 2002, waarbij één derde van de positieve koppels was besmet met S. Paratyphi B var. Java. De salmonella prevalentie in vleesvarkens vertoonde een dalende trend tussen 2000-2002, met een geschat besmettingpercentage van 30% in 2002. De helft van deze besmettingen werd veroorzaakt door S. Typhimurium, waarvan circa 20% behoorde tot het multiresistente faagtype DT104. Opmerkelijk was de isolatie van DT104 uit vleeskuikens (n=1), melkkoeien (n=4) en vleeskalveren (n=6). Het salmonella-besmettingspercentage voor melkkoeien en vleeskalveren bleef op een constant, relatief laag niveau. S. Typhimurium werd het meest frequent geïsoleerd, maar ook S. Dublin werd relatief frequent geïsoleerd.
De prevalentie van Campylobacter spp. in vleeskuikens vertoonde geen stijgende of dalende trend tussen 1998 en 2002. Dit komt in grote lijnen overeen met data afkomstig uit de pluimveevleesindustrie. Het besmettingspercentage fluctueerde rond de 20%, met C. jejuni als meest voorkomende campylobacter-soort.
De ruwe prevalentieschatting voor E. coli O157 in melkkoeien is toegenomen in de opeenvolgende jaren, met een schatting van 14% in 2002. Er was echter nog geen sprake van een statistisch significante toenemende trend in de periode 2000-2002. Voor vleeskalveren is een nagenoeg continue stijging waargenomen (Ptrend<0.08), resulterend in een prevalentie-schatting van 24% in 2002. Deze toenemende trend kan grotendeels worden toegeschreven aan een toename in het aandeel rosévleesbedrijven in de steekproef in combinatie met een toename van E. coli O157 binnen dit type vleeskalveren. Het merendeel van de E. coli O157- isolaten van melkkoeien en vleeskalveren bezat één of twee stx-genen die coderen voor productie van Shigatoxine en zijn daarmee potentieel humaan-pathogene bacteriën. De toename van Shigatoxine-producerende E. coli (STEC) O157 bij melkvee en vleeskalveren kan leiden tot een verhoogd risico van STEC-infecties bij de mens. In dit surveillance-programma is geen onderzoek gedaan naar het voorkomen van STEC van een ander serotype dan O157. Gelet op de wereldwijde toename van non-O157 STEC-infecties, dient uitbreiding van de bestaande surveillance-programma’s, zowel bij landbouwhuisdieren als bij de mens, overwogen te worden.
Summary
The EU Zoonoses Directive obliges the Member States to collect data on the occurrence of zoonotic agents in animal populations. For this purpose, since April 1997, the RIVM conducts a national programme for surveillance of zoonotic bacteria in farm animals in order of and in collaboration with the Inspectorate for Health Protection and Veterinary Public Health (VWA/KvW). In 1998-2002, the programme focussed on Salmonella spp. in laying hens, broilers, finishing pigs, dairy cattle and veal calves, Campylobacter spp. in broilers and E. coli O157 in dairy cattle and veal calves. The main objective of the programme is to monitor trends in the annual prevalences of these zoonotic bacteria in farm animals. Besides, this information is used to monitor the effects of control measures implemented by the industry. Furthermore, risk factors for contamination of farm animals with these zoonotic bacteria are identified and quantified to provide a basis for intervention strategies. Additionally, the occurrence of certain types of bacteria prevailing in animals is related to those causing disease in humans.
The prevalence of Salmonella spp. in layer flocks has significantly decreased in the period 1999-2002. This decreasing trend might indicate that the control measures taken by the poultry industry were effective. The estimated salmonella prevalence in 2002 was 13%, with S. Enteritidis accounting for one third of the positive flocks. Prevalence estimates for Salmonella spp. in broiler flocks, in 1999-2002, did not yet yield a decreasing trend. However, the decrease in salmonella prevalence measured in 2002 as well as the decreasing contamination percentages measured in the poultry meat production chain by the poultry industry and in poultry products at retail by the VWA/KvW indicate that the intervention measures implemented by the poultry industry might have an effect. The estimated salmonella prevalence in 2002 was 11%, with S. Paratyphi B var. Java accounting for one third of the salmonella positive flocks. The prevalence of Salmonella spp. in finishing pigs showed a decreasing trend between 2000 and 2002, with an estimate of 30% in 2002.
S. Typhimurium accounted for half of the salmonella positive herds in the last two years, with multiresistant phagetype DT104 accounting for approximately 20% of the positive herds. Notable was the isolation of DT104 from broilers (n=1), dairy cattle (n=4) and veal calves (n=6) between January 2001 and December 2002. The prevalence of Salmonella spp. in dairy cattle and veal calves remained at a relatively low level during the study period,
S. Typhimurium being the most frequently isolated serotype.
The prevalence of Campylobacter spp. in broiler flocks did not increase nor decrease continuously between 1998 and 2002, which roughly corresponds with the monitoring results from the poultry industry. In 1999-2002, the estimated flock prevalence roughly averaged around 20%, with C. jejuni being the predominant species.
The crude prevalence estimates for E. coli O157 in dairy herds increased in subsequent years, resulting in a prevalence estimate of 14% in 2002. However, a significantly increasing trend in the period 2000-2002 was not yet present. The prevalence of E. coli O157 in veal herds increased in the period 2000-2002, yielding an estimate of 24% in 2002. This increasing trend
nearly reached statistical significance (P<0.08) and can largely be attributed to an increase in the fraction of pink veal herds in the sample during the study period combined with an increase in the prevalence of E. coli O157 in this type of veal herds. The vast majority of the E. coli O157-isolates obtained from dairy cattle and veal herds possessed at least one of the two stx-genes encoding for Shiga toxin-production and can thus be considered potentially pathogenic to humans. The increase of Shiga toxin-producing E. coli (STEC) O157 in dairy and veal herds may yield an increased risk of STEC O157 infections in humans. In view of the world-wide emergence of non-O157 STEC infections, extension of the existing surveillance programmes, both in public health laboratories and in farm animals, towards detection of non-O157 STEC serogroups should be considered.
1 Introduction
Zoonotic micro-organisms transmitted to humans through food of animal origin pose a continuous problem to veterinary public health authorities. An important group of zoonotic agents are the zoonotic bacteria causing gastroenteritic symptoms, such as Salmonella spp., Campylobacter spp. and Shiga toxin-producing E. coli O157 (STEC O157). World-wide, gastroenteritis is considered a serious public health problem with a significant impact on both economy and society (11). A recent sentinel study on human gastro-enteritis in general practices in the Netherlands has yielded an estimated incidence of 79.7 per 10,000 person years in the period 1996–1999 (17). The majority of these bacterial infections were caused by Campylobacter spp., being responsible for 10% of the cases. Salmonella spp. were associated with 4% of the cases. In 1999-2000, a study was conducted in the Dutch general population indicating a total number of cases of campylobacteriosis and salmonellosis of approximately 100,000 and 50,000, respectively (18). Estimates of the incidences of campylobacteriosis and salmonellosis in the general population for 2002 were roughly 105,000 and 35,000 cases, respectively (6).
The main campylobacter species causing disease in humans are C. jejuni (accounting for the vast majority of the cases) and C. coli (46). In developed countries world-wide, campylobacter infections in humans have been mainly associated with the consumption of undercooked poultry meat (51; 1), consumption of raw milk (55) or untreated drinking water (2), direct contact with pets (2), foreign travel (17) and, to a lesser extent, with pork (52). In the Netherlands, 30.5% of chicken products sampled at retail in 2000 and 32.5% in 2001 were contaminated with campylobacters, whereas pork samples were not found to be contaminated (63; 64).
For many decades, Salmonella enterica subspecies enterica serovar Typhimurium
(S. Typhimurium) was the predominant salmonella serotype in humans in the Netherlands. However, from 1988, Salmonella enterica serovar Enteritidis (S. Enteritidis) has emerged as a major serotype in man, with PT4 being the most prevalent phagetype. In 1995 this serotype accounted for approximately 50% of the salmonella infections in humans, but the contribution of this serotype has slightly declined in the last few years (40). S. Enteritidis infections have predominantly been associated with the consumption of raw eggs and egg-containing foods (54). Over the past years, in many countries, including the Netherlands, S. Typhimurium phagetype DT104 has emerged in humans as well as farm animals (8; 40; 74). S. Typhimurium DT104 is multi-resistant to antibiotics and there are indications that the clinical course of infections with this specific phagetype in humans is more severe in comparison with other salmonella infections (71). In the Netherlands, pigs and cattle appear to be main reservoirs of S. Typhimurium DT104 (68). Salmonella infections in humans have mainly been associated with consumption of (undercooked) foods of animal origin.
Shiga toxin-producing Escherichia coli (STEC), and especially E. coli O157, has been shown in the past 10-15 years to be an important zoonotic agent causing haemorrhagic colitis (HC) in humans, with potentially further complications, such as the haemolytic uraemic syndrome (HUS) (37; 56). HUS is characterised by acute renal failure. Young children (0–4 years of age) and the elderly are particular risk groups. In the Netherlands, approximately 20 children are seriously affected with HUS per year (29). In 2002, 49 human cases were diagnosed with a STEC O157 infection, 27% of these cases developed HUS (22).
Cattle acts as the main reservoir for this particular serotype of E. coli (31) and contaminated beef products, raw milk and direct contact with farm animals are considered the main routes of transmission (66; 32). The virulence of STEC has been associated with the ability of toxin production, mediated through the Shiga toxin genes (stx1 and stx2). Also, the presence of the E. coli attaching and effacing gene (eae-gene) has been associated with pathogenicity. This gene enables the pathogen to attach to the intestine wall and efface the lumen.
In 1997, the Dutch Product Boards for Livestock, Meat and Eggs (Productschappen Vee, Vlees en Eieren (PVE)) have implemented monitoring and control programmes in the poultry meat and egg production chains to reduce salmonella and campylobacter contamination of poultry meat, and S. Enteritidis and S. Typhimurium contamination of laying hens (5; 4). These programmes include amongst others microbiological examination of flocks at each stage of the production chain, application of strict hygiene measures throughout the production chain and a logistic slaughtering procedure for broiler flocks.
Adequate control of the above mentioned bacteria and other zoonotic agents in the food production chain largely depends on the availability of reliable data on the occurrence of these agents both at farm animal level and at retail level. In view of this need, the Zoonosis Directive (92/117/EEC) issued by the European Commission in 1992, obliges all Member States to report on the occurrence of zoonoses and zoonotic agents annually. In this context, the Inspectorate for Health Protection and Veterinary Public Health (Keuringsdienst van Waren (KvW)), part of the Food and Consumer Product Safety Authority (VWA), monitors, for instance, salmonella and campylobacter contamination of chicken products in retail stores. Within the same context, in 1997, the VWA/KvW commissioned the National Institute for Public Health and the Environment (Rijksinstituut voor Volksgezondheid en Milieu (RIVM)) to implement a surveillance programme in farm animals in the Netherlands with the main objective to monitor trends in the occurrence of zoonotic bacteria. In the period 1997-2002, the programme focussed on Salmonella spp., Campylobacter spp. and E. coli O157 in laying hens, broilers, finishing pigs, dairy cattle and veal calves. In addition to monitoring trends, the occurrence of certain types of bacteria prevailing in animals was related to those causing disease in humans. Also, essential data on farm and flock/herd characteristics were gathered to perform risk factor analyses (RFAs). Results can be used in the developmental stage of intervention strategies.
The results of the surveillance programme obtained in 1997-2000 are described in previous reports (10; 30). The current report describes the results of the surveillance programme obtained from January 1998 through December 2002. First, the programme design is
described, followed by brief descriptions of the microbiological detection techniques used. Then, logistic aspects of the sampling procedure are described and prevalence estimates and observed trends are presented per pathogen. Additionally, two summaries of performed risk factor analyses (Salmonella spp. in finishing pigs and E. coli O157 in veal calves) are presented. Conclusively, a chapter is dedicated to discussion and conclusions.
2 Materials and Methods
2.1 Programme design
A two-stage sampling scheme (i.e. using a primary and secondary sample size) was used to accurately estimate the annual prevalence of the target bacteria in the farm animal populations at flock or herd level. For laying hens, broilers and veal calves, a flock/herd includes all animals of similar age housed within one building. A dairy herd includes all lactating cows; a herd of finishing pigs equals all animals housed in one barn, usually existing of several divisions and therefore including animals in various production stages and of diverse ages. The primary sample size specifies the number of flocks/herds to be sampled from the population to estimate the annual prevalence of the target bacteria. Input parameters include the predicted prevalences for the target bacteria for the year of interest, the total number of flocks/herds in the Netherlands as well the desired accuracy and confidence level. In this programme, the prevalence estimates are based on a 90% confidence level and an accuracy level ranging between 3% – 5% (depending on the prevalence, where a lower predicted prevalence resulted in a higher desired accuracy). The input parameters used and the results of the calculations are presented in Appendix 1A – E.
Selection of farms of laying hens, broilers, finishing pigs and dairy cattle from national databases was conducted by the Animal Health Service (Gezondheidsdienst voor Dieren (GD)). For this, stratification was applied according to five regions for all species and according to farm size for finishing pigs and dairy cattle. Subsequently, farms were randomly selected from these subgroups of the population. The Quality Guarantee of Veal (Stichting Kwaliteitsgarantie Vleeskalveren (SKV)) provided a sampling population for veal calves, stratified according to region and farm size. The owners of the selected farms were contacted by the GD/SKV through mail and asked for voluntary participation in the programme. After the response period, lists of the selected farms that were willing to co-operate were sent to the VWA/KvW for sampling.
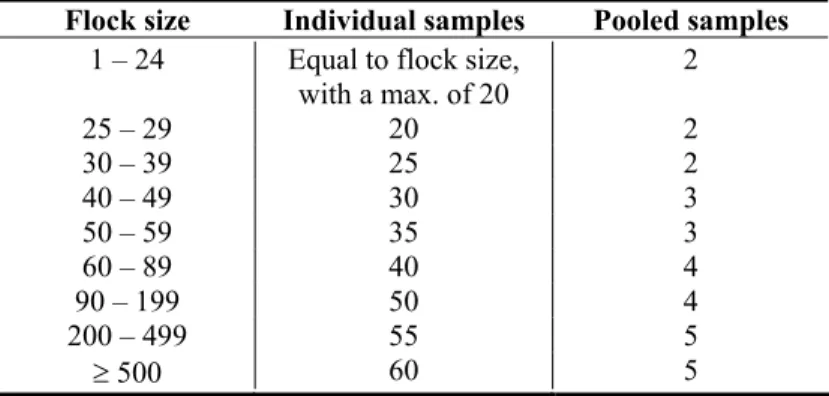
Sampling was conducted by VWA/KvW-employees according to a sampling protocol. If more than one flock/herd was present on the farm, one of them was randomly selected according to the flock/herd definition. The number of samples taken from a flock/herd (i.e. the secondary sample size) was based on a sample size calculation to detect a
5% contamination in a flock/herd with a reliability of 95%. Results of the calculations made
Table 2.1: Number of individual and pooled samples per flock, depending on flock size.
Flock size Individual samples Pooled samples
1 – 24 Equal to flock size,
with a max. of 20 2 25 – 29 20 2 30 – 39 25 2 40 – 49 30 3 50 – 59 35 3 60 – 89 40 4 90 – 199 50 4 200 – 499 55 5 ≥ 500 60 5
by the epidemiological computer programme WinEpiscope (19) are presented in Table 2.1. The appropriate number of faecal droppings was collected from the floor or – in case of laying hens – the manure conveyer. To reduce the number of samples, a number of individual samples was aggregated into pooled samples according to Table 2.1. The samples were transported to the RIVM in cooled transport boxes by a professional delivery service. Microbiological examination started within 48 hours.
In addition to the faecal samples, a questionnaire addressing farm- and flock/herd-specific information was completed in co-operation with the farm manager. Questionnaires were sent to the RIVM for use in analyses on risk factors and on representativeness of the sampled flocks/herd for the respective populations.
2.2 Microbiological examination
2.2.1 Salmonella spp.
For the detection of Salmonella spp. in the faecal samples, a RIVM standard operating procedure (MGB/M124) was used based on ISO 6579 (35; 47). In this procedure, several modifications of the ISO-method are included. No selenite/cystine medium for selective enrichment and no bismuth sulfite agar for selective isolation were used. These media are particularly useful for the detection of S. Typhi, a serotype that is not found in farm animals. For the selective enrichment of samples modified semisolid Rappaport-Vassiliadis (MSRV) was used in addition to the prescribed Rappaport-Vassiliadis (RV). Samples from layers and broilers were analysed with this medium from October 1998 onwards, samples from finishing pigs from 2000 and samples from veal and dairy herds from 2001.
From each pooled sample, 25 g was added to 225 ml of buffered peptone water (SVM, Bilthoven, the Netherlands; catalogue number E4900z) and incubated for 16 to 20 hours at 37 ± 1 oC. Of the pre-enrichment culture, 0.1 ml was inoculated in 10 ml RV broth (Oxoid, Haarlem, the Netherlands; cm866) and incubated for 2 x 24 ± 1 h at 42± 0.5 oC. After 24 h the culture was plated on brilliant green agar (BGA; Oxoid; cm329) and incubated for
24 ± 2 h at 37 ± 1 oC. If no suspect colonies were obtained, the RV-culture – after 48 h of incubation – was plated-out on BGA again and incubated under similar conditions. Preparation of MSRV (Difco; 1868-17), containing 0.01 g l-1 novobiocine (Sigma-Aldrich Chemie, Wyndrecut, the Netherlands; n1628), was done as described by the manufacturer. Three drops of the pre-enrichment culture were inoculated on this medium, followed by an incubation for 2 × 24 ± 3 h at 41.5 ± 1 oC. White colonies were transferred to BGA and handled as described for the RV procedure. Suspect colonies on BGA were biochemically confirmed using ureum agar with triple sugar iron agar (SVM; E6025z) and lysine-decarboxylase broth (SVM; E4000z). Positive isolates were sent to the National Salmonella Centre (Diagnostic Laboratory for Infectious Diseases and Perinatal Screening, RIVM, Bilthoven, the Netherlands) for sero- and phagetyping.
2.2.2 Campylobacter spp.
For the detection of thermophilic Campylobacter spp. a RIVM standard operating procedure (48) was used. For this, each pooled faecal sample was directly plated on Campylobacter blood-free selective agar (CCDA; Oxoid; cm739) using sterile swabs, followed by incubation for 44–52 hours at 42 ± 1 oC using the GENbox Microaër system (Biomerieux, Marcy, l’Etoile, France; 96125). Subsequently, plates were examined for the presence of suspect colonies and if present, one colony per plate was transferred to CCDA, inoculating colonies from positive pooled samples from the same flock/herd on the same plate. The microaerobic incubation procedure was repeated and characteristic campylobacter colonies were examined under a microscope for typical spiral-shaped cells and rapid motility. If the microscopic results were ambiguous, the Indx Campy agglutination test (Bipharma, Weesp, the Netherlands; 22000105) was performed additionally, as prescribed by the manufacturer. Up till 2001, one campylobacter isolate per positive pooled sample was stored in 2 ml peptone glycerol and subjected to the mixed polymerase chain reaction (PCR) method described by Van de Giessen et al. (58) at a later stage to discriminate C. coli from C. jejuni. In 2002, the species of the campylobacter isolates were not determined.
2.2.3 E. coli O157
Until January 2000, the pooled samples were aggregated further into one pooled sample per flock/herd and examined for the presence of E. coli O157. Since January 2000, all pooled samples were examined individually for the presence of this micro-organism. For this examination, a RIVM standard operating procedure MGB/M517 was used (49).
A portion of 10 g of the faecal sample was added to 90 ml of modified Trypton Soya Broth (mTSB; Oxoid; cm129) with 5 ml l-1 acriflavine and incubated in a glass jar for 7 ± 1 h at 37 ± 1 oC. One ml was subsequently added to a 1.5 ml vial with 20 µl anti-E coli O157 dynabeads (Dynal, Oslo, Norway; 71004) and incubated for 0.5 h at 20 ± 2 oC on a rotary shaker at 150 rotations per minute. Immuno magnetic separation (IMS) was performed by placing the substance in a Magnetic Partial Concentrator (Dynal) and aspirating the supernatant. The dynabeads were resuspended by adding 1 ml of wash buffer and again subjected to IMS. This was repeated twice, after which the dynabeads were resuspended in 100 µl wash buffer and mixed on a rotary shaker briefly. This solution was subsequently streaked onto sorbitol MacConkey agar (SMAC; Oxoid; cm813) enriched with 200 µl cefixime-solution and 200 µl tellurite-solution per 200 ml SMAC (CT-SMAC). These plates were incubated for 18 to 20 hours at 37 ± 1 oC, enabling screening for the presence of sorbitol-negative colonies. If present, 12 colonies were confirmed on SMAC supplemented with 0.1 g 4-methylbelliferyl-β-D-glucuronide (MUG; Sigma Chemical Co., St. Louis, MO; m9130) and on SMAC supplemented with 37.5 m l-1 eosin methylene blue agar (EMB; Oxoid; cm69). These were incubated at 37 ± 1 oC for 18 to 20 hours, after which screening for pink mauve metallic colonies on EMB and for achromatic colonies being non-fluoresecent to UV-light (302 nm) on SMAC+MUG was performed. These colonies were suspected to be E. coli O157 and subjected to an agglutination test (Murex, Kent, UK; zc60) to confirm the authenticity of the colonies. In addition, one isolate per flock/herd was serotyped at the Diagnostic Laboratory for Infectious Diseases and Perinatal Screening
Pˆ
(RIVM, Bilthoven). If the confirmation resulted in the identification of E. coli O157, the isolates were stored in 1 ml peptone glycerol and stored at -70 oC, and at a later stage subjected to PCR (49) for detection of the Stx-I, Stx-II and eae genes.
2.3 Questionnaires
Questionnaires were divided into three major sections addressing either farm specific information, flock/herd specific information or hygiene-related measures. Questionnaires were in Dutch and therefore not included in the appendices, but can be obtained from the last author upon request. Varying per animal species, the number of variables derived from the questionnaires ranged between 36 and 56.
In 1999, the questionnaires were structurally revised. Several questions were added, others removed, several open-ended questions were replaced by multiple choice questions and some questions were more elaborated, since the earlier questions did not yield the information aimed at. These changes influenced the initial structure of collected data for some variables, but in general improved the data quality.
2.4 Data analyses
Prevalence estimates were obtained by dividing the total number of positive flocks/herds by the number of examined flocks/herds per year and will be referred to as crude prevalence estimates from this point onward. Standard errors of the mean (sem) for this estimate were obtained through eqn. (1):
where equals the crude estimated prevalence and N indicates the sample size (57). Confidence limits were calculated by multiplying the sem with 1.64 (90% confidence level) and either subtract (lower confidence limit) or add (upper confidence limit) this product to the estimated crude prevalence. To assess the significance of differences in annual prevalence estimates, the method provided by Thrusfield (57) was applied.
Trend analyses were performed using multivariable logistic regression (MLR), by analysing a continuous variable (hereafter named ‘trend-variable’) that represented subsequent time periods of 3 months. Applying MLR enabled adjustments for other factors or circumstances, such as differences in age or flock/herdsize distribution between years or the non-sampling period in 2001 due to the Food-and-Mouth (FMD) disease epidemic. A trend was assumed to be present if the likelihood ratio test for the trend-variable yielded a significant P-value for the variable ‘year’ at the 95% confidence level.
The qualitative geographical analyses were performed with the SAS/GIS procedure in the statistical software package SAS (45). Statistics Netherlands (50) provided the geographical spread of farms in the Netherlands that were used for comparison with the geographical spread of sampled farms. The statistical tests for assessing differences between the geographical distribution of farms in the database and the actual distribution of farms in the Netherlands were based on the χ2-distribution.
N P P
Monthly data were examined for cyclic trends to detect possible seasonal fluctuations. A useful tool in that process is the smoothing of data, which is described by amongst others Diggle (20). The derivation of the equation we used (eq. 2) is described in the previous report (10).
2.5 Available data
No samples were taken from March 6th – July 9th 2001 due to an epidemic of Foot and Mouth Disease (FMD) in the Netherlands. No efforts were taken to compensate for the loss of sampled flocks/herds in the remainder period of that year, since laboratory capacity was insufficient to realise this. Details on the data from 1998 – 2000 are described in a previous report (10).
∑
∑
= − + − = + − + − + − + − − − × + × + × = 2 0 2 2 2 1 1 9 1 a t a a t i i a t a t a t a t a t a t t n n y n y n y s (2)3 Results
3.1 Descriptive results
3.1.1 Primary sample sizes
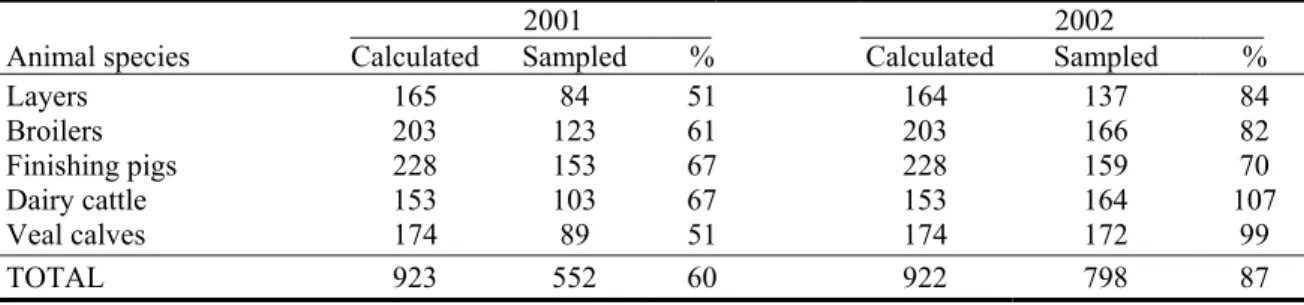
In 2001 and 2002, 1350 flocks/herds have been sampled in total (Table 3.1). In those two years, 60% and 87%, respectively, of the calculated sample sizes have been realised. In 2001, four months were lost due to the FMD-epidemic, giving an expected realisation of approximately 65%. However, in this year, realisation percentages for laying hens and veal calves were substantially lower. In 2002, the realisation of the sample size for laying hens, broilers and finishing pigs was insufficient to approach the desired accuracy; sample sizes for dairy cattle and veal calves were sufficiently large.
3.1.2 Geographical distribution of sampled farms
The graphical representation of the geographical spread of sampled flocks/herds is given in Appendix 2. Next to the figures, a comparison at provincial level is made between the percentage of the total sample size realised in a certain province and the percentage of the total number of farms present in that province.
For layers, the geographical spread of sampled farms corresponded with the actual spread of layer farms. No spatial clustering of salmonella positive flocks was observed. Similar findings were observed for broiler flocks, where areas with a larger number of farms were sampled more frequently. Salmonella and campylobacter positive flocks were observed throughout the country.
For finishing pigs, herds from the three central areas of the Netherlands were underrepresented in the sample of 2001. In contrast, the fraction of herds from the southern areas was larger in the database than in the Netherlands in both years (52% vs. 30% in 2001; 46% versus 30% in 2002). Salmonella positive herds were not restrained to a specific region. Dairy herds were mainly sampled in the north in both years. In 2002, this was further restricted to mainly one province (the three northwestern areas in the figure). Remarkable are the low fraction of dairy herds from the mid-eastern areas in 2001 and the small clusters of farms in the central-eastern areas in both years (one in 2001, three in 2002). Salmonella and E. coli O157 positive herds were observed throughout the country.
For veal calves, the sampled herds appear to be well distributed over the country, with more
Table 3.1: Comparison of the calculated sample sizes with the actual sample sizes and the realization percentages per animal species.
OO2001 OO2002
Animal species Calculated Sampled % Calculated Sampled %
Layers 165 84 51 164 137 84 Broilers 203 123 61 203 166 82 Finishing pigs 228 153 67 228 159 70 Dairy cattle 153 103 67 153 164 107 Veal calves 174 89 51 174 172 99 TOTAL 923 552 60 922 798 87
frequent sampling in areas harbouring more veal farms. Similar to dairy cattle, positive herds for Salmonella spp. and E. coli O157 were observed throughout the country.
In Appendix 3, adjustments for inadequacies in regional distribution of farms in the database are shown. All adjusted prevalence estimates changed ≤3% from the crude estimates, except for the estimate for salmonella in finishing pigs in 2001 (6% change).
3.1.3 Age distribution
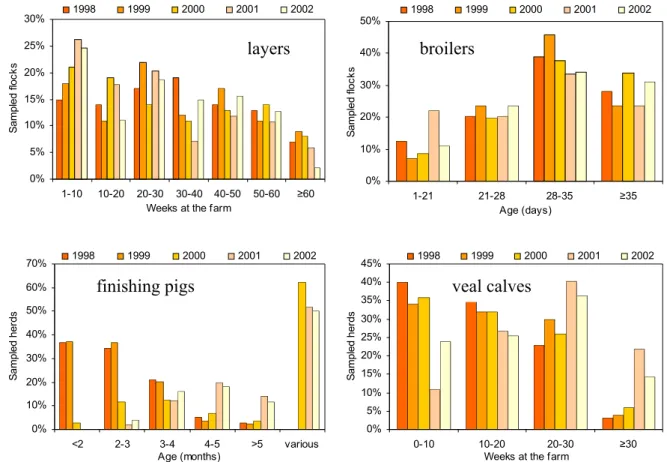
In Figures 3.1A-D, the relative distribution of age (broilers and pigs) and time at the farm (layers and calves) are shown. Differences in age distribution between years will be accounted for in the trend analyses.
For layers, an increase of flocks that were on the farm between one and 10 weeks was observed, predominantly at the expense of the categories 30-40 weeks and ≥60 weeks. For broilers, the lowest age-category showed a two-fold higher input in 2001 compared to the other years. This was compensated by a lower fraction of flocks in the last two categories. For finishing pigs, no differences were found between 2001 and 2002 for the age of pigs in the sampled herds. Comparison with the other years is difficult, due to the change in questionnaire for this factor and consequently the introduction of the category ‘various’. For veal calves, a decrease in percentage of flocks that have been on the farm for less than 20 weeks is contrasted by an increase of both categories describing animals that have been on the farm longer.
Data on the age of the sampled dairy herds was not available.
Figure 3.1: Time at the farm/age distribution of sampled flocks/herds. 0% 5% 10% 15% 20% 25% 30% 1-10 10-20 20-30 30-40 40-50 50-60 ≥60
Weeks at the farm
S ampl ed fl oc ks 1998 1999 2000 2001 2002 0% 10% 20% 30% 40% 50% 1-21 21-28 28-35 ≥35 Age (days) S am pl ed fl ocks 1998 1999 2000 2001 2002 0% 10% 20% 30% 40% 50% 60% 70% <2 2-3 3-4 4-5 >5 various Age (months) S amp le d her ds 1998 1999 2000 2001 2002 0% 5% 10% 15% 20% 25% 30% 35% 40% 45% 0-10 10-20 20-30 ≥30
Weeks at the farm
S amp le d her ds 1998 1999 2000 2001 2002 layers broilers
0% 5% 10% 15% 20% 25% 30% 35% 40% <2 2-5 5-10 10-20 ≥20 Flocksize (x1000) P er centa ge o f fl oc ks 1998 1999 2000 2001 2002 0% 5% 10% 15% 20% 25% 30% 35% 40% 45% 0-10 10-20 20-30 ≥30 Flocksize (x1000) P er cen ta ge of fl oc ks 1998 1999 2000 2001 2002 0% 10% 20% 30% 40% 50% 60% 70% 0-100 100-200 200-400 400-600 ≥600 Herdsize P er centage of he rd s 1998 1999 2000 2001 2002 0% 5% 10% 15% 20% 25% 30% 35% 40% 45% 0-30 30-50 50-70 ≥70 Herdsize P er cen ta ge o f he rd s 1998 1999 2000 2001 2002
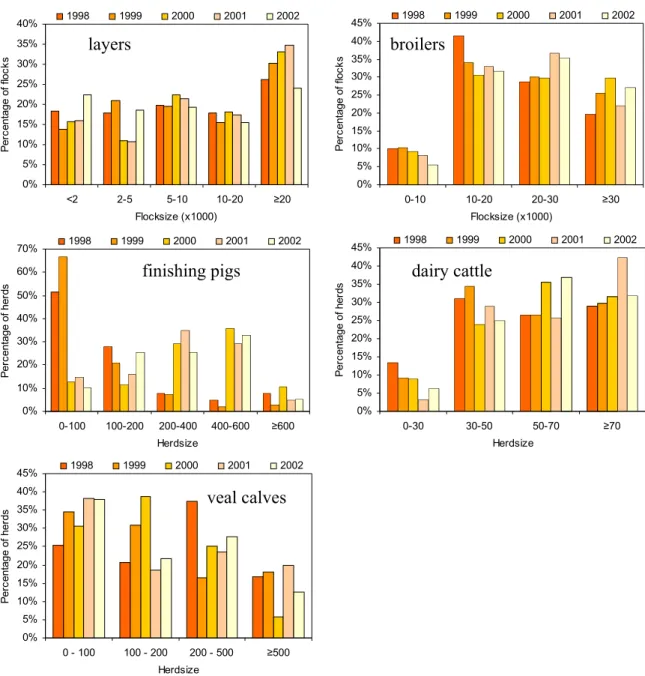
3.1.4 Flock-/herdsize distribution
In Figure 3.2A-E, the number of animals in the sampled flocks/herds are shown. Differences in flock-/herdsize distribution between years will be accounted for in the trend analyses. Layer flocks exceeding 20,000 birds showed an increasing contribution until 2001, primarily at the expense of flocks with 2,000-5,000 birds. In 2002, the opposite is the case.
For broilers, a decreasing percentage of flocks with less than 20,000 birds were sampled during the study period, and consequently larger flocks were sampled more frequent.
Finishing pig herds showed differences in herdsize distribution throughout the years. Herds with 1-100 animals were sampled less often from 2000 onward, whereas herds within the three subsequent categories were sampled more frequent since 2000.
For dairy cattle, the sampling in 2001 showed a higher percentage of herds in the class describing ≥70 animals, which is contrasted by a decrease in sampling herds fitting the
0% 5% 10% 15% 20% 25% 30% 35% 40% 45% 0 - 100 100 - 200 200 - 500 ≥500 Herdsize P er centa ge o f her ds 1998 1999 2000 2001 2002
Figure 3.2: Flock-/herdsize distribution of sampled flocks.
layers broilers
finishing pigs dairy cattle
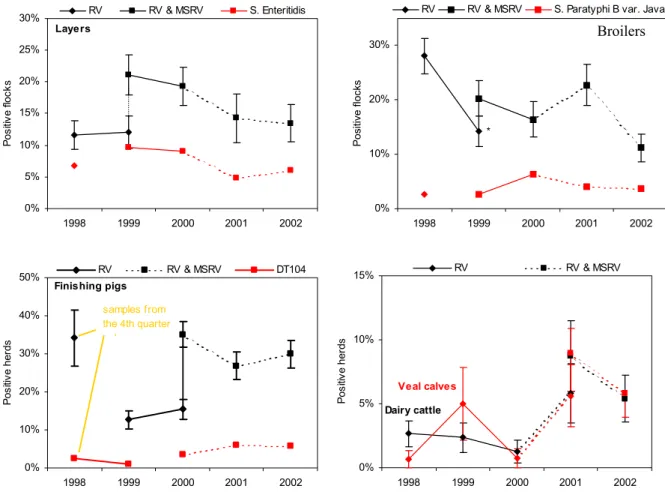
Figure 3.3: Crude annual salmonella prevalence estimates for the five animal species. The use of different selective enrichment media is marked by different symbols (* = statistically significant difference with previous estimate).
smallest category (<30 animals). In 2002, herds with 50-70 animals were sampled more frequent, also contrasted by a decrease in the smallest herdsize category.
Veal calf flocks with less than 100 animals were sampled more frequent during the studyperiod. The increasing input of the category 100-200 animals, observed in 1998-2000, was discontinued and reached a similar level as 1998 in 2001 and 2002.
3.2 Salmonella spp.
Figure 3.3 shows the crude annual prevalence estimates for all animal species graphically. In Table 3.2, these values and their 90% confidence intervals are presented numerically. In the graphs, the use of different selective enrichment media (RV or RV & MSRV) is marked by different symbols.
For layers, a decrease was observed between 1999 and 2002, yielding less than 15% positive flocks in 2002. Trend analysis on the data from 1999 until 2002, adjusted for age, flocksize and the sampling-stop due to the FMD-outbreak in 2001, showed a significant decreasing trend within this period (P=0.02). The prevalence of S. Enteritidis was a fairly constant fraction of approximately 45% of the salmonella positive flocks in all years, with an exception in 2001 (33%). Trend analysis on the prevalence estimates for S. Enteritidis yielded a P-value of 0.08 for a decreasing trend, thus suggesting its existence. The limited number of S. Enteritidis positive flocks might have caused the absence of statistical significance.
Layers 0% 5% 10% 15% 20% 25% 30% 1998 1999 2000 2001 2002 P osi tive fl oc ks RV RV & MSRV S. Enteritidis 0% 5% 10% 15% 1998 1999 2000 2001 2002 P os iti ve her ds RV RV & MSRV Dairy cattle Veal calves Finishing pigs 0% 10% 20% 30% 40% 50% 1998 1999 2000 2001 2002 Po si tiv e h er ds RV RV & MSRV DT104 samples from the 4th quarter onl 0% 10% 20% 30% 1998 1999 2000 2001 2002 Posit ive f locks
RV RV & MSRV S. Paratyphi B var. Java
*
For broilers, crude prevalence estimates showed comparative values between 1999 and 2001, followed by a decrease in 2002. Trend analysis on data from 1999 until 2002, adjusted for age, flocksize and the non-sampling period in 2001, did not show a statistically significant decreasing trend for Salmonella spp. (P=0.20).
For finishing pigs, no significant differences were observed in the crude annual prevalence estimates between 2000 and 2002. However, trend analysis on the crude estimates from 2000 till 2002, adjusted for herd size, age, season of sampling and the non-sampling period due to FMD, showed a significant decreasing trend during these three years (P=0.049).
The results of the surveillance of Salmonella spp. in dairy and veal herds showed no significant differences within the study period. An interesting finding is the similarity in prevalence estimates for both types of cattle from 2000 onwards. Due to the low number of salmonella positive herds and only two years of data obtained with the more sensitive diagnostic method, trend analyses were not conducted.
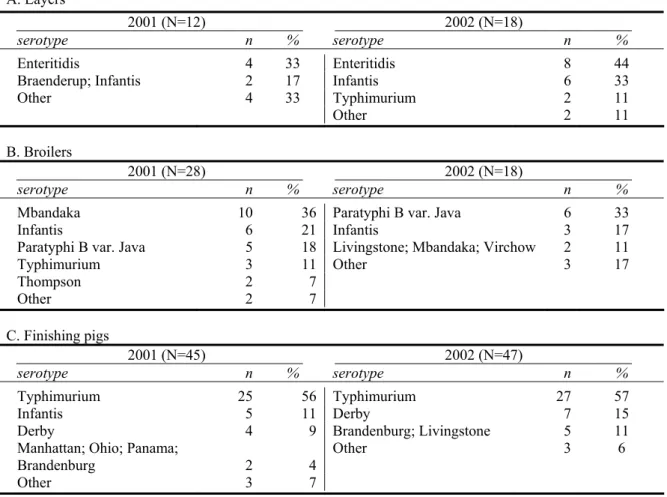
The most frequently isolated salmonella serotypes are shown in Table 3.3 per animal species. Appendix 4 shows all isolated serotypes per animal species per year. For layers, S. Enteritidis was the predominantly isolated serotype, but also S. Infantis was commonly found. In 2001, S. Enteritidis PT4 was present in three of four S. Enteritidis-positive flocks; in 2002, five of the eight S. Enteritidis infections concerned PT4.
In 2001-2002, the predominant serotypes in salmonella positive broiler flocks were
S. Mbandaka, S. Infantis and S. Paratyphi B var. Java. The latter serotype accounted for a third of the salmonella positive flocks in 2002, after experiencing an increase from 13% of the positive flocks in 1999. In contrast to results from 1998–2000, S. Typhimurium DT104 (corresponding to the Dutch phagetypes 406 and 501) was also isolated from broilers (two and one flocks in 2001 and 2002, respectively; see Appendix 4).
For finishing pigs, S. Typhimurium accounted for approximately 55% of the salmonella positive herds in both years. Phagetype DT104 was observed in approximately 20% of the salmonella positive herds in both years and had shown a two-fold increase in occurrence between 2000 and 2001. In 2002, a level comparable to that in 2001 was observed.
For dairy cattle, in both years, a predominating serotype was not observed. S. Typhimurium DT104 was isolated from one of nine salmonella positive herds in 2001 and in three of the eight salmonella positive herds in 2002.
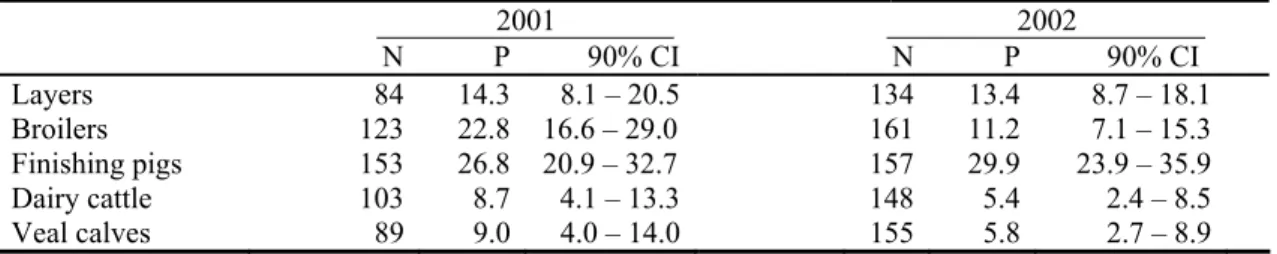
Table 3.2: Salmonella prevalences (P) and 90% confidence intervals (90% CI) per animal species per year. N gives the number of flocks/herds examined that year.
2001 2002 N P 90% CI N P 90% CI Layers 84 14.3 8.1 – 20.5 134 13.4 8.7 – 18.1 Broilers 123 22.8 16.6 – 29.0 161 11.2 7.1 – 15.3 Finishing pigs 153 26.8 20.9 – 32.7 157 29.9 23.9 – 35.9 Dairy cattle 103 8.7 4.1 – 13.3 148 5.4 2.4 – 8.5 Veal calves 89 9.0 4.0 – 14.0 155 5.8 2.7 – 8.9
Also for veal calves, no predominant serotype was observed in 2001. However, noticeable was the isolation of S. Dublin from four of the nine positive herds in 2002 and
S. Typhimurium DT104 from three of these nine herds.
Seasonal variation of salmonella occurrence in layer and broiler flocks and finishing pig herds is presented in Appendix 5. In none of the species a univocal seasonal variation was observed.
Table 3.3: Frequency of salmonella serotypes per year for layers, broilers and finishing pigs. N gives the
number of Salmonella spp. positive flocks. An overview of all isolated serotypes for all animal species is shown in Appendix 3.
A. Layers
2001 (N=12) 2002 (N=18)
Oserotype n % serotype n %
OEnteritidis 4 33 Enteritidis 8 44
OBraenderup; Infantis 2 17 Infantis 6 33
OOther 4 33 Typhimurium 2 11
Other 2 11
B. Broilers
2001 (N=28) 2002 (N=18)
Oserotype n % serotype n %
OMbandaka 10 36 Paratyphi B var. Java 6 33
OInfantis 6 21 Infantis 3 17
OParatyphi B var. Java 5 18 Livingstone; Mbandaka; Virchow 2 11
OTyphimurium 3 11 Other 3 17 OThompson 2 7 OOther 2 7 C. Finishing pigs 2001 (N=45) 2002 (N=47) Oserotype n % serotype n % OTyphimurium 25 56 Typhimurium 27 57 OInfantis 5 11 Derby 7 15
ODerby 4 9 Brandenburg; Livingstone 5 11
OManhattan; Ohio; Panama;
OBrandenburg 2 4 Other 3 6
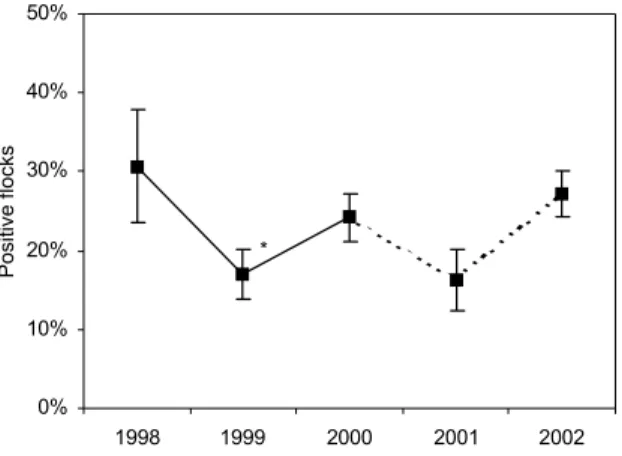
Figure 3.5: Crude E. coli O157 prevalence estimates for dairy cattle and veal calves. Different examination procedures are marked by different symbols. 0% 10% 20% 30% 40% 50% 1998 1999 2000 2001 2002 Positive flocks *
Figure 3.4: Crude annual campylobacter prevalence estimates for broilers.
0% 5% 10% 15% 20% 25% 30% 1998 1999 2000 2001 2002 Posi ti ve her d s Pooled Individual Veal calves Dairy cattle
3.3 Campylobacter spp.
In Figure 3.4, the estimated crude campylobacter prevalences for broilers are graphically shown. The crude annual prevalence estimate for 2001 was 16.3% (90% CI: 10.9% – 21.8%) and for 2002 27.1% (90% CI: 21.5% – 32.8%). In 2000 and 2002, an increase in the prevalence estimate was observed, compared to 1999 and 2001, respectively. Trend analysis of the prevalence estimates, adjusted for season, age, flocksize and the non-sampling period due to FMD, gave no indication for a significant trend during the study period (P=0.18).
Molecular analysis of isolates from 12 of the 20 campylobacter positive flocks from 2001 showed, that all 12 flocks harboured C. jejuni and two also contained C. coli. In 2002, no PCR-tests were done on the isolated campylobacter strains.
Seasonal variation in campylobacter occurrence in broiler flocks is presented in Appendix 6. The prevalence starts to rise in March/April, and shows a peak in the summer months. Thereafter, the prevalence decreases to become lowest in winter.
3.4 E. coli O157
The estimated crude prevalences for E. coli O157 are graphically shown in Figure 3.5. Differences in laboratory techniques are marked by different symbols. In Table 3.4, the estimates and their 90% confidence intervals are presented numerically.
For dairy cattle, higher prevalence estimates were obtained in subsequent years, but none of these differences were statistically significant. Trend analyses were done on data from 1998 until 2000 and on data from 2000 until 2002, adjusting for herd size, season of sampling and the non-sampling period in 2001. Results indicated the absence of an increasing
trend in both periods (P=0.33 and P=0.24, respectively).
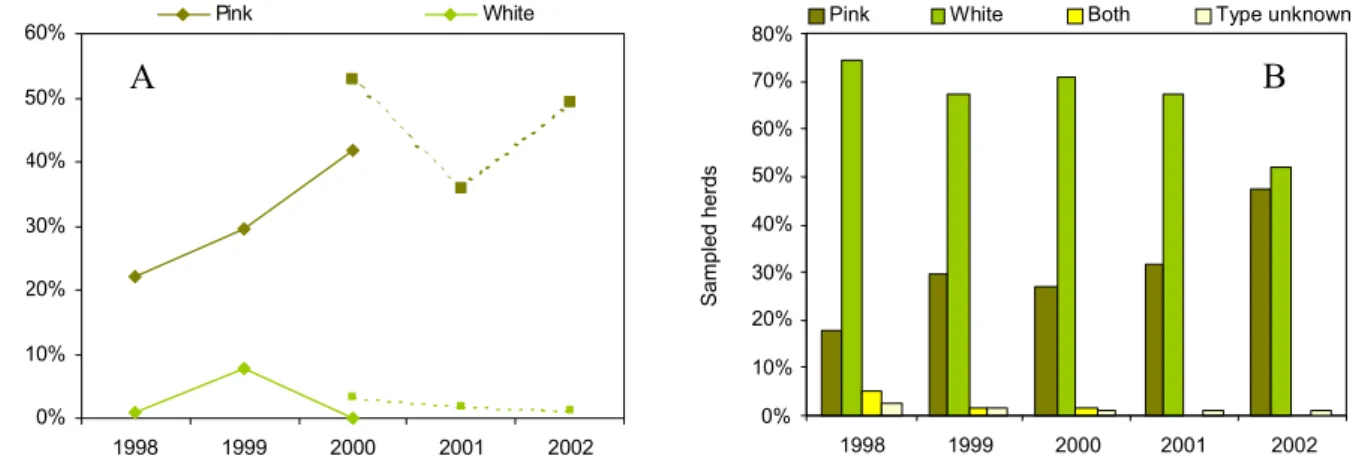
For veal calves, an increase in subsequent crude annual prevalence estimates was observed, except for 2001. A tendency for an increasing trend between 2000 and 2002 was suggested when adjusting for age, herd size, quarter of sampling and the non-sampling period in 2001 (P<0.08). To examine this increase more thoroughly, univariable associations between calf
characteristics and E. coli O157 were examined. A remarkable difference in E. coli O157 prevalence was found between white veal herds and pink veal herds (Figure 3.6A). Pink veal herds were more often found positive for E. coli O157 than white veal herds. Furthermore, Figure 3.6B shows that the fraction of pink veal herds in the sample increased during the study period. To examine the effect of this shift in the sampling units (i.e. herds) on the crude prevalence estimate, trend analyses were conducted on data from 1998 – 2000 and on data from 2000 – 2002 (different analytical methods were used in those two periods), with adjustments for age, herd size, quarter of sampling, the non-sampling period in 2001 as well as for type of veal calf. The results showed the absence of an increasing trend in both periods
(P’98-’00=0.94; P’00-=’02=0.42), indicating the importance of the increase of pink veal herds in
the sampling population for the course of the estimated annual prevalences.
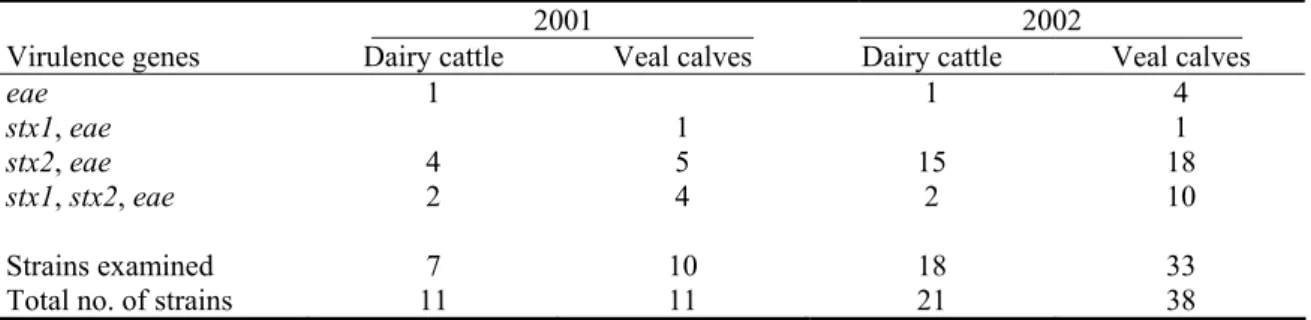
Table 3.5 shows the results of the PCR analyses of E. coli O157 isolates. Two examined isolates from dairy herds and four from veal herds did not possess stx-loci, all other examined isolates were found to be STEC O157.
Seasonal variation of E. coli O157 occurrence in dairy herds and veal herds is shown in Appendix 7. In both animal species, a univocal seasonal pattern was observed. In dairy cattle, the peak prevalence of E. coli O157 occurred in August through October, whereas in January through April few to none herds were found E. coli O157 positive. Also, in veal herds, a higher prevalence was observed in the summer months, followed by a lower prevalence in the winter. However, whereas in the winter period E. coli O157 was scarcely found in samples from dairy cattle, it was detected relatively frequent in samples from veal calves.
Table 3.4: Crude prevalence estimates (P) and 90% confidence intervals (90% CI) for E. coli O157 per animal species per year. N gives the number of examined herds.
2001 2002 N P 90% CI N P 90% CI Dairy cattle 103 10.7 5.7 – 15.7 148 14.2 9.5 – 18.9 Veal calves 89 12.4 6.7 – 18.1 159 23.9 18.4 – 29.4 0% 10% 20% 30% 40% 50% 60% 70% 80% 1998 1999 2000 2001 2002
Pink White Both Type unknown
A B
Figure 3.6: Difference between types of veal calves for the percentage of E. coli O157 positive herds (A) and the percentage of sampled herds (B).
0% 10% 20% 30% 40% 50% 60% 1998 1999 2000 2001 2002 S amp le d he rd s Pink White A Posi tiv e her ds Sampled herd s
3.5 Potential risk factors for Salmonella spp. in finishing pigs
(Nieuwenhuis MGH, Bouwknegt M, Dam-Deisz WDC, Graat EAM, Van de Giessen AW, 2004. Risk factor analysis for Salmonella spp. in Dutch finishing pig herds. In preparation.)
In this study, data on salmonella presence in 347 Dutch finishing pig herds derived from this surveillance programme between January 2000 and December 2001, were analysed in univariable and multivariable logistic regression. In total, 43 variables were analysed for its association with the presence of Salmonella spp. in finishing pig herds. The comprehensive model, based on 271 records, showed significant associations for: the seasons spring (+), summer (+) and autumn (+) compared to winter; a herd size of 501-1000 animals (+) compared to a herd size of 201-500 animals; feed supplier D (+) compared to the four other suppliers; the use of fermented liquid feed (-) compared to its non-use; the use of natural ventilation (+) compared to mechanical ventilation; presence of a hygiene lock (+) compared to no hygiene lock; presence of cats on the farm (-) compared to the absence of animals; and the age of the inspected herd (2-3 months) (-) compared to the age of 3-4 months.
3.6 Potential risk factors for E. coli O157 in veal calves
(Schouten JM, Van de Giessen AW, Frankena K, De Jong MCM, Graat EAM, 2004. Escherichia coli O157 prevalence in Dutch poultry, pig finishing and veal herds and risk factors on Dutch veal herds. Submitted for publication.)
Data from Dutch veal herds, examined in the period 1998-2000, were analysed to identify and quantify potential factors associated with presence of E. coli O157. In total, 42 of the 454 veal herds (9.3%) showed at least one positive pooled sample. E. coli O157 positive herds were compared to negative herds, using logistic regression, with regard to variables obtained from the questionnaire, taken from the farm manager. In the final model, ‘pink veal production’ (compared to white veal production), ‘group housing of the sampled herd’ (compared to individual housing), ‘more than one stable present’ (compared to one stable present), ‘hygienic measures regarding visitors’ (compared to no hygienic measures), ‘interval arrival-sampling of a herd of more than 20 weeks’ (compared to < 10 wks), and
Table 3.5: Virulence genes detected with PCR analysis in E. coli O157 strains isolated from dairy cattle and veal calves in the Netherlands in 2001 and 2002.
2001 2002 Virulence genes Dairy cattle Veal calves Dairy cattle Veal calves
eae 1 1 4
stx1, eae 1 1
stx2, eae 4 5 15 18
stx1, stx2, eae 2 4 2 10
Strains examined 7 10 18 33
‘presence of other farms within 1 km distance’ (compared to no presence of farms < 1 km) showed associations (P<0.10) with the presence of E. coli O157.
4 Discussion
In this report, prevalence estimates and trend observations for Salmonella spp., Campylobacter spp. and E. coli O157 in farm animals are presented for the period 1998 – 2002. Furthermore, two risk factor analyses were performed using questionnaire data, indicating which farm or flock/herd characteristics are potentially associated with infection. Evaluation of the programme design
The voluntary basis of this study may have affected the obtained estimates in this report. The willingness of the farmer to participate in the programme might be related to the farm or flock/herd status for the target bacterium (bacteria), disease awareness or other management factors. Moreover, the willingness of poultry farmers to participate in our voluntary programme is likely to be moderated by the obligatory participation in the salmonella monitoring and control programme run by the poultry industry. These factors might result in: (i) the absence or overrepresentation of certain (categories of) farms in this study, (ii) interference with the randomisation of the sample and (iii) lower sample sizes and thus a lower accuracy of presented estimates. The amount and direction of these effects, however, are in most instances difficult to assess (57).
The collection of faecal samples from the ground might result in a lower detection probability caused by a die-off of bacteria due to exposure to non-favourable circumstances. Campylobacter spp., for instance, is known for its sensitivity to dry conditions (21). On the contrary, several experimental studies showed the possibility of survival of Salmonella spp., Campylobacter spp. and E. coli O157 under non-favourable circumstances (12; 24; 28; 33; 34; 38; 43). Also, sample-collectors are instructed to collect optically fresh samples, which presumably reduces the probability of false negative results due to die-off of bacteria.
The geographical distribution of co-operating farms showed deviations from the actual distribution of farms for finishing pigs and dairy cattle. Although the effect of these deviations on the annual prevalence estimates were not substantial (Appendix 3), it is desirable to have a more satisfactory correspondence between the distribution of sampled farms and the actual distribution of farms in the Netherlands. This should be a point of attention and improvement in the future selection of flocks/herds.
Analytical remarks
The prevalences presented in this report have not been adjusted for misclassification of flocks/herds due to imperfect diagnostic testing, and are therefore crude prevalence estimates. Ideally, crude prevalences are corrected to true prevalences by taking into account the sensitivity and specificity of the diagnostic tests. Since salmonella and E. coli isolates were subjected to serotyping, and campylobacter isolates were confirmed using an agglutination test (and additionally a PCR-test until 2001), false-positives were not likely to occur. However, since the amount of false-negatives is unknown, the presented prevalences are likely to underestimate the true prevalences.
In the trend analyses, adjustments were made for several variables. To account for the sampling-stop due to the food-and-mouth disease epidemic, estimates were adjusted for the quarter of sampling. Similarly, adjustments to age- and herd-/flocksize were made to exclude possible biases in the prevalence estimates due to by differences in the sample of farms with respect to these characteristics. However, this approach levels the contribution of the adjusted variables, i.e. their effects were assumed to remain constant over time. Whether this is the actual situation might be questionable. For instance, continuing shifts towards increasing farm sizes to reach economic sustainability might result in larger flock or herd sizes. If this factor would be a risk (preventive) factor for the presence of a bacterium, an increase (decrease) in prevalence due to this shift would be levelled and a trend may subsequently remain unnoticed.
Salmonella spp. in layers
From 1999 onwards, a significantly decreasing trend in the prevalence of Salmonella spp. in flocks of laying hens was observed. The estimated salmonella prevalence in 2002 was 13%, with S. Enteritidis accounting for one third of the positive flocks. Phagetype 4 dominated other Enteritidis phagetypes. The decreasing trend for Salmonella spp. (and a similar tendency for S. Enteritidis) in layer flocks might indicate that the control measures taken by the poultry industry are effective. However, the initial aim of the control programme to reduce contamination in laying hens to less than 5% Salmonella Enteritidis or Typhimurium positive flocks in 2000 has not been reached in that year, nor in 2002. Furthermore, serological examination of layer flocks by the Animal Health Service (GD) in 2002 indicated that 9% and 0.5% of the flocks were infected with S. Enteritidis and S. Typhimurium, respectively (6). The results of this serological monitoring programme roughly corresponded with the results of our surveillance programme, indicating a slight decrease of S. Enteritidis-infections in flocks of laying hens. At present, the aim of the control programme for layers is set at 0+% S. Enteritidis- or S. Typhimurium-positive eggs. An extensive study on the prevalence of salmonella in eggs in the Netherlands, in 1999, yielded an estimate of at least 0.03% and at most 0.3% (14 pools of 10 eggs each out of 4620 pools were found positive). Eleven (77%) of the isolates were S. Enteritidis (15). Recent data on salmonella prevalence in eggs are not available.
In humans, the incidence of salmonellosis has decreased between 1995 and 2002 from
2975 laboratory confirmed cases towards 1588 cases (6). The contribution of laying hens (or eggs) to human cases of salmonellosis was estimated at approximately 35% between 1999 and 2002, while more than 80% of the S. Enteritidis-infections were associated with eggs (Van Pelt, unpublished results). Just recently, two egg-associated outbreaks of human salmonellosis in the Netherlands were associated with egg-containing products, i.e. bavaroise (16) and mashed potatoes (26).
S. Enteritidis PT4 was the predominant phagetype observed in human S. Enteritidis-infections, but its contribution declined from 80% in 1997 towards 50% in 2002. In contrast, PT21 emerged in humans from 3% of the S. Enteritidis isolates in 1997 towards 17% in 2002 and also PT1 expanded in contribution from 2% in 1997 towards 9% in 2002. These
phagetypes were not isolated from laying hens in 2001, while in 2002, PT1 was isolated from two flocks of laying hens.
Salmonella spp. in broilers
Trend-analysis on salmonella prevalences in broiler flocks in 1999-2002 did not yield a decreasing trend (P=0.20). However, the decrease in salmonella prevalence measured in 2002 as well as the decreasing contamination percentages measured in the poultry meat production chain by the poultry industry and in poultry products at retail by the Inspectorate for Health Protection (Appendix 9) indicate that the intervention measures implemented by the poultry industry might have an effect. Still, the contribution of poultry meat to human salmonella infections in the Netherlands, in 1999-2002, has been estimated to be approximately 15% (6). In 2001 and 2002, S. Paratyphi B var. Java was often isolated from broiler flocks, similar to our findings in the period 1998-2000 (10). However, the increase of Java-positive broiler flocks that was observed from 1998 did not continue in 2001 and 2002. In 2002, one third of the salmonella positive flocks harboured this serotype. The difficulty with this serotype is its resistance to standard cleaning and disinfection methods (72), making the serotype harder to eradicate from contaminated broiler houses. Another problem is the potential of S. Paratyphi B var. Java to rapidly develop resistance to quinolones, such as flumequine, which are used for veterinary treatment of broilers (72). Since fluoroquinolones are the antibiotics of first choice in case of human salmonellosis, quinolone-resistance might hamper effective medical treatment. Fortunately, until now, S. Paratyphi B var. Java has not been associated with human salmonellosis often (72), despite its abundance on poultry meat in retail stores (54% of the isolates in 2002) (62).
S. Infantis showed a decrease in our study in the period 1998-2000 (10), but was isolated relatively often from samples in 2001 and 2002 (approximately 10% of the isolates).
S. Mbandaka was the main isolated serotype from broilers in 2001 after showing an increase in the period 1998-2000 (10). In 2002, this serotype was less predominant. The contribution of this specific serotype to human infections in the Netherlands is relatively low (6).
Salmonella spp. in finishing pigs
The use of the additional, more sensitive selective enrichment medium in the analysis of finishing pig samples from 2000 resulted in an approximately two-fold higher prevalence estimate in 2000 (16% versus 36%). Conclusively, the prevalence estimates for 1998 and 1999 have been underestimated. A comparison study on salmonella detection in faecal samples from finishing pigs (14), showed that the relative sensitivity of the RV medium compared to the combination of RV and MSRV was approximately 49%.
In 2000-2002, the prevalence of Salmonella spp. approximated 30%, while a significantly decreasing trend was observed when standardizing data for herdsize, age and quarter of sampling. The latter finding may be due to an increased awareness of good hygiene practices in the pig primary production sector. The crude prevalence estimate corresponded with the outcome of a study conducted by the Animal Health Service (GD) indicating a prevalence approximately 25% in 1999 (59).
S. Typhimurium was found to be the predominating serotype. For many years, this serotype has been one of the most prevalent serotypes in pigs, both in the Netherlands and in other countries (13; 25; 53; 60). In this study, in 2002, 17% (25 of 157 herds) were found to be positive for S. Typhimurium.
In our study, S. Typhimurium phagetype DT104 (Dutch phagetypes FT401 and FT506) accounted for approximately 20% of the salmonella positive herds. This specific phagetype accounted for 30% of the S. Typhimurium strains isolated from humans in the Netherlands between 1996-2001 (65). Since 1990, this phagetype emerged both in humans and farm animals, especially cattle and pigs (70). Van Pelt (unpublished data) estimated that 24% of the incidents of human salmonellosis in the period 1999-2002 originate from pigs. The majority of this fraction was associated with S. Typhimurium, but also S. Brandenburg and S. Derby played a substantial role. These two serotypes were frequently observed in our pig samples.
In a study on microbiological contamination of pork at retail, in 1999, 6% of the pork products and 8% of the mixed pork/beef products were found to be contaminated with Salmonella spp. (N=533). S. Typhimurium was the prevailing serotype on both pork and mixed pork/beef products (42% and 27%, respectively, of the salmonella isolates) (63). A similar study was conducted in 2002 with 105 pork samples from retail stores, indicating a salmonella prevalence of 10% in retail stores (6).
In order to reduce the salmonella prevalence in pig herds and in pork, the pig industry in the Netherlands is currently developing a salmonella monitoring and control programme. In this plan, which is partially based on the Danish approach (42), blood samples are collected from finishing pigs. Based on the results, farms are divided into one of three infection levels (free or lightly contaminated, moderately contaminated and heavily contaminated). Farms experiencing a heavy infection will be compelled to develop an intervention plan. Furthermore, slaughterhouses are examined on slaughter hygiene and if the hygiene level is found to be insufficient, the development and implementation of an intervention plan will be required.
Salmonella spp. in dairy cattle and veal calves
Salmonella prevalences in dairy and veal herds were low during the study period. Although the use of MSRV-medium in addition to RV-medium increased the probability to detect salmonella positive herds, prevalence estimates did not exceed 10%. As in preceding years, S. Typhimurium was the most frequently isolated serotype in 2001 and 2002. For comparison, in a study of the Animal Health Service (GD), in 2000, in which samples were collected from cattle for diagnostic purposes, herd prevalences of S. Typhimurium and
S. Dublin were estimated to be 3.2% and 2.5%, respectively (6).
Notable in our study was the relatively frequent isolation of S. Typhimurium DT104 from dairy cattle (one of nine salmonella positive herds in 2001; three of eight positive herds in 2002) and veal calves (three of eight positive herds in 2001; three of nine in 2002). In the first years of this surveillance programme, DT104 was isolated only once from dairy cattle, in 1998, and twice from veal calves in 1997 (10; 30). This might suggest an emergence of this