Simplified Multi-Stage and Per Capita
Convergence:
an analysis of two climate regimes for
differentiation of commitments
M.G.J. den Elzen, M.M. Berk, P. Lucas
This research was conducted for the Dutch Ministry of the Environment as part of the Climate Change Policy Support Project (M/728001 Ondersteuning Klimaatbeleid)
National Institute of Public Health and the Environment (RIVM) Netherlands Environmental Assessment Agency
P.O. Box 1, 3720 BA Bilthoven The Netherlands
Telephone : +31 30 2743584
Fax: : +31 30 2744427
Abstract
Here, two post-Kyoto climate regimes for differentiation of future commitments, the simplified Multi-Stage approach and the Per Capita Convergence approach, are described and analysed in detail. The Multi-Stage approach consists of a system to divide countries into groups with different types of commitments (stages), resulting in a gradual increase over time in the number of countries involved and their level of commitment. Three new simplified Multi-Stage variants, which share three consecutive stages for the different commitments, have been developed and analysed. Stage 1 contains no quantitative commitments, while Stage 2 consists of emission-limitation targets and Stage 3, emission reduction targets. The Per Capita Convergence, or Contraction and Convergence approach defines emission permits on the basis of a convergence of per capita emissions under a contracting global GHG emission profile. The analysis focuses on two global greenhouse gas emission profiles, resulting in long-term CO2-equivalent concentrations stabilising at 550 ppmv for the S550e profile and 650 ppmv for S650e profile. For the Per Capita Convergence, two variants are analysed for different convergence years, 2050 and 2100. The abatement efforts, or allocations, for Annex I regions with respect to the S550e profile for all variants generally range from 25%-50% below 1990 levels in 2025 (across regions and regimes) and 70-85% in 2050. For S650e, these efforts range from a 10% increase to a 25% reduction in 2025, and a 40-60% reduction in 2050. The 2100 Per Capita Convergence regime forms an exception, leading to lower emission targets for Annex I regions. Most non-Annex I regions will need to reduce their emissions by 2025 in comparison to baseline levels, but emissions can increase with respect to 1990 under all the regimes analysed. For non-Annex I regions, results are generally more differentiated for the various commitment schemes, stabilisation targets and time horizons (2025 versus 2050) than for Annex I regions. The analysis further highlights the major strengths and weaknesses of the Multi-Stage and Per Capita Convergence variants, as well as indicating important obstacles and pre-conditions for the feasibility and acceptability of these approaches.
Acknowledgements
This analysis draws on research performed for the Dutch Ministry of the Environment within the Climate Change Policy Support project (M/728001 Ondersteuning
Klimaatbeleid). The authors would like to thank the participants, Patrick Criqui and Alban Kitous of Institute de l’Economie et de Politique de l’Energie (IEPE for the constructive collaboration). The authors would also like to thank their RIVM colleagues, in particular, Bas Eickhout and Detlef van Vuuren, for their comments and contributions.
Contents
SAMENVATTING ... 6
1 INTRODUCTION ... 7
2 THE CLIMATE REGIMES EXPLORED ... 9
2.1 The new Multi-Stage variants ...9
2.1.1 Equity principles and stages of commitment ... 10
2.1.2 Other new features... 14
2.2 The Per Capita Convergence variants...15
3 ANALYSIS OF THE MULTI-STAGE AND PCC VARIANTS FOR STABILISING AT 550 CO2-EQ PPMV ... 17
3.1 The Multi-Stage variants...17
3.2 The Multi-Stage and Per Capita Convergence results ...21
3.2.1 The Per Capita Convergence results ... 25
3.3 Robustness of results for the Multi-Stage variants for the S550e profile ...29
4 ANALYSIS OF THE MULTI-STAGE AND PCC VARIANTS FOR STABILISING AT 650 CO2-EQ PPMV ... 31
4.1 The Multi-Stage variants...31
4.2 The Multi-Stage and Per Capita Convergence results ...34
4.3 Robustness of results for the Multi-Stage variants under the S650e profile...41
5 ALL RESULTS OF THE S550E AND S650E PROFILES COMPARED... 43
5.1 Pros and cons of the Multi-Stage and Per Capita Convergence approaches...43
6 CONCLUSIONS... 47
REFERENCES ... 51
APPENDIX A: THE S550E AND S650E EMISSION PROFILES... 53
APPENDIX B THE MULTI-STAGE 1 RESULTS FOR THE S550E PROFILE ... 55
APPENDIX C THE MULTI-STAGE 2 RESULTS FOR THE S550E PROFILE ... 57
APPENDIX D THE MULTI-STAGE 3 RESULTS FOR THE S550E PROFILE ... 59
APPENDIX E THE PCC RESULTS FOR THE S550E PROFILE... 61
APPENDIX F THE MULTI-STAGE 1 RESULTS FOR THE S650E PROFILE... 63
APPENDIX G THE MULTI-STAGE 2 RESULTS FOR THE S650E PROFILE ... 66
APPENDIX H THE MULTI-STAGE 3 RESULTS FOR THE S650E PROFILE ... 68
Samenvatting
Dit rapport beschrijft een analyse voor het (kwantitatief) verkennen van twee post-Kyoto regimes voor lastenverdeling in het internationale klimaatbeleid: 1. de eenvoudige Multi-Stage benadering, waarbij landen op grond van hoofdelijk inkomen en emissies worden ingedeeld in groepen met verschillende typen van doelstellingen (stadia). Deze benadering resulteert in een geleidelijke uitbreiding van het aantal landen met kwantitatieve
doelstellingen alsmede van de stringentheid van hun doelstellingen. 2. de Per Capita Convergentie benadering, waarbij voor alle landen vanaf 2013 emissierechten worden gedefinieerd op basis van een convergentie van hoofdelijke emissie ruimte onder een (dalend) wereldwijd broeikasgas emissieplafond. Dit is gedaan met behulp van twee mondiale emissieprofielen voor broeikasgassen die resulteren in een stabilisatie van de CO2-equivalente concentratie op een niveau van respectievelijk ongeveer 550 en 650 ppmv (S550e en S650e profielen).
De Multi-Stage benadering (toenemende participatie) gaat uit een kwantitatief raamwerk van geleidelijk toenemende participatie volgens een filosofie van graduatie. De benadering biedt een concept waarbinnen landen geleidelijk kunnen toetreden tot een mondiaal
klimaatregime, overeenkomstig hun specifieke nationale omstandigheden en stadium van economische ontwikkeling. Het geleidelijk toetreden is vertaald naar meerdere stadia binnen het regime. Daarmee is het in staat om meerdere verdelingsprincipes en meerdere vormen van verplichtingen in meerdere stadia van één systeem te verenigen.
Drie eenvoudige Multi-Stage varianten zijn ontwikkeld met ieder verschillende
deelnameregels en criteria voor zowel deelname als bijdrage, maar gemeenschappelijke opeenvolgende stadia van inspanningsniveau: stadium 1: geen verplichtingen; stadium 2: emissie beperkende maatregelen; en stadium 3: emissie reductiedoelstellingen. Voor de Per Capita Convergentie benadering zijn twee varianten geanalyseerd, met verschillende convergentiejaren (2050 en 2100).
De kwantitatieve analyse laat zien dat de reductie doelstellingen van Annex I landen voor S550e liggen in 2025 voor de verschillende benaderingen tussen de 25%-50% onder 1990 niveau (afhankelijk van regio en regime) en 70-85% in 2050. Voor S650e variëren deze doelstellingen van een 10% toename tot een 25% reductie in 2025 en een 40-60% reductie in 2050. Het 2100 Per Capita Convergentie regime vormt een uitzondering en leidt tot lagere doelstellingen voor Annex I landen. De meeste niet-Annex I regio’s moeten voor alle geanalyseerde regimes in 2025 hun emissies reduceren ten opzichte van baseline, maar kunnen hun emissies nog laten groeien ten opzichte van 1990. De resultaten voor niet-Annex I regio’s laten in de regel een diverser beeld zien voor verschillende regimes, stabilisatie doelen, regio’s en tijdsperiodes (2025, 2050) dan die voor Annex I regio’s. Naast de kwantitatieve analyse is op basis van een multi-criteria analyse ook een kwalitatieve beoordeling gemaakt van de sterke en zwakke kanten van de verschillende Multi-Stage en Per Capita Convergentie varianten, en laat zien waar de belangrijkste obstakels en condities liggen voor een mogelijke uitvoerbaarheid en aanvaardbaarheid.
1 Introduction
In this report we will describe and analyse the implications of five variants of two different climate regime approaches for differentiating future mitigation commitments. Two of them are variants of the Per Capita Convergence approach (PCC), while the other three are new variants of the simplified Multi-Stage (MS) approach. For the analysis we will use the two global emission profiles for stabilising atmospheric greenhouse gas concentrations at 550 and 650 ppmv equivalent (S550e and S650e) (see Appendix A).1
The MS approach comprises a system to divide countries into groups with different types of commitments (stages) and results over time in a gradual increase in the number of countries and their level of commitment according to participation and differentiation rules. In this study we will present three new simplified variants of the MS approach, developed in collaboration with IEPE on the basis of the original MS approach from RIVM (Berk and Den Elzen, 2001; Den Elzen, 2002), and elements from an alternative climate regime approach, called Soft Landing (Criqui and Kouvaritakis, 2000).
The Per Capita Convergence approach, more commonly known as the ‘Contraction & Convergence’ approach, originating at the Global Commons Institute (Meyer, 2000). This approach allocates emissions on the basis of a convergence in per capita emission to equal per capita levels in the future under a contracting global GHG emission profile. The two approaches have been selected because they show a number of structural differences. First, the MS approach is based on a gradual extension of the number of countries participating in global greenhouse gas emission abatement, while in the PCC approach, all countries participate from the start. Second, the MS approach defines different types of commitments, while in the PCC approach all countries have similar commitments (fixed targets). Third, where the MS approach concerns the allocation of emission
abatement efforts (burden-sharing), the PCC approach is based on the allocation of rights to use the (constrained) capacity of the atmosphere to absorb greenhouse gas emissions
(resource-sharing). Finally, the MS and PCC approaches are based on different equity principles, as will be discussed in Chapter 2.
Organisation of the report
The features - new, simplified variants of the MS approach - are described in more detail in Chapter 2. This Chapter also briefly describes the PCC approach. Chapters 3 and 4 present the analysis of the implications oftheMS and Per Capita Convergence variants in terms of the regional emission allowances for the two profiles. For this analysis we used a Common POLES-IMAGE (CPI) baseline, which up to 2030 is largely based on the existing POLES model baseline scenario (see Criqui and Kouvaritakis (2000)), with an extension up to 2100 based on the IMAGE 2.2 model (IMAGE-team, 2001). The decision-support model FAIR 2.0 (Framework to Assess International Regimes for differentiation of future commitments) is used as framework for the analysis of allowances (Den Elzen, 2002; Den Elzen and Lucas, 2003). This model is designed to quantitatively assess the environmental
effectiveness and abatement costs of a range of alternative differentiation schemes of future commitments under the UNFCCC (post-Kyoto) in the context of stabilising greenhouse gas concentrations. The calculations for the following 17 regions were presented here: Canada, USA, OECD-Europe, Eastern Europe, Former Soviet Union (FSU), Oceania and Japan (Annex I regions); Central America, South America, Middle East & Turkey, (the
1 The ‘CO
2-equivalent concentration’ indicates the forcing of the total GHG concentration expressed in terms
and high income non-Annex I regions); Northern Africa, Southern Africa, East Asia (incl. China) and South-East Asia (the low-middle income non-Annex I regions), Western Africa, Eastern Africa and South Asia, including India (i.e. the low-income non-Annex I regions). Chapter 5 compares the results of the PCC and MS variants in more detail, and highlights the major strengths and weaknesses of the MS and Per Capita Convergence variants; it also points out important obstacles and pre-conditions for their feasibility and acceptability. Findings are summarised in Chapter 6.
2 The climate regimes explored
2.1 The new Multi-Stage variants
The MS approach is an international climate regime for differentiating future (mitigation) commitments under the United Nations Framework Convention on Climate Change (UNFCCC). The MS approach consists of a system to divide countries into groups with different levels of efforts and types of commitments (stages). The aim of such a system is to ensure that countries with similar circumstances in economic, developmental and
environmental terms have comparable responsibilities, i.e. commitments under the climate regime. Moreover, the system defines when a country’s level of commitment changes according to pre-determined rules that take into account changes in its circumstances. The MS approach thus results into an incremental evolution of the climate change regime, i.e. a gradual expansion over time of the group of countries with emission targets (the Annex I), with countries adopting different levels and types of commitments according to
participation and differentiation rules. The various levels of participation could be organised as different annexes to the UNFCCC. The approach was first developed by Gupta (1998). Later, this approach was elaborated into a quantitative scheme compatible with the UNFCCC objective of stabilising the atmospheric greenhouse gas concentrations at a level that would ‘prevent dangerous anthropogenic interference with the climate
system’. This had be done by Den Elzen et al. (1999), Berk and Den Elzen (2001), Den
Elzen (2002), Den Elzen and Berk (2003) and Den Elzen et al. (2003).
Criqui and Kouvaritakis (2000) developed a detailed world energy and CO2 projection, and then proposed an alternative ‘multi-grouping’ regime approach, called Soft Landing. This approach encompasses a scheme for a progressive limitation of emissions in non-Annex I countries, where timing of the moment of stabilisation of emissions is differentiated for groups of countries on the basis of their per capita emissions and per capita income levels, as well as on their population growth. Annex I countries keep reducing their emissions according to an ‘extended Kyoto-type’ trend. Blanchard et al. (2003) fully describe the corresponding complete scenario. In contrast to the MS approach, in the Soft-Landing approach all non-Annex I countries participate immediately.
Both the Soft-landing and the MS approach were part of the explorative phase of the ‘Greenhouse gas Reduction Pathways in the UNFCCC post-Kyoto process up to 2025’ project. In evaluating both, the MS and Soft-Landing approach, it was found that the MS approach provides a promising approach for extending the present KP in a gradual, but structured way. However, the original approach was considered as probably too complex and for this reason it was decided to reduce the number of stages and policy variables. The Soft-Landing approach provides for an early participation and smooth change in emission pathways of non-Annex I, but does not result into global emission reductions needed for stabilising GHG concentrations and lacks clear rules related to equity considerations in the UNFCCC.
Therefore, the RIVM and IEPE have collectively developed new variants of the MS approach. The criteria here were that the new variants should:
- account for various equity principles;
- result in a gradual shift from no emission control commitments to full participation in the emission-reduction stage via a transition stage;
It was felt that the elements of the Soft Landing approach could be used to further develop, and in fact simplify, the existing MS approach. Therefore the new, simplified MS variants are built on both RIVM’s MS approach and IEPE’s Soft-Landing approach but include several new elements. These simplified MS cases (hereafter MS cases) are described in more detail below.
2.1.1 Equity principles and stages of commitment
Accounting for equity principles
The design of the MS regime can be related to various equity considerations (see Box 2.1). Moreover, as we have suggested elsewhere, there is some hierarchy in equity principles (Den Elzen et al., 2003). The basic need principle would come first, as it exempts one from contributing, not even proportionally, so as to avoid hindrance of attaining basic
development needs. Next, the capability principle foregoes the responsibility principle, as one cannot be expected to contribute proportionally to one’s responsibility if this would constitute a disproportional or abnormal burden. Finally, the responsibility principle would subordinate the sovereignty principle, as international law does not allow a state to continue to emit freely if this is known to be harmful to other states.2 This hierarchy of equity
principles is largely reflected in the design of the new MS approaches:
- Stage 1 corresponds with securing basic needs by exempting the least developed
countries from quantitative commitments and allowing them to follow baseline emissions.
- Stage 2 corresponds with contributing according to one’s capability (and avoiding
disproportional burdens), allowing for a transition towards a full contribution.
Commitments in this stage limit the growth in emissions, but do not yet require absolute reductions (emission limitation commitments).
- Stage 3 corresponds with the responsibility principle by defining emission reduction
commitments based on one’s contribution to climate change.
Shifting gradually from no emission control to emission reductions
All three new MS variants developed are based on the following consecutive stages for the commitments of non-Annex I countries:
- Stage 1. No quantitative commitments (exemption stage);
- Stage 2. Emission limitation targets, e.g. intensity targets (transition stage); - Stage 3. Emission reduction targets, similar to those of Annex I countries
(full participation).
However, the variants differ in the way the transition stage has been designed. All Annex I regions (including the US) are assumed to be in stage 3 after 2012.
Relatively simply in design
The MS variants are all based on a limited number of policy variables, as illustrated by the main characteristics of the three MS variants in Table 2.1.
2 See preamble of UNFCCC: ‘Recalling also that States have, in accordance with the Charter of the United
Nations and the principles of international law, the sovereign right to exploit their own resources pursuant to their own environmental and developmental policies, and the responsibility to ensure that activities within their jurisdiction or control do not cause damage to the environment of other States or areas beyond the limits of national jurisdiction’.
Box 2.1 Equity principles
Equity principles refer to general concepts of distributive justice or fairness. Many different categorisations of equity principles can be found in the literature (Ringius et al., 1998; Ringius et al., 2000). In Den Elzen et al. (2003) a typology of four key equity principles was developed that seem most relevant for characterising various proposal for the differentiation of post-Kyoto commitments in the literature and international climate negotiation to date:
- Egalitarian: i.e. all human beings have equal rights in the ‘use’ of the atmosphere.
- Sovereignty and acquired rights: all countries have a right to use the atmosphere, and current emissions constitute a ‘status quo right’.
- Responsibility / polluter pays: the greater the contribution to the problem, the greater the share of the user in the mitigation /economic burden.
- Capability: the greater the capacity to act or ability to pay, the greater the share in the mitigation / economic burden.
The basic needs principle is included here as a special expression of the capability principle: i.e. the least capable Parties should be exempted from the obligation to share in the emission reduction effort so as to secure their basic needs. An important difference between the egalitarian and sovereignty principle, on the one hand, and responsibility and capability, on the other, is that the first two are
rights-based, while the latter two are duty-based. This difference is related to the concepts of resource-sharing, as in the PCC approach, and burden-sharing in the MS approach.
• Stage 1 to Stage 2: from no-constraint to emission limitation (carbon intensity) targets
The transition from Stage 1 to Stage 2 depends, for all MS variants considered here, on a Capability-Responsibility (CR) index.
This new element, the CR-index, is a composite index that intends to relate the degree of effort that each country should perform in emission abatement policies, according both to its responsibility in the problem (per capita emissions) and to its capability to act (per capita income). This index draws from the mention in Article 3.1. of the UNFCCC of the
‘common but differentiated responsibilities and respective capabilities’ that should be taken into account in defining the appropriate action of the different Parties. The CR-index is defined as the sum of the per capita income (expressed in PPP€1000 per capita), which relates to the capability to act, and of the per capita CO2-equivalent emissions (expressed in tCO2-equivalent per capita). This CR-index reflects the responsibility in climate change (illustrated in Table 2.2).3 and is used to define the threshold for the transition from Stage 1 to 2.The CR-index originates from the Soft Landing approach (see Criqui and Kouvaritakis (2000)), where it was used to categorise countries into groups with different trajectories in the search for stabilisation of emissions on the basis of both their per capita income and levels. Because it combines variables of a different nature, this composite index should in principle be normalised or weighted. It happens however that, in this particular variant, a one-to-one weight produces fairly satisfactory results.
While resulting from a pragmatic approach, this indicator shows good ‘screening’ properties, in the sense that it allows to reproduce in a satisfactory way the existing Annex I, as well as relevant country groupings for non-Annex I regions. The ranking of regions, as it comes out from the 2000 index, is modified in 2025 for only a limited number of variants, in particular China and Southern Africa.
3 Because it combines variables of a different nature, this composite index should in principle be normalised
or weighted. It happens however that in this particular variant a one-to-one weight produces fairly satisfactory results.
Table 2.1: The main characteristics of the three MS variants
MS 1 MS 2 MS 3
Stage 1 No quantitative commitments Stage 2 (emission-limitation stage)
First threshold (to Stage 2) Capability-Responsibility (CR) index
Same as MS 1 Same as MS 1 Emission-limitation targets Income-dependent
intensity targets Same as MS 1 Prescribed emissionstabilisation profile
Stage 3 (emission-reduction stage)
Second threshold (to Stage 3) World-average per capita
emissions CR-index value
--Absolute targets, reductions
proportional to burden sharing key Per capita emissions Same as MS 1 Same as MS 1
Table 2.2: Regional Capability-Responsibility (CR) index values in 1995 and in 2025 for the CPI scenario. regions ranked by decreasing value in 1995
1995 2025
Per capia Per capia CR-index Per capia Per capia CR-index
GDP emissions GDP emissions 1000 PPP$ tCO2-eq 1000 PPP$ tCO2-eq USA 28 26 54 47 27 73 Canada 24 21 45 39 21 60 Oceania 17 19 36 30 20 51 Japan 24 11 35 39 13 52 OECD Europe 20 11 31 37 12 50 Former USSR 5 12 18 13 17 30 Eastern Europe 7 9 15 17 11 28 Middle East 5 7 12 9 11 20 South America 7 5 12 12 8 19 Central America 5 5 10 10 6 17 Southern Africa 2 4 7 3 6 9
East Asia (China) 3 4 7 11 7 18
Northern Africa 3 3 6 6 5 11
South East Asia 3 3 6 8 5 14
South Asia (India) 2 2 4 5 3 8
Western Africa 1 1 2 1 2 4
Eastern Africa 1 1 2 1 2 3
Compared to a single capability oriented threshold, like per capita income as in the original MS (Berk and Den Elzen, 2001), the CR-index generally tends to result in an earlier
participation of low-income regions, in particular, those that have relatively high per capita emission levels (for example Southern Africa). Based on the experience with the Soft Landing approach, proper weighting of both Capacity and Responsibility factors can prevent countries that are too poor having to participate early on.
In Stage 2, the MS 1 and MS 2 variants share GDP-related emission intensity targets. More specifically, the GHG emission intensity improvement rate is defined as a linear function of per capita income level (IC in PPP€ per capita), i.e. max [a*ICR(t), EIRmax ], where t is the year of calculation, a, a coefficient and EIRmax the exogenous maximum de-carbonisation rate. The EIRmax was adopted to avoid de-carbonisation rates that would outpace those of economic growth and result in absolute reduction targets for middle-income regions. The basic idea behind the coefficient a is that the rate reaches a maximum at 50% of (1990) Annex I income, where the corresponding income level is ICmax in PPP€ per capita per year, can be calculated as: EIRmax / ICmax.
The MS 3 variant provides a prescribed emission limitation growth target for Stage 2, leading to a stabilisation of emissions as in the Soft-Landing approach. The length of this stabilisation period given by the transition constant, TC, is calculated by dividing the TC by the per capita emission levels (in tCO2-eq per capita) before the first CR-threshold is met.
For example, if the transition constant is 70, a region with per capita emission levels of five will have to bring down its emission growth rate to zero in 14 years. 4
Box 2.2 Transition constant
The concept of a transition constant is most directly related to the original Soft Landing approach. The idea was to have developing country emissions gradually bending towards a stabilisation of emission levels, taking into account differences between various countries. In earlier discussions on the development of this MS 3 variant, it was proposed to relate the length of the transition period to the initial emission growth rate at the point of reaching the CR-threshold: the higher this rate, the shorter the transition period. This would discourage countries from raising their emission rates just before meeting the participation threshold. However, it was found that this could result in unreasonable outcomes, which would contradict the concept of capability, central to the emission-limitation stage. High initial growth rates can be the result of population growth and structural change (e.g.
industrialisation) in a country’s economy, and not necessarily due to inefficiency only. In fact, while countries’ growth may be high, their absolute (per capita) emission levels are not necessarily high (yet). Because of these factors, it was considered unreasonable to punish countries with high initial growth rates by requiring a shorter transition rate. Instead, a link between the length of the transition period and the per capita emissions was adopted. A long-range reference year was introduced to reduce the problems related to the use of data from a single reference year.
• Stage 2 to Stage 3: from emission-limitation to reduction targets
The three MS variants differ in the way the transition from Stage 2 to Stage 3 is defined:
- In MS 1, the entry to Stage 3 depends on a second threshold, defined as a proportion of
the world average per capita emission level. As the level of this threshold changes over time due to mitigation actions by other parties, it is not a fixed (like the CR-values) but a dynamic threshold.
- MS 2 uses a second CR-index with a value that is about twice that used for the Stage 1
to Stage 2 threshold.
- In MS 3, the entry to Stage 3 is not defined by a threshold, but begins after the fixed
and pre-determined stabilisation period has ended.
Given these characteristics, we have labelled the MS 1 variant a ‘dynamic threshold’, MS 2 a ‘double CR-threshold’ and MS 3 a ‘transition path’.
All new MS variants in Stage 3 assume the same burden-sharing key: per capita GHG emissions.5 This key tends to result in some convergence of per capita emission levels over time.6
4 The emissions during Stage 2 are calculated as: E(t-1)+V
0*(1-((t-t0)/LTS)), where E(t-1) are the emissions
of the previous year, t0 is the start year, LTS is the length of the stabilisation period and V0 is the average
increase in the emissions before the CR threshold is passed.
5 The share of a region r in the total emission reduction is calculated as: X
r = (Er*pcEr)divided by the sum of Xr over all regions, with Er the total emissions and pcEr the per capita emissions. In this way, two regions with
equal per capita emissions, but different total emissions, have the same relative reduction effort compared to their emissions.
6 As referred to in the preamble of the Marrakesh Accords: ‘Emphasising that the Parties included in Annex I
shall implement domestic action in accordance with national circumstances and with a view to reducing emissions in a manner conducive to narrowing per capita differences between developed and developing country Parties while working towards achievement of the ultimate objective of the Convention’ (italics added).
The levels chosen for the different thresholds and the rules applied to the entry in each stage have been adjusted to the global emission profile, as will be described in Chapters 3 and 4 (Table 3.1 and Table 4.1).
2.1.2 Other new features
Apart from the new features of the variants some other generic changes were made to enhance the policy realism of the approaches. The first one is related to the incorporation of a policy delay. In the original MS analyses performed so far, countries have immediately changed the stage when exceeding any of the thresholds. In reality, (reliable) information on the threshold indicators is only available after some time (normally 3-5 years). In
addition, negotiations are needed to define commitments for countries that have kept within threshold levels. In the present Kyoto Protocol system, targets for future commitment periods would ideally be defined as five years before the commitment period (CP) begins, perhaps to avoid interference with policy implementation. This would imply another five years of delay. However, it remains to be seen if this will be realised in practice. To account for the policy delay, all MS variants assume that if the threshold has to be met in the middle of the CP, T (2010, 2015, …), the country will enter a new stage at T +5 (2015, 2020, …). This implies a policy delay of at least five years, which is considered to be the shortest thinkable delay; in practice, a ten-year delay would seem more likely.
Another change relates to the use of a reference period for threshold levels. Using a single reference year for measuring whether a (non-Annex-I) country has met a threshold level has a number of disadvantages. First, indicator values such as those for per capita emissions or income tend to fluctuate substantially from year to year. Second, such figures are
generally surrounded by substantial uncertainty. Third, a single reference year brings the risk of anticipative behaviour and/or fraud. These problems are reduced when the
measurement of the threshold indicator is based on more robust long-range averages. A suitable reference period would seem to be 5-10 years. However, in the perfect model world, it is not necessary to introduce such a period, and we simply define for the reference year the value at CP T.
The implications of the reference period and policy delay factor in the model can be illustrated in the following example for the MS 1 and MS 2 variants. If a country’s 2012 level meets the first threshold level, this will be observed at time, 2015, the middle of the second CP (2013-2017). The country will adopt its first new emission intensity target for 2020, the middle of the third CP (2018-2022). At this point, the emissions change
according to the intensity improvement factors taken from 2016 to 2020, using the
emissions of 2015 as the reference.7 In the MS 3 variant, where per capita emissions in the reference period determines the length of the transition period (LTS), the end of the
transition period is extended with a policy time delay, necessary to fit in with middle of the next CP.8
Another change is the use of CO2-equivalent emission allowances in preference to CO2 emission allowances. Earlier analyses with RIVM’s MS were performed on the basis of (fossil) CO2 emissions only. A multi-gas approach has now been adopted using GWPs to convert all gases to CO2-equivalent units. In addition, the KP allows for emission trading in CO2 equivalent units. This implies that once countries engage in emission trading, their real
7 If the first threshold level is already exceeded by 2005, a start will be made with the implementation of the
emission intensity targets by 2012.
8 For example, if the calculated end of the transition period is 2022, the period is extended to 2025, the middle
emissions can no longer be used as a basis for target-setting /burden sharing and threshold indicator values; furthermore, burden sharing will have to be based on assigned amount units. This also implies the necessity for a multi-gas approach.
2.2 The Per Capita Convergence variants
The Per Capita Convergence (PCC) or ‘Contraction & Convergence’ approach (Meyer, 2000), as it is commonly called, starts from the assumption that the atmosphere is a global common to which all are equally entitled. It defines emission rights on the basis of a convergence of per capita emissions under a contracting global emission profile. In the PCC approach, all Parties take up immediate participation in the regime (in the post-Kyoto period), with per capita emission permits (rights) converging to equal levels over time. More specifically, over time, all shares converge from actual proportions in emissions to shares based on the distribution of population in the convergence year.
The PCC approach is based on a combination of both the egalitarian and sovereignty principles. The egalitarian principle is used within this approach to underpin the final convergence of per capita emission allowances. However, as the approach starts from the current distribution of emissions and only approaches this convergence in time, it is also clearly related to the sovereignty principle.
The assumptions for the PCC variants are indicated in Table 2.3. The two PCC variants assume a convergence of per capita CO2-equivalent emissions by 2050 and 2100 for both emission profiles (PCC50 and PCC100 variants).
In the original Contraction and Convergence approach of the GCI, based on a non-linear convergence formula, the actual degree of convergence in per capita depends on the rate of convergence selected. This rate of convergence determines whether most of the per capita convergence takes place at the beginning or end of the convergence period. Another important parameter in the approach is (accounting for) population growth. GCI has indicated that the approach might be combined with the option of applying a cut-off year, after which population growth is no longer accounted for. For reasons of transparency, a linear converge of per capita emissions in the PCC regime variants explored has been assumed and no cut-off year for population growth has been applied. Population projections used are from the CPI baseline scenario.
Table 2.3: Two alternative variants of the Per Capita Convergence (PCC) approach for the S550e and S650e profile
Key parameters PCC50 PCC100
Year of convergence 2050 2100
Rate of convergence Linear Linear
3 Analysis of the Multi-Stage and PCC variants for
stabilising at 550 CO
2-eq ppmv
3.1 The Multi-Stage variants
The parameter values for the MS variants and the S550e profile (as listed in Table 3.1) were selected on the following grounds: (i) meeting the global emission profile; (ii) timely participation of the non-Annex I regions and (iii) realisation of some convergence in the per capita emissions for the Annex I and non-Annex I regions before 2050.
Table 3.1: Assumptions for the MS variants for the S550e profile
Key parameters MS 1 MS 2 MS 3
Stage 1 No quantitative commitments Stage 2 Emission limitation targets: --Adoption of intensity targets
-Participation threshold CR = 5 (*) Same as MS 1 Same as MS 1
-De-carbonisation rate /
stabilisation Income-dependentintensity targets (**) Same as MS 1 Prescribedstabilisation path Stage 3 Emission Reduction targets:
participation threshold world average per capitaemissions CR = 12 Stabilisationperiod (TC=70) Burden-sharing key Per capita CO2 emissions Same as MS 1 Same as MS 1
(*) The CR-index is defined as the sum of per capita income (in PPP€/cap) and per capita CO2-equivalent
emissions (tCO2/cap yr.
(**)The de-carbonisation rate (in percentage) is a linear function of per capita income (PPP€/cap): a * PPP/cap, a = 0.33, and using a maximum de-carbonisation rate of 3%.
The same first CR-threshold of 5 is chosen for all three MS variants under the S550e profile, since in this way all non-Annex I regions, except the low-income non-Annex I regions South Asia and Western and Eastern Africa, participate in the emission-limitation stage after 2012.9 South Asia (including India) already enters the emission-limitation stage in 2015, whereas Western and Eastern Africa participate in this stage from 2055 and 2065, respectively (CR-index exceeded 5-10 years earlier). Figure 3.1 shows per capita emissions versus the per capita income over 2000-2050, and illustrates when the CR-threshold of 5 is exceeded.
First threshold for stage 2 – CR-values under 5 imply earlier participation of Western and
Eastern Africa regions, so these low-income regions already acquire intensity targets in the second commitment period. This seems too stringent and probably politically difficult to accept. Adopting such a low value only slightly affects the overall outcomes for these regions (see Figure B.1, Appendix B), since the carbonisation rates in stage 2 de-carbonisation are low (low-income level). This leads to emissions close to their baselines. CR-values between 5 and 10 give roughly the same results as a CR-threshold of 5. For instance, a CR-value of 8 delays the participation in the emission-limitation stage of the low-income non-Annex I regions by 10-15 years, and slightly decreases their emission allowances in the short-term. Higher CR-values (above 10) would delay the participation of low- and middle-income non-Annex I regions too long, in particular, East Asia. This not only increases the emission reduction burden of Annex I, but could also hinder the development of a viable emissions trading market. Moreover, it would imply that many
9 For MS 1 and MS 2, these low-income non-Annex I regions have their first emission intensity targets in the
non-Annex I regions were considerably behind schedule or had even completely skipped the emission-limitation stage, since they are already able to meet the second threshold for stage 3 burden sharing, i.e. world average per capita emission threshold (MS 1) or the CR-threshold (MS 2). This would lead to sudden strong emission reductions for the non-Annex I regions when entering the emission-reduction stage (see also Figure B.1, Appendix B).
CRI-index baseline 0 2 4 6 8 10 12 0 2500 5000 7500 10000 12500 15000 per capita income (in ppp $)
pe r c api ta C O 2 emi ss ion s ( tC O 2/c ap. yr ) Central America South America Northern Africa Western Affrica Eastern Africa Southern Africa 2050 (WAF) date of achieving CR = 5 20002030 2050 2040 CRI-index baseline 0 2 4 6 8 10 12 0 2500 5000 7500 10000 12500 15000 per capita income (in ppp $)
per c api ta C O 2 em is si on s ( tC O 2/c ap .y r) Middle East South Asia (India) East Asia (China) South East Asia
2010 (India)
Figure 3.1: Per capita emissions versus per capita income over the 2000-2050 period for Latin American and African regions (left), and Asian regions (right), for the CPI baseline scenario. The green line depicts the threshold value, CR = 5. The dates show when this threshold is reached. Note: the dots refer to the values in 2000,2005, …, 2050.
Table 3.2: Participation of non-Annex I regions in the emission-limitation stage (stage 2) for the MS variants
Regions Central America South America Northern Africa Western Africa Eastern Africa Southern Africa Middle East South Asia East Asia SE Asia Stage 2 2012 2012 2012 2055 2065 2012 2012 2015 2012 2012
Note: participation in 2012 means that from 2012 on a region participates in the emission-limitation stage, with their first emissions intensity target by 2015.
Main finding
• Under the S550e emission profile, a first threshold based on a Capability–
Responsibility (CR) index of five results in early participation (2015) of all non-Annex I regions, except for South Asia (after 2015) and Western and Eastern Africa (after 2050) in the emission-limitation stage.
Second threshold MS 1 –For the second participation threshold for the emission-reduction
stage, the MS 1 variant assumes 100% of world average per capita emissions. This threshold results in a gradual convergence of per capita emissions between Annex I and Annex I overtime. A value below 100% results in a premature participation of the non-Annex I regions. The per capita emissions of non-Annex I and non-non-Annex I also start to
diverge. A value of more than 110% results in a convergence of the Annex I and non-Annex I per capita emissions before 2040. The East Asia (China) region plays a key role in this outcome. When East Asia enters the emission reduction regime, its emission
allowances will have to decrease considerably, thereby relaxing the emission reductions for the other participating regions. For this reason, East Asia’s entry strongly determines the reduction efforts of the Annex I countries. For the 100% variant, East Asia enters the emission-reduction stage in 2020, for 110%, 5 years later and for 120%, again 5 years later (see Figure B.2 in Appendix B).
per capita emissions (MS1) 0 1 2 3 4 5 6 7 8 2000 2010 2020 2030 2040 2050 time (years) tCO2/cap.yr Central America South America Northern Africa Western Affrica Eastern Africa Southern Africa w orld 2035 (NAF) 2025 (SAF) 2005 (SAM) 2030 (CAM)
per capita emissions (MS1)
0 1 2 3 4 5 6 7 8 9 2000 2010 2020 2030 2040 2050 time (years) tCO2/cap.yr Middle East South Asia (India) East Asia (China) South East Asia w orld
2030 (SEAS) 2015 (China)
2040 (India)
Figure 3.2: Per capita CO2-equivalent emissions over the 2000-2050 period for Latin
American and African regions (left), and Asian regions (right), for the MS 1 variant. The thick red line depicts the threshold value of world average per capita emissions. The dates show when this threshold is reached.
Table 3.3 shows when non-Annex I regions start participating in the emission-reduction stage. The moment the threshold level is reached is depicted in Figure 3.2. This clearly shows that the actual participation is delayed by 5-9 years due to policy delays (see section 2.2). Almost all non-Annex I regions now participate before 2050, except for Western and Eastern Africa. South America and the Middle East & Turkey will have to participate directly in the emission-reduction stage after Kyoto, since they already reach the per capita emission threshold by 2000 and, so, skip the emission-limitation stage.
Table 3.3: Participation of non-Annex I regions in the de-carbonisation and emission-reduction stage (stages 2 and 3) for the MS1 variant
Regions Central
America SouthAmerica NorthernAfrica WesternAfrica EasternAfrica SouthernAfrica MiddleEast SouthAsia EastAsia SEAsia
Stage 2 2012 ---- 2012 2055 2065 2012 --- 2015 2012 2012
Stage 3 2035 2012 2040 2060 2075 2030 2012 2045 2020 2035
Main findings
• A participation threshold based on world average per capita emissions implies that the emission reduction efforts of Annex I regions will enhance the participation of the non-Annex I regions.
• This threshold in combination with the use of per capita emissions as burden-sharing key tends to result in some convergence of per capita emissions of Annex I and non-Annex I regions in the long term (by 2050).
Second threshold MS 2 – The assumptions for the MS 2 variant are the same as for MS 1,
except for the threshold for the emission-reduction stage, which is now based on a second CR-index set on CR = 12. Higher CR-values represent the main delay in the participation of the major non-Annex I regions (in particular, East Asia), thereby increasing the Annex I reduction efforts (see also Figure C.1). A lower CR-value would imply the early
participation of the low- and middle-income non-Annex I regions, especially for East Asia and Southern Africa, which may not be realistic. CR-values as high as 15 lead to negative emission allowances for the Annex I regions. Therefore, a CR-threshold value of 12 was chosen.
Compared to their participation under the dynamic per capita emission threshold, a
participation threshold based on a CR = 12 value results into an earlier participation of the low- and middle-income non-Annex I regions, especially East Asia and South-East Asia. This threshold delays the participation of the low- and middle- income non-Annex I regions, especially Southern Africa, with a low per capita income, but relatively high per capita emissions, and the low-income non-Annex I regions (see Tables 3.4) (see also Figure 3.3). There are now also a number of regions that skip the emission-limitation stage, and enter the emission-reduction stage directly after Kyoto, i.e. Central America, South America, Middle East & Turkey and East Asia. The outcomes are quite sensitive for the exact CR-value (see also Figure C.1).
Table 3.4: Participation of non-Annex I regions in the de-carbonisation and emission-reduction stage for the MS 2 variant (the difference with the entry date of stage 3 for MS 1 is also given here, in which the grey boxes indicate the earlier entry variants)
Regions Central
America SouthAmerica NorthernAfrica WesternAfrica EasternAfrica SouthernAfrica MiddleEast SouthAsia EastAsia SE Asia
Stage 2 --- --- 2012 2055 2065 2012 ---- 2015 --- 2012
Stage 3 2015 2012 2050 2100 2100 2060 2012 2050 2015 2030
Comp.
to MS 1 earlier20 yr Same 10 yrlater 40 yrlater 25 yrlater 30 yrlater Same later5 yr earlier5 yr earlier5 yr CR-index MS2 0 2 4 6 8 10 12 0 2500 5000 7500 10000 12500 15000 per capita income (in ppp $)
pe r c api ta C O 2 emi ss ion s ( tC O 2/c ap. yr )
Central America (CAM) South America (SAM) Northern Africa Western Affrica Eastern Africa Southern Africa 2045 (NAF) 2010 (CAM) 2005 (SAM) 2050 2000 2010 2030 2050 (WAF) CR-index MS2 0 2 4 6 8 10 12 0 2500 5000 7500 10000 12500 15000 per capita income (in ppp $)
per c api ta C O 2 em is si on s ( tC O 2/c ap .y r) Middle East South Asia (India) East Asia (China) South East Asia
2010 (China)
2045 (India)
2025 (SEAS)
Figure 3.3: Per capita emissions versus per capita income over the period 2000-2050 for Latin American and African regions (left), and Asian regions (right), for the MS 2 variant. The green line depicts the first threshold value CR = 5 and the red line the second threshold CR = 12. The dates show when this threshold was reached.
Main findings
• Compared to a participation threshold based on world average per capita emissions (MS 1), a threshold for the emission-reduction stage based on a Capability–Responsibility index (MS 2) of 12 results in the short-term in an earlier participation of middle- and high-income non-Annex I regions (Latin America, Middle East & Turkey) and South-East & South-East Asia. However, the participation of Southern and Northern Africa (low per capita income and relatively high per capita emissions) and the low-income non-Annex I regions comes later.
Second threshold MS 3 – The MS 3 variant differs from the previous MS 1 and MS 2
variants with respect to the second transition stage. Instead of de-carbonisation targets, allowable emissions in the transition stage are determined by a prescribed slowing-down of the emission growth to a final stabilisation. The length of the transition period is not
determined by the level of as second threshold, but by a transition constant (TC) value, the length of which is calculated by dividing the TC value by per capita emissions (in tCO2/cap
yr[?? zie pag. 18] ) in the reference period. Here, a value of 70 was chosen for TC as this results by 2040 in a convergence in Annex I and non-Annex I per capita emissions under the S550e profile. A sensitivity analysis for different TC values is presented in Appendix D (Figure D.1), while Table 3.5 presents the length of the stabilisation period, which is also indicated with the red line in Figure 3.4.
Compared to a per capita emission threshold (MS 1), this approach leads for the non-Annex I regions, except for Central America, Northern Africa and South-East Asia, to a later
participation in the emission-reduction stage. However, compared to a CR-threshold (MS 2), this approach leads to a later participation of middle- and high-income non-Annex I regions and an earlier participation of the low-income non-Annex I regions.
CO2 eq. emissions
0.0 0.2 0.4 0.6 0.8 1.0 1990 2000 2010 2020 2030 2040 2050 time (years) GtCO2/yr Central America South America Northern Africa Western Affrica Eastern Africa Southern Africa stabilisation period
CO2 eq. emissions
0.0 0.5 1.0 1.5 2.0 2.5 3.0 1990 2000 2010 2020 2030 2040 2050 time (years) GtCO2/yr Middle East South Asia (India) East Asia (China) South East Asia stabilisation
period
Figure 3.4: Total emission allowances over the 2000-2050 period for the Latin American and African regions (left), and Asian regions (right), for the MS 3 variant. The red line shows the stabilisation period in which the first threshold was reached.
Table 3.5: Participation of non-Annex I regions in the de-carbonisation and emission-reduction stage for the MS 3 variant (the differences between entry date of stage 3 for MS 1 and for MS 2 are also given, in which the grey boxes indicate the earlier entry variants)
Regions Central America South America Northern Africa Western Africa Eastern Africa Southern Africa Middle East South Asia East Asia SE Asia Stage 2 2012 2012 2012 2055 2065 2012 2012 2015 2012 2012 Stage 3 2025 2025 2030 2085 2095 2030 2020 2045 2025 2030 Stab. Period 15 15 20 30 30 20 10 30 15 20 Comp. to MS 1 10 yr earlier 15 yr later 10 yr earlier 25 yr later 20 yr later 5 yr later 10 yr later Same 5 yr later 5 yr earlier Comp.
to MS 2 10 yrlater 15 yrlater earlier20 yr earlier15 yr earlier5 yr earlier30 yr 10 yrlater earlier5 yr later5 yr Same
Main findings
• The MS 3 approach with a TC value of 70 leads in the short-term to later participation of the middle- and high income non-Annex I (East Asia).
3.2 The Multi-Stage and Per Capita Convergence results
Timing of participation for the MS variants – Table 3.6 briefly overviews the participation of
the non-Annex I regions in the emission-limitation and emission-reduction stage. All three MS variants show an early entry in the emission-limitation stage – before 2020 – of most non-Annex I regions, except for Western and Eastern Africa, which only enter after 2050.
For the emission-reduction stage, MS 2 leads to the earliest entry for the middle- and high-income non-Annex I regions, whereas the MS 3 variant shows the latest entry. All three MS variants lead for the low-income non-Annex I regions to a late entry, especially for the MS 2 and MS 3 variants. For the low- and middle-income region Southern Africa, there are notable differences in the entry dates. Due to its relatively high per capita emission level, this region participates early in Stage 3 in the MS 1 variant (emission trigger) and MS 3 variant (short transition period), whereas the CR-threshold in MS 2 delays the participation in Stage 3.
Table 3.6 S550e profile, entry dates of non-Annex I regions in Stage 2 and 3
Regions Central America South America Northern Africa Western Africa Eastern Africa Southern Africa Middle East South Asia East Asia SE Asia Stage 2 2012 2012 2012 2055 2065 2012 2012 2015 2012 2010 Stage 3 Multi-Stage 1 2035 2010 2040 2060 2075 2030 2012 2045 2020 2035 Multi-Stage 2 2015 2012 2050 2100 2100 2060 2012 2050 2015 2030 Multi-Stage 3 2025 2025 2030 2085 2095 2030 2020 2045 2025 2030
* For each region, white boxes indicate the earliest entry variant, dark-grey the latest, and light grey in between.
** South America and Middle East & Turkey enter directly into Stage 3 after Kyoto %-change compared to 1990-level in 2025
-60 -40 -20 0 20 40 Canada & USA Enlarged EU
FSU Oceania Japan
%-change compared to 1990-level in 2025
0 50 100 150 200 250 300 350 Latin America Africa ME & Turkey South Asia SE & E.Asia Multi-Stage 1 Multi-Stage 2 Multi-Stage 3 PCC50 PCC100 Baseline
%-change compared to 1990-level in 2050
-100 -80 -60 -40 -20 0 20 40 Canada & USA Enlarged EU
FSU Oceania Japan
%-change compared to 1990-level in 2050
-100 0 100 200 300 400 500 Latin America Africa ME & Turkey South Asia SE & E.Asia
Figure 3.5: Percentage change in the CO2-equivalent emission allowances relative to the
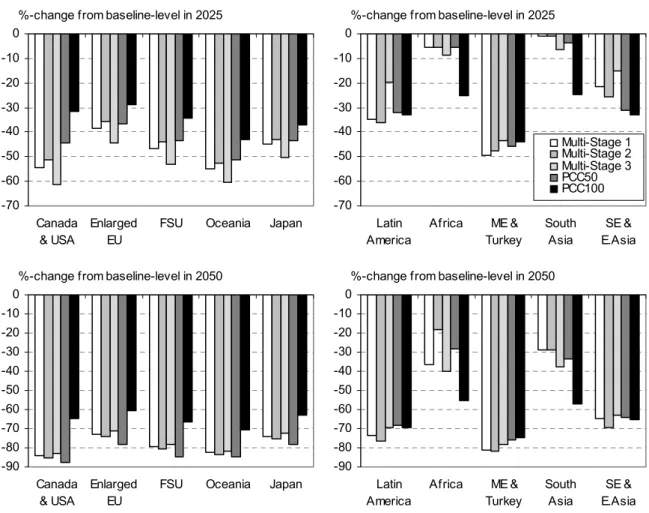
Figure 3.5 depicts the change in the ratio of allowances to the 1990 level for 10 aggregated regions and two time horizons, short-term (2025) and long-term (2050). Regional emission allowances can also be compared with the corresponding baseline emissions, providing more information on the magnitude of actual effort required from the different Parties (Figure 3.6). Therefore, Table 3.7 provides both ratios of reduction.
Comparing emission allocations for the MS variants – For the Annex I regions, the lowest
reductions are for MS 2, whereas MS 3 shows the highest reduction levels. This is a direct result of the respectively early and late entry into stage 3 of middle- and high-income non-Annex I regions. These regions show an opposite pattern, with the lowest reductions in MS 3. The East Asia region plays a key role in the MS outcomes, since when East Asia enters the emission-reduction stage, it considerably relaxes the reductions for the other
participating regions, i.e. Annex I. For the low-income non-Annex I regions, the MS 3 variant is, in general, the regime with the strongest constraints due to higher reductions in the emission-limitation stage. For the Southern Africa region, the differences in the entry dates for MS variants explain the wide range in outcomes (Table 3.6).
%-change from baseline-level in 2025
-70 -60 -50 -40 -30 -20 -10 0 Canada & USA Enlarged EU
FSU Oceania Japan
%-change from baseline-level in 2025
-70 -60 -50 -40 -30 -20 -10 0 Latin America Africa ME & Turkey South Asia SE & E.Asia Multi-Stage 1 Multi-Stage 2 Multi-Stage 3 PCC50 PCC100
%-change from baseline-level in 2050
-90 -80 -70 -60 -50 -40 -30 -20 -10 0 Canada & USA Enlarged EU
FSU Oceania Japan
%-change from baseline-level in 2050
-90 -80 -70 -60 -50 -40 -30 -20 -10 0 Latin America Africa ME & Turkey South Asia SE & E.Asia
Figure 3.6: Percentage change in the CO2-equivalent emission allowances relative to the
baseline-level for the MS and PCC variants in 2025 and 2050 under the S550e profile. Annex I and non-Annex I targets for the MS variants – In 2025, the Annex I regions need to
reduce their emissions by about 30-60% compared to 1990 levels, whereas the non-Annex I regions can still increase their emissions compared to 1990 levels. Nevertheless, the non-Annex I regions do have to reduce their emissions compared to the baseline levels. The reductions are more differentiated across non-Annex I regions than across Annex I regions (see Table 3.7). The low-income non-Annex I regions experience small emission
constraints in all MS variants, with emissions close to their baseline (less than 10-20% reduction).
In 2050, the differences for the Annex I regions are relatively small, with reductions in the order of 70-80% for the MS variants. The middle- and high-income non-Annex I regions show high reductions. For the low-income non-Annex I regions, the reductions compared to the baseline emissions are still less compared to the other regions, but already reach percentages of 30-40% for South Asia, and 30-70% for Northern and Southern Africa; only Western and Eastern Africa still follow their baseline emissions.
Main findings:
Emission-limitation stage
• For the emission-limitation stage all MS variants show an early participation of the non-Annex I regions, except for Western- and Eastern Africa (after 2050).
Emission-reduction stage
• For the middle- and high-income non-Annex I regions MS 2 leads to the earliest entry (already in the second CP), whereas MS 3 shows the latest entry.
• For the low-income non-Annex I regions, all three MS variants show a late entry, especially for MS 2 and MS 3.
Emission allowances Short-term:
• For the Annex I regions the MS 2 variant leads to the lowest emission reduction efforts, whereas MS 3 leads to highest reduction efforts. This is a result of the earlier entry of middle- and high-income non-Annex I regions for MS 2.
• The middle- and high-income non-Annex I region show an opposite pattern.
• The emissions of low-income non-Annex I regions are close to the baseline emissions. Long-term
• For the Annex I regions all MS variants lead to high emission reductions efforts. • Also the middle- and high-income non-Annex I regions show high reductions.
• For the low-income non-Annex I regions, the MS 3 variant represents the regime with the strongest constraints due to higher reductions in stage 2.
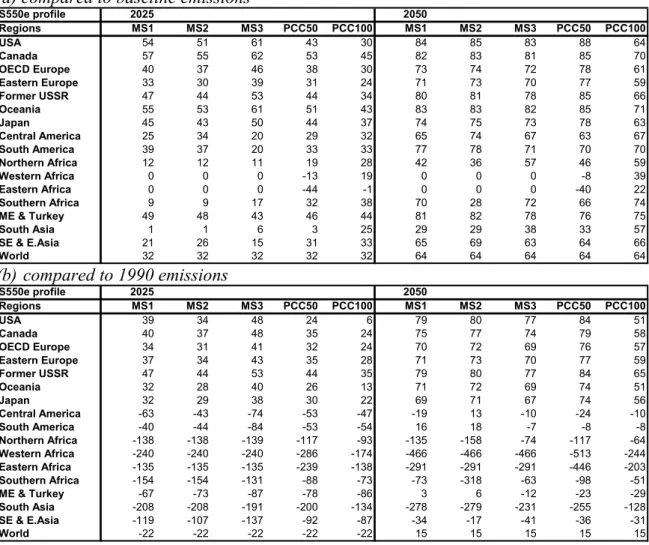
Table 3.7: Reductions for the MS (MS) and PCC variants in the year 2025 and 2050 under the S550e profile for the CPI baseline scenario
(a) compared to baseline emissions
S550e profile 2025 2050 Regions MS1 MS2 MS3 PCC50 PCC100 MS1 MS2 MS3 PCC50 PCC100 USA 54 51 61 43 30 84 85 83 88 64 Canada 57 55 62 53 45 82 83 81 85 70 OECD Europe 40 37 46 38 30 73 74 72 78 61 Eastern Europe 33 30 39 31 24 71 73 70 77 59 Former USSR 47 44 53 44 34 80 81 78 85 66 Oceania 55 53 61 51 43 83 83 82 85 71 Japan 45 43 50 44 37 74 75 73 78 63 Central America 25 34 20 29 32 65 74 67 63 67 South America 39 37 20 33 33 77 78 71 70 70 Northern Africa 12 12 11 19 28 42 36 57 46 59 Western Africa 0 0 0 -13 19 0 0 0 -8 39 Eastern Africa 0 0 0 -44 -1 0 0 0 -40 22 Southern Africa 9 9 17 32 38 70 28 72 66 74 ME & Turkey 49 48 43 46 44 81 82 78 76 75 South Asia 1 1 6 3 25 29 29 38 33 57 SE & E.Asia 21 26 15 31 33 65 69 63 64 66 World 32 32 32 32 32 64 64 64 64 64 (b) compared to 1990 emissions S550e profile 2025 2050 Regions MS1 MS2 MS3 PCC50 PCC100 MS1 MS2 MS3 PCC50 PCC100 USA 39 34 48 24 6 79 80 77 84 51 Canada 40 37 48 35 24 75 77 74 79 58 OECD Europe 34 31 41 32 24 70 72 69 76 57 Eastern Europe 37 34 43 35 28 71 73 70 77 59 Former USSR 47 44 53 44 35 79 80 77 84 65 Oceania 32 28 40 26 13 71 72 69 74 51 Japan 32 29 38 30 22 69 71 67 74 56 Central America -63 -43 -74 -53 -47 -19 13 -10 -24 -10 South America -40 -44 -84 -53 -54 16 18 -7 -8 -8 Northern Africa -138 -138 -139 -117 -93 -135 -158 -74 -117 -64 Western Africa -240 -240 -240 -286 -174 -466 -466 -466 -513 -244 Eastern Africa -135 -135 -135 -239 -138 -291 -291 -291 -446 -203 Southern Africa -154 -154 -131 -88 -73 -73 -318 -63 -98 -51 ME & Turkey -67 -73 -87 -78 -86 3 6 -12 -23 -29 South Asia -208 -208 -191 -200 -134 -278 -279 -231 -255 -128 SE & E.Asia -119 -107 -137 -92 -87 -34 -17 -41 -36 -31 World -22 -22 -22 -22 -22 15 15 15 15 15
3.2.1 The Per Capita Convergence results
• Comparing emission allocations with the Per Capita Convergence variant – The PCC
variants generally show larger differences in regional emission allowances than the MS variants. By 2025 Annex I reductions from 1990 levels range from 25 to 45% for the PCC50 variant and less than 10% to 35% for the PCC100 variant. The difference in convergence year appears to have a major influence on the distribution of emission allowances among Annex I and non-Annex I regions. A delay in the convergence year results in much smaller reductions in Annex I emission allowances on both the short and longer term. The PCC100 variant results in substantial smaller emission reductions for the Annex I regions than the PCC50 variant and also than the MS variants, and vice versa for the non-Annex I regions. The results of PCC50 variant are comparable to the MS variants, with some qualifications. First, for Annex I, the emission reductions for the PCC50 variant tend to be smaller in the short term and larger in the long term than the MS variants. Particularly in the variant of the USA/Canada, the MS variants in the short term result in much larger reductions than the PCC50 variant. Second, for SE& East Asia, the PCC50 also results in larger emission reductions (from baseline levels) than in the MS variants, since their per capita emissions are close to the world-average. Finally, it is interesting to note that Western and Eastern Africa gain from the excess emission allowances (not
shown). However, under the considered baseline and S550e profile, the PCC50 variant does not lead to significant amounts of excess emissions. In fact, due to the higher per capita emissions of Southern Africa, there are no excess emissions for Africa as a whole. In
contrast, Africa, like South Asia, would already need to substantially limit its emissions in the PC100 variant.
Figure 3.7 also depicts for eight aggregated Annex I and non-Annex I regions the emission allowances for all MS and PCC variants, as well as their baseline emissions.
Main findings:
• The PCC100 variant results into substantial smaller emission reduction efforts for the Annex I regions than the other MS variants and PCC50 variant. The PCC100 variant is thus the most attractive for Annex I and least attractive for the non-Annex I regions. The results of PCC50 variant are more comparable to the MS variants.
• On the short term, for the US & Canada the PCC50 variant is more attractive than the MS variants; for the other Annex I regions the differences are relatively small. The MS 3 variant remains the least attractive for the Annex I regions on the short term. • In the long term, the PCC50 variant is less attractive for Annex I regions than the
MS variants.
• For the middle- and high income non-Annex I regions (Latin America, Middle East & Turkey) the MS 3 approach remains the most attractive approach.
• For the low-income non-Annex I regions the differences in results of the PCC and MS variants are relatively large. The PCC50 variant is generally not more favourable for the low-income regions than the MS variants. In particular MS 2 variant is generally more favourable.
• The PCC approach can result into excess emission allowances. However, under the S550e profile and the CPI baseline, the PCC variants do not lead to significant amounts of excess emissions.
Box 3.1 Relative attractiveness of the MS and PCC variants
Table 3.8 and 3.9 ranks the percentage change relative to the baseline-emission level for the target year, 2025, of each regime in comparison to the outcomes of the other regimes
explored. The approach resulting in, relatively speaking, the lowest relative emission reductions (or highest emission allowances) is indicated in green, hereafter classified as the most favourable or most attractive approach compared to the other regimes explored. The approach resulting in the highest relative emission reductions (or lowest emission
allowances) is indicated in red; this will be forthwith classified as the most favourable or most attractive approach compared to the other regimes explored. White indicates an intermediate position. It should be noted that this ranking is always in relative comparison to the outcomes of the other regimes explored.
Table 3.8: Regional relative scores for different approaches by 2025 for the reference variants compared to baseline for the S550e profile *
S550 MS 1 MS 2 MS 3 PCC50 PCC10 0 Canada &USA 55 51 61 44 32 OECD-Europe 40 37 46 38 30 EEUR &FSU 44 41 50 41 32 Oceania 55 53 61 51 43 Japan 45 43 50 44 37 Latin America 35 36 20 32 33 Africa 6 6 8 6 25 ME & Turkey 49 48 43 46 44 South Asia 1 1 6 3 25
SE & East Asia 21 26 15 31 33
* Green area indicates most attractive regime, and red area indicates least attractive regime for each region
Table 3.9: Regional relative scores for different approaches by 2050 for the reference variants compared to baseline for the S550e profile *
S550 MS 1 MS 2 MS 3 PCC50 PCC10 0 Canada &USA 84 85 83 88 65 OECD-Europe 73 74 72 78 61 EEUR &FSU 78 79 77 83 65 Oceania 83 83 82 85 71 Japan 74 75 73 78 63 Latin America 73 77 70 68 70 Africa 37 18 40 28 55 ME & Turkey 81 82 78 76 75 South Asia 29 29 38 33 57
CO2-eq emissions Canada & US 0 3 6 9 12 1990 2000 2010 2020 2030 2040 2050 time (years) GtCO2/yr M ulti-Stage 1 M ulti-Stage 2 M ulti-Stage 3 P CC50 P CC100 B aseline
CO2-eq emissions Latin America
0 3 6 9 12 1990 2000 2010 2020 2030 2040 2050 time (years) GtCO2/yr M ulti-Stage 1 M ulti-Stage 2 M ulti-Stage 3 PCC50 PCC100 Baseline
CO2-eq emissions Enarged EU-25
0 2 4 6 8 10 1990 2000 2010 2020 2030 2040 2050 time (years)
GtCO2/yr CO2-eq emissions Africa
0 2 4 6 8 1990 2000 2010 2020 2030 2040 2050 time (years) GtCO2/yr
CO2-eq emissions EEUR & FSU
0 1 2 3 4 5 1990 2000 2010 2020 2030 2040 2050 time (years) GtCO2/yr M ulti-Stage 1 M ulti-Stage 2 M ulti-Stage 3 P CC50 P CC100 B aseline
CO2-eq emissions South Asia
0 2 4 6 8 10 1990 2000 2010 2020 2030 2040 2050 time (years) GtCO2/yr
CO2-eq emissions Japan
0.0 0.5 1.0 1.5 2.0 1990 2000 2010 2020 2030 2040 2050 time (years) GtCO2/yr
CO2-eq emissions SE & E.Asia
0 5 10 15 20 25 1990 2000 2010 2020 2030 2040 2050 time (years) GtCO2/yr
Figure 3.7: CO2-equivalent emission allowances for the MS and PCC variants for the
3.3 Robustness of results for the Multi-Stage variants for the S550e
profile
As the results found are based on various assumptions we explored the robustness of our findings by performing a sensitivity analysis by varying the key parameters. We focused on the assumptions for the MS variants since the sensitivity of the PCC results to the selection of the convergence year is already shown. We varied the values of the main participation thresholds of the Stage 3 for MS 1 and MS 2, as well as the transition constant for MS 3 (first three column bars). More specifically, for MS 1: 80-120 % of world-average per capita emission threshold, for MS 2 CR-threshold 10-15 and for MS 3: TC value 50-100. Figure 3.8 shows the results (first three columns).
Figure 3.8 shows that for the Annex I regions, MS 3 retains the highest reductions in the short term. In general, the difference in the outcomes of MS 1 and MS 2 are small.
Depending on the parameter settings of MS 1 and MS 2, PCC50 may now no longer result in fewer reductions than the MS variants in the short term, and the largest reduction in the long term. PCC100 remains the variant with the lowest reductions in both the short and long term.
For the middle- and high-income non-Annex I regions, changes in the parameter values do affect the outcomes, but MS 3 still leads to the smallest reductions. For these regions, different thresholds for the entry to stage 2 can have a significant influence on the
allowances under the MS 1 regime, since their per capita emissions are close to the world average (especially for the South-East and East Asia and the Middle East). Changing the Capacity-Responsibility threshold (MS 2) seems to have a smaller impact on the outcomes.
%-change compared to 1990-level in 2025
-60 -50 -40 -30 -20 -10 0 Canada & USA OECD Europe EEE & FSU Oceania Japan
%-change compared to 1990-level in 2025
0 50 100 150 200 250 300 350 Latin America Africa ME & Turkey South Asia SE & E.Asia Multi-Stage 1 Multi-Stage 2 Multi-Stage 3 PCC50 PCC100
%-change compared to 1990-level in 2050
-100 -80 -60 -40 -20 0 Canada & USA OECD Europe EEE & FSU Oceania Japan
%-change compared to 1990-level in 2050
-100 0 100 200 300 400 500 Latin America Africa ME & Turkey South Asia SE & E.Asia
For the low-income non-Annex-I regions, changes of parameter values for the MS 1 and MS 2 variants do not affect the outcomes in the short-term, since they do not yet participate in the emission-reduction stage. For MS 3, the effect of changing the TC value is also small. For the Annex-I regions, MS 3 remains the one with the highest reductions on the short-term and PCC100 the one with the lowest reductions. Depending on the parameter settings of MS 1 and MS 2, now PCC50 may no longer be more the one with the lower reductions. In general, the difference the outcomes of MS 1 and MS 2 are small. In the long term the differences between the MS variants and PCC50 become small.