Contact:
E.M.J. Verbruggen
Expert Centre for Substances E-mail: eric.verbruggen@rivm.nl
RIVM report 601782001/2007
Guidance for the derivation of environmental risk limits within the framework of
‘International and national environmental quality standards for substances in the Netherlands’ (INS)
Revision 2007
P.L.A. van Vlaardingen and E.M.J. Verbruggen
This investigation has been performed for the account of the Directorate-General for Environmental Protection, Directorate for Chemicals, Waste and Radiation, in the context of the project ‘International and national environmental quality standards for substances in the Netherlands’, RIVM-project no. 601782.
National Institute for Public Health and the Environment, PO Box 1, 3720 BA Bilthoven, the Netherlands. Tel. 31-30-2749111, fax. 31-30-2742971
This report is based on:
Lepper P. 2005. Manual on the Methodological Framework to Derive Environmental Quality Standards for Priority Substances in accordance with Article 16 of the Water Framework Directive (2000/60/EC). Schmallenberg, Germany: Fraunhofer-Institute Molecular Biology and Applied Ecology. Version dated September 15, 2005.
European Commission. 2003. Technical Guidance Document in support of Commission Directive 93/67/EEC on Risk Assessment for new notified substances, Commission Regulation (EC) No 1488/94 on Risk Assessment for existing substances and Directive 98/8/EC of the European Parliament and of the Council concerning the placing of biocidal products on the market. Ispra, Italy: European Chemicals Bureau, Institute for Health and Consumer Protection.
Rapport in het kort
Handleiding voor de afleiding van milieurisicogrenzen binnen het raamwerk ‘(Inter)nationale Normen Stoffen’ (INS) - Revisie 2007
Dit rapport is de handleiding voor het afleiden van milieurisicogrenzen die worden gebruikt in het Nederlandse milieubeleid. Het rapport is een herziening van de INS-handleiding uit 2001.
Nederland onderscheidt vier milieurisicogrenzen: het verwaarloosbaar risiconiveau (VR), het maximaal toelaatbaar risiconiveau (MTR), het ernstig risiconiveau (ER) en de maximaal toelaatbare concentratie voor ecosystemen (MACeco).
Welke basisgegevens zijn nodig voor het afleiden van een milieurisicogrens? De handleiding geeft dit overzicht en beschrijft hoe deze literatuurgegevens moeten worden geëvalueerd op juistheid en bruikbaarheid. Vervolgens wordt de methodiek voor het afleiden van milieurisicogrenzen
beschreven, inclusief de benodigde berekeningen. Voor water en sediment is deze gelijk aan de methodiek zoals voorgeschreven voor de Europese Kaderrichtlijn Water. Voor bodem is direct aangesloten op de technical guidance documenten (TGD) voor EU risicobeoordelingen van nieuwe en bestaande stoffen en biociden. De overige milieurisicogrenzen, bijvoorbeeld het VR en het ER, zijn onderdeel van het Nederlandse milieubeleid en voor de afleiding van deze risicogrenzen worden aparte procedures beschreven.
Trefwoorden: milieurisicogrenzen, Kaderrichtlijn Water, handleiding, richtsnoer, milieukwaliteitsnormen
Abstract
Guidance for the derivation of environmental risk limits within the framework of ‘International and national environmental quality standards for substances in the Netherlands’ (INS) - Revision 2007
This report forms the guidance document for the derivation of environmental risk limits used in environmental policy in the Netherlands. The report is a revision of the INS-guidance from 2001. The following four environmental risk limits are distinguished in the Netherlands: negligible concentration (NC), maximum permissible concentration (MPC), serious risk concentration (SRC) and the maximum acceptable concentration for ecosystems (MACeco).
The guidance document answers the question on what data are needed for the derivation of an environmental risk limit by overviewing and describing how data from the literature should be evaluated for reliability and usefulness. The method of derivation, including the necessary
calculations, is described. For water and sediment, the methodology is the same as that prescribed to meet requirements in the European Water Framework Directive. For soil, the methodology for the European risk assessment for new and existing substances and biocides is followed. The remaining risk limits (e.g. NC and SRC) which are required to comply with Dutch environmental policy, are subject to separate derivation procedures. These too are presented here.
Key words: environmental risk limits, Water Framework Directive, guidance, environmental quality standards
Contents
Samenvatting 11
Summary 13
1. Introduction 15
1.1 Aim and use 15
1.2 Background and sources 15
1.3 Reader’s guide 16
1.4 Environmental risk limits and environmental quality objectives 16 1.5 ERLs for ecosystem health and ERLs for human health 17
1.6 Standard soil, sediment and suspended matter 21
2. Data collection and evaluation 23
2.1 Physicochemical data 23
2.1.1 Data collection 23
2.1.2 Data evaluation and data tables 25
2.1.3 Data selection 32
2.2 Toxicity data 33
2.2.1 Data collection 33
2.2.2 Data evaluation and data tables 34
2.2.3 Aquatic toxicity data tables 41
2.2.4 Terrestrial and sediment toxicity data tables 49
2.2.5 Bird and mammal toxicity data tables 52
2.2.6 Data selection 54
2.2.7 Data treatment 56
2.3 Bioconcentration and biomagnification data 58
2.3.1 Data collection 58
2.3.2 Data evaluation and data tables 59
2.3.3 Bioconcentration data tables 59
2.3.4 Data selection 61
2.4 Human toxicological data 64
2.4.1 Threshold limits 64
2.4.2 Data collection for MPChuman, soil calculation 65
3. Derivation of MPC 67
3.1 Aquatic compartment 67
3.1.1 Trigger values 67
3.1.2 MPCeco, water – freshwater, ecotoxicity 70
3.1.3 MPCeco, marine – marine water, ecotoxicity 78
3.1.4 MPCsp, water and MPCsp, marine – secondary poisoning 82
3.1.5 MPChh food, water – human consumption of fishery products 84
3.1.6 MPCdw, water – drinking-water abstraction 84
3.1.7 Selection of the final MPC for the water compartment 86
3.1.8 Calculation of the MPC in suspended matter 87
3.2 Sediment compartment 88
3.2.1 MPCsediment – freshwater 88
3.3 Soil compartment 91
3.3.1 Trigger values 91
3.3.2 Soil microbial processes and enzymatic reactions 91
3.3.3 Taxonomic groups and trophic levels 92
3.3.4 MPCeco, soil – ecotoxicity in soil 92
3.3.5 MPCsp, soil – secondary poisoning in soil 93
3.3.6 MPChuman, soil – human-toxicological risk limits for soil 94
3.3.7 Selection of the final MPC for the soil compartment 98
3.4 Groundwater compartment 99
3.4.1 ERL derivation 99
3.4.2 Use of dissolved versus total standards for groundwater 99
3.4.3 Relation of Dutch ERLs to EU groundwater threshold values 100
3.5 Air compartment 100
3.5.1 MPCeco, air – ecotoxicity via air 100
3.5.2 MPChuman, air - human toxicological risk limit for air 100
3.5.3 Selection of the final MPC for the air compartment 100
3.6 Environmental risk limits for metals 101
3.7 Equilibrium partitioning method 101
3.7.1 Calculation of Kcomp-water 102
3.7.2 EqP for sediment 102
3.7.3 EqP for soil 103
3.7.4 Recalculation to Dutch standard soil and sediment 103
4. Derivation of MAC, NC and SRCeco 105
4.1 MACeco, water – intermittent release/short-term exposure 105
4.1.1 Derivation of MACeco, water based on assessment factors 105
4.1.2 Derivation of MACeco, water based on species sensitivity distributions 107
4.1.3 Derivation of MACeco, water based on simulated ecosystem studies 107
4.1.4 Lower and upper limit of the MACeco, water – additional INS guidance 109
4.2 Derivation of NC 109
4.3 Derivation of SRCeco 110
5. Derivation of ERLs based on EU-RARs 113
5.1 MPC 113 5.1.1 MPCwater 113 5.1.2 MPCsoil 113 5.1.3 MPCsediment 113 5.2 NC 113 5.3 SRCeco 114
6. Taxonomic classification of species in ERL derivation 115
6.1 Taxa 115 6.2 Trophic levels 119 6.2.1 Aquatic ecosystem 119 6.2.2 Terrestrial ecosystem 119 Acknowledgements 121 References 123
Appendix 1: A1 values from Council Directive 75/440/EC 139
Appendix 2: DWS values from Council Directive 98/83/EC 141
Appendix 3: Soil classification 143
Samenvatting
Dit rapport is de handleiding voor de afleiding van milieurisicogrenzen op het nationale niveau. Dit rapport vervangt de INS handleiding van Traas (2001). Nieuwe elementen in deze handleiding zijn de integratie van de KRW en TGD methodieken en de afleiding van MTRs voor blootstelling van de mens via het milieu.
De afleiding van milieurisicogrenzen vindt plaats binnen het proces ‘(Inter)nationale Normen Stoffen’ (INS), ten behoeve van de uitvoering van het milieubeleid. In Nederland worden de
volgende milieurisicogrenzen onderscheiden: het verwaarloosbaar risiconiveau (VR), het maximaal toelaatbaar risiconiveau (MTR), het ernstig risiconiveau (ER) en de maximaal toelaatbare
concentratie voor ecosystemen (MACeco).
De methodiek voor het afleiden van het MTR en de MACeco voor de milieucompartimenten zoet en zout water en het MTR voor zoetwater-sediment en marien sediment, is gelijk aan de methodiek die onderdeel vormt van de Europese kaderrichtlijn water (KRW). Deze methodiek is vastgelegd in Lepper (2005), die in dit rapport is geïmplementeerd. Volgens de KRW methodiek wordt voor het compartiment water ook een MTR afgeleid die de mens beschermt tegen schadelijke effecten. De methodiek voor MTR afleiding voor het compartiment bodem is gebaseerd op het ‘technical
guidance document’ (TGD; European Commission, 2003). zoals gebruikt in de Europese
risicobeoordeling van nieuwe en bestaande stoffen en biociden. De methodiek voor de afleiding van de overige milieurisicogrenzen is gebaseerd op specifieke Nederlandse procedures. Ook deze procedures worden in dit rapport beschreven. Dit betreft: MTR voor grondwater, VR en EReco voor alle compartimenten en MTR voor humane blootstelling via bodem, grondwater en lucht.
Om milieurisicogrenzen af te kunnen leiden zijn verscheidene fysische, chemische en
toxicologische gegevens nodig. Dit rapport beschrijft gedetailleerd welke parameters nodig zijn en hoe gegevens dienen te worden verzameld, geëvalueerd en geselecteerd voordat met de afleiding van de milieurisicogrenzen wordt begonnen. Daarna volgt een stapsgewijze beschrijving van het afleiden van de risicogrenzen voor de verschillende milieucompartimenten. Daar waar
berekeningen plaatsvinden, zijn de benodigde formules gepresenteerd. Een volledige beschrijving van alle parameters en standaardwaarden die in de vergelijkingen worden gebruikt, wordt in het hoofdstuk ‘Abbreviations, variables and default values’ gegeven. Ook is een korte handleiding opgenomen voor het afleiden van milieurisicogrenzen wanneer die gebaseerd moeten worden op een Europees risicobeoordelingsrapport (EU RAR) voor een bestaande stof.
Summary
This report forms the guidance document for the derivation of environmental risk limits (ERLs) at the Dutch national level. This document replaces the INS guidance by Traas (2001). New elements in this guidance are the integration of WFD guidance, the TGD and the derivation of MPCs for human exposure.
The derivation of environmental risk limits takes place within the process of ‘International and national environmental quality standards for substances in the Netherlands’ (INS), in order to facilitate environmental policy. The four following ERLs are distinguished in the Netherlands: the negligible concentration (NC), the maximum permissible concentration (MPC), the serious risk concentration (SRC) and the maximum acceptable concentration for ecosystems (MACeco). The method for deriving the MPC and MACeco for freshwater and marine water and the MPC for freshwater and marine sediment, is the same as the guidance, which is part of the European Water Framework Directive (WFD). This methodology is laid down in Lepper (2005), which is
implemented in this report. For the water compartment, the ERL derivation according to the WFD methodology includes the derivation of an MPC protecting humans from adverse effects. The methodology for MPC derivation for the soil compartment is based on the technical guidance document (TGD; European Commission, 2003) used for the European risk assessment for new and existing substances, and biocides. The methodology for derivation of the remaining ERLs is based on Dutch procedures. These procedures also are described in this report. These ERLs are: MPC for groundwater; NC, SRCeco for all compartments, and MPCs for human exposure via soil,
groundwater and air.
Several physical, chemical and toxicological parameters are needed to derive ERLs. Detailed guidance is given on the parameters needed and how data should be collected, evaluated and selected before the ERL derivation is started. This is followed by a description of the stepwise derivation of the various ERLs for the environmental compartments. The necessary equations are provided where parameters need to be calculated as well as a full description of all parameters and default values used in equations.. Furthermore, guidance is given for ERL derivation in cases where this should be based on the outcomes of a European risk assessment report (EU RAR) for existing substances.
1.
Introduction
1.1
Aim and use
The aim of the present report is to provide adequate guidance for the derivation of environmental risk limits (ERLs) used in the Netherlands. The methodology given in the present report should be followed when deriving ERLs. That the methodology is ‘guidance’ implies that there is room to deviate from the methods described here. Deviating from the guidance is permitted when the circumstances give cause, e.g. when the compound of interest has specific properties or when specific relevant information is available for which guidance has not been developed. Please note that deviating from the guidance should always be motivated in the report describing the ERL derivation and be accompanied by a full description of the alternative method followed.
1.2
Background and sources
This report merges guidance from three different frameworks: the first is the guidance currently used in the Water Framework Directive (WFD, European Commission, 2000), the second is the risk assessment for new and existing substances and biocides (European Commission (Joint Research Centre), 2003a) and the third is ERL derivation specific to the Netherlands (VROM, 2004).
Water Framework Directive
Guidance for the derivation of quality standards in accordance with the European Commission Directive 2000/60/EC (European Commission, 2000) or WFD is laid down in Lepper (2005). This is a revised version of Annex 5 to the report, ‘Towards the Derivation of Quality Standards for Priority Substances in the Context of the Water Framework Directive’ (Lepper, 2002)1. Since Lepper (Lepper, 2005) will be cited regularly in this report, the abbreviation ‘FHI’ (Fraunhofer Institute) has been used for it. The present report implements FHI guidance in national guidance on ERL derivation for water and sediment, both in the freshwater and marine environment.
New and existing substances and biocides
Guidance for the risk assessment for new and existing substances and biocides is laid down in the ‘Technical Guidance Document’ or TGD (European Commission (Joint Research Centre), 2003a). In the present report, part II of the TGD will be cited most often; it will be abbreviated by ‘TGD’. If other parts than part II of the TGD are cited, a full citation will be given rather than using ‘TGD’. In the present report, the TGD is used for ERL derivation for soil.
Please note, however, that the FHI guidance cites the TGD for many topics. Therefore, the TGD is, in fact, present in many other sections of this report as well. It should be noted that although the FHI refers directly to the TGD for the majority of its items, there are also differences between the two documents (Vos and Janssen, 2005). These differences will also be described in detail in this report.
ERL derivation in the Netherlands
Historically, Dutch ERLs are derived within the project INS: ‘International and national
environmental quality standards for substances in the Netherlands’. The guidance within this project has developed over the years. The most recent guidance document was that by Traas (2001), which
1 The status of the document prepared by Lepper (2005) is not yet final. DG Environment intends to finalise and publish this document (together with Lepper, 2002) as a ‘Manual on the Methodological Framework Used to Derive Quality Standards for Priority Substances of the Water Framework Directive’ once the European Commission adopts its proposal (European Commission, 2004b).
became obsolete on 1-1-2004, because the Steering Committee for Substances decided to implement the TGD for derivation of Dutch ERLs. A new national guidance document was not published at that time. Therefore, the report presented here is an updated guidance for the project INS.
In summary, FHI guidance has been followed for water and sediment. For the subjects in this report where the WFD is not applicable, the guidance in this report is in accordance with the TGD.
However, for those subjects not covered by the TGD, national guidance is provided. This is part of the process 'International and national environmental quality standards for substances in the
Netherlands'.
1.3
Reader’s guide
A short overview of the topics dealt with in this guidance is given below.
Chapter 2 describes how data should be (i) collected, (ii) evaluated, (iii) handled (in order to derive useful endpoints), (iv) tabulated and (v) selected for ERL derivation. Detailed information is given on each of these topics.
Chapter 3 describes the methodology for derivation of the MPC. MPC derivation for each of the compartments: water, sediment, soil and groundwater, is described in a separate section. The MPC derivations for human toxicological endpoints for the compartments that are not covered by the FHI guidance (i.e. air, soil and groundwater) are dealt with in a separate section.
Chapter 4 describes how to derive the negligible concentration (NC), the maximum acceptable concentration for ecosystems (MACeco) and the serious risk concentration for
ecosystems (SRCeco). The method for derivation of the SRCeco is revised with respect to its earlier description (Verbruggen et al., 2001) and is now brought in line with TGD guidance.
Chapter 5 describes the methodology to base ERLs on European Union risk assessment reports (EU-RARs).
Chapter 6 explains how species for which ecotoxicological data have been retrieved (‘test species’) are to be classified taxonomically. The classification presented has been developed within the course of the INS project and has been brought in line with TGD guidance.
A list of references and a list of abbreviations, variables and default values used throughout the report are also given.
Four appendices are added to the report:
Appendix 1 shows so-called ‘A1-values’ for substances or groups of substances, as listed in EC directive 75/440/EC. These values relate to the quality of surface water intended for drinking-water abstraction. The A1-values are needed in the derivation of MPCs for water.
Appendix 2 shows so-called ‘DWS-values’ for substances or groups of substances, as listed in EC directive 98/83/EC. These values relate to drinking-water quality (‘at the tap’) and are needed in the derivation of MPCs for water.
Appendix 3 shows how soils used in ecotoxicological experiments can be classified according to texture. Soil type classification is used when tabulating terrestrial ecotoxicity data. Appendix 4 gives an overview of terminology and equations associated with partition coefficients.
1.4
Environmental risk limits and environmental quality
objectives
the negligible concentration (NC) for water, soil, groundwater, sediment and air;
the maximum permissible concentration (MPC) for water, soil, groundwater, sediment and air, both for ecosystems and for humans;
the maximum acceptable concentration for ecosystems (MACeco) for surface water (freshwater and marine);
the serious risk concentration (SRC) for water, soil, groundwater and sediment, both for ecosystems (SRCeco) and humans (SRChuman).
These environmental risk limits (ERLs) serve as advisory values for the setting of environmental quality standards (EQSs). The Dutch Steering Committee for Substances (VROM, 2004) has been appointed to set EQSs. The term EQS is used to designate all legally and non-legally binding standards that are used in Dutch environmental policy.
The term EQS is also used in the FHI document. In the context of the FHI document, EQS is equal to MPC. However, in the Netherlands, the distinction between an ERL and an EQS is very strict (as described above): an MPC can be either a proposed value or a value that is set as an EQS when the Steering Committee for Substances decides to do so. Throughout this document the term MPC is used for the scientifically derived (i.e. proposed) ERL.
1.5
ERLs for ecosystem health and ERLs for human health
An environmental risk limit should represent an environmental concentration that protects both humans and ecosystems from adverse effects. For the MPC this is defined as follows (VROM, 1999):
‘The MPC has been defined in the policy on substances as the standard based on scientific data which indicates the concentration in an environmental compartment:
1. no effect to be rated as negative is to be expected for ecosystems;
2a no effect to be rated as negative is to be expected for humans (for non-carcinogenic substances);
2b for humans no more than a probability of 10-6 per year of death can be calculated (for carcinogenic substances).’2
The major part of this report is concerned with the methodology to derive ERLs for ecosystem protection. However, the procedure of deriving ERLs for the protection of human health is also described in this document, always in separate sections, for reasons of clarity.
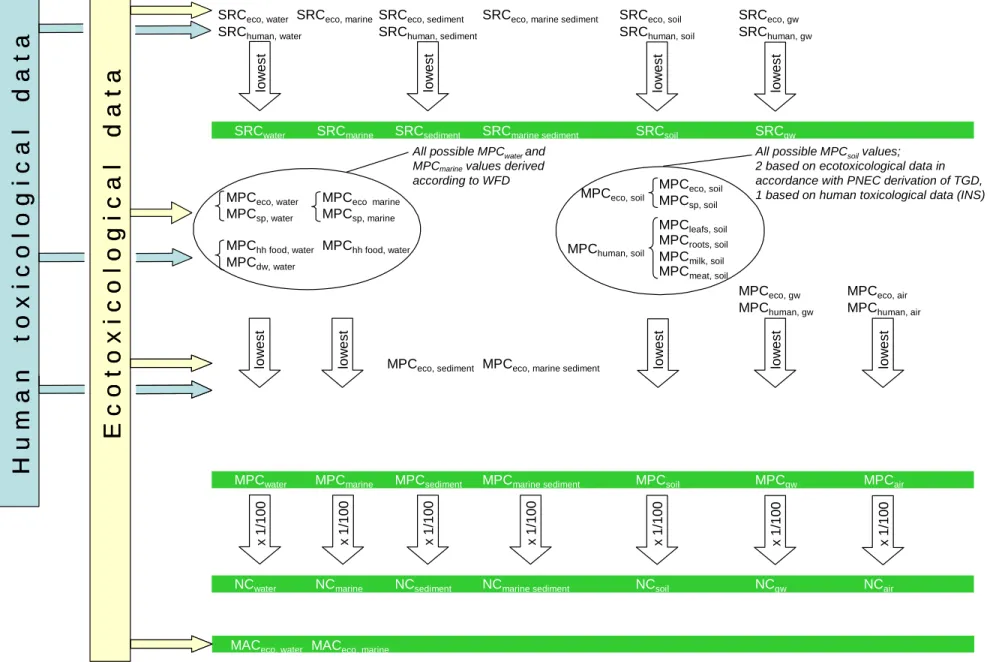
Figure 1 (page 19) overviews the final ERLs that are discerned within the INS framework. Even more ERLs are used in the text of this report. However, all these other ERLs are temporary, e.g. since these ERLs needed to be defined to explain a recalculation method (e.g. wet weight to dry weight, dissolved concentration to total concentration, etc.) or because a selection procedure is applied to come to a final MPC (choice of the final MPCwater according to FHI). All MPCs and their descriptions have been listed in the overview of parameters and variables in Table 31.
Two types of ERL are derived for the protection of human health through environmental exposure: the MPChuman, comp and the SRChuman, comp. Both are expressed as a concentration in an environmental compartment, the latter designated by the index ‘comp’. These compartments are: soil, water, sediment, groundwater and air and the respective MPCs are called MPChuman, soil, MPChuman, water, MPChuman, sediment, MPChuman, gw and MPChuman, air These indexes are identical for the SRChuman, comp. It
2 This level deviates from the level that has been set in the WFD, where 10-6 is defined as a lifetime (70 y) risk (see section 2.4.1). No level has been agreed on in the TGD. In a final draft of a revised chapter for the human health risk characterisation of the TGD, the level of 10-6 lifetime risk in deriving limit values for the general population is mentioned in relation to the level used in the EU directives on ambient air and drinking-water quality.
is important to distinguish an environmental risk limit (e.g. MPChuman, comp) from a human risk limit (MPChuman). The environmental risk limits, like MPChuman, comp, are compartment concentrations, whereas the human risk limits are intake concentrations. The MPChuman is expressed in µg.kgbw-1.d-1 and is comparable to toxicological threshold values like the TDI (tolerable daily intake).
The SRC values for human health are not derived within the context of the project INS. These values serve as trigger values in the framework of soil remediation in the context of the project ‘Risks in Relation to Soil Quality’. The models used to calculate the SRChuman values are SEDISOIL and CSOIL (Lijzen et al., 2001).
NCmarine sediment NCsoil NCgw NCair MPCeco, soil MPCsp, soil
H u m
a n
t o
x
i c o l
o g i
c a l
d a
t a
E c o t
o
x i c o
l o g i c a l
d
a
t
a
x 1/ 10 0 x 1/ 10 0 x 1/ 10 0 low e stMPCeco, marine sediment
MPCeco, soil
MPCeco, gw MPCeco, air
MPChuman, soil
MPChuman, gw MPChuman, air
MPCmilk, soil
H u m
a n
t o
x
i c o l
o g i
c a l
d a
t a
E c o t
o
x i c o
l o g i c a l
d
a
t
a
x 1/ 10 0 x 1/ 10 0All possible MPCsoilvalues;
2 based on ecotoxicological data in accordance with PNEC derivation of TGD, 1 based on human toxicological data (INS)
NCwater NCmarine NCsediment
MPCeco, sediment
SRCmarine sediment SRCsoil SRCgw
lo w e st lo w e st
SRCeco, marine SRCeco, marine sediment SRCeco, soil SRCeco, gw
SRChuman, water SRChuman, sediment SRChuman, soil SRChuman, gw
lo w e st lo w e st SRCeco, water
SRCwater SRCmarine SRCsediment
SRCeco, sediment
MPCmarine sediment MPCsoil MPCgw MPCair
low e st low e st
MPCwater MPCmarine MPCsediment
MPCeco, water MPCsp, water low e st MPChh food, water
All possible MPCwaterand
MPCmarinevalues derived
according to WFD MPCdw, water x 1/ 10 0 x 1/ 10 0 MPCeco marine MPCsp, marine MPChh food, water low e st
MACeco, water MACeco, marine
MPCleafs, soil
MPCmeat, soil
MPCroots, soil
Figure 1. Overview of environmental risk limits within INS framework.
Presented here is a selection scheme. Not indicated are the various possibilities of derivation, e.g. equilibrium partitioning.
Final risk limits are indicated in green. Environmental risk limits protect both humans and ecosystems from exposure to a given compound. The unit of environmental risk limits is: mass of compound per mass (or volume) unit of environmental compartment, expressed as e.g.: mg.L-1 or mg.kg-1.
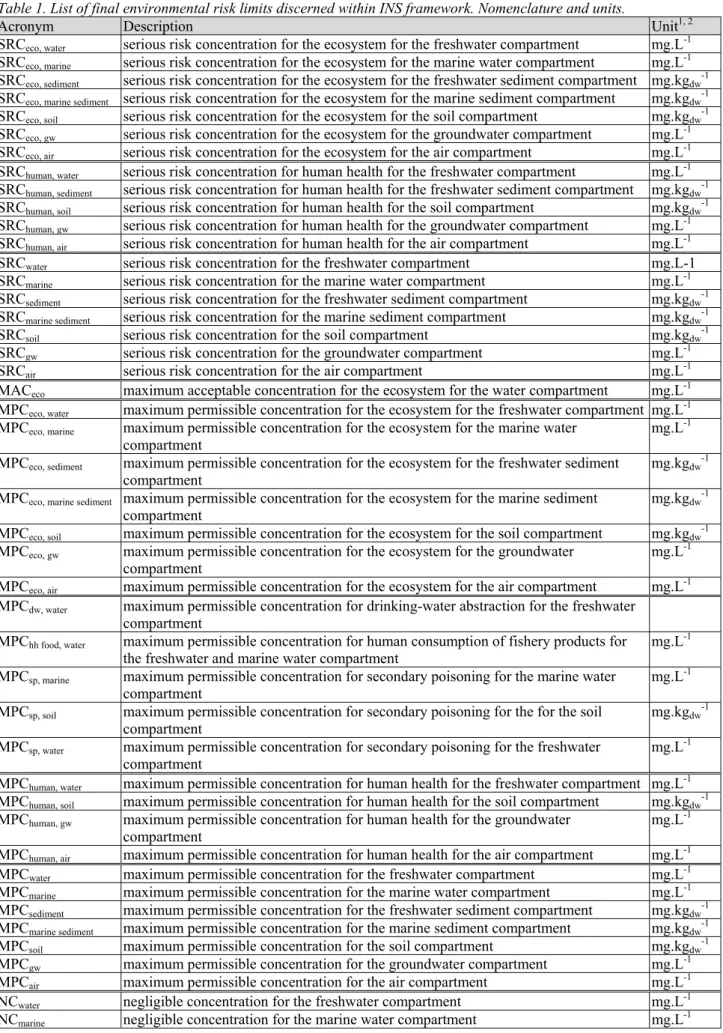
Table 1. List of final environmental risk limits discerned within INS framework. Nomenclature and units.
Acronym Description Unit1, 2
SRCeco, water serious risk concentration for the ecosystem for the freshwater compartment mg.L-1
SRCeco, marine serious risk concentration for the ecosystem for the marine water compartment mg.L-1
SRCeco, sediment serious risk concentration for the ecosystem for the freshwater sediment compartment mg.kgdw-1 SRCeco, marine sediment serious risk concentration for the ecosystem for the marine sediment compartment mg.kgdw-1
SRCeco, soil serious risk concentration for the ecosystem for the soil compartment mg.kgdw-1
SRCeco, gw serious risk concentration for the ecosystem for the groundwater compartment mg.L-1
SRCeco, air serious risk concentration for the ecosystem for the air compartment mg.L-1
SRChuman, water serious risk concentration for human health for the freshwater compartment mg.L-1
SRChuman, sediment serious risk concentration for human health for the freshwater sediment compartment mg.kgdw-1
SRChuman, soil serious risk concentration for human health for the soil compartment mg.kgdw-1
SRChuman, gw serious risk concentration for human health for the groundwater compartment mg.L-1
SRChuman, air serious risk concentration for human health for the air compartment mg.L-1
SRCwater serious risk concentration for the freshwater compartment mg.L-1
SRCmarine serious risk concentration for the marine water compartment mg.L-1
SRCsediment serious risk concentration for the freshwater sediment compartment mg.kgdw-1
SRCmarine sediment serious risk concentration for the marine sediment compartment mg.kgdw-1
SRCsoil serious risk concentration for the soil compartment mg.kgdw-1
SRCgw serious risk concentration for the groundwater compartment mg.L-1
SRCair serious risk concentration for the air compartment mg.L-1
MACeco maximum acceptable concentration for the ecosystem for the water compartment mg.L-1
MPCeco, water maximum permissible concentration for the ecosystem for the freshwater compartment mg.L-1 MPCeco, marine maximum permissible concentration for the ecosystem for the marine water
compartment
mg.L-1 MPCeco, sediment maximum permissible concentration for the ecosystem for the freshwater sediment
compartment mg.kgdw
-1
MPCeco, marine sediment maximum permissible concentration for the ecosystem for the marine sediment
compartment mg.kgdw
-1
MPCeco, soil maximum permissible concentration for the ecosystem for the soil compartment mg.kgdw-1
MPCeco, gw maximum permissible concentration for the ecosystem for the groundwater
compartment mg.L
-1
MPCeco, air maximum permissible concentration for the ecosystem for the air compartment mg.L-1
MPCdw, water maximum permissible concentration for drinking-water abstraction for the freshwater compartment
MPChh food, water maximum permissible concentration for human consumption of fishery products for
the freshwater and marine water compartment mg.L
-1
MPCsp, marine maximum permissible concentration for secondary poisoning for the marine water
compartment
mg.L-1
MPCsp, soil maximum permissible concentration for secondary poisoning for the for the soil
compartment mg.kgdw
-1
MPCsp, water maximum permissible concentration for secondary poisoning for the freshwater
compartment mg.L
-1
MPChuman, water maximum permissible concentration for human health for the freshwater compartment mg.L-1
MPChuman, soil maximum permissible concentration for human health for the soil compartment mg.kgdw-1
MPChuman, gw maximum permissible concentration for human health for the groundwater
compartment mg.L
-1
MPChuman, air maximum permissible concentration for human health for the air compartment mg.L-1
MPCwater maximum permissible concentration for the freshwater compartment mg.L-1
MPCmarine maximum permissible concentration for the marine water compartment mg.L-1
MPCsediment maximum permissible concentration for the freshwater sediment compartment mg.kgdw-1
MPCmarine sediment maximum permissible concentration for the marine sediment compartment mg.kgdw-1
MPCsoil maximum permissible concentration for the soil compartment mg.kgdw-1
MPCgw maximum permissible concentration for the groundwater compartment mg.L-1
MPCair maximum permissible concentration for the air compartment mg.L-1
NCwater negligible concentration for the freshwater compartment mg.L-1
Acronym Description Unit1, 2
NCsediment negligible concentration for the freshwater sediment compartment mg.kgdw-1
NCmarine sediment negligible concentration for the marine sediment compartment mg.kgdw-1
NCsoil negligible concentration for the soil compartment mg.kgdw-1
NCgw negligible concentration for the groundwater compartment mg.L-1
NCair negligible concentration for the air compartment mg.L-1
1 The unit ‘mg’ is optional (e.g. µg might also be used, if convenient).
2 ERLs for sediment and soil are expressed per kgdry weight of Dutch standard sediment and kg dry weight of Dutch standard soil, respectively.
1.6
Standard soil, sediment and suspended matter
The methodology for derivation of ERLs for soil and sediment in this report, makes use of the characteristics for Dutch standard soil, Dutch standard sediment and Dutch standard suspended matter as they have been used in the past for ERL derivations at the Dutch national level. These characteristics are: the percentage of organic matter, which is proportional to the percentage organic carbon, the percentage of clay (lutum), and the concentration of suspended matter in surface water. The ERLs should be expressed on the basis of Dutch characteristics.
Note that an ERL that is expressed in standard soil or sediment should be recalculated to local soil or sediment conditions when a local concentration is compared with an ERL (VROM, 1999). Using Dutch standard conditions for all ERLs is thus a way of expressing ERLs, a systematisation that enables comparison of values for different compounds, rather than a generic value that should be valid for all soils and sediments in the Netherlands.
In the FHI and TGD guidance documents, these characteristics have values that differ from the standards used in the Netherlands. FHI follows the TGD for the percentages of organic matter or organic carbon in sediment and suspended matter (Table 2).
Table 2. Characteristics of standard soil, standard sediment and standard suspended matter used in INS compared to TGD and FHI guidance.
INS (Netherlands) TGD and FHI
Parameter
Compartment % o.m. [-] % o.c. [-] % clay [-] [mg.LCsusp-1l] % o.m. [-] % o.c. [-] [mg.LCsusp-1]
soil 10 5.88 25 − 3.4 2 −
suspended matter 20 11.8 40 30 17 10 15
sediment 10 5.88 25 − 8.5 5 −
2.
Data collection and evaluation
Before any data are collected, a check should be performed to see if there are EU-RAR documents available for the compounds of interest (Regulation (EC) No. 793/93) or whether the compound is on the list of priority substances of the Water Framework Directive. It is recommended to use the ESIS (European chemical Substances Information System) database on the internet
(http://ecb.jrc.it/esis/) to trace any EU-RAR documents.
For compounds for which an EU-RAR is in draft, no risk limits will be derived (in compliance with the current policy of the Ministry of VROM).
For compounds for which a finalised EU-RAR is available, the PNECs are recalculated to MPCs (see Chapter 5), making use of the Dutch characteristics for soil, sediment and suspended matter (see section 1.6). The following PNECs are used: PNECwater, PNECmarine, PNECsediment, PNECmarine sediment, and PNECsoil. The data validated in the EU-RAR should be used to derive the SRCeco and if applicable, the MACeco. PNECs for these compartments are not given in the section on risk assessment for human health in an EU-RAR. From the risk assessment and the EUSES calculation presented, MPC values should be derived for human health as well (see sections 3.1.5 and 3.1.6 for water and 3.3.6 for other compartments). For compounds that are priority substances in the Water Framework Directive, annual
average quality standards (AA-QS) values for freshwater, marine water, freshwater sediment and marine sediment are available in principle, plus a MAC-QS for freshwater. For the Dutch situation, the AA-QS-values are taken over as MPC and the MAC-QS as MACeco. The data validated in the WFD fact sheets should be used to derive the SRCeco., ERLs are also derived for other compartments (soil, groundwater and air, if applicable) in the framework of INS. Additional literature searches should be performed for these compartments.
The toxicity data that are used to derive the environmental risk limits for plant protection products (PPP) comprise both all publicly available literature data and all confidential data. The confidential data for plant protection products should be made available by the Dutch Board for Authorisation of Pesticides (CTB). If more than one registration dossier for the same compound (active substance) is available, data from all registration dossiers should be taken into account when deriving
environmental risk limits. According to the FHI-guidance, the data3 validated in the risk
assessments under Directives 98/8/EC (biocides) or 91/414/EEC (plant protection products) should be used for EQS-setting with the highest priority, to assure coherence with other EU legislation. Any relevant information provided by companies can also be evaluated for use in the ERL derivation.
2.1
Physicochemical data
2.1.1 Data collection
2.1.1.1 Identity
The following data on substance identity are collected: − IUPAC name
− structural formula − CAS registry number − EINECS number
3 Only validated data will be used, not the risk assessments. These data were already subject to extensive review and can be used without any additional evaluation.
− chemical formula4 − SMILES code
IUPAC name, CAS registry number, EINECS number and empirical formula are primarily derived from the ESIS database (ECB website, http://ecb.jrc.it/esis/). A structural formula can also be obtained here for a great number of compounds. If a structural formula can not be obtained from the ESIS database, EPI Suite software can be used (U.S. EPA, 2007b), or handbooks can be consulted, e.g. Tomlin (2002) for pesticides or more general handbooks like Mackay et al. (2006). The
SMILES code is generated by EPI Suite software. If the compound of interest is not available in the EPI Suite database, the SMILES code can be generated using e.g. the ChemSketch (ACD/Labs, 2006) software.
2.1.1.2 Physicochemical properties
Physicochemical parameters should be collected for each compound for which ERLs are derived. These parameters provide information on the behaviour of the compound in the environment. Data on the following parameters are collected (name, symbol, unit):
− molecular weight: Mw, (g.mol-1); − melting point: Tm, (°C);
− boiling point: Tb, (°C);
− vapour pressure: Pv (Pa), experimental melting point and boiling point can be useful for estimation of the vapour pressure;
− Henry’s law constant: H (Pa.m3.mol-1).
− water solubility: Sw (mg.L-1), experimental melting point can be useful for the estimation of the solubility from log Kow;
− dissociation constant: pKa (-);
− n-Octanol/water partition coefficient: Kow (-);
− soil/sediment water partition coefficient: Kp, (L.kg-1). For organic substances, the partition coefficients normalised to organic carbon are preferred: Koc (L.kg-1). For metals, field based partition coefficients (Kp) are searched for, both for soil and suspended matter;
The following steps should preferably be followed to collect physicochemical data:
1. The following databases and estimation methods are used to retrieve or calculate data on physicochemical parameters (Table 3).
Table 3. Sources and estimation methods to be screened for physicochemical parameters.
Parameter Sources/methods
MW Mackay, EPI Suite, SPARC, IUCLID
Tm Mackay, EPI Suite, IUCLID
Tb Mackay, EPI Suite, SPARC, IUCLID
Pv Mackay, EPI Suite, SPARC, IUCLID
H Mackay, BioLoom, EPI Suite, SPARC, IUCLID Sw Mackay, EPI Suite, SPARC, IUCLID
pKa Mackay, BioLoom, SPARC, IUCLID
Kow BioLoom, Mackay, EPI Suite, SPARC, IUCLID
Koc Mackay, BioLoom, Sabljić, EPI Suite, IUCLID
Kp (metals) Sauvé, Bockting, scientific literature
References to the sources and programs mentioned in Table 3: Mackay = Mackay et al. (2006);
EPI Suite = U.S. EPA (2007b);
SPARC = SPARC online calculator (2007);
IUCLID = International Uniform Chemical Information Database (European Commission (European Chemical Bureau), 2000);
Bioloom = BioByte including internet database (BioByte, 2004);
Sabljić = Sabljić and Güsten (1995) cited in: European Commission (2003b) or Sabljić et al. (1995).
Sauvé = Sauvé et al., (2000)
Bockting = Bockting et al., (1992)
2. Scientific literature. For all of the listed parameters, the open literature may, in principle, be searched (method, see section 2.2.1) in the case that a reliable estimate is lacking or if the number of reliable or relevant data is very low. This might be most applicable to Kp values for metals (see section 2.1.2.6) since a robust data collection in this area is absent.
3. Contact persons from environmental agencies in other countries are consulted by sending out an e-mail enquiry, in which they are asked if they have access to specific information on ecotoxicological toxicity data (see section 2.2.1) and/or physicochemical data and are willing to share those data.
4. The industry parties involved in production or use of the compounds under investigation are invited to submit relevant studies, which will be treated as public literature.
2.1.2 Data evaluation and data tables
All retrieved literature is read and evaluated with respect to its usefulness and reliability. Several aspects considered important for the evaluation of the parameters, are discussed in the following sections.
After evaluating a study, the results of the study are summarised by entering these into the
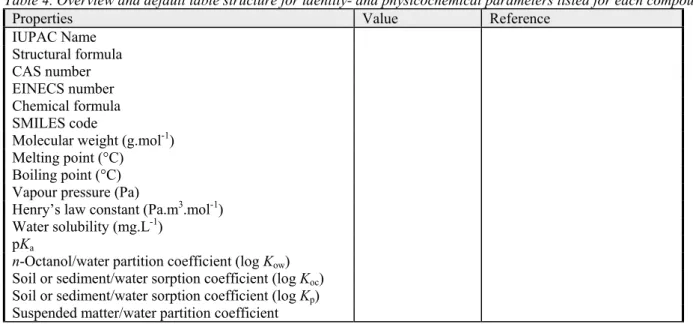
appropriate data table (Table 4). The structural formula of the compound is also placed in this table. Table 4. Overview and default table structure for identity- and physicochemical parameters listed for each compound.
Properties Value Reference
IUPAC Name Structural formula CAS number EINECS number Chemical formula SMILES code
Molecular weight (g.mol-1)
Melting point (°C) Boiling point (°C) Vapour pressure (Pa)
Henry’s law constant (Pa.m3.mol-1)
Water solubility (mg.L-1)
pKa
n-Octanol/water partition coefficient (log Kow) Soil or sediment/water sorption coefficient (log Koc)
Soil or sediment/water sorption coefficient (log Kp)
Suspended matter/water partition coefficient
2.1.2.1 Evaluation of the vapour pressure for use in ERL derivation
An OECD guideline exists for the experimental determination of the vapour pressure of a
compound (OECD guideline 104; OECD, 1995b). In this guideline several methods are discussed, each with its own range of applicability. The following table presents information from the
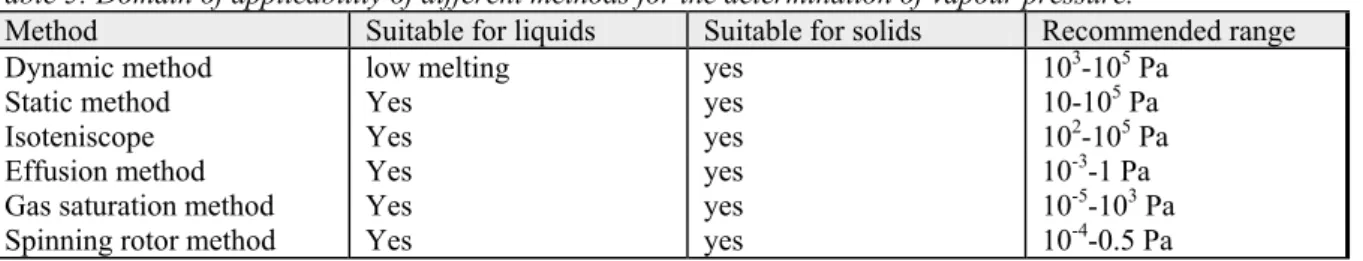
Table 5: Domain of applicability of different methods for the determination of vapour pressure.
Method Suitable for liquids Suitable for solids Recommended range
Dynamic method low melting yes 103-105 Pa
Static method Yes yes 10-105 Pa
Isoteniscope Yes yes 102-105 Pa
Effusion method Yes yes 10-3-1 Pa
Gas saturation method Yes yes 10-5-103 Pa
Spinning rotor method Yes yes 10-4-0.5 Pa
In the dynamic method (Cottrell's method), the boiling point of a compound is determined at various pressures between about 103 and 105 Pa. In the static method, the vapour pressure is determined at one specified temperature by means of a manometer (e.g. 25 ºC). The isoteniscope method is based on the same principle as the static method. In the effusion method the weight loss of the compound is measured. This can be done directly by measuring the mass of the remaining substance or by analysing the volatilised amount by gas chromatography (GC). In the proposed update of guideline 104 (OECD, 2002), isothermal gravimetry is added for the effusion method. The weight loss is then determined at different temperatures and an extrapolation to 20 or 25 ºC can be made. The range of vapour pressures that can be determined with this method is 10-10 to 1 Pa. The gas saturation method makes use of a column containing a carrier material supporting the substance, through which an inert gas is passed. The concentration of the substance in this carrier gas is then determined, usually by gas chromatography (GC). The last method is the spinning rotor method, where the retardation of a spinning ball due to the friction with the gas phase is measured. In general, the methods that make use of an analysis of the substance, for example, by gas
chromatography, are less prone to errors due to impurities than the other methods. The OECD guideline does not mention this explicitly. However, degassing of more volatile compounds prior to the determination of the vapour pressure also enhances the reliability of the determination.
The retention time in gas chromatography can be used to estimate the vapour pressure of a compound. Although this is not a direct determination of the vapour pressure, it generally gives rather accurate results and is applicable to substances with a very low vapour pressure. In addition to this, the vapour pressure can be estimated by the programme MPBPwin, which is incorporated in EPI Suite (U.S. EPA, 2007b). The programme makes use of three estimation methods, which are the Antoine method, the modified Grain method and the Mackay method. All three methods make use of the boiling point for their estimation of the vapour pressure. Also the melting point of the compound is a necessary parameter for the estimation. Both boiling and melting point can be estimated by the programme, but experimental values can also be entered if known. For solids, the result of the modified Grain method is presented as the preferred value, while for liquids this is the mean of the Antoine method and the modified Grain method. A value for the vapour pressure can also be estimated by SPARC (Karickhoff et al., 2007), which has a mechanistic thermodynamic basis. In the data tables, both estimated values are reported as well.
2.1.2.2 Henry coefficient
No general accepted guideline exists for the determination of the Henry coefficient. However, several methods exist to determine the Henry coefficient experimentally.
In the batch stripping method, gas is bubbled at a known rate through a solution of the compound in water. The Henry coefficient is calculated with a mass balance from the decrease in the aqueous concentration. The concentration in air is generally not measured. This method works well for fairly volatile compounds with Henry coefficients higher than 2.5 and occasionally down to
One common method, very similar to the batch stripping method, is the gas stripping method in which a gas is bubbled through the aqueous solution and both the aqueous concentration and the gas concentration are determined. The technique was applied to chlorobenzenes, PAHs, and PCBs in a range from 0.018 to 276 Pa.m3.mol-1 (Ten Hulscher et al., 1992).
A method for highly volatile compounds (i.e. higher than 120 Pa.m3.mol-1) is the Equilibrium Partitioning In Closed Systems (EPICS) method. With this method a known volume of solute in water solution is equilibrated with air in sealed vessels. The headspace air concentrations are measured. The method has a high precision (Mackay et al., 2000). A number of other headspace analysis techniques that are used, are slightly different from the EPICS method, in some techniques not only the headspace but both phases are analysed (Mackay et al., 2000).
A method for less volatile compounds is the wetted-wall method. In this method the solute is equilibrated between a thin flowing film of water and a concurrent air flow in a vertical column. Both phases are measured. The method has been applied to pesticides and other less volatile
compounds, but no recommended range is given (Mackay et al., 2000). In the handbook (Mackay et
al., 2006), values for polychlorinated biphenyls (PCBs), polyaromatic hydrocarbons (PAHs), and
two pesticides are tabulated using this method. Values for PCBs and PAHs range from 0.91 to 74.3 Pa.m3.mol-1. One of the pesticides (alachlor) has a much lower Henry coefficient of 8.43·10-4 Pa.m3.mol-1. This is in agreement with the method being suitable for less volatile compounds.
Also the Henry coefficient is sometimes related to retention times (Mackay et al., 2000). However, results obtained using this method should be considered as an estimate. Another estimation that is often used for the Henry coefficient is the quotient of vapour pressure and solubility. This method works quite well for substances that have a solubility of less than 1% in water. The Henry
coefficient can also be calculated by a bond contribution method as included in EPI Suite (U.S. EPA, 2007b). These estimated values should be included in the data table.
2.1.2.3 Evaluation of the water solubility for use in ERL derivation
For the experimental determination of the water solubility, an OECD guideline is available (OECD guideline 105; OECD, 1995c), in which two methods are discussed. These methods are the flask method (shake-flask) and the column elution method (generator column). The flask method can be used for compounds with a solubility higher than 10 mg.L-1. Below that value, colloid formation will overestimate the true aqueous solubility and in that case the column elution method should be used, which prevents this phenomenon.
Apart from the methods proposed in the OECD guideline, the water solubility of poorly soluble liquid compounds can be accurately determined by means of the slow-stirring method. The
reliability of the slow-stirring method applied to liquid substances can be considered as equivalent to that of the column elution method. Only few examples are available of the use of this method for the determination of the solubility, mostly for hydrocarbons and phthalate esters (Tolls et al., 2002; Letinski et al., 2002; Ellington, 1999). This method is often used to prepare saturated solutions of hydrocarbon mixtures (oil products) in water (water accommodated fractions or WAF), by which information on the solubility of a mixture is given (Schluep et al., 2002).
Estimates of the water solubility can be made by two different programmes included in EPI Suite (U.S. EPA, 2007b). These programmes are WSKOWwin, which estimates the solubility from log Kow, and WATERnt, which is a fragment method for water solubility independent of log Kow. Experimental values for log Kow and melting point can be entered in WSKOWwin if available.
Otherwise WSKOWwin will use the default values (experimental or calculated) from EPI Suite for these parameters. Another estimation method for the water solubility is the calculation performed by SPARC (Karickhoff et al., 2007), which has a mechanistic thermodynamic basis. These estimated values are reported as well in the data tables.
2.1.2.4 Evaluation of Kow values for use in ERL derivation
Several methods are available for the experimental determination of log Kow. In the OECD guidelines, two methods are available and further there is one draft guideline. The first method is the shake-flask method (OECD guideline 107; OECD, 1995a). This method works well for log Kow values in the range between -2 and 4 (occasionally up to 5), but is impossible to use with surface-active materials. For these materials, a calculated value (using BioLoom; BioByte, 2004) or an estimate based on individual n-octanol solubility and water solubility should be provided,
preferably in mutually saturated n-octanol and water (Sijm et al., 1999; Li and Yalkowsky, 1998a; Li and Yalkowsky, 1998b).
The second method is the HPLC method. Values of log Kow in the range between 0 and 6 can be estimated using high performance liquid chromatography (OECD guideline 117; OECD, 2004). The HPLC method is not applicable to strong acids and bases, metal complexes, surface-active materials or substances which react with the eluent. The HPLC method is less sensitive to the presence of impurities in the test compound than is the shake-flask method. Nevertheless, in some cases impurities can make the interpretation of the results difficult because peak assignment becomes uncertain. For mixtures which give an unresolved band, upper and lower limits of log Kow should be stated.
Before deciding on what procedure to use, a preliminary estimate of the log Kow should be obtained from calculation (see the annex to Guideline 117), or where appropriate from the ratio of the
solubilities of the test substance in the pure solvents. Still, the HPLC method should be regarded as an estimation method of the log Kow, because it does not directly measure the distribution of a compound between octanol and water.
Another method that determines the distribution of a compound between n-octanol and water directly, but whose reach extends beyond the range of the shake-flask method, is the slow-stirring method (draft OECD guideline 123; OECD, 2003). With this method, log Kow values up to 8.2 can be accurately determined, making it suitable for highly hydrophobic compounds. This method prevents the formation of micro droplets of n-octanol in the aqueous phase, which results in an overestimation of the water concentration and, consequently, an underestimation of the log Kow value. For the same reason, the shake-flask method can only be used up to log Kow values of around 4 and definitely not higher than 5.
Another method that is not mentioned in OECD guidelines is the generator-column technique. Although this technique is most frequently used for the determination of the water solubility, it is occasionally used for the determination of log Kow. Because the supporting material silica, saturated with n-octanol containing the compound, is held in a column, the formation of micro droplets is excluded. For this reason, the results from this technique can be considered equivalent to results obtained with the slow-stirring method. In general, good correlation exists between the slow-stirring method and the generator-column technique, within the experimental error of both methods.
However, only a limited number of studies is available that makes use of this technique, primarily for chlorinated biphenyls and dibenzodioxins (e.g. Tewari et al., 1982; Miller et al., 1984; Doucette and Andren, 1987; Doucette and Andren, 1988; Hawker and Connell, 1988; Shiu et al., 1988; Li and Doucette, 1993; Yeh and Hong, 2002).
Except from experimental determination, log Kow values can also be calculated with a QSAR programme. The log Kow values calculated with ClogP (BioByte, 2004) and EPI Suite (U.S. EPA, 2007b) are always presented for comparison. Both programmes are based on a fragment
contribution method. Besides this, SPARC (Karickhoff et al., 2007) is a third estimation programme for the log Kow that is frequently used. This programme is not based on a fragment contribution but has a mechanistic thermodynamic basis.
2.1.2.5 Evaluation of Koc values for use in ERL derivation
The organic carbon normalised partition coefficient (Koc) is calculated or directly retrieved from literature for all valid adsorption studies collected. The soil or sediment type that underlies these partition coefficients is reported (e.g. sediment, loamy sand, suspended matter) in the table. The organic carbon content is also reported. The method to determine the Koc most accurately is the OECD guideline 106 (OECD, 2000). All Koc values that are determined with a method similar to this guideline can be regarded as reliable. However, the TGD also allows Koc values to be derived from field studies or simulation studies. Therefore, whether or not a sorption study is reliable remains subject to expert judgement.
The Koc may also be calculated. Estimation of Koc from Kow is the preferred route, following the QSAR method described in the TGD (cited in the next section). A short description of the use of the method is given after the citation.
Citation from TGD, part III (European Commission (Joint Research Centre), 2003b):
‘The models are based on linear regression analysis and log Kow as descriptor variable. It should be noted that all models are developed assuming an equilibrium state. For certain classes of chemicals, e.g. anilines and carbamates, this assumption is not correct, because the sorption to soil is irreversible due to the formation of bonded residues. Improvements of the more specific models is certainly feasible if parameters for more specific interactions are taking into account.’
‘Domain
An extensive description of the domain is given in Table 65. The description is made in terms of chemical structures as well as in terms of log Kow ranges.
Accuracy
The standard errors of the estimates (± 2σ range = 95%)6 range from 0.35 to 1.0 log units for the different models. The standard errors are indicated in Table 75 for each model. A cross-validation has not been performed yet. External cross-validation is not possible, because all available data have been used to generate the models (Sabljić et al., 1995 cited in: European Commission (Joint Research Centre), 2003a).’
5 The number of the table refers to this document and not the table number in the TGD. 6 For clarification, the standard error is equal to σ.
Table 6. Domain of the sorption models (Sabljić et al., 1995 cited in: European Commission (Joint Research Centre), 2003a).
Model X-variable domain
log Kow in log units
Chemical domain Substituents or Warnings
Hydrophobics 1 - 7.5 All chemicals with C, H, F,
Cl, Br, and I atoms
Nonhydrophobics (-2.0) - 8.0 All chemicals that are not
classified as hydrophobics Overestimated n-Alkyl Alcohols (0.9 log units)
Organic Acids (0.55 log units) Underestimated
Amino-PAHs (1-2 log units) Aliphatic Amines (1-2 log units) Alkyl Ureas (1.0-1.5 log units)
Phenols 1.0 - 5.0 Phenols Anilines Benzonitriles Nitrobenzenes Cl, Br, CH3, OH, NO2, CH3O Cl, Br, CH3, CF3, CH3O, N-Me Chlorinated Cl, Br, NH2 Agricultural (-1.0) - 8.0 Acetanilides Carbamates Esters Phenylureas Phosphates Triazines Uracils
Alcohols, acids (-1.0) - 5.0 Alcohols
Organic Acids Alkyl, Phenalkyl, OH All
Acetanilides 0.9 - 5.0 Anilides CH3O, Cl, Br, NO2, CF3, CH3
Alcohols (-1.0) - 5.0 Alcohols Alkyl, Phenalkyl, OH
Amides (-1.0) - 4.0 Acetamides
Benzamides F, Cl, Br, CHNO2, N-Me 3O, Alkyl
Anilines 1.0 - 5.1 Anilines Cl, Br, CF3, CH3, N-Me, N,
N-di-Me
Carbamates (-1.0) - 5.0 Carbamates Alkyl, Alkenyl, Cl, Br, N-Me,
CH3O
Dinitroanilines 0.5 - 5.5 Dinitroanilines CF3, Alkyl-SO2, NH2SO2, CH3,
t-Bu Esters 1.0- 8.0 Phthalates Benzoates Phenylacetates Hexanoates Heptanoates Octanoates alkyl, phenyl, Cl
alkyl, phenyl, NO2,OH,Cl,NH2 alkyl, phenalkyl
alkyl alkyl alkyl
Nitrobenzenes 1.0 - 4.5 Nitrobenzenes Cl, Br, NH2
Organic Acids (-0.5) - 4.0 Organic Acids All
Phenols 0.5 - 5.5 Phenols Cl, Br, NO2, CH3, CH3O, OH
Benzonitriles Cl
Phenylureas 0.5 - 4.2 Phenylureas CH3, CH3O, F, Cl, Br,
Cyclo-alkyls, CF3, PhO
Phosphates 0.0 - 6.5 All Phosphates
Triazines 1.5 - 4.0 Triazines Cl, CH3O, CH3S, NH2, N-Alkyl
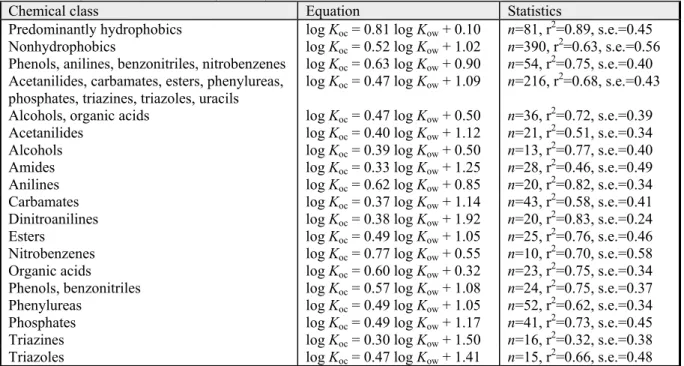
Table 7. QSARs for soil and sediment sorption for different chemical classes (Sabljić et al., 1995 cited in European Commission (Joint Research Centre), 2003a).
Chemical class Equation Statistics
Predominantly hydrophobics log Koc = 0.81 log Kow + 0.10 n=81, r2=0.89, s.e.=0.45
Nonhydrophobics log Koc = 0.52 log Kow + 1.02 n=390, r2=0.63, s.e.=0.56
Phenols, anilines, benzonitriles, nitrobenzenes log Koc = 0.63 log Kow + 0.90 n=54, r2=0.75, s.e.=0.40 Acetanilides, carbamates, esters, phenylureas,
phosphates, triazines, triazoles, uracils log Koc = 0.47 log Kow + 1.09 n=216, r
2=0.68, s.e.=0.43
Alcohols, organic acids log Koc = 0.47 log Kow + 0.50 n=36, r2=0.72, s.e.=0.39
Acetanilides log Koc = 0.40 log Kow + 1.12 n=21, r2=0.51, s.e.=0.34
Alcohols log Koc = 0.39 log Kow + 0.50 n=13, r2=0.77, s.e.=0.40
Amides log Koc = 0.33 log Kow + 1.25 n=28, r2=0.46, s.e.=0.49
Anilines log Koc = 0.62 log Kow + 0.85 n=20, r2=0.82, s.e.=0.34
Carbamates log Koc = 0.37 log Kow + 1.14 n=43, r2=0.58, s.e.=0.41
Dinitroanilines log Koc = 0.38 log Kow + 1.92 n=20, r2=0.83, s.e.=0.24
Esters log Koc = 0.49 log Kow + 1.05 n=25, r2=0.76, s.e.=0.46
Nitrobenzenes log Koc = 0.77 log Kow + 0.55 n=10, r2=0.70, s.e.=0.58
Organic acids log Koc = 0.60 log Kow + 0.32 n=23, r2=0.75, s.e.=0.34
Phenols, benzonitriles log Koc = 0.57 log Kow + 1.08 n=24, r2=0.75, s.e.=0.37
Phenylureas log Koc = 0.49 log Kow + 1.05 n=52, r2=0.62, s.e.=0.34
Phosphates log Koc = 0.49 log Kow + 1.17 n=41, r2=0.73, s.e.=0.45
Triazines log Koc = 0.30 log Kow + 1.50 n=16, r2=0.32, s.e.=0.38
Triazoles log Koc = 0.47 log Kow + 1.41 n=15, r2=0.66, s.e.=0.48
n is the number of data, r2 is the correlation coefficient and s.e. the standard error of estimate. End of citation
The QSARs in Table 7 are from a report cited in the TGD, but they can also be found in the public literature (Sabljić et al., 1995). In principle, the appropriate QSAR should be chosen on basis of this table. For many compounds with polar groups attached, a separate QSAR is available for that particular chemical class. In general, these QSARs do not deviate very much from the QSARs for larger subsets of chemical classes. However, if there is doubt about which QSAR to use, for example, due to the presence of more than one functional group, it is often most convenient to use the more general QSARs, in particular the QSAR for non-hydrophobic chemicals. This QSAR, together with the QSAR for predominantly hydrophobic compounds provides a reasonable estimate of the Koc for most compounds.
The Koc can also be estimated with an HPLC method (OECD guideline 121; OECD, 2001). As the title of the method indicates, this is no direct determination of the Koc but an estimate based on another property (retention in HPLC). Also the estimation routine PCKOCwin, which employs a calculation method based on molecular connectivity indices (MCI), may be used to estimate the Koc. PCKOCwin is embedded in the EPI Suite software (U.S. EPA, 2007b). Both methods can aid in the decision by means of an independent estimation, in the case that the interpretation of the estimation method based on log Kow according to the TGD is difficult. Both the estimated value from
molecular connectivity and values estimated with the HPLC method, if any available, should be reported.
2.1.2.6 Evaluation of Kp values for metals for use in ERL derivation
Adsorption of metals to the solid fraction of soil, sediment or particulate (suspended) matter is dependent on many variables such as cation exchange capacity, organic matter content and clay content, pH, redox potential, etc. In contrast to organic compounds, there is no estimation method to predict metal-solids partitioning in environmental compartments from compound properties. Thus, partition coefficients for metals have to be determined in and retrieved from experimental studies. The Kp values are collected from all valid studies reporting metal partition coefficients.
Relevant studies are those that report Kp values for sediment, soil or suspended matter (or Kd values) determined in field samples. Batch adsorption studies, performed in the laboratory, are a second type of potentially relevant studies. An established data source of metal Kp values for bulk compartments (soil, sediment, suspended matter) does – to our knowledge– not exist. A few references that are of interest are Sauvé et al. (2000) and Bockting et al. (1992), although values of the latter have been criticised (Koops et al., 1998). Due to the heterogeneity of adsorbents
encountered in various compartments, Kp values for metals usually show a high variation. Since normalisation is generally impracticable, selection of the Kp value(s) to be used in EqP needs careful consideration.
2.1.3 Data selection
2.1.3.1 Kow
The Kow value that is selected for use in the ERL derivation is preferably the selected experimental value (MlogP) presented by BioLoom (BioByte, 2004). This value is assigned the highest quality in the underlying database (MedChem). Only if this database does not give a selected value or when careful considerations lead to a different selection, the selected (log) Kow value is the average value of all reliable values determined by the shake flask, slow stirring or generator column method, for which guidance is given in section 2.1.2.4. This selected log Kow is reported as described in section 3.1.1 (Table 15). Kow values estimated using the HPLC method are indirect estimates of
octanol/water partitioning and are therefore not regarded as most reliable, they are not used when more reliable data are available.
When no or only unreliable experimental data on Kow are available, the selected data should be calculated with a QSAR programme. The use of the Kow values obtained with the ClogP program (BioByte, 2004) is preferred.
2.1.3.2 Koc
For the selection of the Koc value, experimentally determined values should be retrieved; preferably as much as possible. These Koc values may be derived from standardised tests (e.g. OECD guideline 106; OECD, 2000) or from other studies published in scientific literature. Koc values determined by the HPLC method (OECD guideline 121; OECD, 2001) should be considered as estimates of the real Koc values and consequently, these values are not used as experimental values. Because Koc values may vary widely and no value for Koc can be considered as the most reliable value, the geometric mean of all valid Koc values is calculated, including one value estimated from Kow. This geometric mean Koc will be used as the selected value in ERL derivations (Otte et al., 2001).
2.1.3.3 Kp, susp-water
For organic substances, the value of Kp, susp-water is derived from the Koc value and the fraction organic carbon of suspended matter used within the EU (Focsusp, TGD), applying Eq. 1. Note that the fraction organic carbon is equal to 0.1 in this case (the EU standard), since the outcome of this equation triggers MPCsediment derivation and should be uniform within Europe.
TGD susp, oc water susp p, K Foc K − = × (1)
If data for suspended matter are available these can be used directly as well and might be preferred. The value for Kp, susp-water for metals is derived from experimental data. From the valid Kp, susp-water values summarised in the table containing physicochemical properties (section 2.1.2.6), the
geometric mean value is calculated. This geometric mean Kp, susp-water will be used as selected value in ERL derivations. If experimental data on Kp for metals are lacking, the data gap is reported and